

Non-communicable diseases (NCD) are projected to become the most common causes of death in Africa by 2030( 1 ). Despite this fact, risk factors – including nutritional factors – have not been fully studied in African populations undergoing epidemiological and nutritional transitions, with concomitant changes in lifestyle and diet. In high-income countries, diets began to shift in the 1970s, from a traditional pattern of high carbohydrate and fibre and low fat and sugar, toward a more globalised ‘Western’ pattern characterised by increased consumption of processed foods, greater use of edible oils and sugar-sweetened beverages( Reference Popkin, Adair and Wen 2 ). Similar changes started to emerge in the 1990s in low- to middle-income countries( Reference Popkin, Adair and Wen 2 – Reference Mattei, Malik and Wedick 4 ). The nutritional transition has led to an increased consumption of products that can be harmful to health at high levels, such as sugar, Na and fat, particularly SFA and industrial trans-fatty acids (iTFA). In turn, this has had an impact on patterns of cancers, from one dominated by infection-related cancers to one characterised by cancers related to changing reproductive patterns, poor diet, excess body fatness and reduced physical activity( Reference Wiseman 5 ).
Countries in sub-Saharan Africa are clearly undergoing a nutrition transition( Reference Steyn and Mchiza 3 ). More than half of them are still in the early stage, as illustrated by the finding that fat, protein and carbohydrate intake are still within those recommended, while a few have already reached a situation where changes in dietary patterns are affecting health outcomes in the population( Reference Steyn and Mchiza 3 , Reference Abrahams, Mchiza and Steyn 6 ). Data from the FAO indicated a steady increase in the energy supply in most sub-Saharan countries over a period of three decades, protein and fat intake displaying a similar trend( 7 ). An increase in fat consumption has been shown to be highly associated with global dietary changes( Reference Steyn and Mchiza 3 ). Thus, these data suggest that measurement of fatty acid intakes might serve as an indicator of nutrition transition in general.
Measurement of dietary fatty acids in nutritional epidemiology studies has been hampered by substantial measurement error when using dietary questionnaires. Plasma or serum phospholipid fatty acid level measurements offer specific biomarkers of medium-term (weeks to months) dietary intake of bioavailable amounts of these nutrients, particularly for fatty acids that are not endogenously synthesised, such as iTFA and n-6 and n-3 PUFA( Reference Saadatian-Elahi, Slimani and Chajès 8 , Reference Chajès, Biessy and Byrnes 9 ). Thus, the use of specific biomarkers of fatty acids is a more rigorous approach to provide a better understanding of changes in dietary fatty acids in low- to middle-income countries.
The general population cohort (GPC) set-up in rural south-western Uganda provided a unique framework to examine the biomarkers of dietary fatty acids. We measured serum phospholipid fatty acid levels at three time periods, in 1990–1991, 1999–2000 to 2007–2008, and monitored changes over this period in a representative sample within the GPC.
Methods
Population
The GPC was set up as a population-based open cohort study established in 1989 to examine trends in HIV prevalence and incidence in rural south-western Uganda. Since 2010, the scientific research questions have incorporated the epidemiology and genetics of both communicable and NCD. The study area is located in Kyamulibwa sub-county of Kalungu district. The initial study population of about 10 000 residents comprised a cluster of fifteen neighbouring villages. From 1999, ten more adjacent villages with comparable characteristics were added to the cohort, thereby doubling the population( Reference Asiki, Murphy and Nakiyingi-Miiro 10 ).
The study population was recruited through annual house-to-house rounds of census through which participants for the medical survey are selected. All residents aged 13 years and above were included in all the medical survey rounds 1–22 (1989–2011). Children <13 years were also recruited every third round. Data on health and lifestyle are collected using a standard individual questionnaire, and blood samples were obtained and biophysical measurements taken. Blood samples were transported to MRC/UVRI Laboratories in Entebbe and stored at –80°C. Overall, more that 95 % of households approached for census participated.
Ethics statement
Study participants provided written informed consent to participate in the study. Ethical approval for this study was granted by London School of Hygiene and Tropical Medicine and the Uganda Virus Research Institute Research and Ethics Committee, and the study was approved by the Uganda National Council for Science and Technology. It was also approved by the Ethics Committee of the International Agency for Research on Cancer (IARC).
Selection criteria
Census rounds 3, 11 and 19 were chosen because of the inclusion of children. A total of three independent random samples of 281 individuals (149 adults and 132 children), 283 individuals (166 adults and 117 children) and 351 individuals (238 adults and 113 children) were selected on the basis of availability of serum sample and stratified to provide a 1:1 sex ratio. Serum samples were shipped to the IARC in Lyon, France.
Laboratory analysis
All measurements of fatty acids were performed at the IARC. Serum samples were profiled for phospholipid fatty acid composition by batches of twenty samples, including samples from eighteen subjects at three time periods (six men, six women and six children) in random order, and two independent serum samples as quality controls. The laboratory staff was blinded to the status of the sample (subject, sex, time period or quality control). As previously described, total lipids were extracted from serum samples, phospholipids were purified by adsorption chromatography, and fatty acid methyl esters separated through GC( Reference Chajès, Assi and Biessy 11 ). The relative concentration of each fatty acid, expressed as percentage of total fatty acids, was quantified by integrating the area under the peak and dividing the result by the total area. Fatty acids were also expressed as absolute concentrations in serum (µmol/l).
Overall (intra-batch and inter-batch) CV for fatty acids, which were calculated using two serum samples as quality controls added to each batch, ranged from 0·29 % for large peaks such as palmitic acid, to 7·74 % for the smallest peaks such as 18 : 3trans. Specifically for trans-fatty acids (TFA), the overall CV were 0·112 for 16 : 1n-9trans, 0·137 for 18 : 1n-9trans, 0·376 for 18 : 2trans,cis, 0·198 for 18 : 2trans,trans, 7·74 for 18 : 3n-3trans,cis,cis, 0·282 for 18 : 1n-7trans, 1·017 for CLA 10trans,12cis and 0·097 for CLA 9trans,11cis.
Statistical analysis and data treatment
Multivariate regression analyses were performed to compare the geometric mean levels (mean 95 % confidence intervals) of fatty acids by time period. We calculated the percentage and absolute amounts of the following groups: SFA, cis-MUFA, ruminant TFA, iTFA, cis-n-6 PUFA, long-chain n-6 PUFA, n-3 PUFA, long-chain n-3 PUFA and the ratio of n-6:n-3 PUFA. Analyses were conducted separately in children, men and women and in men and women combined. Tests for trend were computed using the time period-specific geometric means of each fatty acid. The models were adjusted for age at baseline for men and for women separately. For children and for adults combined, the models were adjusted for age at baseline and for sex. All analyses were performed with STATA version 13 software.
Results
Subject characteristics
Characteristics of the study population are described above and in a previous report( Reference Asiki, Murphy and Nakiyingi-Miiro 10 ). Briefly, the cohort includes all residents (52 % aged ≥13 years, men and women in equal proportions) within one-half of a rural sub-county, residing in scattered houses. Characteristics of the study population showed a relatively young population, with about 90 % of the population <50 years old, predominantly farmers of three major ethnic groups. Only 13 % of the population attained education beyond primary level.
Serum phospholipid fatty acid profile
The separation of serum phospholipid fatty acids, particularly TFA isomers, is shown in Fig. 1. The serum phospholipid fatty acid profile in the adult study population at baseline (1990–1991) is provided in Table 1. Due to a lack of appropriate reference values, we used serum phospholipid fatty acid profiles reported at the same time in other cross-sectional studies of healthy adults to determine whether our population had been exposed to low or high fatty acid levels. Serum phospholipid fatty acid proportions reported in the European Prospective Investigation into Cancer and Nutrition (EPIC) study( Reference Saadatian-Elahi, Slimani and Chajès 8 , Reference Chajès, Biessy and Byrnes 9 ), the Japan Public Health centre-based prospective study on cancer and CVD study( Reference Kobayashi, Sasaki and Kawabata 12 ) and the New Zealand National Nutrition Survey( Reference Bradbury, Skeaff and Crowe 13 ) are provided for comparison. In all studies, fatty acids are expressed in percentage of total fatty acids. Because the proportions of fatty acids are similar in adult men and women in the Ugandan population study (data not shown), combined data are provided for men and women.
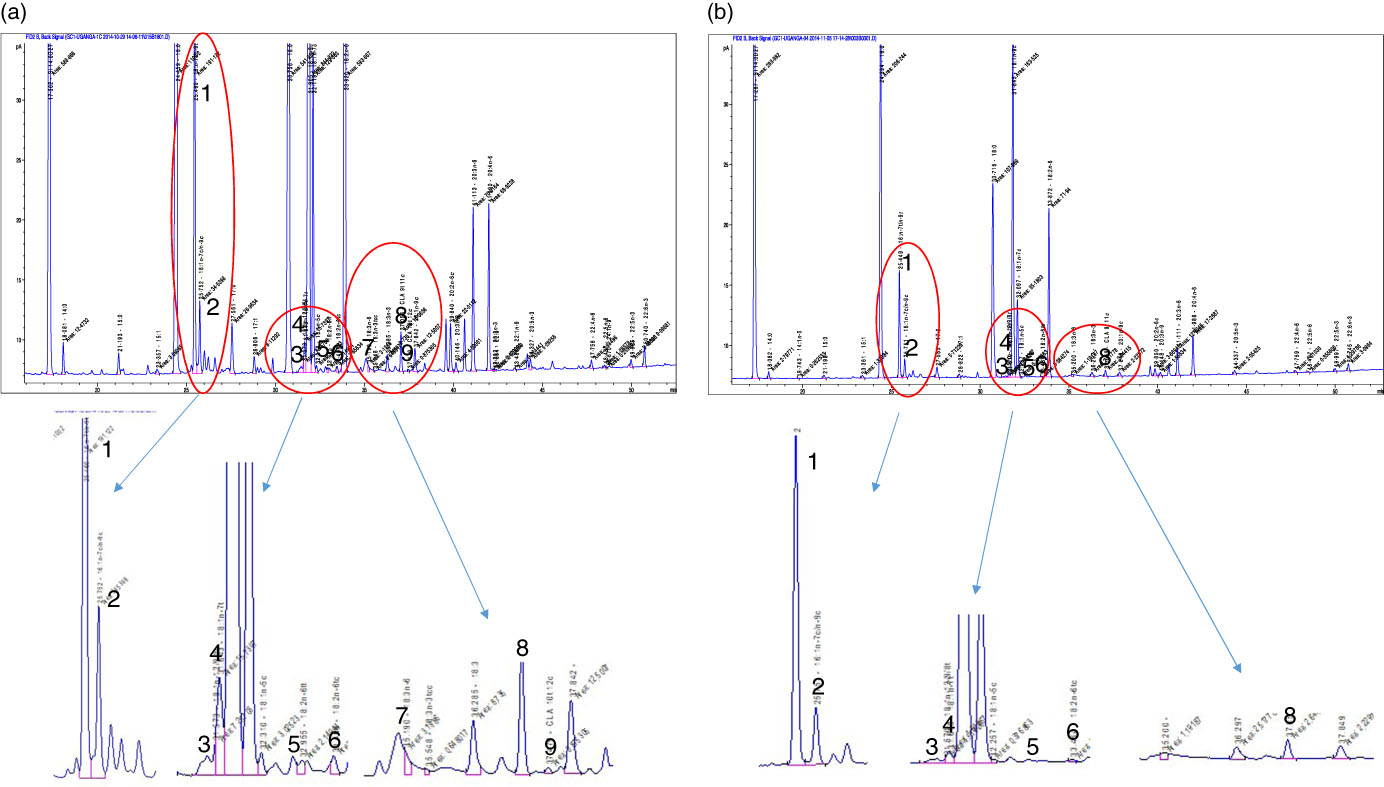
Separation of serum phospholipid fatty acids through GC. (a) The separation of fatty acids in a sample from the population study with a high proportion of trans-fatty acid isomers, while (b) shows a sample with a low proportion of trans-fatty acid isomers. 1, Palmitelaidic acid (16 : 1n-9trans); 2, palmitoleic acid (16 : 1n-9cis); 3, elaidic acid (18 : 1n-9trans); 4, vaccenic acid (18 : 1n-7trans); 5 and 6, linolelaidic acid isomers (18 : 2n-6trans,trans, 18 : 2n-6trans,cis); 7, linolenelaidic acid (18 : 3n-3trans,cis,cis); 8, conjugated linoleic acid (CLA) 9trans,11cis; 9, CLA 10trans,12cis. Industrial trans-fatty acids (iTFA) included peaks 1, 3, 5, 6 and 7, while ruminant trans-fatty acids included peaks 4, 8 and 9.
Serum phospholipid fatty acid ranges in the general population cohort (GPC) in Uganda, the European Prospective Investigation into Cancer and Nutrition study, the Japan Public Health centre-based prospective study on cancer and CVD study and a New Zealand National Nutrition Survey (Mean values, 95 % confidence intervals and ranges)
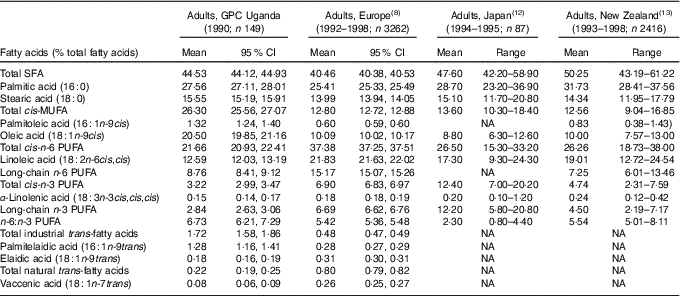
NA, not available.
In 1990–1991, the fatty acid profile in Ugandan adults is characterised by a high proportion of SFA (44·53 % of total fatty acids), mainly palmitic acid (27·56 %). More striking is the very high proportion of cis-MUFA (26·30 %), mainly oleic acid (20·50 %). In contrast, the proportions of n-6 PUFA (21·66 %), mainly linoleic acid (12·59 %) and n-3 PUFA (3·22 %) are low. The ratio of n-6:n-3 PUFA is 6·73. The proportion of TFA from industrial processing (1·72 %) is relatively high, mainly as the consequence of a high proportion of palmitelaidic acid, sixteen-carbon TFA (Fig. 1). In contrast, the proportion of elaidic acid, the main TFA from industrial processing, is relatively low, as is the proportion of TFA from natural sources mainly represented by vaccenic acid.
Trends in serum fatty acids over time
Trends in serum phospholipid fatty acids, expressed in absolute amounts and in proportions, from 1990 to 2008 are shown in Table 2 for adults and children.
Evolution trends of serum phospholipid fatty acids over time in the general population cohort, Uganda (Mean values and 95 % confidence intervals)
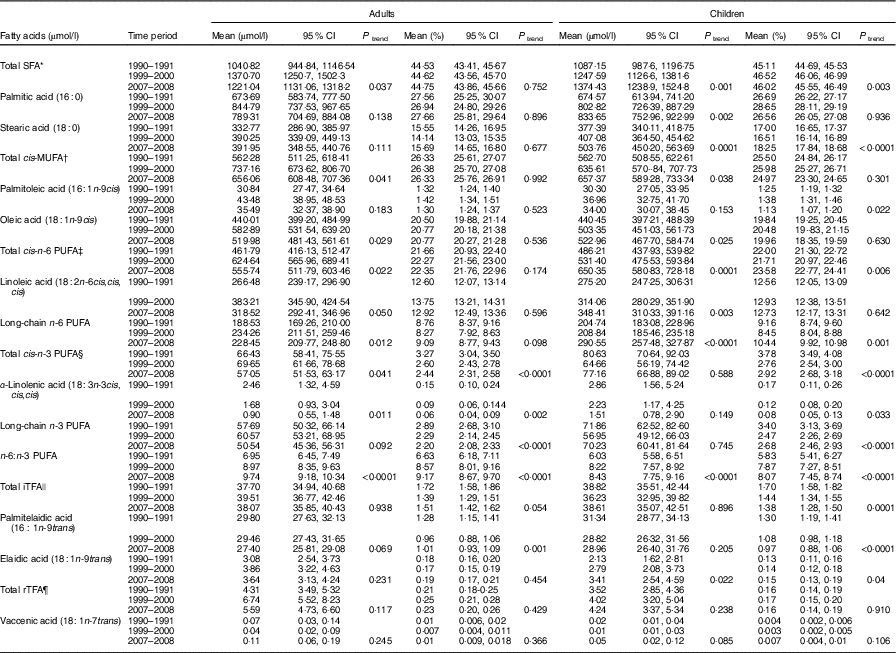
iTFA, industrial trans-fatty acids; rTFA, ruminant trans-fatty acids.
* SFA, including 10 : 0, 12 : 0, 14 : 0, 15 : 0, 16 : 0, 17 : 0, 18 : 0, 20 : 0, 22 : 0 and 24 : 0.
† cis-MUFA, including 14 : 1, 15 : 1, 16 : 1n-7/9, 17 : 1, 18 : 1n-5, 18 : 1n-7, 18 : 1n-9, 20 : 1, 22 : 1 and 24 : 1.
‡ n-6 PUFA, including cis-18 : 2, 18 : 3, 20 : 2, 20 : 3, 20 : 4, 22 : 4 and 22 : 5.
§ n-3 PUFA, including cis-18 : 3, 18 : 4, 20 : 4, 20 : 5, 22 : 5, 24 : 5, 24 : 6 and 22 : 6.
|| Total iTFA isomers from industrial processes, including trans-16 : 1n-9, trans-18 : 1n-9, trans-18 : 2n-6 and trans-18 : 3n-3.
¶ Total rTFA isomers from animal sources, including trans-18 : 1n-7, conjugated linoleic acids.
Notably, there were statistically significant increases in absolute amounts of SFA (17·3 % increase in adults and 26·4 % in children) (mainly palmitic acid), of cis-MUFA (16·7 % increase in adults and 16·8 % in children) (mainly oleic acid) and of total n-6 PUFA (20·3 % increase in adults and 33·8 % in children), as a consequence of the increasing levels of linoleic acid and long-chain n-6 PUFA. These trends were present in children and adults but were stronger in children; an unexplained peak level of SFA and MUFA was seen in adults in the 1999–2000 collection. There was an increasing ratio of n-6:n-3 PUFA, rising to 9·74:1 and 8·43:1 in adults (40·1 % increase) and children (39·8 % increase), respectively, in 2007–2008. There was a significant increase (of around 60 %) in the mean level of elaidic acid, the main eighteen-carbon monoenoic TFA isomer from hydrogenated fats in children, with far less of a rise in adults. In contrast, the levels of palmitelaidic acid showed a decreasing trend in adults (9 % decrease) and children (8 % decrease). TFA from natural animal sources remained very low over time.
Expression of fatty acids, both in proportions and in absolute amounts, showed similar directions of changes over time; however, changes are generally more pronounced when expressed in absolute amounts (Table 2).
Discussion
This study provides the first direct evidence of the transition in serum fatty acid profiles in a rural African population over time. The profile is characterised by high proportions of SFA, cis-MUFA and iTFA, low proportions of PUFA along with a high ratio of n-6:n-3 PUFA. This profile persisted from 1990 to 2008, but with increases in the absolute concentrations of SFA, MUFA, n-6 PUFA and the ratio of n-6:n-3 PUFA. A specific TFA isomer from industrial processing increased in children. Current profiles show high levels of fatty acids that are known to be deleterious to health.
Compared with data reported for adults in Europe( Reference Saadatian-Elahi, Slimani and Chajès 8 ), Japan( Reference Kobayashi, Sasaki and Kawabata 12 ) and New Zealand( Reference Bradbury, Skeaff and Crowe 13 ), the fatty acid profile in Ugandan adults in 1990–1991 is markedly different. The most prominent difference in Uganda is the far higher proportion of MUFA, mainly oleic acid. The Ugandan population is also characterised by higher proportions of SFA, mainly palmitic acid, than that reported in Europe, close to Japan and lower than New Zealand. The proportion of n-6 PUFA in Uganda is the lowest of the four populations compared. Similarly, the proportion of n-3 PUFA is much lower in Uganda than in the three other populations, particularly Japan. These differences result in Uganda having the highest ratio of n-6:n-3 PUFA. Among the different TFA isomers, the proportion of palmitelaidic acid, sixteen-carbon monoenoic n-9 TFA from industrial processing, is much higher in Uganda than in Europe, while the proportion of elaidic acid, the main eighteen-carbon monoenoic n-9 TFA from industrial processing, is lower in Uganda than in EPIC. The proportion of TFA isomers from dairy product intake is much lower in Uganda than in Europe.
High proportions of SFA palmitic acid and MUFA oleic acid in the GPC in Uganda are likely to be the consequence of high consumption of palm oil rich in palmitic acid and oleic acid, commonly used for cooking in Africa( Reference Mancini, Imperlini and Nigro 14 ). High proportions of TFA from industrial processing are likely to be the consequence of high dietary intake of palmitelaidic acid, TFA isomer from partially hydrogenated vegetable oils (PHVO) – these are also used for cooking as well as being added to a myriad of processed foods to cheaply improve the shelf life and palatability. Major dietary sources of this specific TFA isomer are deep-fried foods, bakery products, packaged snack foods, margarines( 7 , Reference Micha, King and Lemaitre 15 , Reference Sansone, Melchiorre and Chatgilialoglu 16 ) and also heating/frying and reuse of edible fats/oils( Reference Bhardwaj, Passi and Misra 17 ). Low proportions of natural TFA in the population study are likely to be the consequence of low consumption of dairy foods. Low proportions of n-6 PUFA likely result from low intake of vegetable oils rich in n-6 PUFA, as reported in a previous cross-sectional study within the GPC( Reference Riha, Karabarinde and Ssenyomo 18 ). Finally, low proportions of long-chain n-3 PUFA may reflect low intake of fish( Reference Saadatian-Elahi, Slimani and Chajès 8 ).
Trends in the levels of fatty acids from 1990 to 2008 in the population study showed significant increases in SFA (particularly in children), mainly palmitic acid, cis-MUFA, mainly oleic acid, n-6 PUFA, along with an increased ratio of n-6:n-3 PUFA, in adults and children. Levels of total iTFA – with palmitelaidic acid and elaidic acid being the major contributors to total TFA from frying oils and PHVO – remained stable over time. However, when distinguishing the two TFA isomers, levels and proportions of elaidic acid, the main TFA occurring in PHVO, increased over time in children, while levels and proportions of palmitelaidic tended to decrease over time, albeit remaining high compared with European values. This set of data might suggest that the use of PHVO has further increased in the last two decades in this rural population in Uganda.
These data indicate unfavourable trends of dietary fatty acids over time. It is tempting to hypothesise that the unfavourable trend in this population study in Uganda might reflect a global change in this population’s diet and be a surrogate for an early stage of nutrition transition in general. This is in line with the emergence and popularisation of soft drinks and fast foods in sub-Saharan Africa( Reference Steyn and Mchiza 3 ). A study of the diet of urban Ethiopian adults showed the regular consumption of oil and fat, while the consumption of fruits and vegetables decreased over time( Reference Amare, Moges and Moges 19 ). A dietary survey conducted in Kenya showed significant urban/rural differences in the contribution of macronutrients to total energy intake, with higher energy from fat and lower energy from carbohydrates in urban areas( Reference Steyn, Nel and Parker 20 ). This study might also illustrate differences in nutrition transition stages between urban and rural areas.
The specific fatty acid profile in the Ugandan population study is of concern, as some epidemiological studies reported a positive association between intake of SFA and iTFA and mortality from CHD, ischaemic stroke and type 2 diabetes( Reference De Souza, Mente and Maroleanu 21 ). Intake of iTFA, even at low levels, is specifically associated with several adverse outcomes, including inflammation and cardiovascular mortality( Reference Mozaffarian, Katan and Ascherio 22 ). Although limited, there is growing evidence that increasing blood proportion of iTFA is associated with an increased risk of weight gain( Reference Chajès, Biessy and Ferrari 23 ) and breast cancer( Reference Chajès, Assi and Biessy 11 , Reference Hirko, Chai and Spiegelman 24 ).
If iTFA are a cause of NCD in the West and yet higher in levels in Africa, where NCD are less common, this could be attributable to other characteristics of the population, which mitigate the increased risks from higher exposure to iTFA. For examples, risk factors such as smoking, physical activity and harmful alcohol intake associated with the risk of NCD have been reported to be rare in Uganda( Reference Nakibuuka, Sajatovic and Nankabirwa 25 ). However, the impact of specific iTFA isomers on the risk of NCD has not been studied within the Ugandan population study where the proportion of some iTFA isomers is higher than that in Europe.
Key strengths of this study are the availability of blood samples collected from 1990 in adults and children. In addition, we were able to separate and quantify sixty fatty acids, including various TFA isomers from natural and industrial processes. Finally, we were able to examine the relative concentrations as well as absolute concentrations of fatty acids. Among limitations, long-term storage of blood samples might have affected fatty acids, particularly PUFA. However, samples stored between –196°C and –80°C are likely to be stable over time( Reference Hodson, Skeaff and Fielding 26 ).
In conclusion, these data show evidence of an unfavourable trend over time of dietary fatty acids in a rural Ugandan population characterised by increasing levels of SFA, MUFA, iTFA (specifically elaidic acid) and n-6:n-3 PUFA. If the major sources of these harmful fats are the types of oils and fats used for cooking, this offers opportunity for policy change to improve public health in low-income settings. Finally, we also demonstrate the power of this approach in characterising how serum fatty acid profiles have changed over time, providing a benchmark for future prospective studies and a comparator for countries at different stages of nutritional transition.
Acknowledgements
The authors acknowledge Mrs Béatrice Vozar and Siham El Manssouri at the International Agency for Research on Cancer, for their assistance with laboratory measurements of serum fatty acids.
The GPC is jointly funded by the UK Medical Research Council (MRC) and the UK Department for International Development (DFID) under the MRC/DFID Concordat agreement.
V. C. and R. N. designed the project, drafted the manuscript and contributed to the interpretation of the data. V. C. supervised laboratory analysis. L. J. G. and C. B. conducted statistical analysis. All the authors have read, corrected the drafts and approved the final version of the manuscript.
The authors declare no conflict of interest.


