


Information: “Causal Panel Analysis under Parallel Trends: Lessons from a Large Reanalysis Study.” American Political Science Review 120(1): 245 – 66.
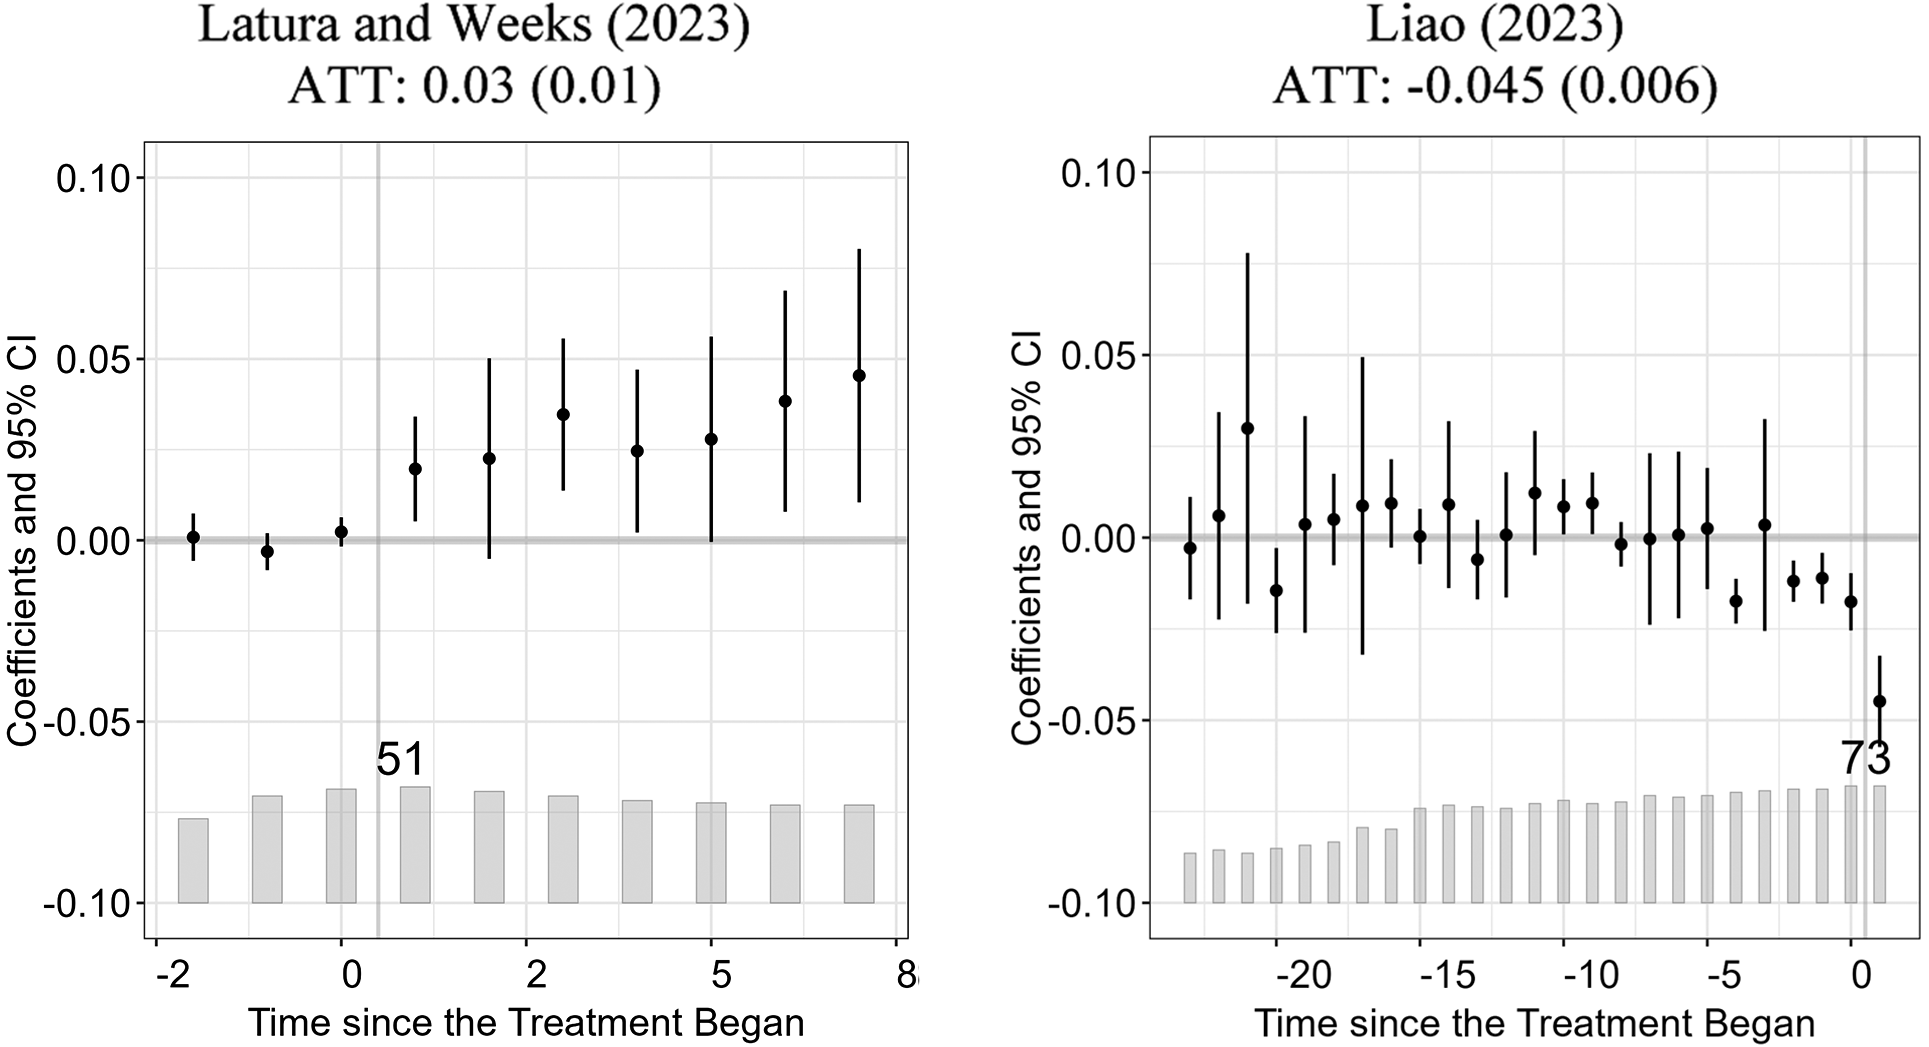
In Figure 5 on page 260 of published article, the panels associated with Latura (Reference Latura and Weeks2023) and Liao (Reference Liao2023) were inadvertently interchanged. We apologize for this error. The corrected panels of Figure 5 are provided below.
Event-Study Plots w/ Imputation Estimator (Corrected Panels)

Figure 5. Long description
The figure consists of two side-by-side panels. Both panels share a Y-axis labeled Coefficients and 95 percent C I ranging from negative 0.10 to 0.10 and an X-axis labeled Time since the Treatment Began.
Left Panel: Latura and Weeks 2023 with A T T 0.03 open parenthesis 0.01 close parenthesis.
* The X-axis ranges from negative 2 to 8.
* Data points with vertical error bars show a stable trend near zero before time zero, followed by a positive linear increase after treatment begins, peaking near 0.05 at time 8.
* A gray bar chart at the bottom of the plot shows relatively uniform distribution with the number 51 centered above the bars.
Right Panel: Liao 2023 with A T T negative 0.045 open parenthesis 0.006 close parenthesis.
* The X-axis ranges from negative 20 to 0.
* Data points with vertical error bars fluctuate around the zero line for most of the pre-treatment period. There is a sharp downward trend starting at time negative 2, dropping to approximately negative 0.05 at time 0.
* A gray bar chart at the bottom shows a gradual increase in frequency from left to right, with the number 73 positioned above the final bar at time 0.

 Open access


Comments
No Comments have been published for this article.