

I Introduction
Before China joined the World Trade Organization (WTO) in December 2001, annual constant GDP per capita for China in 2010 US Dollars increased by 32% between 1997 and 2001. After the WTO accession, there was an acceleration as the Chinese economy grew 49% between 2002 and 2006. Even more remarkably, the Chinese growth rate remained at 43% between 2007 and 2011 despite the 2007–2009 Great Recession. Behind those numbers is a steady improvement in Chinese living standards.
The goal of this paper is to quantify the treatment effect of WTO entry on Chinese economic growth, an important topic against a backdrop of ongoing US-China trade war and recent debates about whether US government made a mistake by allowing China to join WTO, see for instance the article titled “Was Letting China Into the WTO a Mistake? Why There Were No Better Alternatives” published at Foreign Affairs in April 2018. So far the discussion has mainly centered on the negative impact on rising trade deficit from the US viewpoint. This study on the other hand intends to highlight Chinese perspectives on WTO’s positive influence on its growth.
This research makes a contribution to the literature by using the synthetic control method (SCM) to provide a quantitative comparative case study contrasting the post-WTO economic growth of China to similar economies. The foremost output of SCM is a weighted average of control economies called synthetic China, which is constructed in such a way that it mimics pre-WTO China to the largest extent. Then the economic growth of synthetic China is compared to real China. The gap or divergence in the GDP trajectories can serve as evidence for the treatment effect.
SCM is suitable for a comparative case study for two reasons. First, country-specific idiosyncratic shocks can be smoothed out through averaging; Chins is compared to not just one country, but a weighted average of several countries. Second, optimal weights for control economies are determined endogenously in a data-driven fashion. We let data reveal the degree to which an economy imitates China. Thus, the concern about cherry-picking results can be alleviated.
In this paper, the treatment or intervention refers to joining WTO. Our identification of the treatment effect stems from the across-country variation in economic growth. More specifically, we contrast the growth trajectory of China to (1) the first group of nine countries that joined WTO at least five years later than China but no later than 2015 (donor pool A), and (2) the second group of twelve economies that joined WTO around the same time as China (donor pool B). The first comparison aims to produce the counterfactual of what would have happened to China’s economy in the absence of WTO accession, while the second comparison can shed light on the issue of whether China gains “abnormally” from WTO membership. The second issue is crucial for understanding how WTO accession affects China, but to our best knowledge, it hasn’t been investigated empirically in the literature.
The success of SCM hinges on the assumption that the treatment and control units are comparable. That being said, it is challenging to find control groups that are comparable to China given the sheer size of Chinese economy. Using donor pool B adds the difficulty that, while their dates of joining WTO are close to China’s, they are not the same. Our solution is to normalize the living standard of each economy in donor pool A by its level in one year prior to China’s date of joining WTO; for the country in donor pool B, its living standard is normalized by the level in one year before that country’s own joining date. Thanks to the normalization, the outcome variable in this study effectively becomes an index of living standard as opposed to a level, and that index is much more comparable across countries than the level. Accordingly, the treatment effect is estimated as the cross-economy difference in the growth rate of living standard, rather than the difference in levels of living standard.
To rule out the possibility that the observed gap in GDP trajectories is due to chance, we apply SCM to conduct placebo studies (permutation test). For instance, we apply SCM to the year 2000, before the actual date of Chinese WTO accession, and we do not observe a divergence in outcome variables between China and synthetic China. Moreover, we apply SCM to Kazakhstan, an untreated unit in donor pool A. We see patterns in the trajectory of living standards different from what we observed after applying SCM to China in 2001.
There are studies examining other impacts of China’s WTO entry (Chen, Reference Chen2002; Kim, Reference Kim2002; Shafaeddin, Reference Shafaeddin2004; Tang and Wei, Reference Tang and Wei2009; Bown, Reference Bown, Feenstra and Wei2010). In terms of focusing on the impact on economic growth, Ching et al. (Reference Ching, Hsiao, Wan and Wang2011) is similar to this study, but the two differ in the following ways: first, this paper uses SCM while Ching et al. (Reference Ching, Hsiao, Wan and Wang2011) use a panel data evaluation method that assumes the outcome variable is driven by unobserved common factors and economy-specific fixed effects. Second, Ching et al. (Reference Ching, Hsiao, Wan and Wang2011) do not compare China to economies that joined WTO at times close to China. Given those differences, this study can be seen as a complement to Ching et al. (Reference Ching, Hsiao, Wan and Wang2011).
II Data and Methodology
For each economy, annual constant GDP per capita in 2010 US Dollars is downloaded from FRED economic data. For expository simplicity, GDP refers to the constant GDP per capita in 2010 US Dollars thereafter. If an economy joins WTO in the last three months of a year, we set the intervention or treatment period to next year. China for example entered WTO in December 2001, so the intervention period is set to 2002.
Donor pool A consists of nine economies that joined WTO at least five years later than China. In other words, those economies were untreated units in 2002 when China was subject to the treatment. The samples for China and economies in donor pool A range from 1997 to 2011, covering five pre-treatment years and ten post-treatment years for China. The beginning and ending dates are determined by data availability for all economies considered in this paper. In our view, five pre-treatment years are sufficient to capture the pre-treatment trend, and ten post-treatment years are sufficient to reveal possible divergence in growth trajectories.
No other economies joined WTO at the same time as China, but some were close. To obtain donor pool B with the proper size, we consider economies joining WTO no earlier than January 1999 and no later than December 2004. For those economies in donor pool B their samples include five pre-treatment years and ten post-treatment years just like China, albeit the treatment date varies across economies. We preclude economies that had already been members of WTO before 1999 or haven’t joined WTO since 2016 because a substantial difference in joining-WTO dates signals lack of comparability to China. The name of economies in each donor pool, their dates of joining WTO, and the beginning and ending dates of the sample are reported in Table 3.1. For instance, Kazakhstan joined WTO in November 2015, fourteen years later than China. So it is in donor pool A, and its sample spans from 1997 to 2011. By contrast, Albania joined WTO in September 2000, only one year earlier than China, so it belongs to donor pool B. Its sample is from 1995 to 2009 (i.e., five years before joining WTO and ten years after).
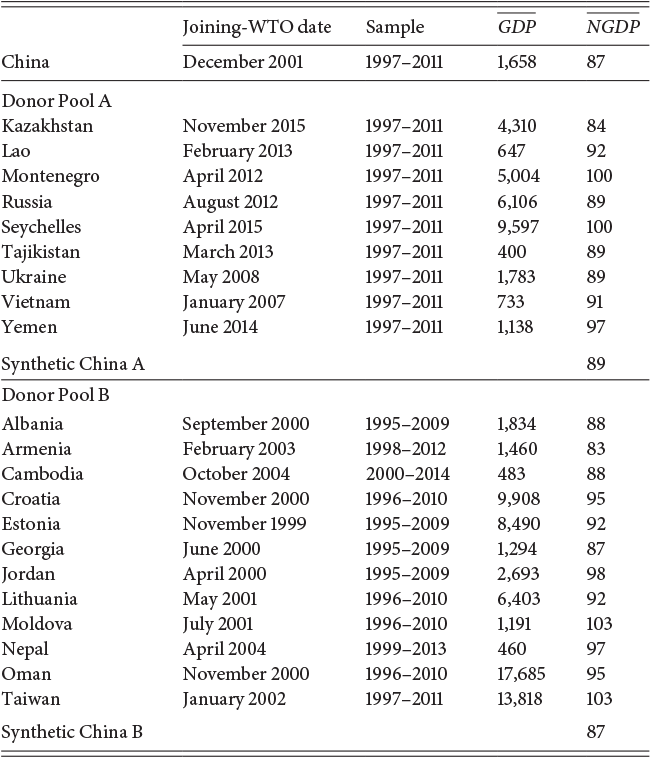
Note:  denotes the average GDP in the five pre-treatment years;
  denotes the average normalized GDP in the pre-treatment years.
There is noticeable across-economy heterogeneity in living standards before treatment, as shown by  in Table 3.1, which denotes the average GDP in five pre-treatment periods. Take donor pool A. China’s average GDP (1,658) was more than twice of Vietnam’s average GDP (733) between 1997 and 2001, although it was only about one-sixth of Seychelles’. Variations alike can also be seen in donor pool B – China was richer than say, Cambodia and Nepal, but poorer than Croatia and Oman.
Therefore a direct comparison of China to other economies is like comparing apples to oranges. In order to put all economies on equal footing and facilitate apple-to-apple comparison, the outcome variable used for constructing synthetic China is the GDP normalized by its value in one year before treatment. In other words, the normalized GDP is set to 100 in 2001 for China and economies in donor pool A. The same normalization is applied to donor pool B but using the GDP from one year before that particular economy joined WTO. For instance, the GDP of Albania is divided by its value in 1999. Because of the normalization, readers are cautioned that all the subsequent results are expressed in terms of an economy-specific index of living standard (the base period is one year before the treatment), or in terms relative to one year prior to the treatment.
The average normalized GDP (NGDP for shorthand) in the pre-treatment periods is denoted by ( in Table 3.1. It equals 87 for China, meaning that on average the GDP of China between 1997 and 2001 is 87% of its GDP in the year 2001. By comparing
  to
to  , we see that the normalized GDP has much smaller variation, and therefore is much more comparable across economies relative to un-normalized GDP. Overall, the enhanced comparability increases the likelihood of constructing a satisfactory synthetic China. Note that even after the normalization, Montenegro, Seychelles, Moldova, and Taiwan differ substantially from China by having
  greater than or equal to 100.
Next, we use NGDP as the outcome variable and apply the SCM proposed by Abadie and Gardeazabal (Reference Abadie and Gardeazabal2003) to obtain two versions of synthetic China based on donor pool A and donor pool B, respectively. In a nutshell, synthetic China is a weighted average of economies in the control group, and an economy with a growth path similar to China receives a greater weight than an economy with a dissimilar growth path. Put differently, SCM assigns data-driven weights to untreated units and the weights are determined by the predictive power. Mathematically, two nested optimization problems are solved by SCM:
 (1)
(1) (2)
(2)where V is a diagonal matrix of weights for predictors; W is a vector of weights for controlled units; A1 is a vector of predictors for the treated unit in the training set; A0 is a matrix of values of predictors for controlled units in the training set; B1 is the vector of outcome variables of the treated unit in the validation set, and B0 is the matrix of outcome variables of controlled units in the validation set.
Minimizing the quadratic form in (1) is a restricted quadratic programming problem because the weight is bounded between 0 and 1. The results are the optimal weights for controlled units for given V, and the optimal V is obtained by cross-validation (i.e., minimizing the mean squared out-of-sample prediction error in the training set given by 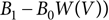 Finally, the synthetic control estimate for the treatment effect is given by
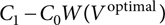 (3)
(3)
where C1 and C0 contain values of outcome variables in the post-intervention periods for the treated and controlled units, respectively. The intuition is that the weighted average of post-intervention outcome variables of controlled units  is used to approximate the potential outcome of the treated unit in the absence of treatment. For more details about SCM, see Abadie et al. (Reference Abadie, Diamond and Hainmueller2015). We follow Ching et al. (Reference Ching, Hsiao, Wan and Wang2011) and use lagged values of the outcome variable and their averages as predictors.
III Synthetic China A
To summarize, the synthetic China A is a weighted average of economies in donor pool A and the weight is determined by the extent to which each economy in that group helps predict China’s normalized GDP in the validation period of 2000 and 2001. An economy with a greater forecasting power is assigned a greater weight.
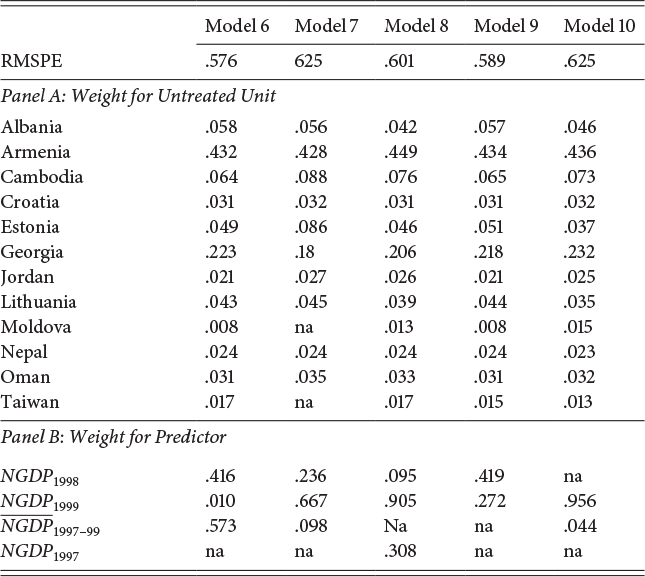
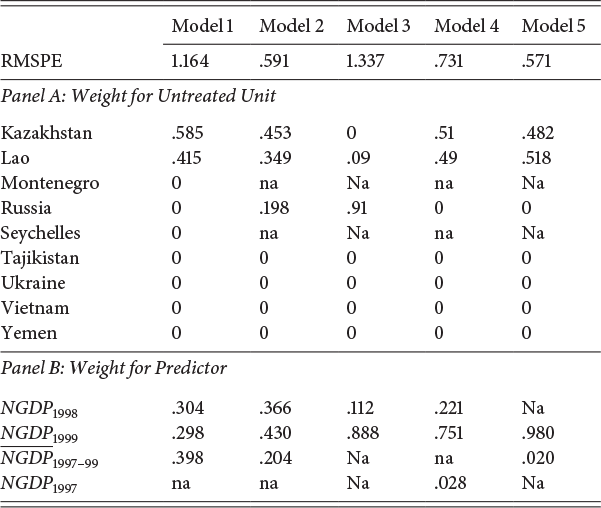
Table 3.2 reports the model specification for constructing synthetic China A, and each column represents one specification. The criterion for model selection is RMSPE – the root of mean squared prediction error for the outcome variable in validation periods. A model with the smallest RMSPE is deemed the best one. Panel A of Table 3.2 shows weights for controlled economies while Panel B shows weights for predictors. Those weights are solutions of  and
and  in (1) and (2).

Note: Each column represents one specification for SCM. A predictor with overline denotes the sample mean. Those weights are solutions of  and
and  in (1) and (2).
In Model 1 all economies in donor pool A are included, and predictors are normalized GDPs in 1998 and 1999, and the average normalized GDP of 1997–1999. We see only two economies are assigned nonzero weights – Kazakhstan’s weight is 0.585 and Lao’s weight is 0.415. The weights for the three predictors are 0.304, 0.298 and 0.398, respectively. Note that in terms of average pre-treatment normalized GDP, Kazakhstan, and Lao are not the ones closest to China, see Table 3.1. But Model 1 also uses normalized GDPs in 1998 and 1999 as predictors. Kazakhstan and Lao have pre-treatment NGDP paths that are closest to China, so they dominate in Model 1.
Because Montenegro and Seychelles have unusually high in pre-intervention periods, Model 2 re-estimates Model 1 after dropping those two economies from the donor pool. Now Russia receives a nonzero weight of 0.198. Model 3 removes the average normalized GDP of 1997–1999 from the set of predictors, resulting in a deterioration in fit as RMSPE jumps remarkably from 0.591 in Model 2 to 1.337 in Model 3. Model 4 replaces the average normalized GDP of 1997–1999 with normalized GDP in 1997 as a predictor. It performs worse than Model 2 because in general GDP is trending upward and the 1997 value lags behind the trend more than the average value.
In terms of minimizing RMSPE or obtaining optimal out-of-sample forecasts in validation periods, Model 5 is the best one by having the smallest RMSPE of 0.571. Model 5 uses normalized GDP in 1999 and the average normalized GDP of 1997–1999 as predictors, and is our chosen model for constructing synthetic China A. Ignoring the worst Model 3, we only see a slight change in the weights for Kazakhstan and Lao, so those two weights are robust.
The best way to present the result of SCM is by visualizing its output. Panel A of Figure 3.1 displays the trajectory of the normalized GDP of China (solid line) and synthetic China A (dash line) constructed with Model 5 in Table 3.2. A vertical line is drawn in the year 2001 (the last pre-treatment year) and the normalized GDP is set to 100 in the year 2001. The divergence in the two trajectories after China’s WTO accession is obvious and persistent. For instance, in 2006 the normalized GDP was 161 for China but only 141 for synthetic China A. That means relative to the 2001 GDP, China’s economy had grown 61% within five years after WTO entry, but synthetic China A had only grown 41%.
Synthetic China A
Note: Panel A compares the trajectory of normalized GDP of China and synthetic China A; Panel B conducts an “in time” placebo; Panel C conducts an “in place” placebo; Panel D contrasts the gap in normalized GDP between China and synthetic China A (solid black line) to gaps between economies in donor pool A and their synthetic counterparts (dashed gray line)
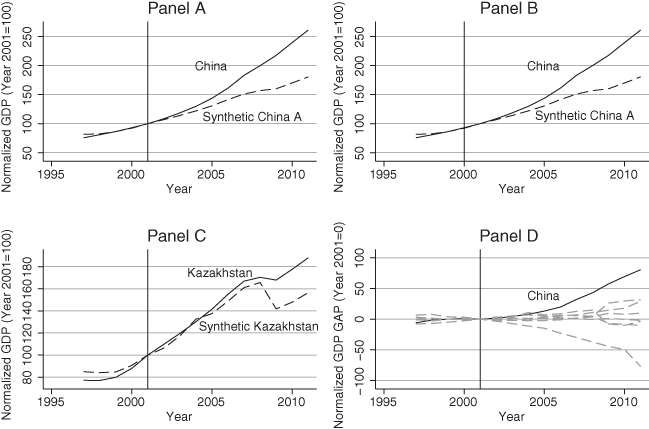
Economic growth could be driven by factors other than the WTO accession. That is why the economies embodied in synthetic China A could grow even without the WTO treatment. One benefit of SCM is using synthetic China to control for other factors, and our identification of the treatment effect of WTO accession stems from the difference between China and synthetic China. Because the economies in donor pool A were not members of WTO in 2002–2006, the GDP trajectory of synthetic China A during that period is able to reveal the counterfactual of what would have happened to China’s economy had China not joined WTO. In other words, the 20% difference in relative growth between China and synthetic China A provides an SCM estimate of the within-five-year treatment effect on Chinese economic growth of joining WTO.
We provide four pieces of evidence to support that SCM estimate. First, in Panel A there is a tight overlap between the two trajectories before 2001, implying that synthetic China A mimics China reasonably well prior to the treatment and therefore is suitable for generating satisfactory counterfactual. In fact, the average normalized GDP between 1997 and 2001 is 87 for China and 89 for synthetic China A. Those two values being close reflects that China and synthetic China A share a common trend before the treatment. In other words, China and its synthetic counterpart are likely to have similar confounding factors, so a comparison between them is akin to an apple-to-apple comparison.
Second, to rule out the possibility that we observe Panel A just by chance, two placebo experiments are carried out. Panel B of Figure 3.1 illustrates an “in time” placebo experiment by re-estimating Model 5 but using the year 2000 as the intervention period. That is, we pretend China joined WTO in 2000, before the actual date. Panel A would be problematic if Panel B displays a post-treatment gap between the two trajectories that looks similar to Panel A. That is not the case here – instead we see in Panel B a close-to-zero gap immediately after 2000, which indicates no treatment effect. Overall Panel B shows that it is unlikely to observe Panel A due to sampling variability.
Third, Panel C of Figure 3.1 presents an “in place” placebo by conducting the synthetic control analysis in Kazakhstan. That country had not joined WTO until November 2015, so there was no WTO treatment effect on its economy in 2002. Nevertheless, we pretend a WTO treatment occurred in 2002 and set the intervention period accordingly. In Panel C we see no persistent widening gap between the trajectories of Kazakhstan and synthetic Kazakhstan after 2002. That finding is consistent with our expectations and adds support to Panel A.
Finally, Panel D of Figure 3.1 plots the gap in normalized GDP between an economy and its synthetic counterpart after SCM is applied to every economy in donor pool A. The normalized GDP gap of China is represented by a solid black line and gaps of other economies are represented by dashed gray lines. Two facts are noteworthy – first, most dashed gray lines are near zero after 2002, consistent with the fact that those economies are not subject to WTO treatment. Second, the Chinese normalized GDP gap is consistently positive and above all dashed gray lines, indicating that China’s relative growth dominates other economies in donor pool A. In short, China’s economic growth is indeed positively affected by WTO accession.
IV Synthetic China B
In this section, we examine the issue of whether China’s economic growth after WTO accession is “exceptional” compared to economies joining WTO between 1999 and 2004. For each economy in donor pool B, we include five pre-treatment years and ten post-treatment years. The GDP is normalized by dividing the level by one year prior to the treatment. Since the intervention period varies for economies in donor pool B, synthetic China B is a weighted average of normalized GDPs of the controlled economies within ten years after their own WTO entries.
The model selection for constructing synthetic China B is presented in Table 3.3, which differs from Table 3.2 in two aspects. First, because all the economies in donor pool B are more comparable to China in terms of having joining-WTO dates close to China, almost all of them receive nonzero weights in Panel A of Table 3.3. Second, the best specification is Model 6 that includes every economy in donor pool B and uses lagged values of normalized GDPs in 1998 and 1999 and average normalized GDP between 1997 and 1999 as predictors. Note that the RMSPE of Model 6 is similar to Model 5 in Table 3.2. Moreover, the average pre-treatment normalized GDPs are 87 and 87 for China and synthetic China B, respectively, a finding that implies that the pre-treatment common trend is captured by the synthetic China B.
Note: Each column is one specification using SCM. A predictor with an overline denotes its sample mean. Those weights are solutions of  and
and  in (1) and (2).
Panel A of Figure 3.2 compares the trajectory of normalized GDP of China and synthetic China B. Unlike Panel A in Figure 3.1, we do not see a widening divergence between the two trajectories immediately after WTO accession. This finding is anticipated because donor pool B is unlike donor pool A, and the former supposedly benefits from WTO accession just like China. Actually, the gap between the two trajectories is not noticeable until 2007 – there is a dip in growth for synthetic China B in 2008 thanks to the Great Recession. By contrast, the economic growth of China remained largely unchanged in 2008. According to Panel A, the impact of Great Recession on economies in donor pool B is profound in the sense that there seems no tendency for synthetic China B to return to its pre-recession trajectory.
Synthetic China B
Note: Panel A compares the trajectory of the normalized GDP of China and synthetic China B; Panel B contrasts the gap in normalized GDP between China and synthetic China B (solid black line) to gaps between economies in donor pool B and their synthetic counterparts (dashed gray line)
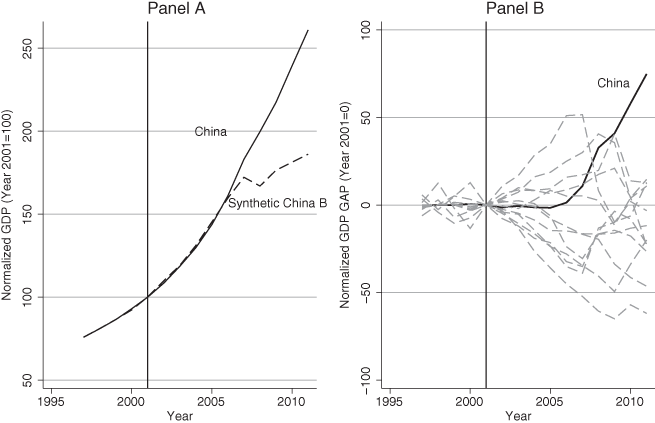
A closer look at Panel A, especially between 2002 and 2007, illustrates that China actually falls a little behind its synthetic counterpart (i.e., the solid line lies slightly below the dashed line). This is the first indication that China’s post-WTO growth is not exceptional, at least in the five-year short term. The second indication of China’s average performance before 2007 is provided by Panel B of Figure 3.2, which contrasts the gap in normalized GDP between China and synthetic China B (solid black line) to gaps between economies in donor pool B and their synthetic counterparts (dashed gray line). In Panel B, China does not stand out in the crowd until around 2007, and this finding is in line with Panel A.
Notice that in Panel B some gray lines are consistently below 0. That means joining WTO is not necessarily associated with accelerated economic growth since there may be other factors neutralizing WTO’s treatment effect. One example is that Georgia had the Russo-Georgian War after joining WTO in June 2000. One advantage of SCM is smoothing out country-specific idiosyncratic shock through weighting averaging.
V Comparative Case Study
In order to better understand the heterogeneity in post-WTO economic growth, Figure 3.3 compares the average post-WTO normalized GDP gap between an economy and its synthetic counterpart. First, Panel A shows that China distinguishes itself in comparison to donor pool A between 2002 and 2011. On average China outperforms synthetic China A by 33% during that period, whereas Kazakhstan and Lao outperform their synthetic counterparts only by 11% and 9%. Since Kazakhstan and Lao receive almost equal weights in Model 5 in Table 3.2, the SCM estimate of treatment effect within ten years is about  three percentage points greater than the estimate of the five-year treatment effect. Note that there is negative economic growth in Yemen during that period, which may partially lead to the Yemeni Crisis beginning with the 2011–2012 revolution.
Average post-treatment normalized GDP gap
Note: Panel A compares the average 2002–2011 post-WTO normalized GDP gap between China and synthetic China A to gaps between economies in donor pool A and their synthetic counterparts; Panel B compares the average within-five-year post-WTO normalized GDP gap between China and synthetic China B to gaps between economies in donor pool B and their synthetic counterparts; Panel C compares the average within-ten-year post-WTO normalized GDP gap between China and synthetic China B to gaps between economies in donor pool B and their synthetic counterparts
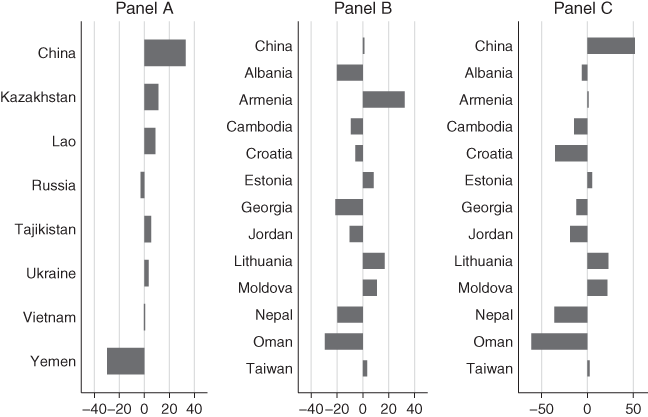
In light of Panel A in Figure 3.2, we need to separately discuss the short-run and long-run when comparing China to donor pool B. Panel B of Figure 3.3 presents the average normalized GDP gap between each economy and its synthetic counterpart in the short-run (within five years of joining WTO). China on average grows faster than synthetic China B by only 1% during that period, while Armenia, Estonia, Lithuania, Moldova, and Taiwan outperform their synthetic counterparts by 32% 8% 17% 11% and 3%. Those five economies are also the ones having gray lines above China before 2007 in Panel B of Figure 3.2. Given this finding, the post-WTO growth in China is not exceptional.
We see a remarkable change in Panel C of Figure 3.3, which reports the long-run (within ten years of joining WTO) average gap for China and donor pool B. Now China has the best performance relative to other economies with an average gap of 51% between 2008 and 2011. By contrast, Armenia only outperforms synthetic Armenia by 1% between 2009 and 2012. A general pattern is evident: from Panel B to Panel C, a positive gap becomes less positive whereas a negative gap becomes more negative, largely because of the negative impact from Great Recession. China is an exception thanks to favorable shocks such as the 2008 Beijing Summer Olympics.
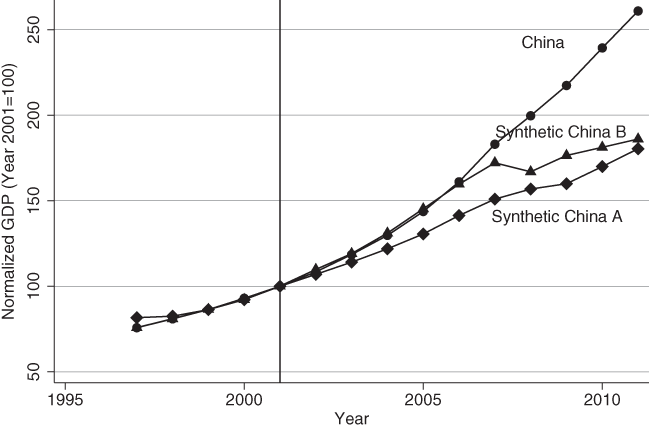
Finally, Figure 3.4 puts together the normalized GDP trajectories of China, synthetic China A, and synthetic China B. It is obvious that China outperforms synthetic China A. By contrast, the gap between China and synthetic China B is not noticeable until the 2008–2009 Great Recession.
China and synthetic China
Note: Comparison of the normalized GDP trajectories of China, synthetic China A, and synthetic China B

VI Conclusion and Discussion
The goal of this paper is to estimate the treatment effect of WTO entry on China’s economic growth. Our identification strategy is contrasting the growth trajectory of China to economies that either joined the WTO much later than China or around the same time as China. By combining economies in the control groups into synthetic China A and synthetic China B, with weights being determined endogenously by data, we are able to capture the pre-treatment common trend between China and its synthetic counterparts. Moreover, the synthetic control method enables us to control for unobserved confounding factors, and smooth out country-specific idiosyncratic shocks.
China’s economy is unique given its sheer size and relatively low living standards before WTO accession. In order to increase the comparability across economies and the likelihood of obtaining a successful synthetic control, we put all economies on equal footing by normalizing each economy’s real GDP per capita by the level in one year before joining WTO. When interpreting our results, readers should keep in mind that the outcome variable is an index of living standards that is specific to each economy.
We report a persistent and positive gap between the growth trajectory of China and synthetic China A. More explicitly, relative to the 2001 GDP, China’s economy had grown 61% within five years after WTO entry, but synthetic China A had only grown 41% This finding implies that China would have grown much slower in the absence of WTO entry. This positive impact of WTO on China’s economy is consistent with the general belief that trade contributes to growth.
The second research question we attempt to answer is whether the post-WTO growth of China is exceptional. Our finding is that within five years after WTO accession, China’s growth had been comparable to other economies with similar joining-WTO dates. China’s growth hadn’t become distinguishable until 2008 when Great Recession affected other economies much more severely than China.
Several factors contribute to China’s robust growth after Great Recession. For one thing, from 1997 to 2011 the length of railways in China increased by 41%, the length of the expressway network increased by 1,600%, the number of university graduates increased by 634 and foreign direct investment in China increased by 156%. Furthermore, the 2008 Chinese Economic Stimulus Program implemented by the Chinese government injected into the economy a stimulus package worth four trillion Renminbi or 586 billion US dollars. The 2008 Beijing Summer Olympics also helped the economy tremendously.
To summarize, our study suggests that China did not gain an unusual benefit from the WTO accession. Accelerated post-WTO growth happened in many countries, not just in China. Becoming a WTO member is only one of the factors leading to rapid improvement in Chinese living standards.


 Open access