

In European countries, 10–25 % of the population suffers from at least one food-borne infection per year. This number increases in travellers to tropical countries, with gastrointestinal diseases accounting for 33 % of all the illnesses( Reference Field, Gautret and Schlagenhauf 1 ). Most infections are self-limiting; however, these infections can be life threatening in people with reduced resistance (e.g. young children, elderly or persons taking immunosuppressive drugs). Treatment of food-borne infections with antibiotics is usually ineffective. Moreover, many bacterial pathogens become resistant to these drugs. Therefore, it is important to search for an alternative means to prevent or treat these infections. Besides improved hygiene, enhancement of human resistance to food-borne infections is an attractive option. Probiotics can contribute to enhanced human resistance to infectious diseases by excretion of anti-microbial components, by competing with pathogens for intestinal nutrients and mucosal adhesion sites, or by modulating the immune system.
Lactobacillus acidophilus (American Type Culture Collection (ATCC) 700396) is a probiotic strain originally isolated from the faeces of a healthy adult. Human studies have shown that the strain survives gastrointestinal transit( Reference Ouwehand, Tiihonen and Saarinen 2 , Reference Sui, Leighton and Busta 3 ) and affects the composition( Reference Engelbrektson, Korzenik and Pittler 4 ) and activity( Reference Goldin and Gorbach 5 ) of the faecal microbiota. The strain also affects the small-intestinal microbiota( Reference Simenhoff, Dunn and Zollner 6 ). Consumption of the strain, together with an oral cholera vaccine, has been shown to lead to a more rapid immune response( Reference Paineau, Carcano and Leyer 7 ). In combination with another strain (Bifidobacterium lactis Bi-07), the strain has been observed to reduce the incidence of diarrhoea( Reference Heiser, Ernst and Barrett 8 ).
In the present double-blind, placebo-controlled, randomised parallel study, the effect of oral L. acidophilus (ATCC 700396) v. placebo on the resistance of human subjects to enterotoxigenic Escherichia coli (ETEC) infection was studied. The main hypothesis is that L. acidophilus (ATCC 700396) will improve human resistance to ETEC as measured by the decreased faecal excretion of ETEC with time and less ETEC-induced daily faecal output.
Subjects and methods
Subjects
The present human intervention study was conducted according to the guidelines laid down in the Declaration of Helsinki, and all procedures involving human subjects were approved by the Medical Ethics Committee of Wageningen University, The Netherlands, and registered at clinicaltrial.gov as NCT01225042. Men were recruited by posters mounted in public buildings. Women were excluded to participate because it is more difficult for them to collect faeces completely separately from urine. The 105 men who responded received a comprehensive brochure of the study and an invitation to attend the study's information meeting. After receiving written informed consent from all the subjects, a general medical questionnaire was completed. Subjects reporting the use of antibiotics, immunosuppressive drugs, antacids, laxatives or anti-diarrhoeal drugs in the last 3 months before the study, gastrointestinal illness or surgical operations in the past, or lactose intolerance were excluded.
Screening for serum colonisation factor antigen II antibodies and faecal lactobacilli
After passing the first screening and receiving written informed consent, a non-fasting blood sample was obtained. Sera were prepared and analysed for specific antibodies (IgG) against colonisation factor antigen II (CFAII) as described previously( Reference Bovee-Oudenhoven, Lettink-Wissink and Van Doesburg 9 ). CFAII is a specific immunogenic epitope of ETEC. Men with clear antibody titres against CFAII, induced by previous ETEC infections, were excluded because of likely resistance to the ETEC strain administered in the present study.
In addition, a fresh faecal sample was obtained and analysed for total lactobacilli, as described earlier( Reference Ten Bruggencate, Bovee-Oudenhoven and Lettink-Wissink 10 ). Because the presence of endogenous lactobacilli might affect the resistance-enhancing effect of dietary probiotics, the participants were stratified according to the number of faecal lactobacilli in addition to age.
Study design, dietary guidelines and probiotics
A parallel, double-blind, placebo-controlled challenge study of 4 weeks was performed (Fig. 1). The subjects were instructed to maintain their usual pattern of physical activity and consume their habitual diet, but refrain from consuming dairy products and products with high amounts of prebiotic fibres and probiotics.
Flow diagram of the study design.
Dairy products are rich in Ca and contribute significantly to total daily Ca intake. To standardise and decrease dietary Ca intake of the subjects, in order to increase the efficacy of the vaccine( Reference Ouwehand, Tiihonen and Saarinen 2 ), low-Ca soya milk and low-Ca soya custard were provided to the subjects as dairy product replacement. During the entire study period, the subjects consumed 150 ml of low-Ca soya milk (50 mg Ca/kg) in the morning during breakfast and 150 ml of soya milk custard (54 mg Ca/kg) in the evening during dinner. (Base soya milk was obtained from Alpro-Soya Bio Nature, Belgium. Soya milk custard was produced at NIZO's production plant, and both the soya milk and custard were flavoured, sterilised and packaged in daily portions.) Based on Ca analysis by inductively coupled plasma-atomic emission spectrometry (Varian), Ca intake as a result of consuming these soya milk products was 16 mg/d.
The probiotic L. acidophilus (ATCC 700396; Danisco USA) was supplied as a powder in capsules, containing 109 colony-forming units (CFU) of L. acidophilus (ATCC 700396). The placebo consisted of a powder of identical appearance and taste (microcrystalline cellulose). The subjects had to open these capsules and mix their contents with the supplied soya milk products in the morning and in the evening and drink them immediately after preparation.
Oral challenge with attenuated Escherichia coli
After an adaptation period of 2 weeks to the intervention products, the subjects fasted for at least 4 h, and all were subsequently orally infected with a live, but attenuated, oral ETEC vaccine strain under supervision( Reference Bovee-Oudenhoven, Lettink-Wissink and Van Doesburg 9 ). ETEC (1010 CFU) was suspended in 100 ml of diluted fruit juice (Roosvicee; Koninklijke de Ruijter) set at physiological pH and osmolarity. The subjects drank 100 ml of demineralised water containing 2 g sodium bicarbonate (Merck) 5 min before ingestion of ETEC to neutralise gastric acid. The subjects drank 150 ml of low-Ca soya milk with either added L. acidophilus (ATCC 700396) or placebo, depending on assignment, 5 min after ingestion of ETEC. Eating and drinking were permitted again 1 h after the oral challenge with attenuated E. coli.
Serum analysis
Blood samples (10 ml) were collected by qualified staff of a local hospital on days 9 and 15 after the oral challenge with attenuated E. coli. Sera were prepared by low-speed centrifugation (20 min at 3000 g and at 10°C) and stored at 20°C. The concentrations of specific antibodies (IgG, IgM and IgA) against CFAII in sera were determined by direct ELISA as described elsewhere( Reference Bovee-Oudenhoven, Lettink-Wissink and Van Doesburg 9 ).
Collection of faecal samples and diarrhoea quantification
Before (on days − 2 and − 1) and after (on days 1, 2, 3, 5 and 17) the oral challenge with attenuated E. coli, 24 h faecal samples were collected. The samples were refrigerated immediately after defaecation, transported to the laboratory under cooled conditions, weighed and homogenised, and aliquots were stored at − 20°C for later analyses. Diarrhoea was quantified by the determination of daily faecal wet weight excretion and by the percentage of faecal wet weight as determined after freeze-drying.
Analyses of faecal enterotoxigenic Escherichia coli and other bacteria
DNA was isolated from the faecal samples collected using the QIAamp DNA Stool Mini Kit (QIAgen Benelux) according to the instructions of the manufacturer, with slight modifications; after addition of the lysis buffer, the samples were shaken for 3 × 1·5 min at 5000 rpm together with zirconia/silica beads in a Bead Beater.
The extracted microbial DNA was analysed by quantitative PCR by absolute quantification using a standard curve with the ABI-PRISM 7500 Sequence Detection System (Applied Biosystems). The SYBR Green methodology (Applied Biosystems) was used for the Bacteroides–Prevotella–Porphyromonas group, Clostridium difficile and Clostridium cluster XIVab, while the TaqMan methodology was used for Bifidobacterium spp., Escherichia coli and L. acidophilus ATCC 700396. The other primers used are given in Table 2. Each sample was analysed in triplicate, and all samples of one subject were analysed in the same run. No-template controls and DNA standards from bacterial strains were included on each plate to enable the quantification of the bacterial content of the samples. The detection limit for the ETEC quantitative PCR corresponds to 3·8 log CFU (quantity DNA).
The number of total faecal bacteria was determined using a flow cytometric FACSCalibur system (BD Biosciences) as described previously( Reference Apajalahti, Kettunen and Kettunen 11 ). The samples were fixed with 4 % formaldehyde and stained with a fluorescent, nucleic acid-binding dye (SYTO 24; Molecular Probes).
Faecal immune markers
The concentrations of faecal immune markers IgA (total) and calprotectin were measured using the supernatants of the faecal homogenates. Briefly, the homogenates were centrifuged (16 000 g , 5 min), and the supernatants were collected. For the measurement of the concentration of IgA, the samples were extracted with bovine serum albumin as described previously( Reference Lahtinen, Forssten and Aakko 12 ). The concentrations of IgA and calprotectin were determined using ELISA with Human IgA ELISA Quantitation Kit E80-102 (Bethyl Laboratories, Inc.) and the PhiCal ELISA test (Eurospital S.p.A.), according to the manufacturer's instructions. The results are expressed as μg/g of (wet) faeces.
Stool consistency, bowel habits and gastrointestinal symptoms
During the entire study period, the subjects reported information on stool consistency by using the Bristol stool scale( Reference Heaton, Ghosh and Braddon 13 ). Moreover, bowel habits (defaecation frequency) and frequency and severity of gastrointestinal symptoms (flatulence, bloating, abdominal pains and cramps) were self-recorded daily in a diary, using a visual analogue scale that ranged from absent to maximum severity( Reference Ten Bruggencate, Bovee-Oudenhoven and Lettink-Wissink 10 ).
Data analysis and statistics
Randomisation lists for the completely randomised design study were generated by a representative of Danisco USA, who was not involved in the clinical trial, using a research randomisation generator (http://www.randomizer.org). The randomisation code of the human intervention study was kept in a sealed envelope, and the code was broken after completion of all the laboratory and statistical analyses. The continuous measurements were analysed with linear mixed-effects (LME) models in a repeated-measures manner using a model with a random effect for the subject (subject-wise intercept term) accounting for repeated measures and a continuous baseline covariate term as well as fixed-effects terms for the treatment groups (placebo and probiotic), the time point and their interaction. Based on the residual analysis, some variables were transformed using square root, logarithmic or power transformations. The statistical significance was determined using ANOVA, and the terms in the model with P< 0·05 were considered statistically significant. The discrete-valued questionnaire data were analysed using the Wilcoxon rank sum test, so that for each subject the baseline (average of the measurements before the treatment) was subtracted from the measurements after the treatment. In this manner, the differences in the baseline levels of the subjects could be taken into account. Significance was determined as P< 0·05. The analyses were conducted using R: a language and environment for statistical computing (version 2.12.2; R Development Core Team). The linear models were computed using R package nlme: linear and nonlinear mixed-effects models (version 3.1-98; J. Pinheiro, D. Bates, S. DebRoy, D. Sarkar, and R Development Core Team). All results are expressed as mean values with their standard errors (n 19 or 20 per group).
Results
Baseline characteristics
The baseline characteristics of the volunteers are summarised in Table 1. The subjects were stratified by age and faecal Lactobacillus counts. The subjects did not differ in BMI.
Baseline characteristics of the subjects* (Mean values with their standard errors)
* Subjects were stratified according to age and faecal Lactobacillus counts at the start of the study.
Primers used for quantitative PCR
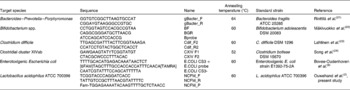
ATCC, American Type Culture Collection.
Effect of the attenuated Escherichia coli vaccine
Clinical parameters
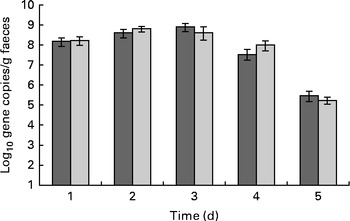
ETEC excretion was highest in both the groups on days 1–3 after the oral challenge and levels gradually declined afterwards (Fig. 2). The LME model indicated that this time effect was significant (P< 0·001).
Effect of dietary Lactobacillus acidophilus (American Type Culture Collection (ATCC) 700396) on faecal enterotoxigenic Escherichia coli (ETEC) excretion with time. Results were obtained by quantitative PCR. Values are means, with their standard errors represented by vertical bars. The subjects were orally vaccinated with 1010 colony-forming units of ETEC on day 0. ![]() , Placebo;
, Placebo; ![]() , probiotic.
, probiotic.
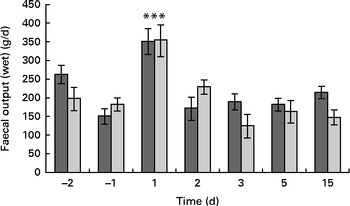
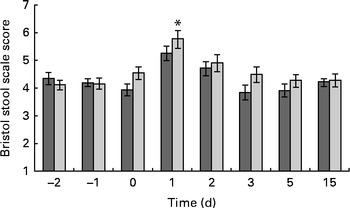
Faecal output peaked (353 (sem 173) g/d) on the 1st day after the oral challenge in both the treatment groups and returned to pre-challenge levels on the 2nd day (200 (sem 119) g/d) (Fig. 3). The LME model indicated that this change over time was significant (P< 0·001). Also, stool frequency increased significantly (LME, P< 0·001) over time, peaking on day 1 (2·4 (sem 1·2)/d). The change in faecal output coincided with a significant increase (1·3 points) in the reported Bristol stool scale scores on day 1 (P< 0·001; Fig. 4) compared with those reported the previous day. This was supported by a significant increase in relative faecal wet weight, an objective measure of stool consistency, on days 1–2 after the oral challenge (81·0 and 78·2 %, respectively, P< 0·04), compared with faecal wet weight before the oral challenge (75·4 %).
Effect of dietary Lactobacillus acidophilus (American Type Culture Collection (ATCC) 700396) on the enterotoxigenic Escherichia coli (ETEC)-induced increase in total faecal output of the subjects with time. The negative days represent the days before ETEC infection, whereas the positive days represent the days after ETEC administration. Values are means, with their standard errors represented by vertical bars. *** Mean value was significantly different from that for all the other time points, regardless of the dietary treatment (P< 0·001). ![]() , Placebo;
, Placebo; ![]() , probiotic.
, probiotic.
Bristol stool scale score. Values are means, with their standard errors represented by vertical bars. * Mean value was significantly different from that of the placebo group (P= 0·008). ![]() , Probotic group;
, Probotic group; ![]() , placebo group.
, placebo group.
Abdominal pain was reported by 15 % of the subjects before the oral challenge and by 69 % on the 1st day after the oral challenge. On day 2 after the oral challenge, it was still reported by 51 % of the volunteers. Bloating was reported by 26 % of the subjects before the oral challenge and by 74 % 1 d after and 67 % 2 d after the oral challenge. Fever was reported by 10 % of the volunteers before the oral challenge and by 38 % 1 d after the oral challenge. Flatulence was reported by 64 % of the volunteers before the oral challenge and by 87 % on the first 2 d after the oral challenge. Headache was reported by 15 % of the subjects before and by 54 % 1 d after the oral challenge. Nausea increased from 13 to 56 % on the 1st day after the ETEC challenge. Stomach ache increased from 13 to 67 % on the 1st day after the oral challenge and was still 62 % 2 d after the oral challenge. All these challenge-induced changes were significantly different over time (P< 0·001), and all peaked on days 1 and 2 after the oral challenge. Also, vomiting peaked (P= 0·01) on day 1 and was reported by six volunteers of the thirty-nine who participated, compared with one to three subjects who reported vomiting on pre-oral challenge days and from day 3 after the oral challenge.
Immune parameters
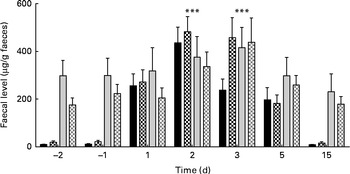
The concentrations of faecal calprotectin and total IgA were observed to change over time, peaking on days 2 and 3, respectively (for both, LME, P< 0·001; Fig. 5). Thereafter, in both the groups, the concentrations decreased and returned to pre-oral challenge levels on day 15 after the oral challenge.
Faecal levels of calprotectin (■) and total IgA (![]() ) in the placebo (■,
) in the placebo (■, ![]() ) v. probiotic (
) v. probiotic (![]() ,
, ![]() ) group before (negative days) and after (positive days) enterotoxigenic Escherichia coli infection. Values are means, with their standard errors represented by vertical bars. *** Both calprotectin and IgA levels changed due to ETEC challenge, with a significant (P< 0·001) peak at day 2 and 3, respectively.
) group before (negative days) and after (positive days) enterotoxigenic Escherichia coli infection. Values are means, with their standard errors represented by vertical bars. *** Both calprotectin and IgA levels changed due to ETEC challenge, with a significant (P< 0·001) peak at day 2 and 3, respectively.
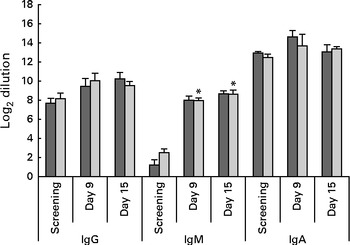
The concentrations of serum CFA II-specific IgA and IgG did not show significant changes over time. The concentration of serum CFA II-specific IgM, however, significantly (LME, P= 0·008) increased from baseline to days 9 and 15 after the oral challenge (Fig. 6).
Serum levels of antibodies specific to colonisation factor antigen II (CFAII) of enterotoxigenic Escherichia coli. Values are means, with their standard errors represented by vertical bars. * Mean value was significantly different from that for screening (P= 0·008). ![]() , Placebo;
, Placebo; ![]() , probiotic.
, probiotic.
Microbiota parameters
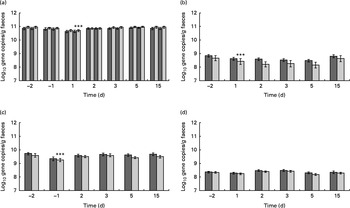
Due to the oral ETEC challenge, the counts of Bacteroides–Prevotella (LME, P< 0·001), Bifidobacterium (P< 0·001), Clostridium cluster XIVab (P< 0·001) and total faecal bacteria (P< 0·001) decreased (Fig. 7). C. difficile was detected in the faecal sample of only one subject, with a mean level of 7·7 log cells/g faeces throughout the study period.
Quantification of the faecal (a) total bacterial load as well as (b) Bifidobacterium, (c) Bacteroides–Prevotella–Porphyromonas group and (d) Clostridium cluster XIVab. Values are means, with their standard errors represented by vertical bars. *** Mean value was significantly different from that for day − 2 (P< 0·0001). ![]() , Placebo;
, Placebo; ![]() , probiotic.
, probiotic.
Effect of probiotic treatment
Clinical parameters
There was no significant difference in faecal ETEC excretion between the dietary treatment groups, either on a daily basis (ETEC/d) or on a faecal weight basis (ETEC/g faeces; Fig. 2). Neither faecal output nor stool frequency was observed to be different between the treatment groups (Fig. 3). Overall, probiotic treatment tended to increase the Bristol stool scale scores. More specifically, the ETEC-induced increase in Bristol stool scale scores (scores on days 0–4 after the oral challenge minus those before the oral challenge) was significantly (Wilcoxon, P< 0·001) higher in the probiotic group (+0·95 Bristol scale points) than in the placebo group (+0·38 Bristol scale points; Fig. 4). Subjects in the probiotic group reported fever (Wilcoxon, P= 0·012; mean 0·165 v. 0·05 cases/subject), headache (Wilcoxon, P= 0·018; mean 0·15 v. 0·03 cases/subject) and nausea (Wilcoxon, P= 0·008; 0·20 v. 0·07 cases/subject) more frequently after the oral ETEC challenge compared with subjects in the placebo group (comparing reports on days 0–4 after the oral challenge minus pre-oral challenge reports). The other determined gastrointestinal symptoms, bloating, flatulence, abdominal pain, stomach ache, vomiting and stool frequency, were not different between the probiotic and placebo groups before or after the oral challenge.
Immune parameters
The concentrations of faecal calprotectin were slightly higher in the probiotic group than in the placebo group, but did not reach statistical significance. The mean concentrations of calprotectin before the oral ETEC challenge were 20 and 10 μg/g in the probiotic and placebo groups, respectively. On day 2 after the oral challenge, the mean concentrations peaked to 404 and 310 μg/g in these groups. Thereafter, the concentrations declined in both the groups and were similar to the pre-oral challenge levels on day 15 (Fig. 5). At most time points measured, the concentrations of total faecal IgA tended to be higher in the placebo group than in the probiotic group (Fig. 5), but treatment differences were never significant. In addition, the concentrations of serum CFA II-specific IgA, IgG and IgM were not different between the two treatment groups (Fig. 6).
Microbiota parameters
The total bacterial count was stable throughout the study period, only a slight non-significant decrease could be detected in the probiotic and placebo groups on day 1 after the oral challenge (Fig. 7). In the probiotic group, L. acidophilus (ATCC 700396 or any closely related strain) was present at detectable levels in seventeen of the twenty volunteers at the end of the run-in phase and just before the oral ETEC challenge (day − 2). Mean faecal level was log 7·0 cells/g for the whole group of volunteers. Following the E. coli challenge (days 1–15), L. acidophilus ATCC 700396 (or genetically related strains) was detected in the faecal samples of eighteen volunteers with a mean level of log 6·7 cells/g throughout that period. In the probiotic group, one subject had undetectable L. acidophilus (ATCC 700396) levels at all the time points measured. On the other hand, four subjects in the placebo group had a single positive faecal sample during the study (one subject on day 2 and the others on day 5 after the oral ETEC challenge). These unexpected positive responders had a mean faecal level of L. acidophilus of log 7·5 (sem 1·2) cells/g. All other subjects in the placebo group had undetectable L. acidophilus (ATCC 700396) levels. Therefore, faecal L. acidophilus (ATCC 700396) levels were significantly (LME, P< 0·001) different between the two treatment groups. C. difficile could only be detected in the faecal sample of one subject in the placebo group at a concentration of log 6·70 cells/g at the start of the intervention. After the ETEC challenge, the level increased to log 8·35 cells/g. Other faecal bacterial groups belonging to Bifidobacterium, Clostridium and Bacteroides were present at similar levels in the two treatment groups (Fig. 7).
Discussion
Food-borne infections are among the most common infections experienced by the general population, in particular, by travellers to (sub)tropical areas. Selected probiotics have been observed to positively influence the recovery from such infections( Reference McFarland 14 ). The aim of the present study was to investigate whether L. acidophilus ATCC 700396 would be able to reduce infection symptoms associated with an oral ETEC challenge as a model for a common human food-borne infection.
The ETEC challenge model has been successfully used to study the effects of dietary Ca on ETEC diarrhoea in healthy adults( Reference Bovee-Oudenhoven, Lettink-Wissink and Van Doesburg 9 ). In the present study also, the model transiently induced the symptoms of a food-borne infection. Stool frequency increased on the 1st day after the oral challenge and faecal output increased concomitantly. Also, faecal wet weight increased and faecal consistency softened. These changes were accompanied by increases in reports of the various intestinal complaints inquired. ETEC could be detected in the faecal samples of the volunteers throughout the 5 d after the oral challenge that were assessed. Therefore, it can be concluded that the oral ETEC challenge functioned as a successful model for a human food-borne infection.
The concentrations of faecal calprotectin and total IgA peaked 2 and 3 d after the challenge, respectively. This is in agreement with the generally observed kinetics of infection-induced intestinal inflammation. Pathogen colonisation or damage to the gut epithelium causes leucocyte influx in the intestinal mucosa. Migrated neutrophilic granulocytes and macrophages are filled up with calprotectin and release the protein into the intestinal lumen( Reference Gisbert, McNicholl and Gomollon 15 ). Calprotectin is very resistant to digestion and bacterial degradation and as such a valuable marker for quantifying intestinal inflammation( Reference Xiang, Ouyang and Li 16 ). Also, the observed increase in the concentration of total faecal IgA is in line with the stimulation of the mucosal immune system in intestinal infectious diseases. While the concentrations of serum IgA and IgG have been reported to remain unchanged, the mucosal (faecal) levels have been shown to increase( Reference Izcue, Coombes and Powrie 17 ). A detectable CFA II-specific serum antibody response was induced only for IgM from day 9 onwards. This is in line with a normal serum immune response where IgM is the first Ig to increase in concentration, generally already within 1–2 weeks. IgG provides immune memory, but its concentration increases only after several weeks. The present study did not determine specific immune responses beyond 15 d of the oral challenge.
The challenge and most probably subsequent gastroenteritis and increased stool passage caused a disturbance of the intestinal microbiota. The reduced total numbers of bacteria/g faeces can be explained by the looser character (increased water content) of the faeces. The faecal levels of Bacteroides–Prevotella, Bifidobacterium and Clostridium cluster XIVab were reduced. It can be hypothesised that the oral challenge and subsequent gastroenteritis may favour the overgrowth of autochthonous opportunistic pathogens such as C. difficile. This pathogen was detectable in the faecal sample of just a single subject in which C. difficile levels tended to increase after the oral challenge. However, not many subjects became C. difficile positive. Much work has been done on the effect of probiotics on different types of diarrhoea, e.g. ETEC-caused diarrhoea. However, little has been published on changes in the microbiota during ETEC-caused diarrhoea and probiotic treatment.
Consumption of 109 CFU/d of L. acidophilus ATCC 700396 during the run-in period of 2 weeks led to a detectable excretion of the strain in the faeces of the volunteers. Although the primers used to detect L. acidophilus ATCC 700396 also detect other closely related strains( Reference Lahtinen, Forssten and Aakko 12 ), the specificity was sufficient to distinguish the strain from endogenous L. acidophilus strains, as in the placebo group only five samples obtained from four subjects were found to be positive. The detection of L. acidophilus ATCC 700396 in some subjects in the placebo group at only single time points makes it likely that these volunteers had consumed another probiotic product and that it is not due to the presence of closely related endogenous L. acidophilus strains. Despite the detection of high faecal levels of L. acidophilus ATCC 700396 in the probiotic group, no substantial protection against the infection symptoms of the oral ETEC challenge was provided. In fact, some of the clinical parameters, fever, headache and nausea, were reported more often by the probiotic group than by the placebo group. The probiotic group also reported looser stools. Although the changes were statistically significant, they were small, with substantial variation within the groups. The increase in symptoms in the probiotic group was unexpected, as such effects have not been observed before( Reference Ringel-Kulka, Palsson and Maier 18 ), and this increase seems to be related only to ETEC exposure, as there was no difference between the groups before the exposure. These findings indicate the importance of assessing adverse events during human intervention trials. The clinical differences between the two treatment groups were accompanied by a higher (although not significant) faecal level of ETEC; the mechanism by which L. acidophilus ATCC 700396 might have caused this increase is not known. It is commonly assumed that improved competitive exclusion is one of the mechanisms by which probiotics exert their protective effects on enteric pathogens( Reference Corr, Hill and Gahan 19 ). The present study indicates that the tested L. acidophilus strain does not appear to improve competitive exclusion against ETEC. ETEC is a cause of food poisoning and, in particular, a common cause of travellers' diarrhoea. Recent meta-analyses have also indicated that probiotics are not particularly effective against travellers' diarrhoea, and although travellers' diarrhoea can be caused by a variety of pathogens, the observations of the present study are in line with these observations( Reference McFarland 14 , Reference Ritchie and Romanuk 20 ). In an oral challenge study with Vibrio cholerae, L. acidophilus ATCC 700396 has been shown to enhance the production of specific serum IgA and IgM( Reference Paineau, Carcano and Leyer 7 ). In the present study, no difference in the concentrations of specific serum antibodies was observed between the probiotic and placebo groups after ETEC vaccination. A potential reason for this difference may be the used dose, 1010 CFU/d in the present study and 109 CFU/d in the previous study, although a difference in response to the different vaccines cannot be excluded.
In conclusion, application of the live, but attenuated, oral ETEC vaccine provides a useful model for human food poisoning, as it exhibits the expected and quantifiable infection symptoms. However, supplementation of L. acidophilus ATCC 700396 is not effective to reduce ETEC challenge symptoms in otherwise healthy men.
Acknowledgements
The authors thank Jaana Larsson-Leskelä and Henri Ahokoski of Danisco Sweeteners for their excellent technical assistance. They also thank Carolien Vink, Elly Lucas and Roeli Holleman of NIZO Food Research for their support in study logistics, faecal sample processing and some laboratory analyses.
The present study was funded by DuPont Nutrition & Health (Kantvik, Finland). The sponsor was involved in the design of the study, analysis of samples and writing of the manuscript.
The authors' contributions are as follows: S. J. M. t. B., A. C. O. and I. M. J. B.-O. designed the study; S. J. M. t. B., A. J. S. and I. M. J. B.-O. conducted the study and interpreted the data; E. A. performed the statistical analysis; S. D. F. performed the microbiota analyses; A. C. O., S. J. M. t. B., S. D. F. and I. M. J. B.-O. drafted the manuscript. All authors contributed to the preparation of the paper and agreed with the submitted manuscript content.
A. C. O. and S. D. F. are employees of DuPont Nutrition & Health (Kantvik, Finland). DuPont produces and markets L. acidophilus (ATCC 700396). The remaining authors declare no conflicts of interest.


