

Introduction
The initial peopling of the Americas has been one of the most intriguing questions debated by archaeologists, palaeoanthropologists, geneticists and geologists in recent years (e.g. Waters & Stafford Reference Waters, Stafford, Graf, Ketron and Waters2014; Llamas et al. Reference Llamas2017; Meltzer Reference Meltzer2021; Willerslev & Meltzer Reference Willerslev and Meltzer2021). Although new discoveries have provided additional data and advanced the debate, important questions remain unresolved regarding the provenance, date of arrival and spread of these first people. Our current, most acceptable, understanding is that humans first arrived approximately 20 000–18 000 years ago, with genetic, archaeological and skeletal evidence indicating that the first migrants arrived from Asia. Discussion continues, however, concerning the routes of entry and dispersal—whether along the coast or through the interior (cf. Potter et al. Reference Potter2018; Braje et al. Reference Braje2020; Scott et al. Reference Scott2021). Debates regarding this process centre on the chronology, validity of human-made artefacts and the contextual integrity of several key sites that radiocarbon date before the ‘Clovis First’ theory. This model envisages entry no earlier than c. 13 000 cal BP, associated with the rapid spread of people primarily engaged in big-game hunting (e.g. Haynes Reference Haynes2002). Although several pre-13 000 cal BP sites have challenged and replaced this theory over the past 30 years, their chronology is still debated. Some of the better-known sites in this group are Blue Fish Caves in north-western Canada, Paisley Cave in Oregon, Cooper's Ferry in Idaho, Meadowcroft Shelter in Pennsylvania, the Gault and Friedkin sites in Texas, Page-Ladson in Florida, Arroyo Seco in Argentina, Huaca Prieta in Peru and the Monte Verde complex in Patagonia (Meltzer Reference Meltzer2021). The Pilauco site, located 100km north of Monte Verde, has recently been added to this list (Pérez et al. Reference Pérez, Navarro-Harris, Boëda and Pino2022).
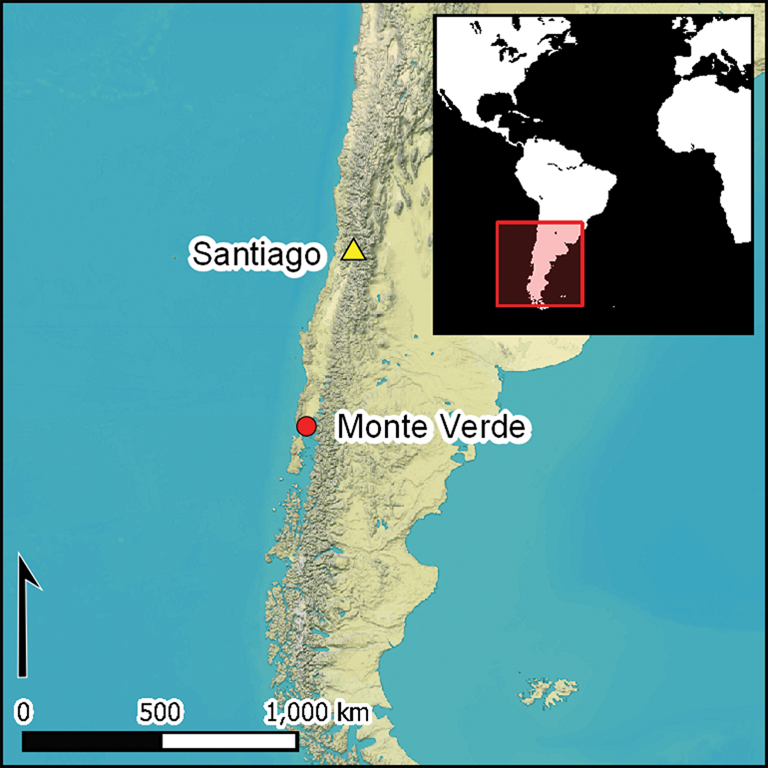
The Monte Verde complex—specifically Monte Verde II—is located in south-central Chile and has been radiocarbon dated to at least c. 14 500 cal BP; it has long been an emblematic site due to its archaeological importance for the peopling of the Americas (Dillehay passim). The site lies between the Coastal and Andean Mountain ranges, in the cool, temperate Valdivian rainforest of the Lake Region of Chilean north-western Patagonia (Figure 1). During the late 1970s and early 1980s, and more recently in the 2000s, an interdisciplinary research team has studied the cultural remains excavated from four areas in the Monte Verde complex: Monte Verde-I (MV-I), Monte Verde-II (MV-II), Chinchihuapi-I (CH-I) and Chinchihuapi-II (CH-II).
Location of Monte Verde II (figure by M. Pino).

The focus of this article is MV-II, a c. 14 500-year-old open-air campsite buried in the sandy terrace to the north of Chinchihuapi Creek. A peat bog developed in the narrow creek basin and on the nearby terraces immediately after the site was abandoned, sealing and preserving it under a layer of anaerobic peat. A detailed radiocarbon analysis of this peat layer (i.e. the same context sealing, but immediately adjacent to, MV-II and containing no cultural material) has not previously been attempted. Here, we present 43 new radiocarbon determinations obtained from a section located approximately 50m north of MV-II, in the same stratigraphic position, and correlate the results to the site's cultural and chronological sequence.
Although the new assays essentially duplicate the now generally accepted chronology for MV-II, we publish them for several reasons. First, given the ongoing debate over the chronology of the arrival of humans in the Americas, more precise dating of key sites such as Monte Verde is relevant for establishing closer, inter-site temporal and cultural relationships. Second, some radiocarbon specialists (see discussion below) have queried the 14 500 cal BP date for the site; we believe that the new dates, obtained from deposits stratigraphically congruent with the MV-II occupation site but acquired independently from cores adjacent to it, help to resolve this issue. Finally, this article brings to a conclusion the dating project that the late Erwin Taylor initiated and completed but had not published before his death.
Querying Monte Verde II
Since MV-II was first reported in the late 1970s, some scholars have questioned its chronology and the validity of its evidence for human occupation, including recent claims that the cultural artefacts and features are unprovenanced (Fiedel Reference Fiedel2022)—despite their precise provenance from within a thin, intact habitation layer documented in detail in numerous publications (e.g. Dillehay & Collins Reference Dillehay and Collins1988; Dillehay Reference Dillehay1989, Reference Dillehay1997, Reference Dillehay2022)—and that the chronology of the site is slightly younger than the original reported dates of c. 14 500 cal BP (see Taylor et al. Reference Taylor, Haynes, Kirner and Southon1999; Erlandson et al. Reference Erlandson, Braje and Graham2008; Politis & Prates Reference Politis, Prates, Harvati, Jäger and Reyes-Centeno2018).
Taylor's initial questioning of the site's chronology was prompted by the presence of two fragments of a single culturally modified bone of an elephant-like gomphothere (family Gomphotheriidae, order Proboscidea), which was referred to in the first reports as from a mastodon (Dillehay & Pino Reference Pino and Dillehay1989, Reference Dillehay, Pino and Dillehay1997). Even though the two fragments were from a single bone, they yielded two widely divergent radiocarbon values assayed by two different laboratories (Dillehay & Pino Reference Dillehay, Pino and Dillehay1997: 43–44, tab. 1). One yielded a date of 6550±100 BP, while the second was dated to 11 990±200 BP (BETA-7824 and TX-3760, 7420 and 13 860 cal BP, respectively).
To resolve this discrepancy, Taylor requested fragments of the same dated gomphothere bone from one of the present authors (TD) to obtain nitrogen values and to measure the >30kD gelatin yields. His assessment concluded that sufficient intact collagen remained in both bones for reliable radiocarbon dating. Taylor's subsequent redating of the two fragments employed two different chemical pre-treatment modalities: total amino acids and >30kD gelatin ultrafiltration. The mean age and the error for the first and second method were 12 453±57 BP and 12 480±85 BP, respectively (the error for the two replicates is equal to the square root of the sum of the squared individual). The analysis resulted in a set of two statistically indistinguishable radiocarbon values at 94.5% probability, which give a mean calibrated age of 14 585 BP. The cause of the anomalous radiocarbon values previously obtained by one laboratory on one of the bone fragments is unknown, although it is presumed that this laboratory's pre-treatment protocol, or its execution, failed to remove sufficient exogenous organic contaminants from the sample (see George et al. Reference George, Southon and Taylor2005: tab. 1).
Taylor and colleagues also analysed organic material from Monte Verde and determined that there was no local marine reservoir effect offsetting the radiocarbon dates (Taylor et al. Reference Taylor, Haynes, Kirner and Southon1999). In 2012, Taylor approached Ricardo De Pol-Holz, a Chilean oceanographer, and one of the present authors (MP) (Monte Verde project geologist), to obtain a sediment core of the non-cultural sequence of layers adjacent to MV-II for AMS dating and sediment analysis, as part of a new research proposal. Taylor proposed to AMS date samples at 10–20mm intervals in a core approximately 1m-deep from top to bottom, in order to determine whether the 14 500 cal BP age of the site was skewed by fallout from volcanic activity in the Early Holocene and/or by a marine reservoir offset in the area. Taylor believed the true age of MV-II should correspond to the 13 000-year-old (or later) Clovis or Folsom period (Taylor Reference Taylor2017).
The proposal was agreed, the conditions being that: 1) two separate cores would be studied and dated, one by Taylor and the other by Pino; and 2) two independent laboratories would undertake dating of samples from the two different but stratigraphically identical cores.
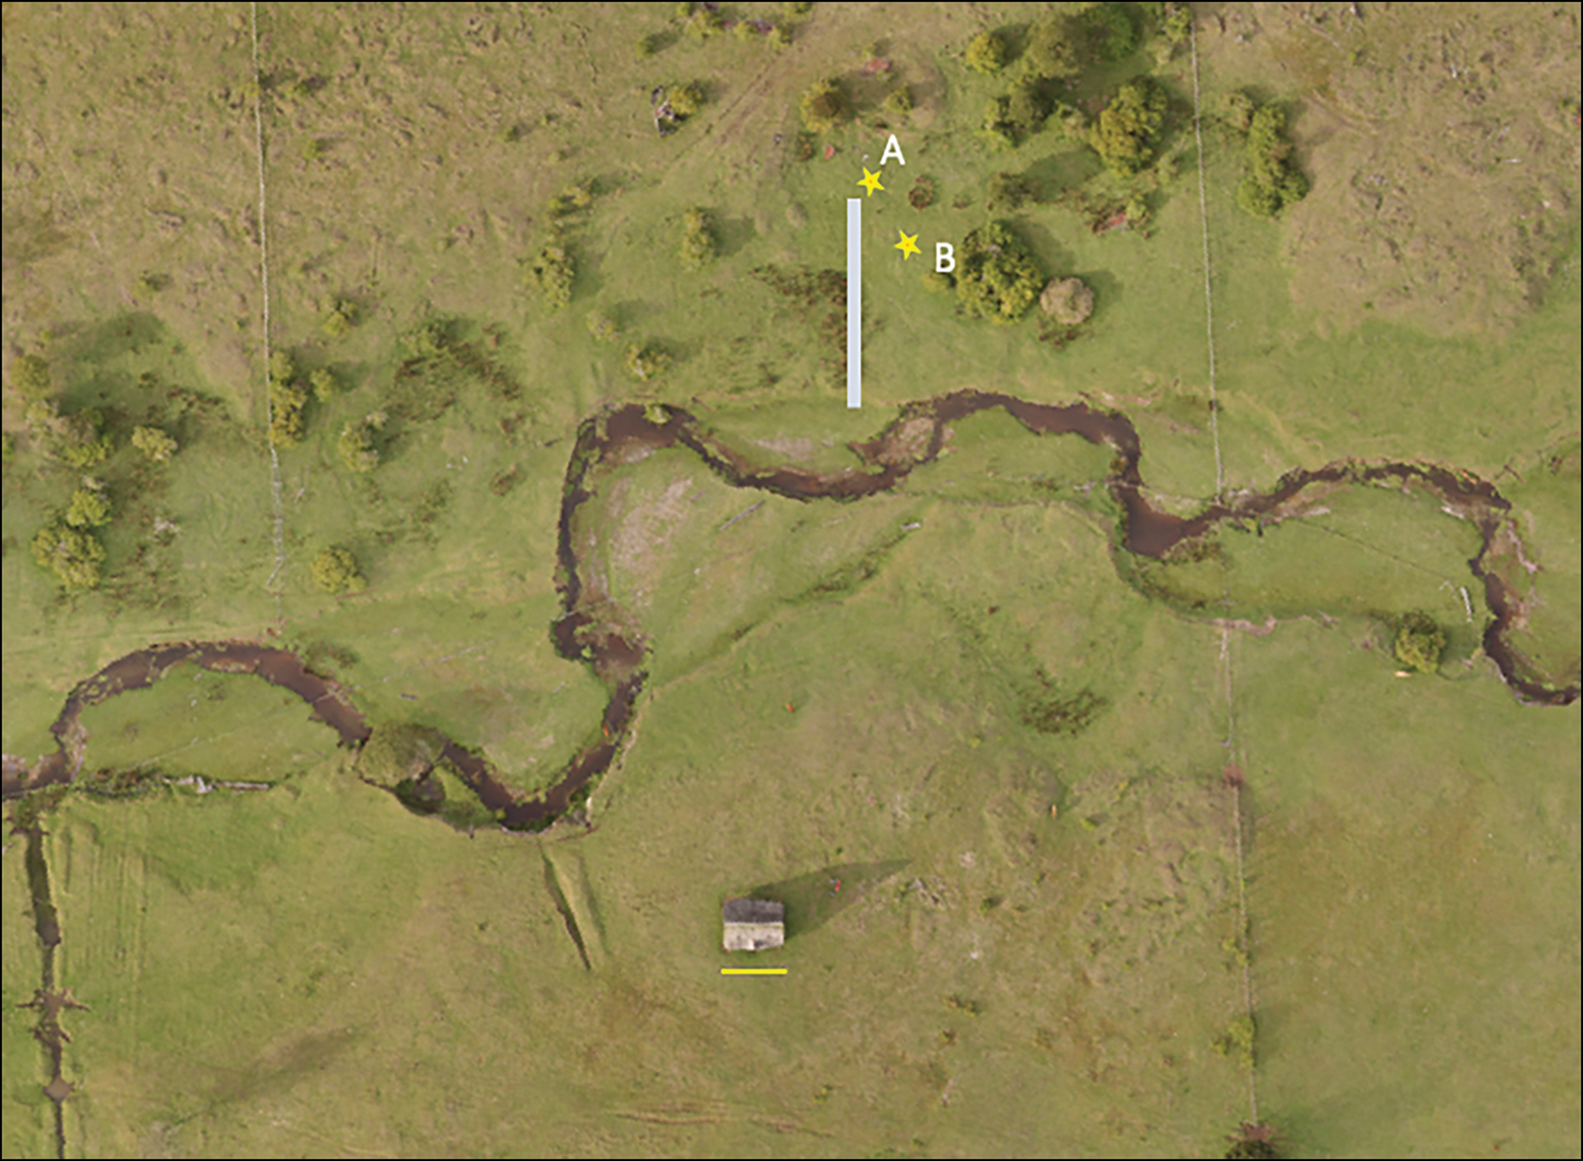
In 2012, Pino and De Pol-Holz, with personnel from the Chilean Instituto de Ciencias de la Tierra, extracted the cores at MV-II in a non-cultural area, approximately 40m north of MV-II, where Pino (Reference Pino and Dillehay1989) had previously recorded the presence of a shallow, boggy marsh. Using a 1m-long modified Livingston coring device, the team sought deposits with thicknesses suitable for analyses of sediments, pollen, charcoal and radiocarbon chronology (Figure 2). A 0.945m-deep section of peat deposits overlying a moderately hard sandy substrate (stratum MV-7; see discussion below) was identified and two identical cores extracted. Taylor processed 39 stratigraphically sequential 10mm-thick samples from one core, and Pino analysed four radiocarbon and 20 sediment samples from the other (MV-86b) (see the online supplementary material (OSM)). In 2017, Taylor sent a manuscript of the dated samples to Pino, but it was never published (see Taylor Reference Taylor2017). Taylor passed away in May 2019. Here, we present the results of both Taylor's 39 assays and Pino's four dates from the two cores.
A) Location of the core analysed by Taylor; B) position of the Pino core (MV-86b). The pale grey line (65m long) represents the position of a previously studied stratigraphic section to the north of Chinchihuapi Creek (between sections CS and 31; Pino Reference Pino and Dillehay1989). The lower half of this line is located in the MV-II site, situated approximately 40m from the two cores. The yellow scale line in front of the house measures 12m (figure by M. Pino).
The archaeology of Monte Verde II
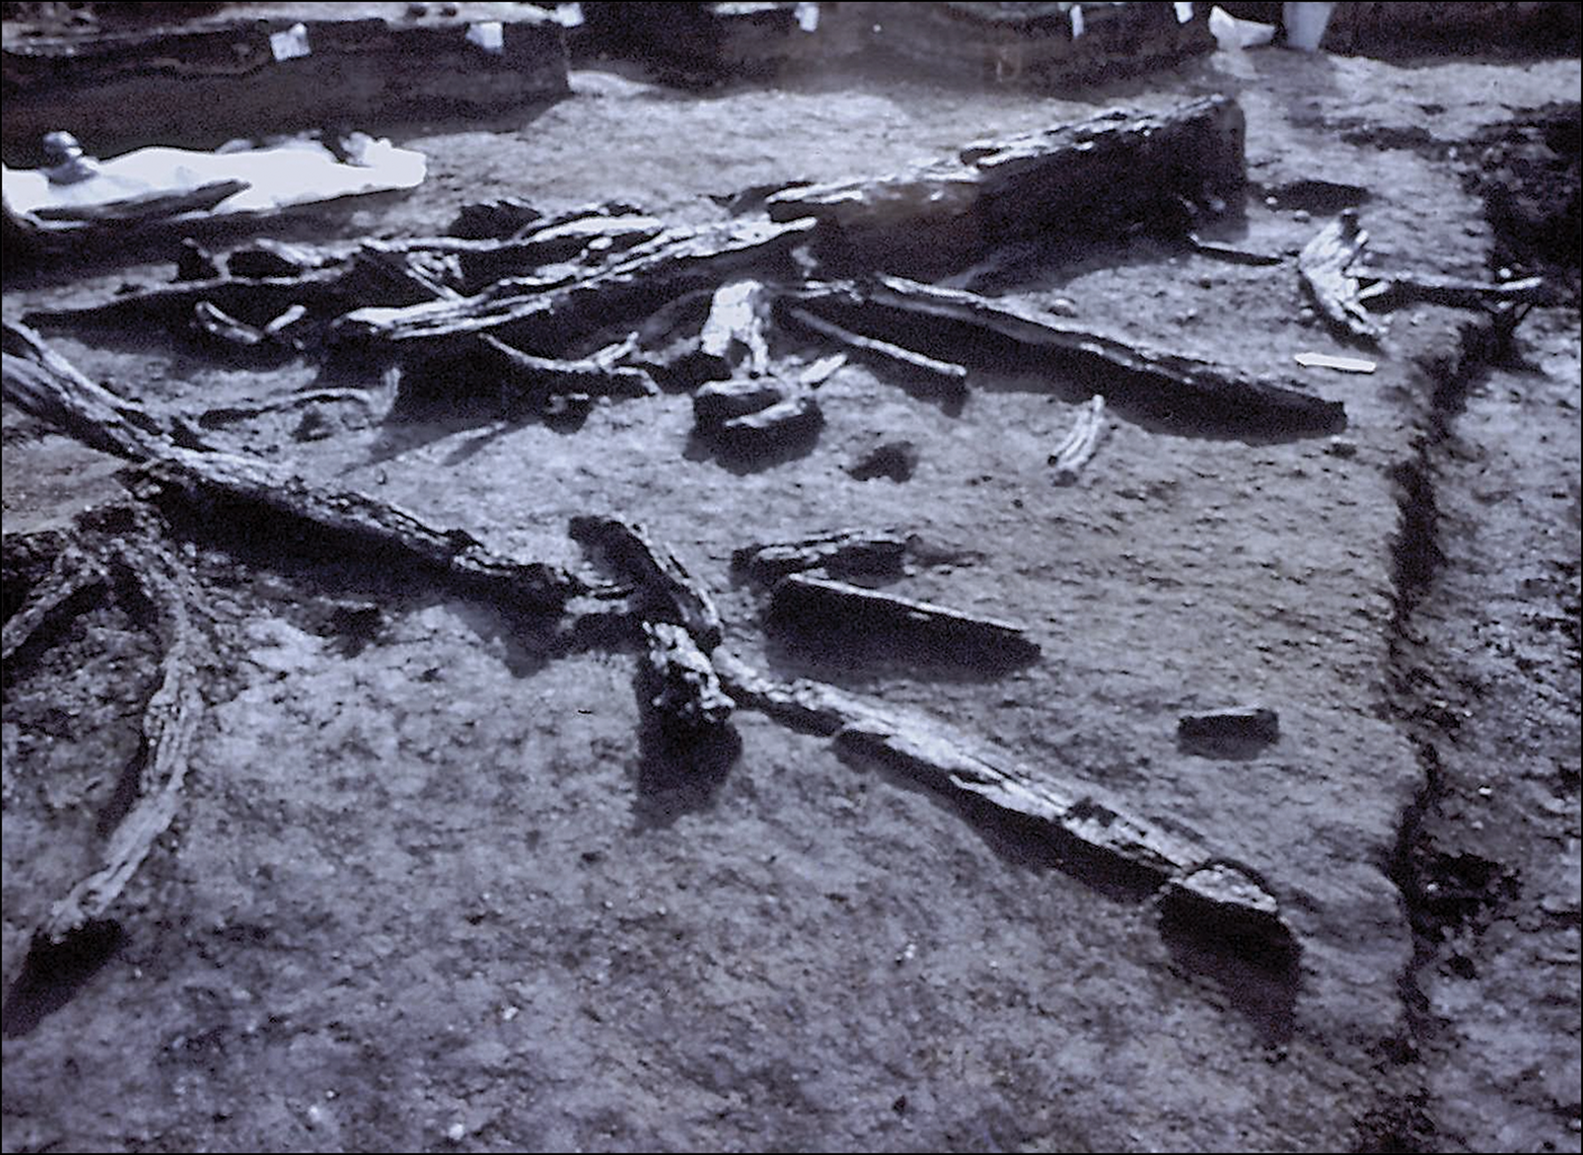
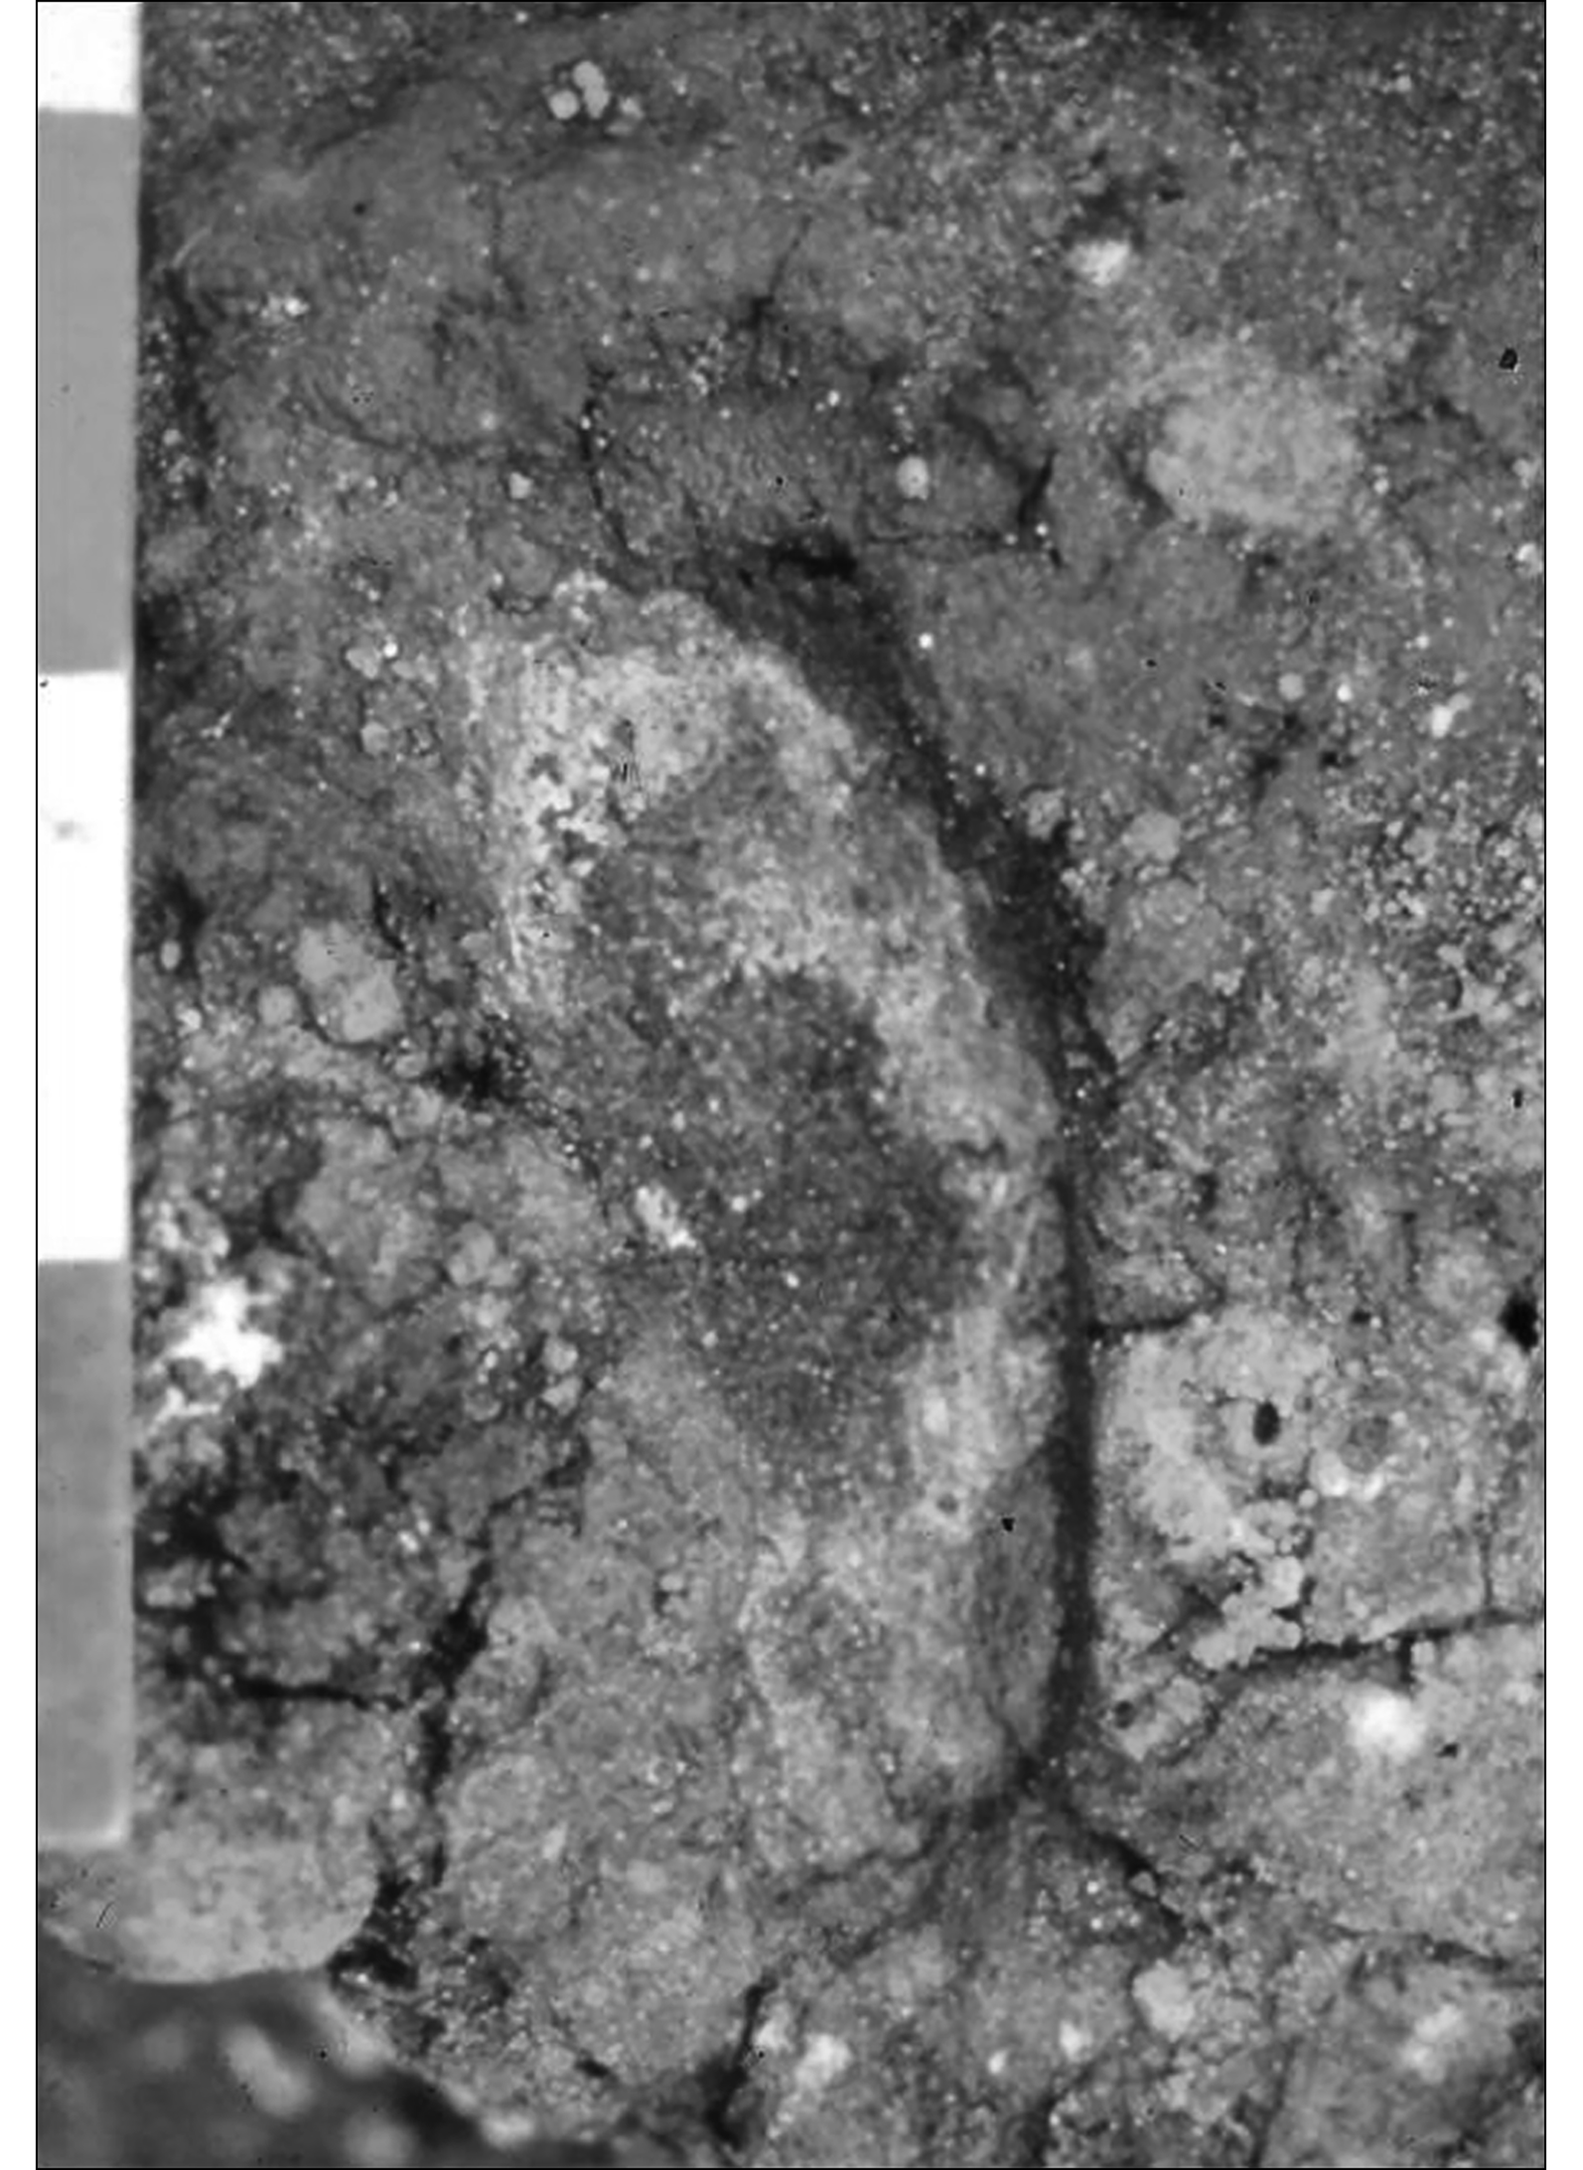
MV-II is a well-preserved, single occupation site, with a wide variety of organic and inorganic archaeological remains. Excavation of Area D at MV-II revealed the remains of a well-preserved, approximately 18m-long, internally segmented tent-like structure, with a partially preserved wooden frame made of culturally modified tree trunks and branches (Dillehay Reference Dillehay1989, Reference Dillehay1997) (Figure 3). Several pieces of cordage made of reed (Juncus sp.) and wrapped around posts and stakes were found among the remains. The tent's thin use-floor (20–30mm thick) had hundreds of microscopic flecks of hide tissue embedded in it, suggesting that it was covered with animal skins. The floor also had brazier pits lined with clay and containing food remains, ash and charcoal, and other debris. These pits were surrounded by stone tools and the remains of more than 72 different species of edible seaweeds, tubers, seeds, nuts, berries and other plants. Outside the tent were large communal hearths, small piles of firewood, wooden mortars with grinding stones, and human footprints near one of the hearths (Figure 4).
Part of the collapsed wooden frame and foundation timbers of a section of the long, internally segmented tent-like structure at MV-II. The internal segments are defined by tree branches staked and tied in place. Note the darkened floor of the structure, which contains moderately high quantities of ash, charcoal, plant and animal remains, and other debris (photograph by T. Dillehay).
One of three human footprints on the cultural use-floor of MV-II. Note the clear impression of the toes and heel. Scale in 100mm increments (photograph by T. Dillehay).
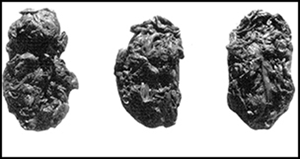
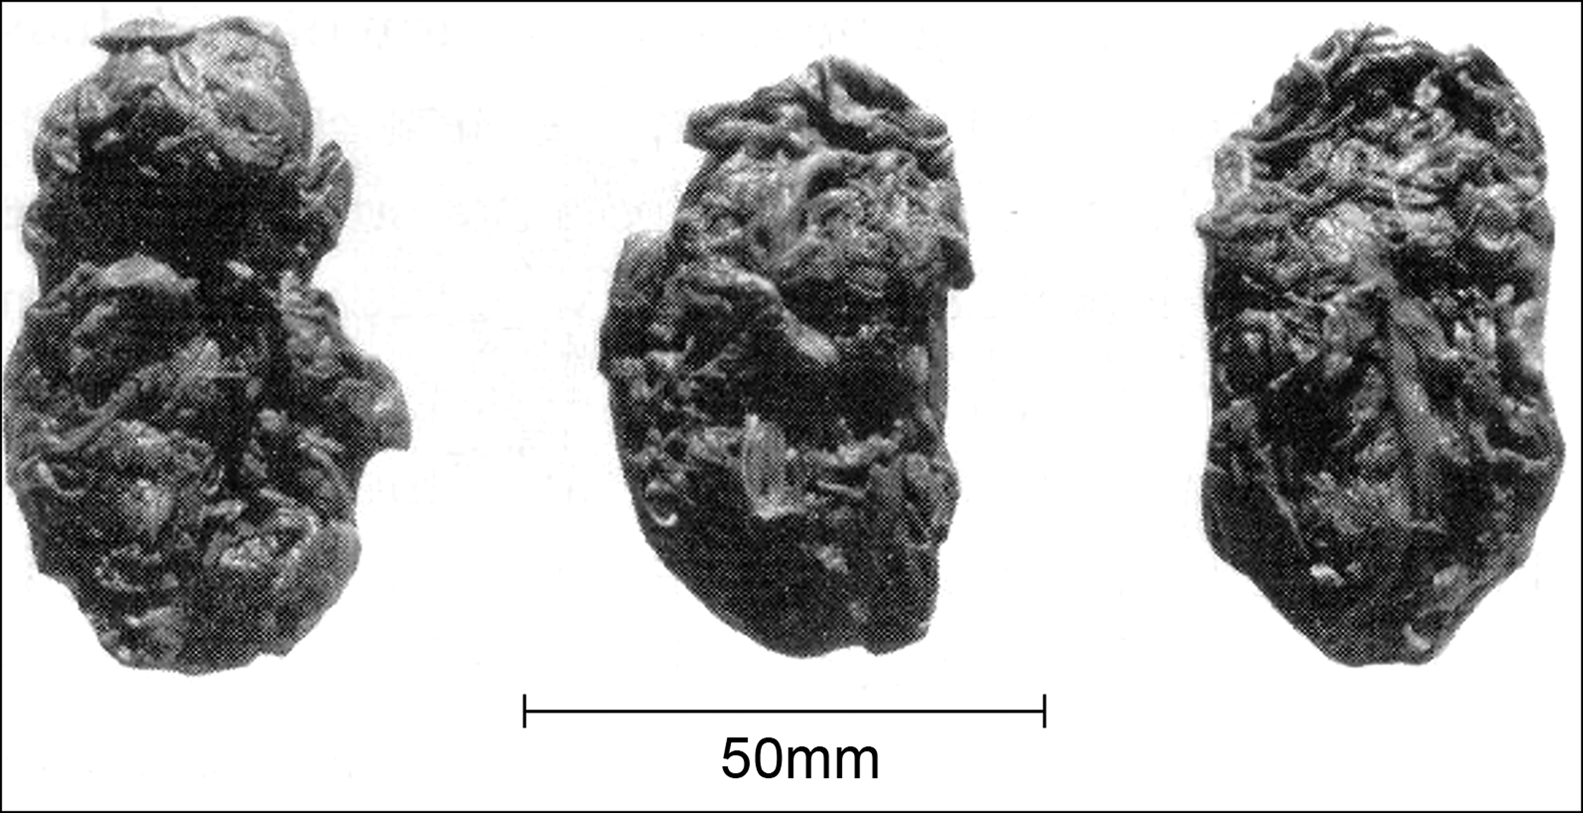
A second structure—wishbone-shaped in plan and made of wooden uprights set into a foundation of hardened sand and gravel—was excavated in Area D, approximately 30m west of the tent-like frame. Parts of the carcasses of seven gomphotheres and one palaeo-llama yielded bones and preserved pieces of meat, representing evidence of butchering and hide preparation. Stone and wooden tools were manufactured immediately outside the structure. Several masticated cuds were recovered from the floor of the structure, which contained three to four varieties of non-local seaweed and terrestrial plants (Dillehay et al. Reference Dillehay2008) (Figure 5) that today are used as medicinal plants by Indigenous Huilliche and Mapuche people in the region. The presence of exotic foods and medicinal elements, and non-local stones for tools reveals that distant Andean mountainous and Pacific coastal habitats provided important resources for the MV-II economy.
Three masticated cuds from MV-II, containing three to four varieties of marine seaweeds and boldo, a terrestrial plant, known ethnographically for their medicinal purposes. Note probable tooth impressions (photograph by T. Dillehay).
Deeper deposits in a separate area of the Monte Verde complex, MV-I, have yielded evidence of a possible earlier occupation in the form of 59 stones, several of which are valid human-made tools, and burnt features and bone fragments. Radiocarbon dating places a possible occupation between c. 15 000 and 18 500 cal BP (at 95.4% probability) and possibly even older. Although insufficient archaeological and geological data have been recovered from MV-I to be more conclusive, it remains a possible human-associated site (Dillehay et al. Reference Dillehay2015).
Several radiocarbon dates were obtained from the CH-I and CH-II sites, located approximately 450 and 600m upstream from MV-I, respectively. Excavations at these localities have yielded several unifacial flakes, modified lithic spheroids probably used as slingstones, fragments of burnt and modified wood, and animal bone (Dillehay et al. Reference Dillehay2015). Radiocarbon dates place a secure occupation of CH-I at c. 14 400–14 500 cal BP (at 95.4% probability), with a possible earlier occupation at c. 16 000–18 000 cal BP (at 95.4% probability). Further investigations of the pre-14 500 cal BP levels of this site are, however, required to confirm a human presence (Dillehay et al. Reference Dillehay2015).
The geology of Monte Verde II
Two stratigraphic formations across the Monte Verde complex were described and interpreted by Pino (Reference Pino and Dillehay1989). The Salto Chico Formation (SCH) corresponds to a sandur (outwash) plain deposited during the last glaciation by meltwater from glaciers located 8km to the south-east. The upper part of the SCH Formation (SCH-4)—the only one that outcrops at Monte Verde—was deposited between c. 45 000 and 19 000 cal BP (at 95.4% probability), calculated from local lithostratigraphic correlations and radiocarbon dates (Dillehay et al. Reference Dillehay2015). It is equivalent to layers MV-7 (the upper 20–30mm of which correspond to the buried MV-II occupational surface) and MV-8 at MV-II (Figure 6). The upper part of SCH-4 outcrops in the creek terraces to the north and south of MV-II and is covered by soils, but it is also the base over which the Monte Verde Formation (MVF) was deposited. The MVF was formed c. 15 000 cal BP in a small valley carved into the upper SCH-4, which resulted in an erosional unconformity (non-depositional surface) between the two formations.
Stratigraphy of the north–south trench (T-3; Pino Reference Pino and Dillehay1989). Section A corresponds to the locus typicus of the Monte Verde Formation (MVF); Section B is near both the Pino (MV-86b) and Taylor cores. The red line indicates the buried MV-II occupational surface. Redrawn after Pino (Reference Pino and Dillehay1989) (figure by M. Pino).
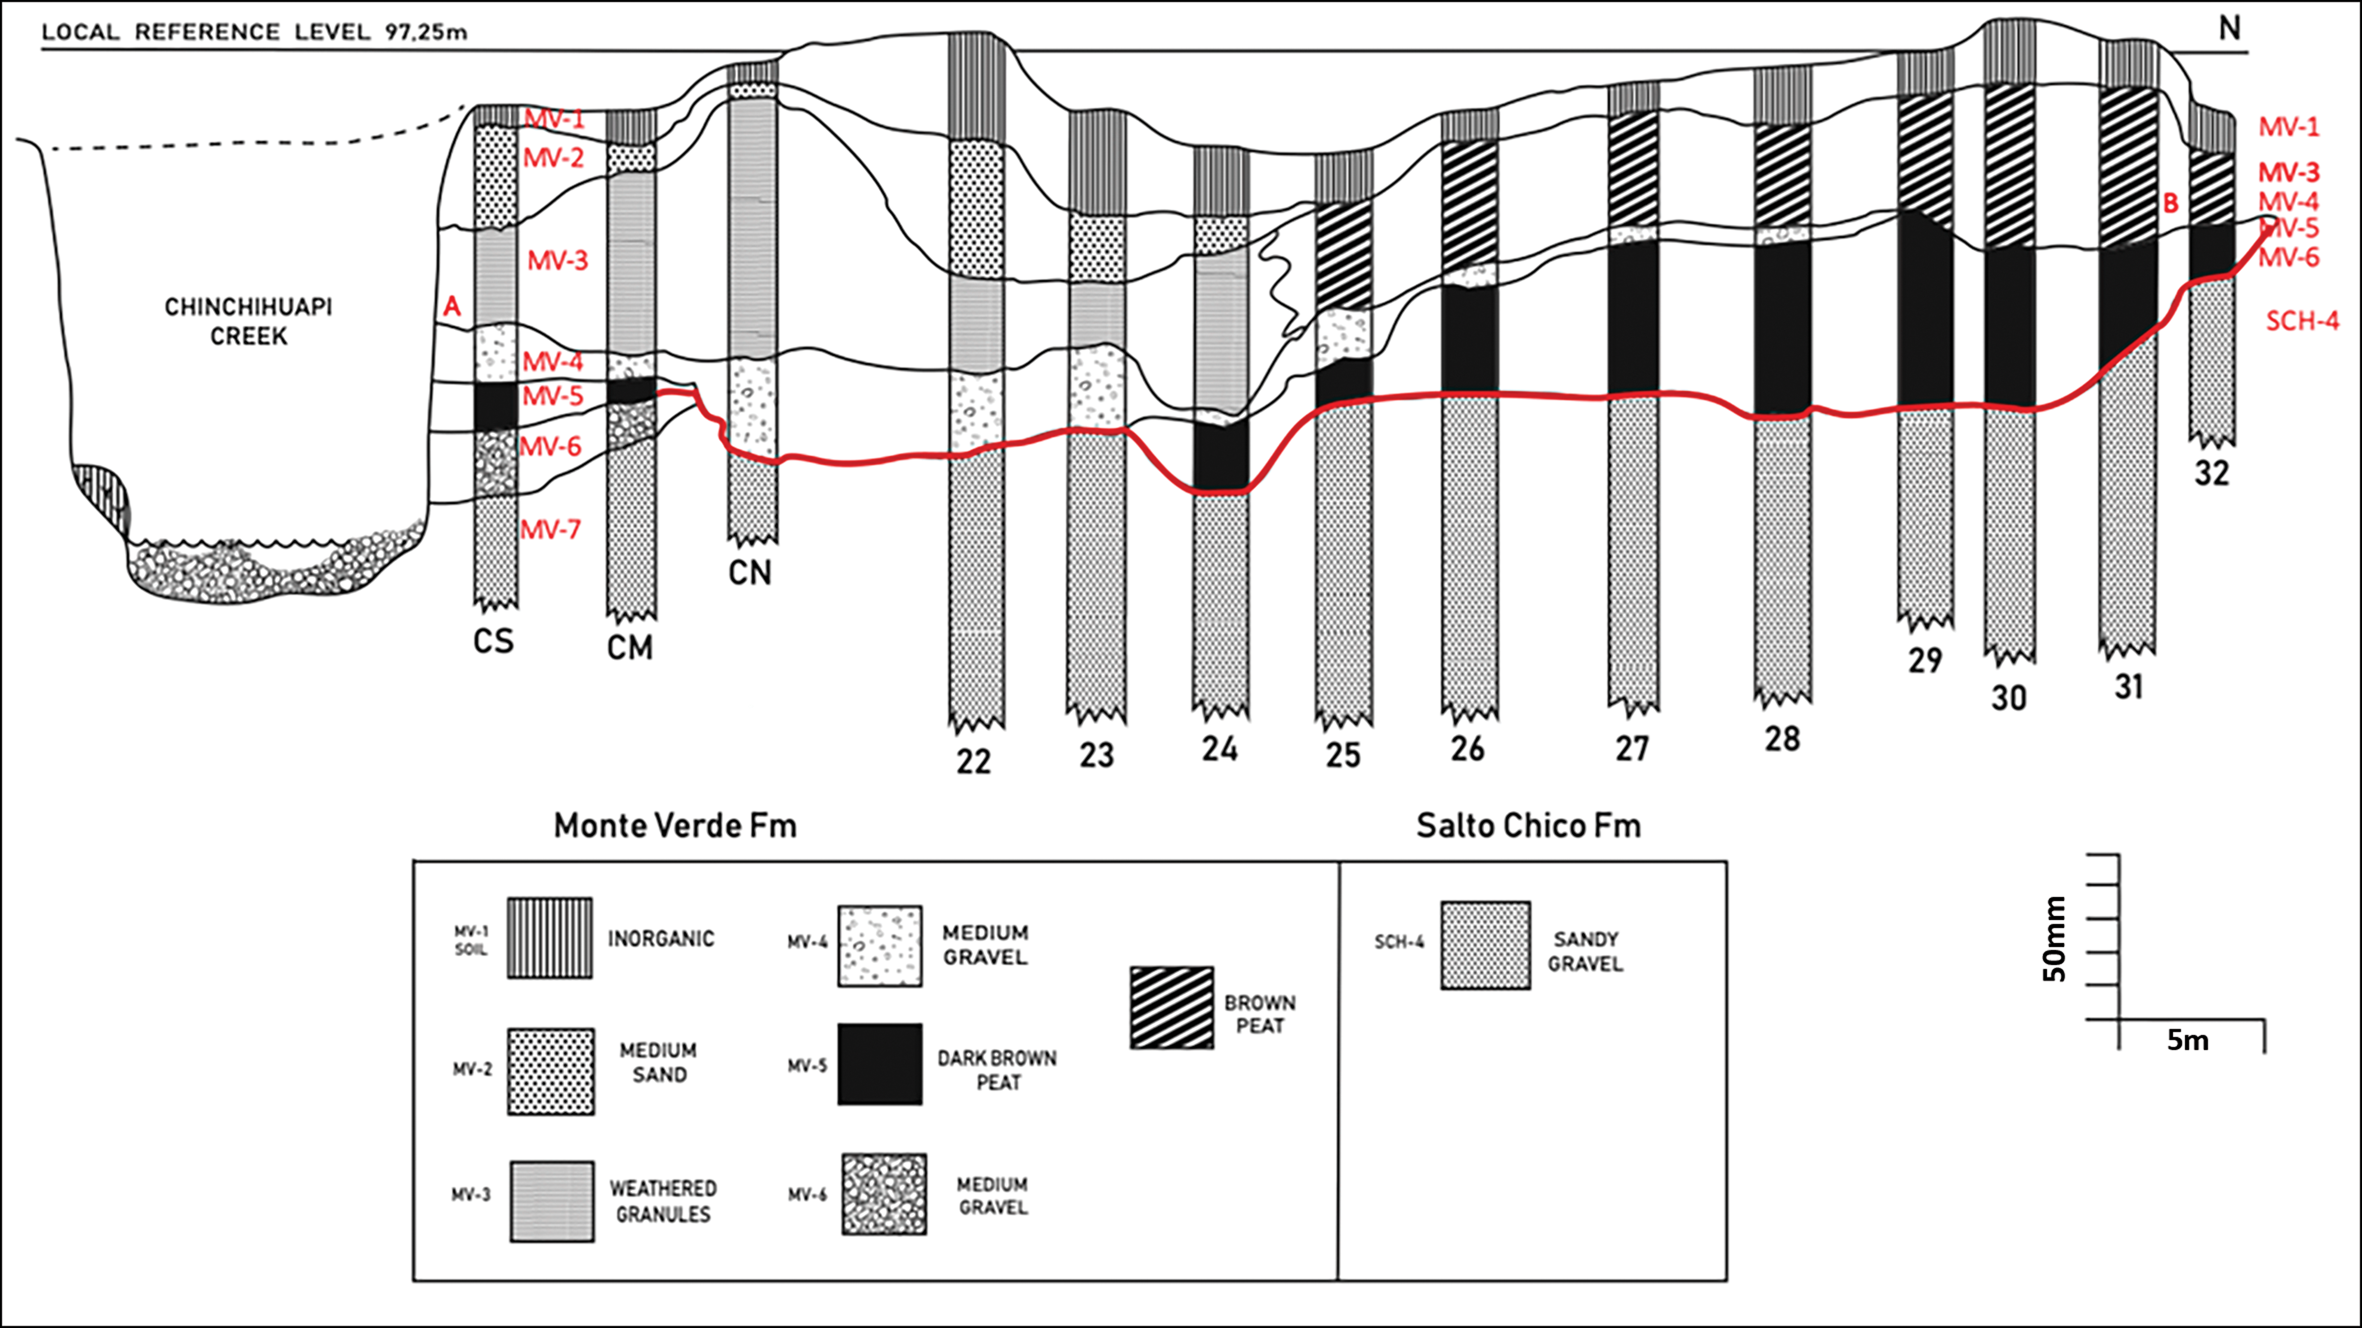
The MVF is composed of six layers—MV-1 to MV-6 (Figure 6)—but only three are relevant here. MV-7 is a sandy terrace cut by a small stream, MV-6, similar to the modern Chinchihuapi Creek close to the site. MV-5 is a peat layer that was deposited over MV-6 and MV-7 and seals the human occupation at MV-II. Although moraines characterise the landscape 15km to the south-east of Monte Verde, there is no evidence that the site was ever covered by ice or glacial outwash during the last glaciation (Pino Reference Pino and Dillehay1989; Dillehay et al. Reference Dillehay2015).
The suite of radiocarbon determinations obtained from the MV-II occupation site on a variety of organic material associated with hearths embedded in the buried sandy surface of the terrace (MV-7) and the creek shoreline (MV-6) indicate a period of occupation sometime between c. 14 200 and 14 900 cal BP (at 95.4% probability), which, when averaged, is equivalent to a median calendar age of c. 14 530 cal BP (at 95.4% probability; Dillehay & Pino Reference Pino and Dillehay1989, Reference Dillehay, Pino and Dillehay1997). This range is expected, considering the different materials dated at different laboratories over a period of four decades. When considered in greater detail, the assessments on specific burnt wooden artefacts, gomphothere bones, single pieces of charcoal from sealed hearths, and short-lived plants such as seaweeds and wild potatoes, more specifically place the date at c. 14 550–14 500 cal BP (at 95.4% probability; Dillehay Reference Dillehay, Graf, Ketron and Waters2014; Dillehay et al. Reference Dillehay2008). A series of OSL dates on intact stratigraphy confirms the chrono-stratigraphy of all four site areas within the Monte Verde complex (Dillehay et al. Reference Dillehay2015, Reference Dillehay2017).
Marine reservoir offsets and volcanic deposits
Regarding Taylor's query of the possible effect of marine deposits on radiocarbon results at MV-II, we can find no evidence of such an effect. The interplate zone that accommodates the 66mm/year convergence between the Nazca and South American plates was the source of the Valdivia earthquake on 22 May 1969 (magnitude Mw 9.5; Plafker & Savage Reference Plafker and Savage1970; Moreno et al. Reference Moreno, Bolte, Klotz and Melnick2009)—the largest seismic movement instrumentally measured by modern seismology. This earthquake triggered important geomorphological changes due to a more than 2m coseismic submergence (lowering of the land) within the continent, as would also have occurred with the earthquakes in AD 1575, 1737 and 1837 (Lomnitz Reference Lomnitz2004; Cisternas et al. Reference Cisternas2005). Such tectonic subsidence did not produce marine ingressions at Monte Verde and is very unlikely to have done so in the past because of the recovery of the continental altitude between successive earthquakes.
The last time a marine environment existed in the Monte Verde area was during the Late Oligocene–Early Miocene (87Sr/86Sr ages of 24–16 Mya; Nielsen & Glodny Reference Nielsen and Glodny2009). The Oligocene–Miocene marine strata are exposed at different localities in the forearc (a type of geological basin) of central and southern Chile between 34° and 45° south (Encinas et al. Reference Encinas2008, Reference Encinas and Folguera2018), but at Monte Verde they are covered by at least 100m of Pleistocene deposits. None of the organic and inorganic remains retrieved from the site indicates any marine resources, other than 13 species of edible or medicinal imported seaweeds from the Pacific coast (approximately 60km away) at the time of occupation; all of these remains (from the masticated cuds, see above) come from leaves rather than the stalks and other plant parts (Dillehay Reference Dillehay1989, Reference Dillehay, Pino and Dillehay1997). If the study area had been a marine terrace, a wide variety of naturally occurring ocean organisms and other elements would be expected.
Furthermore, the Monte Verde area was never below or in direct contact with the Pacific Ocean, contra Taylor's concern and Dickinson's (Reference Dickinson2011) attempts to link the site location directly to the ocean. Circa 130 000 years ago, sea level was approximately 7m higher than at present (after Kopp et al. Reference Kopp2009). During the Marine Isotope Stage MIS 5e (130–80 kya), the shorelines around the world were at an average of 45m asl at active margins, the difference of approximately 38m being due to a global uplift of shorelines (after Pedoja et al. Reference Pedoja2011). At c. 23 000 years ago, during the Last Glacial Maximum (Rabassa Reference Rabassa and Rabassa2008; Ponce et al. Reference Ponce2011), sea level was approximately 130m below the current level (Fleming et al. Reference Fleming1998; Ponce & Fernández Reference Ponce and Fernández2014). It rose, c. 15 000 years ago, to above −85m (Fleming et al. Reference Fleming1998; Dillehay et al. Reference Dillehay2008; Ponce & Fernández Reference Ponce and Fernández2014), but never reached Monte Verde. Moreover, the values of δ13C in radiocarbon dates obtained at Monte Verde and elsewhere in the region exclude the presence of marine components (cf. Fry & Sherr Reference Fry and Sherr1984; Hayes et al. Reference Hayes, Freeman, Popp and Hoham1990; Moreno & León Reference Moreno and León2003; Moreno Reference Moreno2004; Abarzúa et al. Reference Abarzúa, Villagrán and Moreno2004; González-Guarda et al. Reference González-Guarda2018).
In summary, based on the past distance of the site approximately 60km from the Pacific Ocean at the time of human occupation, the sea level at the end of the Late Pleistocene, the δ13C values, and the topography of the site (Dillehay et al. Reference Dillehay2015), the ocean never reached Monte Verde during the last glacial cycle.
Concerning possible volcanic activity affecting the radiocarbon dates, carbon-bearing samples can be contemporaneous with (or very close to) eruption events that generate tephra because any carbon-bearing material that is either transported by pyroclastic density currents or directly buried or overlain by tephra is associated with the time of eruption (Alloway et al. Reference Alloway and Elias2013). There are many radiocarbon-dated tephra deposits and peats interleaved with tephra in non-archaeological sites in south-central Chile that reveal correlated chrono-stratigraphic sequences and the results show no offsetting effects created by volcanic activity (e.g. Weller et al. Reference Weller2015; Vilanova et al. Reference Vilanova, Moreno, Mirada and Villa-Martinez2019).
The possibility of volcanic activity offsetting the radiocarbon results at Monte Verde is a moot point, as tephra deposits at Monte Verde are stratigraphically in the upper strata of the site (i.e. MV-3), above the cultural layer. The volcanic MV-3 stratum (from its upper to lower levels) dates to between 5440 cal BP (at 95.4% probability; Beta-6756; 4750±90 BP) and 9210 cal BP (at 95.4% probability; Beta-6753; 8270±110), respectively. There is no evidence of volcanic materials in the MV-5 stratum directly overlying the cultural layer and there are no regional problems in dating tephra deposits at non-archaeological sites (Dillehay & Pino Reference Dillehay, Pino and Dillehay1989).
New AMS assays
Table S1 (see the OSM) lists the calibrated ages of the samples obtained from the two 2012 cores analysed by Taylor and Pino. The error range of the ages of the samples in Taylor's core is between two and three times greater than in Pino's column MV-86b. Although it was not possible to precisely correlate the two columns lithostratigraphically, Pino's four dates and their depths coincide with those of Taylor's core. Figure 7 illustrates the distribution of 34 of the radiocarbon dates (not 39, due to duplicate and triplicate assessments of Taylor's samples) plotted as the median probability and the 94.5% probability (see Table S1).
Relationship between the probabilistic median and range and the depth. The blue arrows indicate the position of the four MV-86b dates. The median age value distribution appears to form a curve with two different slopes—that is, two different sedimentation rates (see the online supplementary material) (figure by M. Pino).
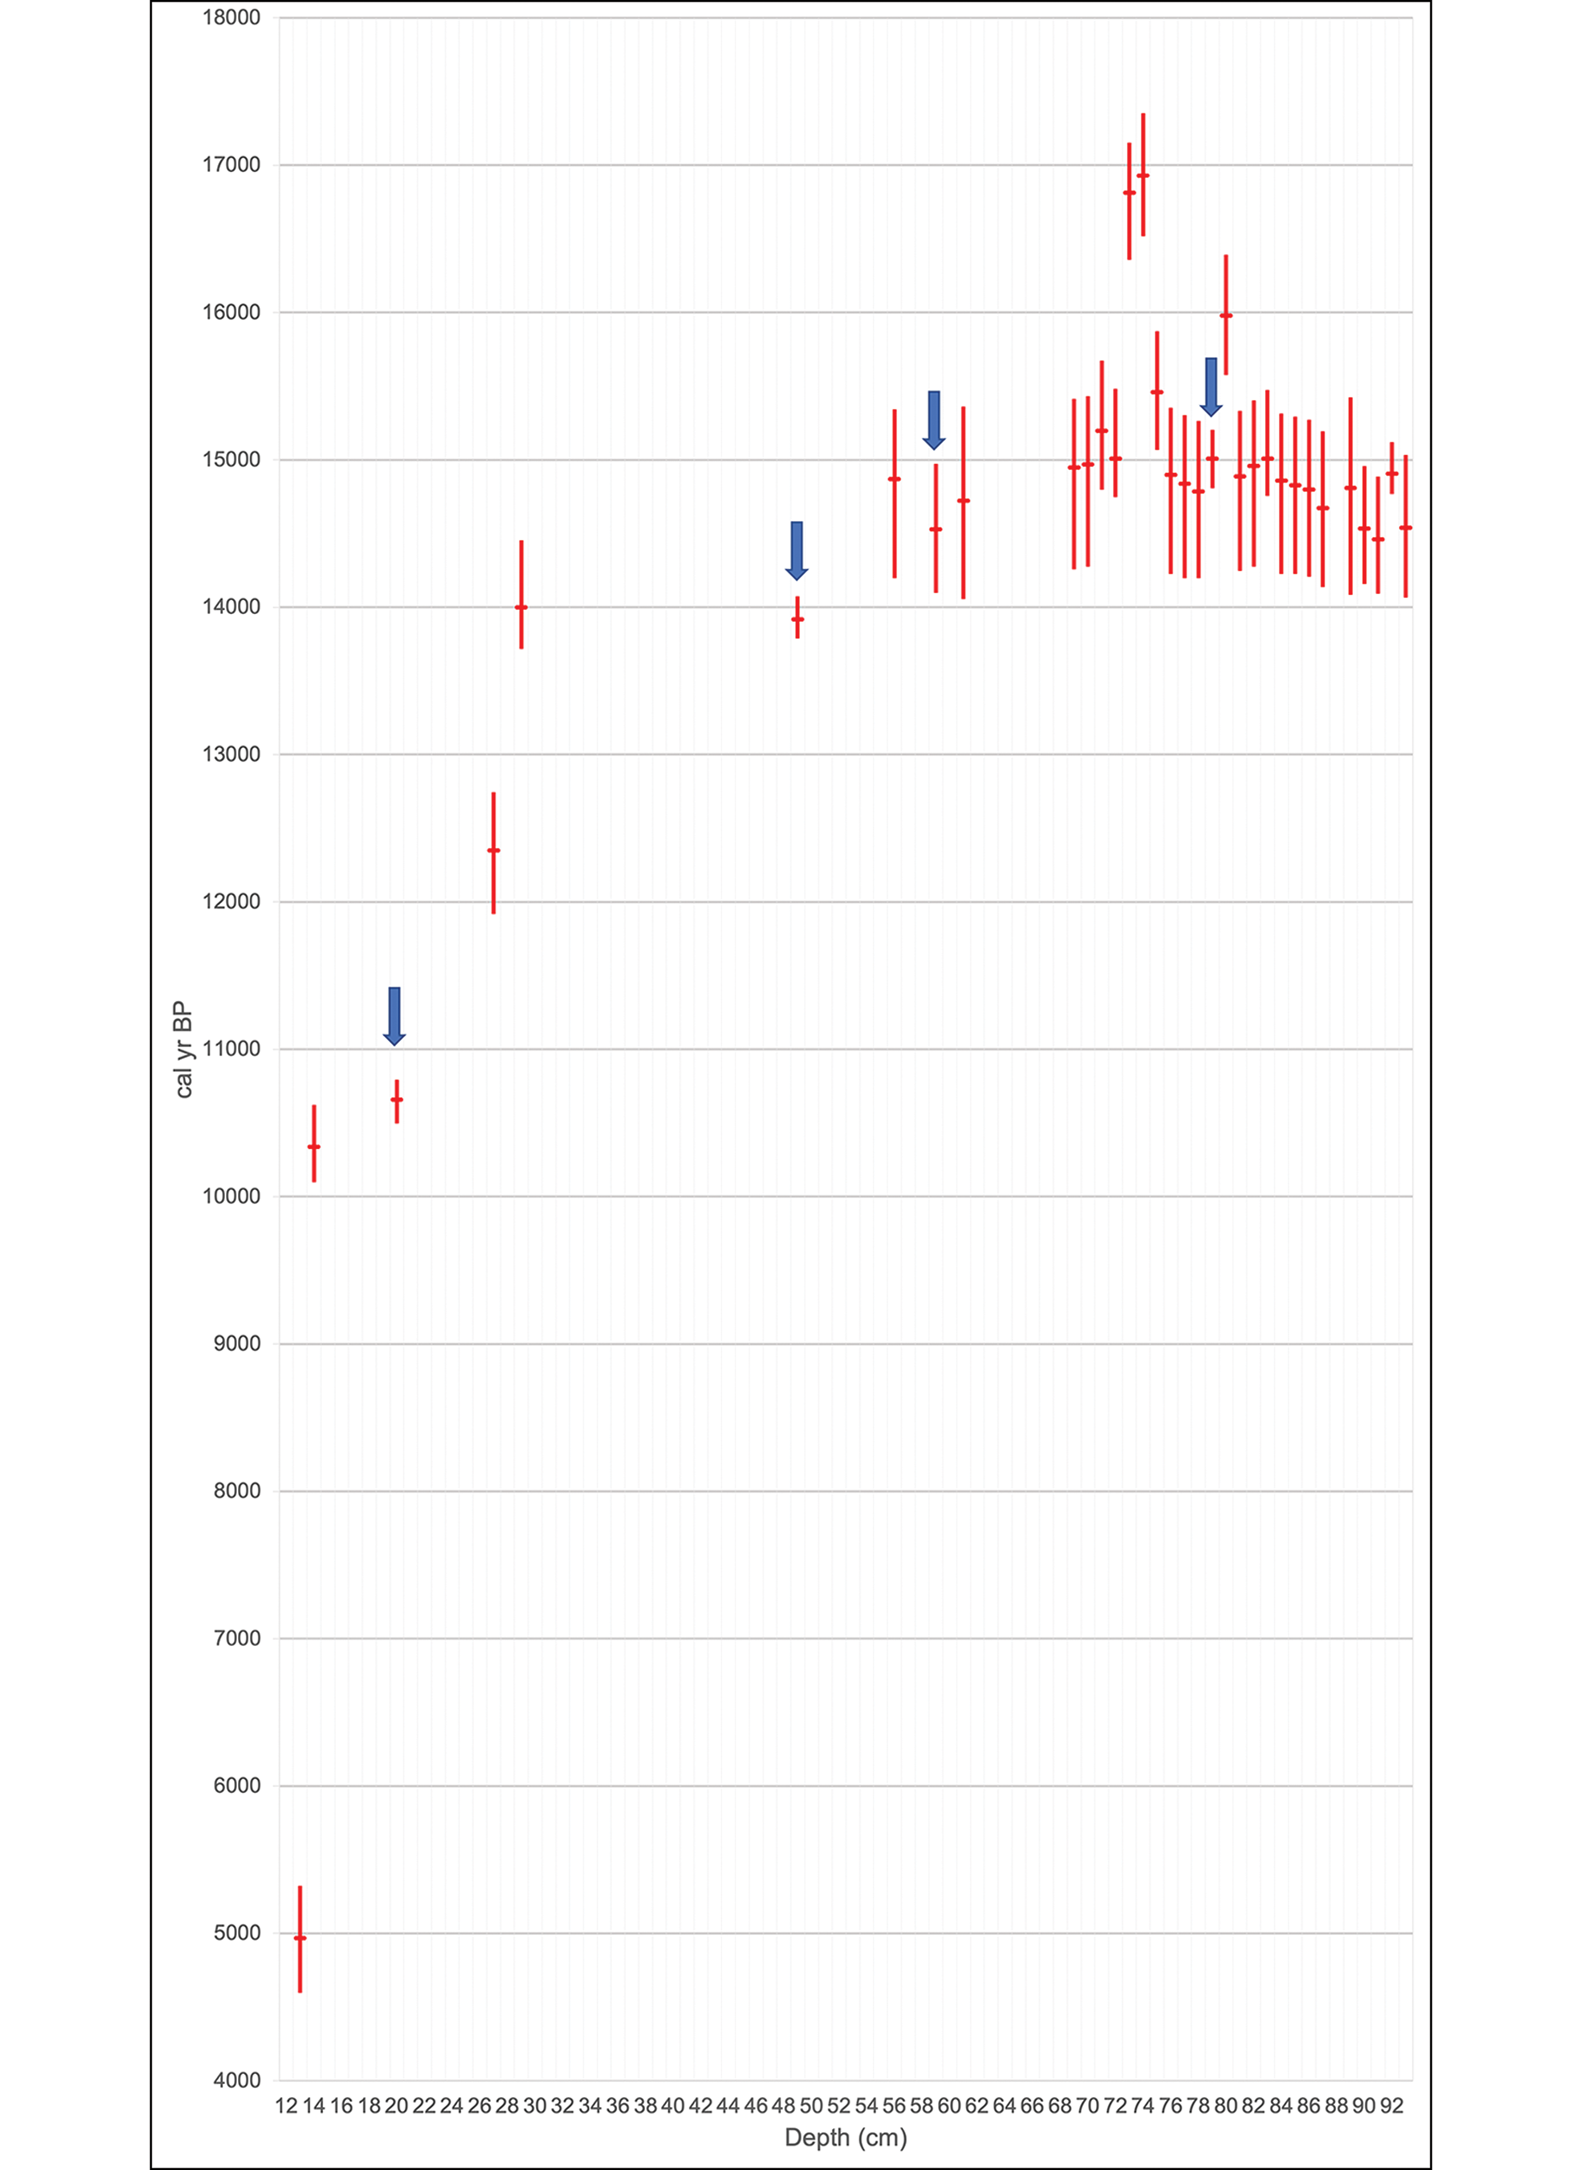
The post MV-II occupation assays of the two cores in the basal deposits of stratum MV-5, which immediately overlies the cultural use-surface, average c. 14 500–14 600 cal BP (at 95.4% probability). This coincides with the artefacts and features previously dated at the MV-II occupation site, at c. 14 550 cal BP (Dillehay & Pino Reference Dillehay, Pino and Dillehay1997), indicating that human settlement at MV-II occurred immediately before the peat first developed.
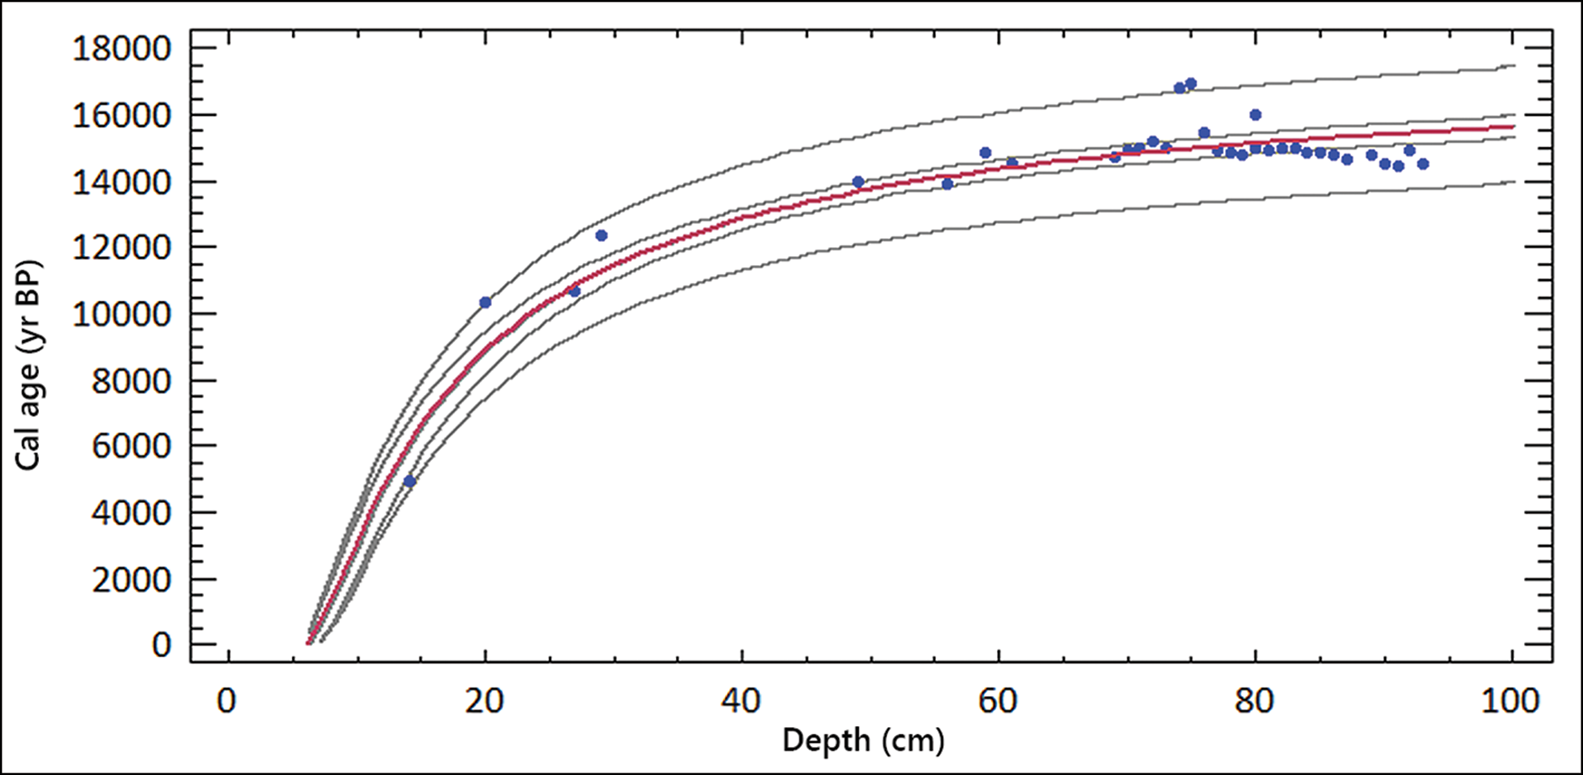
Two groups of dates are apparent in the two cores. The first is composed of six radiocarbon dates between 4970 and 13 920 cal BP (at 95.4% probability), including one outlier of 14 000 cal BP at a depth of 0.49–0.50m. The second group includes 27 dates between 14 530 and 15 010 cal BP (at 95.4% probability), with a mean of 14 855±221 cal BP, including three outliers with a median age of c. 16 000–17 000 cal BP (at 95.4% probability) at a depth of 0.74, 0.75 and 0.80m. The spread shown at 94.5% probability is so narrow that most of the 27 radiocarbon ages are indistinguishable from each other (see Figure 7). The deposition rates in the first and second groups are around 0.05 and 0.30mm per year (see the OSM). Figure 8 shows the modelled age, with the three outliers in the regression model, at depths of 0.20, 0.74 and 0.75m, having more than two standard deviations with respect to the observed calibrated ages in the model, being between 1454 and 1950 years older than expected. Further detail concerning the calculations behind this model are given in the OSM.
Adjusted model graph. The curve defined by the equation age = (132.63−767.334/depth)2 separates the two date groups (approximately 0.35m depth). After an atypical residuals analysis, it is possible to point out that the samples at 0.20, 0.74 and 0.76m in depth have a residual Student's t-test (2.77, 2.41 and 2.53, respectively) (figure by M. Pino).
Lastly, the MV-5 peat layer at the MV-II site was dated by Dillehay and Pino (Reference Dillehay, Pino and Dillehay1989) to between c. 14 000 at the base and to 12 860 cal BP in the upper level (at 95.4% probability). This is similar to the oldest date obtained in Pino's MV-86b core and in Taylor's core, at 0.52m, in the non-cultural area (see Figures 7 & 8). Moreover, Taylor previously published a radiocarbon determination of 14 435 cal BP (at 95.4% probability; UCIAMS-11250) on a plant fragment from the lowest level of the MV-5 stratum (at a depth of 0.930–0.945m; Taylor & Bar-Yosef Reference Taylor and Bar-Yosef2014: 259–60). If the 14 435 cal BP date represents the oldest age of the non-cultural base of the MV-5 peat layer, the peat in both cores (at a depth of between 0.520m and the base at 0.835m) is contemporaneous with the MV-6 creek bed and adjacent MV-7 terrace.
Discussion
It is unusual in palaeoenvironmental and archaeological research that radiocarbon dates are derived from such high-density per unit depths, with duplicate and triplicate dates. It is also uncommon that so many dates are assayed at a distance of 10mm apart in a stratigraphic column, with concordant and accurate results. Twenty-one dates were obtained between a depth of 0.740 and 0.955m in Taylor's core and four come from depths between 0.895 and 0.935m in Pino's core MV-86b. In that column, the standard deviations of the assays were 49, 43, 32 and 130 years; in the last case, the high value was due to one of the triplicates being 200 years older than the other two replicates.
Some radiocarbon dates from Taylor's core were older than expected (Figure 7). At depths of 0.20, 0.74 and 0.75m the organic constituents in the sediment have radiocarbon ages that reflect the presence of older organic material. The two adjacent 10mm units, at 0.74–0.75m and 0.75–0.76m in depth, contain sedimentary organics with radiocarbon values approximately 1250 radiocarbon years older than the mean age of the organics in the later sedimentary units and all but two of the units preceding them. At a depth of 0.80m, the sample gave a result approximately 700 years older than the results from the samples bracketing it. The organic material yielding these relatively abrupt offsets in radiocarbon ages was not transported into the sediments from other watersheds containing older organics, since no other watersheds exist within the site area. A probable explanation is that the dated organics represent windborne old wood or tiny charcoal particles derived from old trees. Regardless, they do not represent the age of deposition but probably date the life history of a single tree. In north-western Chilean Patagonia, there are examples of long-lived tree species, such as alerce or cypress (Fitzroya cupressoides and Pilgerodendron uviferum) that often survive over 1000 years (and up to a maximum of 3620 years; Lara & Villalba Reference Lara and Villalba1993).
This specific case of probable older wood is very different from the radiocarbon ages on the culturally modified wood present in the MV-II site. Fallen timbers that are old and no longer part of living trees present major physical changes, such as mechanical fractures, sponginess due to water saturation, insect burrowing, degradation by fungi and bacteria, cracks from natural drying, and the effects of weathering. This makes them unsuitable for cultural use (Díaz-Vaz Reference Díaz-Vaz and Dillehay1989). They were not chosen as raw material by the occupants of MV-II, as indicated by the absence of these markers of decay in the archaeological wood assemblage. Moreover, why select old, decayed wood when fresh wood is readily available?
Conclusion
The AMS-dated fragments of plants, wood and charcoal taken from two cores adjacent to MV-II, from non-archaeological contexts containing sedimentary organics deposited during the Late Pleistocene and throughout the Holocene, occupy the same chrono-stratigraphic position as those over the MV-II archaeological site. The radiocarbon ages obtained on organics deposited in the lower portion of these cores are consistent with the radiocarbon dates previously reported on artefacts and other materials excavated at the adjacent MV-II archaeological site. They belong to an immediate post-occupation horizon, comprising peat that formed over a relatively short period. The post-occupation assays at the base of the MV-5 peat stratum average c. 14 500–14 600 cal BP (at 95.4% probability). This stratum seals MV-II's cultural layer, dated to c. 14 550 cal BP, indicating that it formed shortly after human occupation of the site.
We hope that these new assays resolve some questions related to the chronology and integrity of MV-II. We look forward to continuing evaluations of the archaeology and geology of the Monte Verde complex and, more importantly, to addressing the wider questions beyond this particular site that merit more attention, if we are to better understand the peopling of the Americas and the history of global human migration.
Acknowledgements
The new radiocarbon dates were generated by an AMS dating project initiated by the late Erwin Taylor, in conjunction with Mario Pino, Ricardo De Pol-Holz and members of the UACh Instituto de Ciencias de la Tierra.
Funding statement
Mario Pino received support as an Investigator of the Nucleus “Transdisciplinary Center for Quaternary Research in the South of Chile”; Research Directorate of the Universidad Austral de Chile.
Supplementary material
To view supplementary material for this article, please visit https://doi.org.10.15184/aqy.2023.32.


 Open access