


The child stunting rate, defined as the share of children with a height-for-age Z-score (HAZ) of less than −2, is extensively used a proxy for average nutritional status of children in a community(Reference Svedberg1). While having HAZ < −2 is not highly predictive of health status at the individual level, at the population level as it can serve as an indicator of the overall incidence of linear growth faltering(Reference Perumal, Bassani and Roth2). Economists and policy makers often use the stunting rate to make cross-country comparisons or to evaluate how average child nutritional status has changed over time(Reference de Onis, Blössner and Borghi3–Reference Mukuria, Cushing and Sangha5). However, focusing only on differences in the stunting rate, rather than the distribution of HAZ, can be misleading. Increasing the variance of Z-scores in a population mechanically increases the stunting rate. While some variation in height is expected due to individual genetic or environmental factors(Reference Jelenkoic, Sund and Hur6), the population variance may be artificially inflated due to measurement error, potentially leading to an overestimation of the actual stunting rate. In the case of Egypt, we show evidence that the measurement error in the Demographic and Health Surveys (DHS) is both high and differs from one survey round to another. Therefore, adjustment for measurement error is necessary to make statements about the evolution of stunting rates over time and how Egypt compares with other countries.
Age misreporting and inaccurate height recording are common in anthropometric surveys and lead to errors in HAZ. For example, it has been shown that age misreporting is the major source of error in calculating HAZ values in national representative surveys in developing countries in sub-Saharan Africa and Asia(Reference Comandini, Cabras and Marini7,Reference Comandini, Cabras and Marini8) and that an error of 1·5 months for a 12-month-old child can increase the sd of HAZ by about 20 %(Reference Grellety and Golden9). Height measurement is also prone to measurement errors by enumerators, especially for younger children(10).
In an analysis of DHS anthropometric data quality in fifty-two countries, Egypt is one of the seven countries listed as having the most concerns raised across a variety of different quality indicators(Reference Assaf, Kothari and Pullum11). Nevertheless, the DHS stunting rate for Egypt is widely used and cited by researchers, policy makers and development organizations(Reference Ecker, Al-Riffai and Breisinger12–Reference Rashad and Sharaf14).
In the present communication, we show the potential ranges of stunting after removing measurement error under different assumptions about the magnitude of error for three rounds of the Egypt DHS (2005, 2008 and 2014)(Reference El-Zanaty and Way15–17).
Methods
We present three scenarios which show the range of true values which could give rise to the observed data depending on how much measurement error we assume: (i) a conservative scenario; (ii) an aggressive scenario; and (iii) a moderate scenario between these two extremes. In all scenarios, we assume classical measurement error uncorrelated with the measurements and with a mean of 0. The sd of the measurement error differs in each scenario.
Conservative scenario
This approach is based on looking at the high side of the distribution. In line with the WHO recommendations from the Multicenter Growth Reference Study, we assume that the share of overly tall children should be no greater than that found in the WHO reference populations used to construct the international growth standards, so any excess must be due to measurement error.Footnote * Let H represent the proportion of children with a Z-score more than 2 sd above the mean:
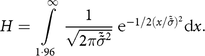 $$H = \int\limits_{1\cdot96}^\infty {{1 \over {\sqrt {2\pi {{\tilde {\tilde \sigma }}^2}} }} {{\rm{e}}^{ - 1/2{{\left( {x/\tilde \tilde \sigma } \right)}^2}}}{\rm{d}}x.}$$
 We solve (computationally) for the sd of a normal distribution that would give this share of extremely tall children, denoted as  ${\tilde \tilde \sigma }$. The difference between ${\tilde \tilde \sigma }$ and the reference population sd of 1 is attributable to measurement error. We denote the variance of this measurement error as ${\sigma _{\varepsilon}^2}$:
 $${\sigma _{\varepsilon}^2} = {{\tilde \tilde \sigma}^2} - 1.$$
While we are confident that our conservative approach identifies a minimum amount of variance that must be due to measurement error, accounting for this measurement error still leaves the observed variance much higher than expected. So, we proceed also to show how much the stunting rate would change under more aggressive assumptions.
Aggressive scenario
As a benchmark of the maximum measurement error that could be assumed, we make the strong assumption that all variance beyond that in the reference population (where the variance is equal to 1) is attributed to measurement error. In effect, this assumes that there is no heterogeneity of malnutrition due to regional differences or other household characteristics and that any impact of malnutrition on growth is diffused equally throughout the population. This assumption of no heterogeneity is unrealistic, but by making the strongest possible assumption, we obtain the minimum true stunting rate that could be inferred from the observed data.
In this case, we define measurement error based on the difference between the variance of the observed Z-scores  $ ({\tilde \sigma ^2})$ and 1:
 $${\sigma _{\varepsilon}^2} = {\tilde \sigma ^2} - 1.$$
Moderate scenario: true variance inferred from a better-quality survey
Instead of the extreme assumption that the true values are distributed with a variance of 1, we can look to better-quality survey data for some guesses about the actual value of the true variance. Here, we use the variance found in a 2018 survey of households in rural areas in Upper EgyptFootnote † where we know that the enumerator training was done more carefully than for the DHS data collection. We define measurement error based on the difference between the variance of the observed Z-scores $ ({\tilde \sigma ^2})$ in the DHS and the variance in our higher-quality survey  $\left( \tilde \sigma _S^2 \right)$:
 $${\sigma _{\varepsilon}^{2}} = {\tilde \sigma ^2} - \tilde \sigma _S^2.$$
Simulations
We turn to simulations to model what true distributions would give rise to the observed distribution after the addition of measurement error. Because we assume that errors are uncorrelated with the true values, the expected variance of this true distribution, denoted as  ${\hat \sigma ^2}$, is equal to the observed variance $\left({\tilde \sigma ^2}\right)$ minus the variance of the hypothesized measurement error:
 $${\hat \sigma ^2} = {\tilde \sigma ^2} - \sigma _{\varepsilon}^2.$$
 We then define a random variable representing simulated measurement error,  $\hat \varepsilon $, such that $\hat \varepsilon $ is distributed N(0, ${\sigma _{\varepsilon}^{2}}$) and subtracting $\hat \varepsilon $ from our observed data reduces the variance to ${\hat \sigma ^2}$. Because the observed measurements $ (\tilde z)$ are the sum of the true values and the measurement error, $\hat \varepsilon $ is positively correlated with the true value (z). The correlation (ρ) between $\hat \varepsilon $ and $\tilde z $ can be defined based on $\sigma _{\varepsilon}^{2}$ and ${\tilde \sigma ^2}$:
 $${\hat \sigma ^2} = {\tilde \sigma ^2} - {\sigma _{\varepsilon}^{2}} = {\tilde \sigma ^2} + {\sigma _{\varepsilon}^{2}} - 2\tilde \sigma {\sigma _{\varepsilon}}\rho , $$
where
 $$\rho = {{{\sigma _{\varepsilon}}} \over {\tilde \sigma }}.$$
 In each iteration, we randomly select values of $\hat \varepsilon $ correlated by ρ with the observed distribution; subtract $\hat \varepsilon $ from $\tilde z $ to generate our simulated measurement-error-free data; and calculate the resulting stunting rate. For all summary statistics, we follow the standard practice of excluding flagged values (HAZ > 6 or HAZ < −6). We present the results of 1000 iterations.
We choose values for $\sigma _{\varepsilon}^{2}$ and perform the simulations separately for children aged 6–23 months and 24–59 months because we expect the measurement error to differ between these two groups.
Results
Figures 1 and 2 illustrate of the effect of removing measurement error under the three scenarios described above. These figures show a single iteration in our simulations: the distribution of corrected Z-scores resulting from one randomly drawn vector of measurement error. Removing the error leads to tighter distributions with fewer cases of stunting.
Height-for-age Z-score (HAZ) distributions based on different scenarios ( , observed distribution of Z-scores;
  , simulated under conservative scenario;
  , simulated under moderate scenario;
  , simulated under aggressive scenario) for children aged 6–23 months from three rounds of the Demographic and Health Survey (DHS) in Egypt (2005, 2008 and 2014)

Height-for-age Z-score (HAZ) distributions based on different scenarios (, observed distribution of Z-scores; , simulated under conservative scenario; , simulated under moderate scenario; , simulated under aggressive scenario) for children aged 24–59 months from three rounds of the Demographic and Health Survey (DHS) in Egypt (2005, 2008 and 2014)

Table 1 summarizes the results of the three simulation scenarios in each of three rounds of DHS data from Egypt.
Stunting prevalence for conservative, aggressive and moderate scenarios among children under 5 years old from three rounds of the Demographic and Health Survey (DHS) in Egypt (2005, 2008 and 2014)
 $\tilde \sigma $, observed sd of Z-scores; ${\sigma _{\varepsilon}^{2}}$, hypothesized measurement error; $\hat \sigma $, modelled sd of Z-scores after removing measurement error.
* 95 % CI based on 1000 simulations.
In panel A of Table 1, we summarize the DHS data on HAZ, including means, sd and the prevalence of stunting in the population of children as calculated using the Stata module zscore06, which is based on the 2006 WHO reference values(Reference Leroy19). The sd of the Z-scores are extremely high, ranging from a minimum of 1·71 in 2005 up to a maximum of 2·32 in 2014. As mentioned above, there is also a striking increase in stunting especially among the younger age group from 2005 to 2008 followed by a decline to 2014.
For each scenario, the corresponding panel in Table 1 shows the measurement error  $ (\sigma _{\varepsilon}^{2})$ that we are assuming, the empirical 95 % CI of the modelled sd of Z-scores after removing measurement error ($\hat \sigma $) and the empirical 95 % CI of the resulting stunting rates.
Under the conservative scenario (panel B in Table 1), the assumed measurement error accounts for between 41 and 46 % of the variance in the observed data. Removing this error leads to modelled stunting rates in the various DHS rounds from 1 to 5 percentage points lower than in the observed data.
Under the aggressive scenario (panel C in Table 1), the assumed measurement error comprises 58–68 % of the variance in the observed data. Removing this measurement error results in a significant decrease in the estimated prevalence of stunting for all groups, particularly among children in the 2008 and 2005 samples. For example, in 2008, children aged 6–23 months would have a stunting prevalence between 12·5 and 14·8 % in contrast with the 30·2 % observed in the DHS data.
Under the moderate scenario (panel D in Table 1), the measurement error comprises 45–54 % of the variance in the observed data. The corrected stunting rates fall between the conservative and aggressive results.
For 2014, under our moderate scenario, our simulations give a mean true stunting prevalence of 14·7 % for children aged 6–23 months and 15·3 % for children aged 24–59 months. This is dramatically lower than the DHS rate currently accepted to be true in Egypt (20·4 and 19·8 %, respectively). The results from the alternative conservative and aggressive assumptions give a range from 3·7 to 17·0 % for children aged 6–23 months, and from 5·6 to 15·7 % for older children. This shows that at the least stunting is overestimated by about 4 percentage points, that the true stunting rate could be substantially lower than even our moderate scenario suggests, and that there is a very large degree of uncertainty about the true stunting rate.
Discussion
The present study shows how measurement error leads to overestimation of the real malnutrition prevalence in Egypt, a country where issues with anthropometric data quality have been observed but are not widely appreciated. We show that measurement error has been high and variable across the three most recent rounds of the DHS and simulate a range of potential true values of the stunting rate.
Policy makers were particularly concerned by the high prevalence of stunting observed in 2008 which contrasts with the other two rounds. Previous research had suggested that this effect might be the consequence of the outbreak of avian flu that took place in Egypt in 2006, and that affected mainly rural areas in Lower Egypt, with significant consequences for household welfare and protein consumption for children(Reference Hosny20,Reference Geerlings, Albrechtsen and Rushton21) . Our simulations confirm that even accounting for measurement error, the increase in stunting in 2008 is still observed, although the level and magnitude of the change are lower.
There are important implications of these findings for policy makers in Egypt; but for the larger community, we emphasize that data quality issues in the DHS were flagged in a number of other countries. While one response is to call for improving accuracy of measurement for future rounds of collection, many researchers and policy makers are faced with the reality that the only data that exist are from surveys with data quality concerns.
We recommend that researchers in this situation use the types of adjustments described in the present communication before using DHS data from survey rounds with questionable data quality in time-series or cross-sectional analysis of stunting rates. We also recommend using this approach to communicate to policy makers about the degree of uncertainty surrounding the stunting rate when the only available data are from survey rounds with data quality concerns.
Acknowledgements
Acknowledgements: The authors would like to thank Jef Leroy, Clemens Breisinger and Ampa Diatta for their support and helpful comments on this research project. All errors are the authors’ own. Financial support: This work was undertaken as part of the CGIAR Research Program on Policies, Institutions, and Markets (PIM) led by the International Food Policy Research Institute (IFPRI). The opinions expressed here belong to the authors, and do not necessarily reflect those of PIM, IFPRI or CGIAR. Conflict of interest: No known conflicts of interest exist. Authorship: Both authors were jointly involved in the design, analysis and writing. Ethics of human subject participation: This study was conducted according to the guidelines laid down in the Declaration of Helsinki and all procedures involving research study participants were approved by the IFPRI internal review board. Verbal informed consent was obtained from all subjects in the IFPRI 2018 survey of households in Upper Egypt referenced herein. Verbal consent was witnessed and formally recorded.



