


Sarcopenia is defined as a progressive and generalised skeletal muscle disorder involving an accelerated loss of muscle mass and function(Reference Cruz-Jentoft and Sayer1). Sarcopenia is associated with a wide range of adverse health-related outcomes, such as metabolic diseases, falls, fractures and all-cause mortality(Reference Xia, Zhao and Wan2,Reference Xu, Wan and Ktoris3) . Therefore, it is of public health significance to identify modifiable lifestyle risk factors that can lower the risk of sarcopenia.
Coffee is one of the most frequently consumed beverages worldwide. Moderate coffee consumption has been reported to be associated with lower risks of specific cancers, CVD, metabolic diseases and all-cause mortality(Reference Poole, Kennedy and Roderick4,Reference van Dam, Hu and Willett5) . Animal studies have suggested that coffee has a beneficial effect on skeletal muscle mass improvement(Reference Guo, Niu and Okazaki6–Reference Dirks-Naylor8). Although the molecular mechanisms underlying the relationships between coffee consumption and muscle mass have not been fully elucidated, anti-inflammatory and anti-oxidative effects, autophagy, downregulation of myostatin and upregulation of insulin-like growth factor may be involved in the effect of coffee on increased muscle mass(Reference Guo, Niu and Okazaki6–Reference Dirks-Naylor8). Ergogenic effects of caffeine on exercise performance, including muscle endurance, muscle strength, anaerobic power and aerobic endurance, have been widely studied(Reference Grgic, Grgic and Pickering9). However, to the best of our knowledge, studies on the association between coffee consumption and muscle mass are limited, with only three cross-sectional studies and one longitudinal study(Reference Iwasaka, Yamada and Nishida10–Reference Larsen, Mikkelsen and Frederiksen13), and these have shown conflicting results. Two cross-sectional studies, one on middle-aged and older Japanese men and women(Reference Iwasaka, Yamada and Nishida10) and the other on older Korean men(Reference Chung, Moon and Kim11), have reported that higher coffee consumption was associated with higher muscle mass. However, a cross-sectional study on Korean men and women aged 40 years and older reported that light coffee consumption was associated with a lower prevalence of low muscle mass in men but not in women(Reference Kim and Park12). Furthermore, heavy coffee consumption was associated with a higher prevalence of obesity in women(Reference Kim and Park12); however, there might have been heterogeneity regarding obesity status in the relationship between coffee consumption and muscle mass. A longitudinal study reported that there was no clear association between changes in coffee consumption and concurrent changes in the fat-free mass index(Reference Larsen, Mikkelsen and Frederiksen13). One reason for the lack of agreement in these observational studies may be the effect modification, whereby certain factors influence the relationship between coffee and muscle mass. However, the potential effect modification has not been examined in previous epidemiologic studies.
This cross-sectional study aimed to further assess the association between coffee consumption and the prevalence of low muscle mass in middle-aged and older adults. Additionally, we performed an exploratory investigation of effect modification in the association by demographic, health status-related and physical activity-related covariates.
Methods
Participants
This was a cross-sectional study performed using baseline survey data from a prospective cohort study based at the Waseda University in Japan(Reference Kawakami, Miyachi and Sawada14–Reference Tanisawa, Ito and Kawakami17). The Waseda Alumni’s Sports, Exercise, Daily Activity, Sedentariness and Health Study (WASEDA’S Health Study) included Waseda University’s alumni and their spouses aged 40 years or older. The participants voluntarily selected one of four courses (cohorts A–D) with different measurement items(Reference Kawamura, Tanisawa and Kawakami16). As cohorts A and B completed non-face-to-face surveys using the internet and/or postal mail, muscle mass was assessed by a bioelectrical impedance analyser (BIA) only in cohorts C and D. The cohort in our study comprised 2538 middle-aged and older men and women who underwent muscle mass measurements in cohorts C or D between March 2015 and March 2020.
Potential participants were excluded for the following reasons: (1) incomplete results on the internet-based questionnaire (n 81); (2) incomplete dietary survey data (n 20); (3) extreme levels of self-reported energy intake (< 600 kcal/d [< 2510.4 kJ/d] or > 4000 kcal/d [> 16736.0 kJ/d]; n 10); (4) extreme levels of self-reported physical activity (n 26); (5) pregnant or lactating status (n 14); and (6) self-reported history of cancer (n 146), stroke (n 28), heart diseases (n 41), kidney failure (n 5), liver cirrhosis and hepatitis (n 9) and diabetes mellitus (n 73). Thus, the analysis included 2085 participants (1296 men and 789 women). A flow diagram of the participant enrolment is presented in online Supplementary Fig. 1.
Ethical approval
All participants received an explanation of the research prior to the measurements and provided written informed consent. The study was approved by the Research Ethics Committee of Waseda University (approval numbers: 2014–095, 2014-G002, 2018–320 and 2018-G001) and was conducted in accordance with the Declaration of Helsinki.
Assessment of coffee consumption and nutritional intake
Energy intake (kcal/d) and protein intake (g/d) were assessed using the brief-type self-administered diet history questionnaire (BDHQ), which has been validated in Japanese adults(Reference Kobayashi, Honda and Murakami18,Reference Kobayashi, Murakami and Sasaki19) . Consumption frequencies of coffee (< 1 cup/week, 1–3 cups/week, 4–6 cups/week or 1 cup/d and ≥ 2 cups/d), green tea (< 1 cup/week, 1–3 cups/week, 4–6 cups/week or 1 cup/d and ≥ 2 cups/d) and alcohol (< 1 d/week, 1–3 d/week, 4–6 d/week and every day) were each assessed using a single item included in the BDHQ. Another category of coffee consumption frequency (none, < 1 cup/week, 1 cup/week, 2–3 cups/week, 4–6 cups/week, 1 cup/d, 2–3 cups/d and ≥ 4 cups/d) was also assessed, and a sub-analysis was performed.
Assessment of muscle mass
Anthropometric measurements were performed in the morning by trained researchers after the participants had fasted for a minimum of 12 h. Height and body composition were measured with the participants wearing light clothing and no shoes. Appendicular skeletal muscle mass (ASM) was estimated using a multifrequency BIA (MC-980A, Tanita Corp.), as described previously(Reference Kawakami, Miyachi and Sawada14). To adjust for the effects of an individual’s physique, we divided the ASM (kg) by the square of height (m). Our previous study confirmed a strong correlation between ASM/height2 measured with the same BIA and ASM/height2 measured using dual-energy X-ray absorptiometry (Horizon A, Hologic Inc.) (r = 0·88 for men, r = 0·84 for women)(Reference Kawakami, Miyachi and Sawada14). The inter-instrument reliability between the two measurement methods for ASM was good (intraclass correlation coefficient = 0·88 for men and 0·76 for women)(Reference Kawakami, Miyachi and Tanisawa15). We defined low muscle mass based on the cut-offs for BIA-measured muscle mass values, as recommended by the Asian Working Group for Sarcopenia 2019(Reference Chen, Woo and Assantachai20); the ASM/height2 cut-offs were 7·0 and 5·7 kg/m2 for men and women, respectively.
Assessment of other variables
Leisure-time physical activity was assessed using the Global Physical Activity Questionnaire developed by the World Health Organisation(Reference Bull, Maslin and Armstrong21). Following the Global Physical Activity Questionnaire analysis guide, moderate-intensity and vigorous-intensity activities were assigned four and eight metabolic equivalents of task (MET), respectively. The amount of leisure-time physical activity (MET-min/week) was calculated by summing the amount of moderate- and vigorous-intensity leisure-time physical activities. Marital status (married and unmarried), education level (junior high or high school, junior college or technical college and university or higher), annual household income (< 3 000 000 JPY, 3 000 000–4 999 999 JPY, 5 000 000–6 999 999 JPY, 7 000 000–9 999 999 JPY and ≥ 10 000 000 JPY), cigarette smoking status (current smoker, former smoker and never smoked) and antihypertensive and anti-dyslipidaemic drug usage (user and non-user) were assessed using internet-based questionnaires.
Statistical analysis
For descriptive data, continuous variables are shown as median values (interquartile ranges), while categorical variables are presented as numbers (%). To investigate the association between coffee consumption and low muscle mass prevalence, we calculated multivariable-adjusted OR and 95 % CI using a logistic regression model with low muscle mass prevalence as the dependent variable and coffee consumption with the covariates as the independent variable. First, we calculated the OR, adjusting only for age (years) and sex (men and women). We subsequently expanded the models with the following covariates: cohorts (cohort C and cohort D), body fat (%), marital status (married and unmarried), education level (junior high or high school, junior college or technical college and university or higher), annual household income (< 3 000 000 JPY, 3 000 000–4 999 999 JPY, 5 000 000–6 999 999 JPY, 7 000 000–9 999 999 JPY and ≥ 10 000 000 JPY), cigarette smoking status (current smoker, former smoker and never smoked), frequency of alcohol consumption (< 1 d/week, 1–3 d/week, 4–6 d/week and every day), antihypertensive drug usage (user and non-user), anti-dyslipidaemic drug usage (user and non-user), energy intake (kcal/d), protein intake (g/d), green tea consumption (< 1 cup/week, 1–3 cups/week, 4–6 cups/week or 1 cup/d and ≥ 2 cups/d) and leisure-time physical activity (MET-min/week). These covariates were selected based on previous studies examining the association between coffee consumption and muscle mass(Reference Iwasaka, Yamada and Nishida10,Reference Chung, Moon and Kim11) . We calculated the E-values for the model covariates. The E-value represents the minimum strength of an association that an uncontrolled covariate would need to have with both the exposure (coffee consumption) and the outcome (low muscle mass) to have a significant impact on the OR(Reference Linden, Mathur and VanderWeele22,Reference VanderWeele and Ding23) .
Obesity was defined as a body fat percentage of ≥ 25 % for men and ≥ 30 % for women(Reference Okorodudu, Jumean and Montori24). Participants were classified into two groups by sex based on the median energy intake, protein intake or leisure-time physical activity. To investigate the interactions of the dichotomised covariates and three levels of coffee consumption with low muscle mass prevalence, the interaction terms (i.e., dichotomised covariates × three levels of coffee consumption) were entered together into the multivariate logistic regression model. These factors included the following: age (< 60 v. ≥ 60 years), sex (men v. women), body fat (< 25 v. ≥ 25 % for men, < 30 v. ≥ 30 % for women), marital status (married v. unmarried), education level (higher than university graduation v. lower education), annual household income (≥ 10 000 000 JPY v. lower income), cigarette smoking status (never smoked v. has smoked), alcohol consumption (< 1 v. ≥ 1 d/week), antihypertensive drug usage (user v. non-user), anti-dyslipidaemic drug usage (user v. non-user), energy intake (< 1990·0 v. ≥ 1990·0 kcal/d for men, < 1677·6 v. ≥ 1677·6 kcal/d for women), protein intake (< 74·6 v. ≥ 74·6 g/d for men, < 67·7 v. ≥ 67·7 g/d for women), green tea consumption (< 4 v. ≥ 4 cups/week) and leisure-time physical activity (< 480 v. ≥ 480 MET-min/week for men, < 240 v. ≥ 240 MET-min/week for women). Furthermore, we performed subgroup analyses for dichotomised values of age, sex, body fat, antihypertensive drug usage and leisure-time physical activity.
All statistical analyses were performed using SPSS Statistics version 27 (IBM Corp) and Stata version 17 (StataCorp). Statistical significance was defined by a P-value of < 0·05 for the two-sided tests. In interaction analysis, Bonferroni correction for multiple testing was applied to the significance level (14 tests, P for interaction < 0·003).
Results
Table 1 shows the characteristics of the participants according to the coffee consumption categories. The median age of the participants was 52 years (interquartile range, 46–59 years). The prevalence rate of low muscle mass was 5·4 % (n 113) and the median ASM/height2 was 7·6 kg/m2 (interquartile range, 6·5–8·3 kg/m2). In terms of coffee consumption, 10·0 % (n 208) consumed < 1 cup/week, 10·9 % (n 228) consumed 1–3 cups/week, 32·6 % (n 679) consumed 4–6 cups/week or 1 cup/d and 46·5 % (n 970) consumed ≥ 2 cups/d of coffee. The group with the highest coffee consumption (≥ 2 cups/d) tended to have a higher energy and protein intake and lower green tea consumption, and there were more current smokers and fewer antihypertensive drug users in this group.
Characteristics of the participants according to coffee consumption
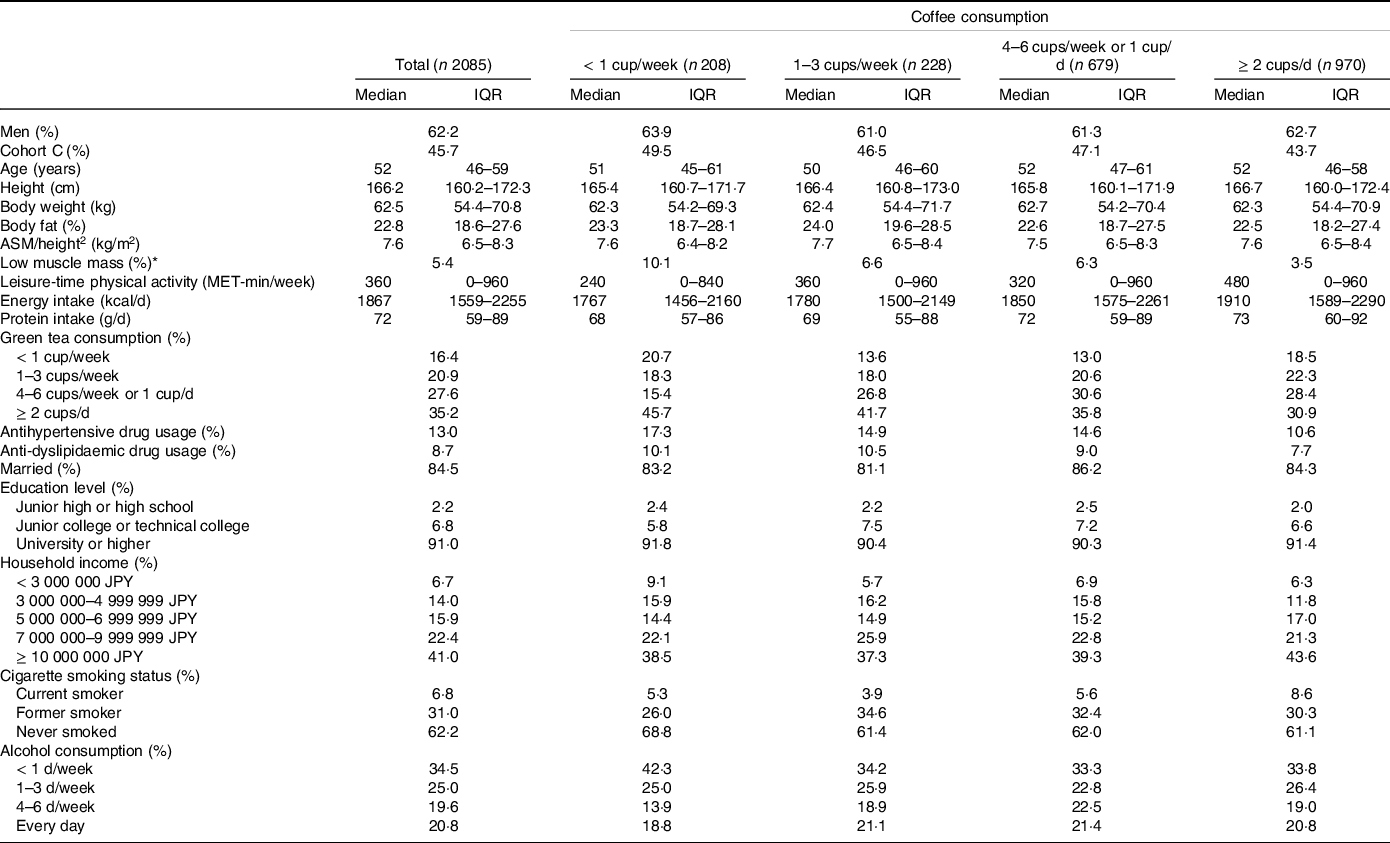
ASM, appendicular skeletal muscle mass; IQR, interquartile range; MET, metabolic equivalent of task.
Data are expressed as medians and IQR or %.
* Low muscle mass was defined based on the definition by the Asian Working Group for Sarcopenia 2019. The recommended cut-offs for appendicular skeletal muscle mass/height2 were determined by bioelectrical impedance analysis were < 7·0 kg/m2 and < 5·7 kg/m2 for men and women, respectively.
Table 2 shows the adjusted OR for low muscle mass prevalence for each covariate. Men, younger age, higher body fat and higher leisure-time physical activity were associated with a lower prevalence of low muscle mass.
OR for the prevalence of low muscle mass according to the study covariates
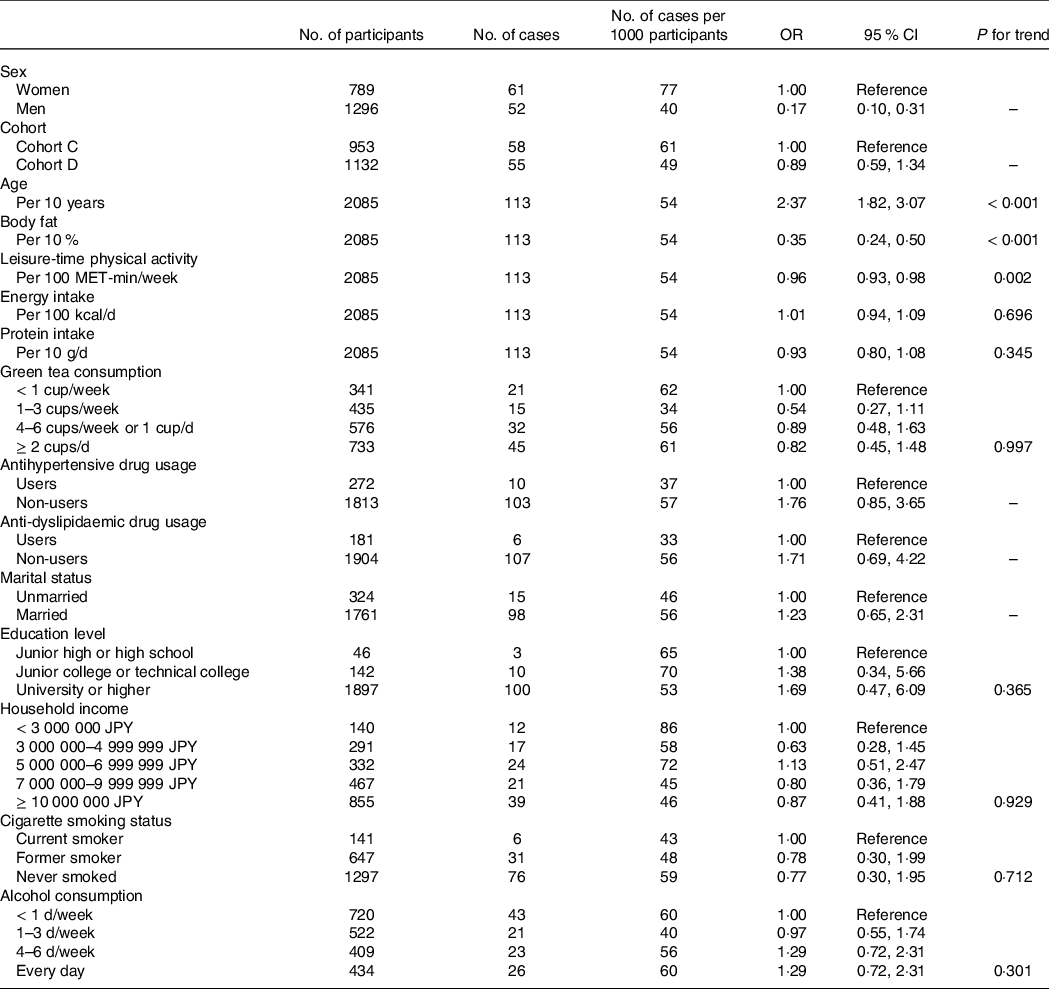
MET, metabolic equivalent of task.
Low muscle mass was defined based on the definition by the Asian Working Group for Sarcopenia 2019. The recommended cut-offs for appendicular skeletal muscle mass/height2 were determined by bioelectrical impedance analysis were < 7·0 kg/m2 and < 5·7 kg/m2 for men and women, respectively.
Adjusted for all items in the table plus coffee consumption (< 1 cup/week, 1–3 cups/week, 4–6 cups/week or 1 cup/d and ≥ 2 cups/d).
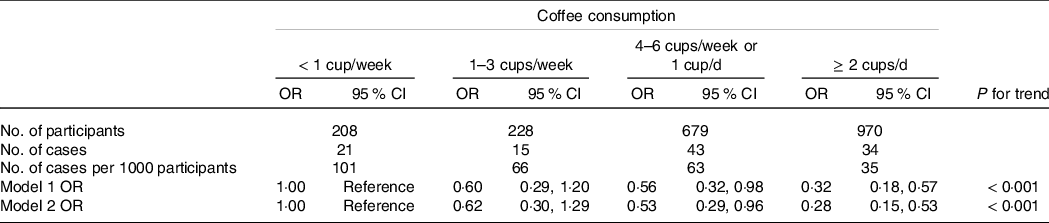
Table 3 shows the adjusted OR for low muscle mass prevalence according to coffee consumption. There was an inverse association between coffee consumption and low muscle mass prevalence (P for trend < 0·001). Compared with the lowest coffee consumption group (< 1 cup/week), multivariable-adjusted OR (95 % CI) for low muscle mass prevalence were 0·62 (0·30, 1·29), 0·53 (0·29, 0·96) and 0·28 (0·15, 0·53) in the 1–3 cups/week group, 4–6 cups/week or 1 cup/d group and ≥ 2 cups/d group, respectively. The E-value (model 2) of the OR for the ≥ 2 cups/d group was 6·60. We also performed a sub-analysis using another category of coffee consumption frequency in eight groups: none, < 1 cup/week, 1 cup/week, 2–3 cups/week, 4–6 cups/week, 1 cup/d, 2–3 cups/d and ≥ 4 cups/d. The association between coffee consumption and low muscle mass prevalence in the sub-analysis was similar to that found in the main analysis (P for trend < 0·001) (online Supplementary Table 1).
OR for the prevalence of low muscle mass according to coffee consumption
MET, metabolic equivalent of task.
Low muscle mass was defined based on the definition by the Asian Working Group for Sarcopenia 2019. The recommended cut-offs for appendicular skeletal muscle mass/height2 were determined by bioelectrical impedance analysis were < 7·0 kg/m2 and < 5·7 kg/m2 for men and women, respectively.
Model 1: Adjusted for age (years) and sex (men, women).
Model 2: Adjusted for model 1 plus cohort (cohort C, cohort D), body fat (%), marital status (married, unmarried), education level (junior high or high school, junior college or technical college, university or higher), household income (< 3 000 000 JPY, 3 000 000–4 999 999 JPY, 5 000 000–6 999 999 JPY, 7 000 000–9 999 999 JPY, ≥ 10 000 000 JPY), cigarette smoking status (current smoker, former smoker, never smoked), alcohol consumption (< 1 d/week, 1–3 d/week, 4–6 d/week, every day), antihypertensive drug usage (user, non-user), anti-dyslipidaemic drug usage (user, non-user), energy intake (kcal/d), protein intake (g/d), green tea consumption (< 1 cup/week, 1–3 cups/week, 4–6 cups/week or 1 cup/d, ≥ 2 cups/d) and leisure-time physical activity (MET-min/week).
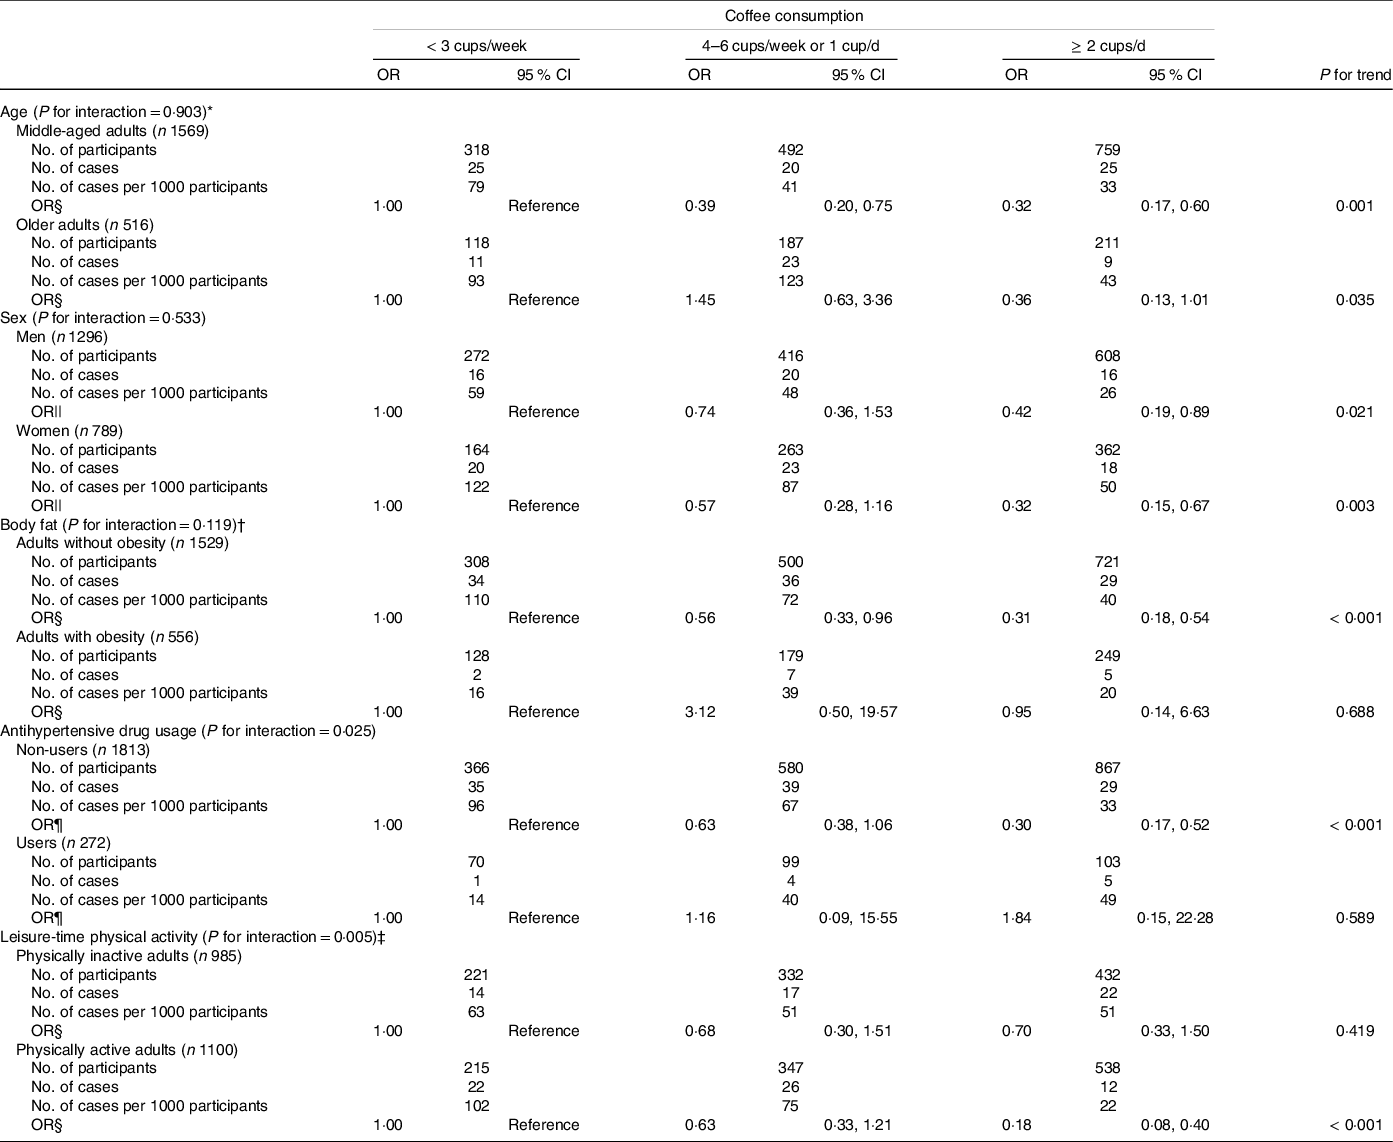
Table 4 shows the adjusted OR for low muscle mass prevalence according to coffee consumption in the subgroup analyses for dichotomised values of age, sex, body fat, antihypertensive drug usage and leisure-time physical activity. There were no significant interactions between coffee consumption and low muscle mass prevalence with the following factors: marital status (P for interaction = 0·318), education level (P for interaction = 0·170), household income (P for interaction = 0·216), cigarette smoking status (P for interaction = 0·974), alcohol consumption (P for interaction = 0·669), anti-dyslipidaemic drug usage (P for interaction = 0·658), energy intake (P for interaction = 0·136), protein intake (P for interaction = 0·358) and green tea consumption (P for interaction = 0·513). The inverse association between coffee consumption and low muscle mass prevalence was similar between men and women (P for interaction = 0·533). There were no significant interactions between low muscle mass prevalence and coffee consumption with age (P for interaction = 0·903) and body fat (P for interaction = 0·119). A tendency for interaction of low muscle mass prevalence with antihypertensive drug usage and coffee consumption was noted, but it was not significant after Bonferroni correction (P for interaction = 0·025). An inverse association between coffee consumption and low muscle mass prevalence was noted among non-users of antihypertensive drugs (P for trend < 0·001) but not among antihypertensive drug users (P for trend = 0·589). A tendency for interaction of leisure-time physical activity and coffee consumption with low muscle mass prevalence was also noted, but it was not significant after Bonferroni correction (P for interaction = 0·005). There was an inverse association between coffee consumption and low muscle mass prevalence among adults who performed physical activity (P for trend < 0·001), but not among adults with physical inactivity (P for trend = 0·419).
OR for the prevalence of low muscle mass according to coffee consumption in the subgroup analyses by study covariates
MET, metabolic equivalent of task.
Low muscle mass was defined based on the definition by the Asian Working Group for Sarcopenia 2019. The recommended cut-offs for appendicular skeletal muscle mass/height2 were determined by bioelectrical impedance analysis were < 7·0 kg/m2 and < 5·7 kg/m2 for men and women, respectively.
Significance level after Bonferroni correction for multiple testing of interaction: P for interaction < 0·003.
* Participants were divided into two groups: middle-aged adults (< 60 years) and older adults (≥ 60 years).
† Obesity was defined as body fat percentage ≥ 25 % for men and ≥ 30 % for women.
‡ Participants were divided into two groups using the median leisure-time physical activity by sex: physically inactive adults (< 480 MET-min/week for men and < 240 MET-min/week for women) and physically active adults (≥ 480 MET-min/week for men and ≥ 240 MET-min/week for women).
§ Adjusted for age (years), sex (men, women), cohort (cohort C, cohort D), body fat (%), marital status (married, unmarried), education level (junior high or high school, junior college or technical college, university or higher), household income (< 3 000 000 JPY, 3 000 000–4 999 999 JPY, 5 000 000–6 999 999 JPY, 7 000 000–9 999 999 JPY, ≥ 10 000 000 JPY), cigarette smoking status (current smoker, former smoker, never smoked), alcohol consumption (< 1 d/week, 1–3 d/week, 4–6 d/week, every day), antihypertensive drug usage (user, non-user), anti-dyslipidaemic drug usage (user, non-user), energy intake (kcal/d), protein intake (g/d), green tea consumption (< 1 cup/week, 1–3 cups/week, 4–6 cups/week or 1 cup/d, ≥ 2 cups/d) and leisure-time physical activity (MET-min/week).
|| Adjusted for age (years), cohort (cohort C, cohort D), body fat (%), marital status (married, unmarried), education level (junior high or high school, junior college or technical college, university or higher), household income (< 3 000 000 JPY, 3 000 000–4 999 999 JPY, 5 000 000–6 999 999 JPY, 7 000 000–9 999 999 JPY, ≥ 10 000 000 JPY), cigarette smoking status (current smoker, former smoker, never smoked), alcohol consumption (< 1 d/week, 1–3 d/week, 4–6 d/week, every day), antihypertensive drug usage (user, non-user), anti-dyslipidaemic drug usage (user, non-user), energy intake (kcal/d), protein intake (g/d), green tea consumption (< 1 cup/week, 1–3 cups/week, 4–6 cups/week or 1 cup/d, ≥ 2 cups/d) and leisure-time physical activity (MET-min/week).
¶ Adjusted for age (years), sex (men, women), cohort (cohort C, cohort D), body fat (%), marital status (married, unmarried), education level (junior high or high school, junior college or technical college, university or higher), household income (< 3 000 000 JPY, 3 000 000–4 999 999 JPY, 5 000 000–6 999 999 JPY, 7 000 000–9 999 999 JPY, ≥ 10 000 000 JPY), cigarette smoking status (current smoker, former smoker, never smoked), alcohol consumption (< 1 d/week, 1–3 d/week, 4–6 d/week, every day), anti-dyslipidaemic drug usage (user, non-user), energy intake (kcal/d), protein intake (g/d), green tea consumption (< 1 cup/week, 1–3 cups/week, 4–6 cups/week or 1 cup/d, ≥ 2 cups/d) and leisure-time physical activity (MET-min/week).
Discussion
In this cross-sectional study on middle-aged and older adults, we investigated the association between coffee consumption and low muscle mass prevalence, focusing on possible effect modification by demographic, health status-related and physical activity-related covariates. We found an inverse association between coffee consumption and the prevalence of low muscle mass. There were no significant interactions among the various covariates after Bonferroni correction.
Epidemiological studies on the association between coffee consumption and muscle mass are scarce; we are only aware of three cross-sectional studies. The Korean National Health and Nutrition Examination Survey in 2008–2011, which included 1781 men aged 60 years and older, reported an inverse association between coffee consumption and low muscle mass prevalence (determined by ASM/height2) when measured using dual-energy X-ray absorptiometry(Reference Chung, Moon and Kim11). They showed that men consuming ≥ 3 cups/d of coffee had a multivariable-adjusted OR (95 % CI) for low muscle mass prevalence of 0·44 (0·21, 0·94) compared to men consuming < 1 cup/d of coffee, after adjusting for age, smoking status, alcohol consumption, exercise, education level, household income, occupation status, protein intake and energy intake. Although the different methods of measurement and analysis preclude simple comparisons, this multivariable-adjusted OR was comparable to that in our analysis of men (OR = 0·42, 95 % CI = 0·19, 0·89). The Japan Multi-Institutional Collaborative Cohort Study in the Saga region, which included 6369 individuals aged 45–74 years, reported that higher coffee consumption was associated with a greater skeletal muscle mass/height2 (measured using a multifrequency BIA) in both men and women, after adjusting for age, fat mass index, smoking status, alcohol consumption, green tea consumption, energy intake, protein intake, anti-inflammatory drug usage, antihypertensive drug usage, antihyperlipidaemic drug usage and physical activity level (β = 0·023 for men, β = 0·011 for women)(Reference Iwasaka, Yamada and Nishida10). In addition, the Korean National Health and Nutrition Examination Survey in 2009–2010, which included 6906 men and women aged 40 years and older, examined the association between coffee consumption (< 1 time/d, 1 cup/d, 2 cups/d and ≥ 3 cups/d) and low muscle mass prevalence (determined by ASM/height2 measured using dual-energy X-ray absorptiometry). The results showed a lower prevalence of low muscle mass in men consuming 1 cup/d of coffee compared to those consuming coffee < 1 time/d (OR = 0·69, 95 % CI = 0·50, 0·94) but not in women, after adjusting for age, smoking status, alcohol consumption, macronutrients intake, exercise and family income, suggesting that light coffee consumption has a protective effect on the loss of muscle mass in men but not in women(Reference Kim and Park12). The findings of these studies support the results of our study that coffee consumption is associated with a lower prevalence of low muscle mass. To the best of our knowledge, only one longitudinal study has examined the association between coffee consumption and muscle mass. The Danish part of the Monitoring Trends and Determinants in Cardiovascular Disease cohort, which included 2128 men and women (median age of 46 years), did not find a clear association between changes in coffee consumption and changes in fat-free mass/height2 measured using a BIA, after adjusting for baseline measures of coffee consumption and fat-free mass/height2, age, sex, smoking status, physical activity, education level and menopausal status for women(Reference Larsen, Mikkelsen and Frederiksen13). Further longitudinal observational studies and randomised controlled trials are needed to elucidate the causal relationship between coffee consumption and muscle mass.
In this study, women, older age, lower body fat and lower leisure-time physical activity were associated with a higher prevalence of low muscle mass, and these covariates are well-known risk factors of sarcopenia, including low muscle mass(Reference Cruz-Jentoft, Landi and Topinková25). The results of this study suggested that there were no interactions between coffee consumption and low muscle mass prevalence with sex and age. Our subgroup analysis by body fat found that the inverse relationship of coffee consumption with low muscle mass prevalence was only noted among adults without obesity, which might be attributed to the fact that adults with obesity rarely had a low muscle mass. In contrast, a meta-analysis of epidemiologic studies reported that higher coffee consumption might be modestly associated with lower adiposity as indicated by BMI and waist circumference(Reference Lee, Lim and Kim26), which would underestimate the inverse relationship between coffee consumption and low muscle mass prevalence. Our subgroup analyses found that the inverse relationship of coffee consumption with low muscle mass prevalence was only present among physically active adults, but there was no significant interaction after Bonferroni correction. It is well-known that physical activity is one of the most modifiable major lifestyle factors that are essential in maintaining and increasing muscle mass(Reference Cruz-Jentoft and Sayer1,Reference Steffl, Bohannon and Sontakova27,Reference Dent, Morley and Cruz-Jentoft28) . Coffee is possibly effective in promoting increased muscle mass through a physiological effect on physical activity. A study in rats revealed that low-intensity exercise along with administration of caffeine and lactate compound effectively increased muscle mass, satellite cell activity and anabolic signals(Reference Oishi, Tsukamoto and Yokokawa29). However, several studies have reported that caffeine intake might be associated with higher physical activity(Reference Schrader, Panek and Temple30,Reference Tripette, Murakami and Hara31) . Further research is warranted to elucidate the causal relationships. We also found a tendency for interaction of antihypertensive drugs and coffee consumption with low muscle mass prevalence, but there was no significant interaction after Bonferroni correction. Only 272 of our participants were taking antihypertensive drugs; of these, only 10 had a low muscle mass, resulting in low statistical power. The effect of these factors merits further investigation with larger sample sizes.
Although the molecular mechanism by which coffee affects the maintenance of or increase in skeletal muscle mass is not fully understood, several animal-based studies have been reported (online Supplementary Fig. 2)(Reference Guo, Niu and Okazaki6–Reference Dirks-Naylor8). Unlike 4 weeks of normal-water treatment in control mice, 4 weeks of coffee treatment in aged mice increased the skeletal muscle weight, accelerated regeneration of injured muscles and decreased serum pro-inflammatory mediator levels (IL-1α, IL-6 and TNF-α)(Reference Guo, Niu and Okazaki6). Furthermore, coffee increased the proliferation rate and DNA synthesis of satellite cells, which play a central role in the growth and regeneration of skeletal muscle mass, through the Akt signaling pathway(Reference Guo, Niu and Okazaki6). In a study using mice, 7 weeks of coffee supplementation suppressed myostatin mRNA expression, increased the expression of an insulin-like growth factor and promoted skeletal muscle hypertrophy(Reference Jang, Son and Kim7).
Because sarcopenia, including low muscle mass, can lead to metabolic diseases, falls, fractures and all-cause mortality(Reference Xia, Zhao and Wan2,Reference Xu, Wan and Ktoris3) , the findings of the present study could contribute to the development of sarcopenia prevention interventions and have a public health impact. Coffee consumption is a modifiable factor, and our findings may facilitate further research on new sarcopenia prevention strategies. However, our study has several limitations. First, because this was a cross-sectional study, causality could not be determined. Second, there is a possibility that residual and unmeasured confounders affected our results. However, the E-value of 6·6 in this study is considered large, indicating that the effects of confounding factors are unlikely to have significantly affected the results. Third, the consumption frequency of coffee was assessed using a single item. The quantity of one cup of coffee was assumed to be a typical one cup (150–173 ml) in the questionnaire. Therefore, information on specific quantities and types of coffee could not be obtained. However, the use of sugar in coffee and tea (always, sometimes and none) was also assessed in the BDHQ and was taken into account in the energy intake of the covariate. Fourth, because leisure-time physical activity was self-reported by the study participants, there is a possibility of overreporting due to social desirability(Reference Adams, Matthews and Ebbeling32). However, overreporting of physical activity generally causes an underestimation of the true effects on the health benefits of physical activity. Although muscle-strengthening exercise is heavily influential on muscle mass, the Global Physical Activity Questionnaire we used to assess leisure-time physical activity could not assess the effect of muscle-strengthening exercises. Further research is needed to examine the effect of different types of leisure-time physical activities on the association between coffee consumption and muscle mass. Finally, the generalisability of the results may be limited because the study participants were Waseda University alumni and their spouses who participated voluntarily, and the participants in cohorts C and D voluntarily selected one of the four courses (cohorts A–D) with different measurement items. Although there were no severe differences in the participant characteristics between cohorts A–B and C–D that would change the direction of our results (data not shown), the results might have been affected by selection bias. Moreover, because only a few participants reported heavy coffee consumption (i.e., ≥ 4 cups/d), we could not adequately examine the effect of heavy coffee consumption. Longitudinal studies involving several populations and randomised controlled trials are required to resolve these issues.
In conclusion, our cross-sectional study revealed that coffee consumption may be inversely associated with the prevalence of low muscle mass. Further longitudinal studies with large representative samples are necessary for a definitive assessment of causality.
Acknowledgments
The authors would like to thank the study participants. We are also grateful to the staff of WASEDA’S Health Study for their assistance with data collection. This research project was performed in collaboration with the Public Health Research Foundation’s Institute of Stress Science, Tokyo, Japan.
This work was supported by a Grant-in-Aid for Early-Career Scientists (R.K., grant numbers JP18K17982 and JP21K17693) and Scientific Research (I.M., grant numbers JP26242070 and JP19H04008), (M.H., grant number JP18H03198) from the Japan Society for the Promotion of Science; MEXT-Supported Program for the Strategic Research Foundation at Private Universities from the Ministry of Education, Culture, Sports, Science and Technology (K.O., grant number S1511017). The funders had no role in the study design; collection, analysis or interpretation of the data or preparation, review or approval of the manuscript.
R. K. developed the study hypothesis, conducted the survey, performed the data analysis and wrote the first draft. K. T., T. I., C. U., K. I., I. M., K. S., S. S., M. H. and K. O. conducted the survey and critically revised the manuscript. All authors approved the final manuscript.
There are no conflicts of interests.
Supplementary material
For supplementary material/s referred to in this article, please visit https://doi.org/10.1017/S0007114522003099


 Open access