





Depression is a major public health concern globally. Approximately 332 million people worldwide experience depressive symptoms(1). In Kenya, the burden of depression is high at 1·9 million cases, placing it among the top five countries for depression in sub-Saharan Africa(2). Further, nearly 25 % and 40 % of outpatient and inpatients, respectively, suffer from depression, followed by stress and anxiety disorders(Reference Marangu, Mansouri and Sands3). In 2019, depression accounted for 33 % of the total disability adjusted life years among adults(Reference Kumar, Njuguna and Amin4). Although the specific aetiology of depression is unknown, current evidence attributes the occurrence of depression to a complex interaction of social(Reference Larsen, Pintye and Marwa5), genetic, environmental(Reference Saveanu and Nemeroff6) and biological factors(Reference Henning7). Given the burden that depression places on both individuals’ quality of life and the public health system(Reference Buckman, Underwood and Clarke8,Reference Hammen9) , it is important to examine how modifiable lifestyle factors such as diet shape depression outcomes. This need is especially critical in settings where undernutrition and depression frequently co-occur.
An increasing body of evidence suggests that diet may be utilised as part of a prevention strategy for depression. Diet affects various physiological processes that may play a role in the onset of depression, such as inflammation, oxidative stress or hormonal influences(Reference Jacka, Pasco and Mykletun10). However, compared with other non-communicable diseases, the role of diet in the prevention of depression is still a relatively new field of research(Reference Sanchez-Villegas and Martínez-González11), particularly in low-income settings. Moreover, prior research on the effect of diet on depression has focused on single nutrients or foods only(Reference Murakami and Sasaki12–Reference Duodu, Okyere and Akyirem15). But, of course, different populations across different settings consume different combination of food groups(Reference Akbaraly, Sabia and Shipley16,Reference Hu17) . The consumption of diverse food groups may synergistically interact with each other resulting in larger effect sizes that can modify the progression of depression, compared with the consumption of individual food group whose effect size maybe too small to be clinically meaningful(Reference Hu17). Thus, examining the consumption of different food groups (‘dietary diversity’) and its relationship with depression outcomes may provide information on more realistic and effective intervention targets than from evaluation of single nutrients alone.
Previous studies on the association between dietary diversity and depression have been confined to high-income countries with mixed results. In high-income countries, some previous research has found that dietary diversity is negatively associated with the risk of depression(Reference Dipnall, Pasco and Meyer18–Reference Oliván-Blázquez, Aguilar-Latorre and Motrico24). Yet, other high-income country studies showed no association between dietary diversity and risk of depression(Reference Gougeon, Payette and Morais25–Reference Chatzi, Melaki and Sarri28). The inconsistent findings between studies in high-income countries and contextual differences in dietary intake and patterns limit the generalisability of study findings to low-income settings, particularly in sub-Saharan Africa. While limited, emerging scientific evidence in sub-Saharan Africa supports the association between dietary diversity and maternal depression(Reference Kalam, McCann and Shakil29,Reference Madeghe, Kogi-Makau and Ngala30) and dietary self-care adherence and risk of depression among people living with diabetes(Reference Duodu, Okyere and Akyirem15). Because these studies focus on specific population sub-groups, a knowledge gap remains in understanding this relationship in rural Western Kenya. We hypothesised that participants who reported higher dietary diversity would experience lower depressive symptoms compared with participants who reported lower dietary diversity in rural Western Kenya.
Materials and methods
Study population and setting
We conducted a cross-sectional study within two neighbouring rural communities with similar socio-demographic characteristics in Milo and Matulo wards located within Webuye sub-County of Bungoma County in rural Western Kenya. Each ward had a population of approximately 15 000 residents at the time of survey (see Supplementary Figure). Bungoma County is a catchment area for the on-going population health initiatives under the Academic Model Providing Access to Healthcare. Academic Model Providing Access to Healthcare is a consortium of North American Universities, Moi University and Moi Teaching and Referral Hospital in Kenya. Under Academic Model Providing Access to Healthcare, a group-based microfinance program has been established, the Bridging Income Generation through grouP Integrated Care. We used purposive sampling to draw 312 participants and excluded one observation with missing dietary diversity data, resulting in analytic sample of 311 eligible study participants. These participants were obtained from a current roster of 4545 active Bridging Income Generation through grouP Integrated Care microfinance members spread across the program areas for Milo and Matulo. Eligible study participants were required to be 18 years and older, current residents of Milo and Matulo wards for at least one year and provided informed consent to participate in the study. Prior to the administration of the actual survey, a trained local researcher fluent in the local dialect of participants translated the data collection instrument into (‘Kibukusu’) language for ease of comprehension, and to ensure cultural appropriateness. We then pre-tested the questionnaire in a small sample (n 5) of study participants to evaluate the data collection instrument for face validity and study procedures. Feedback results from pre-testing were used to inform adjustments on data collection tool and study procedures and correct for any errors that emerged. Participants who were interviewed during the pilot were not included in the final analytic sample. We collected primary data between June and August 2025. Prior to data collection activities, three local fieldworkers were recruited and trained on the study background, objectives, research ethics and data collection using REDCap(Reference Harris, Taylor and Minor31) software installed on tablets. The electronic questionnaire captured information on socio-demographic characteristics, dietary diversity and depressive symptoms.
Assessment of dietary diversity
The independent variable of interest (exposure) was dietary diversity. To measure dietary diversity, we assessed all the five food groups consumed by participants during the reference recall period of 24 h using a validated dietary quality questionnaire in Kenya(32). The scale was appropriate to measure dietary diversity because it uses sentinel food approach that counts the number of context-specific food groups regularly consumed by the vast majority of Kenyan population(32) and has also been validated in similar setting from sub-Saharan Africa(Reference Uyar, Brouwer and Herforth33). We dichotomised dietary diversity based on established thresholds for five recommended food groups from prior literature to create a binary variable where dietary diversity was equal to 1 if participants consumed all the five food groups, and 0 if participants consumed less than the five food groups(32,Reference Herforth, Wiesmann and Martínez-Steele34) . Participants were asked, “yesterday did you and your family eat any of the following food groups?” starch (e.g. Maize ugali, maize porridge, rice, bread, chapati, injera, pasta or noodles); fruits (e.g. Pawpaw, mango, passion fruit or matunda ya damu); vegetables (e.g. collard greens, Ethiopian kale, spinach, nightshade, amaranth, saget or cowpea leaves); animal proteins (e.g. goat meat, beef, minced beef, mutton, liver or matumbo) and pulses, nuts or seeds. The greater the number of food groups consumed, the higher the likelihood that participants received all the necessary nutrients required for a healthy diet.
Assessment of depressive symptoms
The dependent variable of interest (outcome) was depressive symptoms, measured using the Centre of Epidemiologic Studies Depression Scale(Reference Radloff35). The CES-D scale had been previously validated in four sub-Saharan African countries, including Kenya, among populations with socio-economic and demographic characteristics similar to our study sample, particularly community-based, low-resource settings. In a comparable Kenyan population, the CES-D demonstrated good internal consistency, with Cronbach’s α ranging from 0·85 to 0·90(Reference Hamby, Frndak and Schluck36). Participants were asked twenty questions that describe ‘How often have you been bothered by any of the following problems during the past one week?’ The response for each problem was rated on a four-point Likert Scale with the options ‘0 = rarely or none of the time,’ ‘1 = sometime or little of the time,’ ‘2 = occasionally or moderate amount of the time,’ ‘3 = most or all of the time.’ The participants’ responses were coded as 0, 1, 2, 3 from ‘rarely or none of the time’ to ‘most or all of the time,’ and four positively worded responses reverse coded, giving a cumulative score ranging from 0 to 53, which reflected the severity of depression over the last seven days. Higher scores indicated higher depressive symptoms.
Covariates
We used a set of covariates to characterise the study sample and adjust for confounding. Specifically, age was self-reported as the number of years from the date of birth, sex was self-reported as either male or female, educational attainment was self-reported as ‘some primary,’ ‘primary,’ ‘secondary’ and ‘post-secondary’, household size was self-reported as the number of people in the household during the study period, marital status was self-reported as ‘never married,’ ‘currently married,’ and ‘divorced or separated’, work status self-reported as either worked outside home for income or not in the past 30 days. We calculated a weighted wealth index derived from twenty household items and categorised participants into quartiles as per the standard procedures of the 2022 Kenya Demographic Health Survey(37).
Statistical analysis
We fit linear regression models to estimate the association between high dietary diversity and continuous depression scores, and to assess the severity of depressive symptoms in the study population. We further explored the potential differences in associations between dietary diversity and depressive symptoms in low- and high-wealth status backgrounds, by including an interaction term between dietary diversity and wealth status. We conducted a secondary analysis using quantile regression to estimate the associations across the distribution of depressive symptoms scores, and reported the point estimates with their respective 95 % confidence intervals and P-values. Because the distribution of scores for depressive symptoms was highly skewed and bounded (0–53), we categorised depression outcome into ordered severity levels based on established CES-D cut-offs (≤ 16: none/mild; 17–23: moderate; and ≥ 24: severe)(Reference Park and Yu38) We then conducted a sensitivity analysis using an ordinal logistic regression model. The ordinal logistic regression approach treats the scores for depressive symptoms as ordered categorical outcome variable, and reduces the influence of extreme outliers to allow for flexible assessment of the association between dietary diversity and ordered scores for depressive symptoms. We then compared the results from the ordinal logistic regression with those from the linear regression model to determine if there were changes in the magnitude and direction of effect estimates.
Covariate adjustment
We considered the following covariates as potential confounders: wealth, age, education attainment, marital status and household size. Our primary adjustment set included only the covariates that were statistically associated with dietary diversity: wealth and education. Given that this covariate set may not sufficiently capture all measured confounders, we compared these adjusted results to models adjusted for the full covariate set. To assess the sensitivity of our results to any unmeasured confounding, we computed E-values for the relationship between dietary diversity and depressive symptoms. The E-value on a risk ratio scale measures the minimal degree of association that unmeasured confounder would have on the exposure and outcome to completely explain away the observed association. We examined how the magnitude of E-value relates to the observed association for the measured covariates included in the model. All statistical analyses were conducted using R statistical software (version 4.4.2).
Results
Sample characteristics
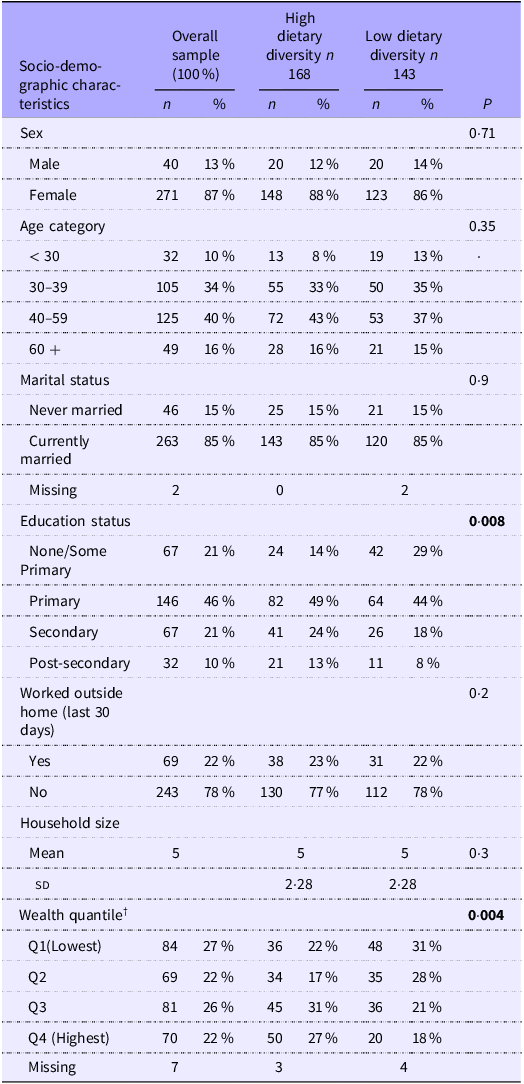
We interviewed 311 eligible participants from a current roster of 4545 current Bridging Income Generation through grouP Integrated Care participants during the study period. From the overall sample, most participants were women (87 %), currently married (85 %) and did not work outside their homes in the last 30 days for income (78 %). The mean household size was five members (sd = 2·28). Most participants age ranged between 30 and 59 years with a median age of 40 years. Compared with participants with lower dietary diversity, participants with higher dietary diversity were more likely to have attained secondary and post-secondary education and be in the highest wealth quantile (Table 1).
Study population characteristics in the full sample and by household dietary diversity exposure status (n 311)

Table 1. Long description
The table presents socio-demographic characteristics of a study population of 311 participants, divided into groups with high and low dietary diversity. It includes data on sex, age category, marital status, education status, work status, household size, and wealth quantile. The table has 11 rows and 8 columns, with column headers including Socio-demographic characteristics, Overall sample, High dietary diversity, and Low dietary diversity. Notable trends include a higher percentage of women (87%), currently married individuals (85%), and those not working outside the home (78%). Participants with higher dietary diversity are more likely to have secondary or post-secondary education and belong to the highest wealth quantile.
Boldface denotes statistically significant associations (P < 0.05).
P value reported for χ 2 test of categorical variables and t test for continuous variables.
† Wealth quartile calculated from a composite score of twenty household items owned by each participant household.
Association between dietary diversity and depression
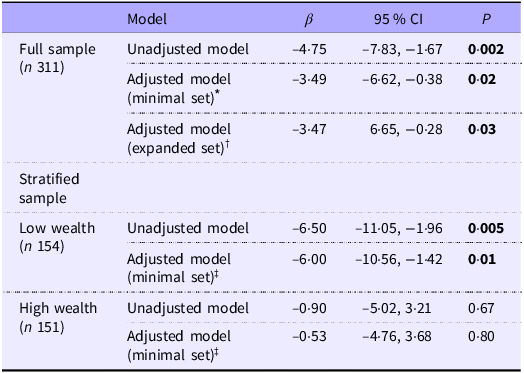
In the unadjusted linear model, higher dietary diversity was associated with lower depressive symptoms (unadjusted β (95 % CI): −4·75 (–7·83, −1·67)). In the model adjusted for wealth and education, we found that higher dietary diversity was associated with over three points lower depressive symptom scores (adjusted β (95 % CI): −3·49 (–6·62, −0·38)). The model with the expanded set of covariates (age, household size, wealth, education attainment, work status and marital status) produced a point estimate (adjusted β (95 % CI): −3·47 (–6·65, −0·28)) that was similar in magnitude and direction to the model adjusted for only wealth and education. The interaction between dietary diversity and wealth status suggested differences in the magnitude and direction of the relationship between low- and high-wealth status (Wald P-value for interaction term = 0·0003). In the wealth-stratified model adjusted for education, the association between dietary diversity and depressive symptoms was stronger in those with low-wealth backgrounds (adjusted β (95 % CI): −6·00 (–10·56, −1·42)) relative to those with high-wealth backgrounds (adjusted β (95 % CI): −0·53 (–4·76, 3·68); Wald P-value for interaction term = 0·0003 (Table 2).
Linear regression estimates for the association between household dietary diversity and depression scores overall and stratified by wealth status

Table 2. Long description
The table presents linear regression estimates for the association between household dietary diversity and depression scores, both overall and stratified by wealth status. It includes data for a full sample of 311 participants and a stratified sample divided into low wealth (154 participants) and high wealth (151 participants). The table has 10 rows and 5 columns, with headers for Model, Beta, 95% Confidence Interval, and P-value. The full sample data includes unadjusted and adjusted models with different sets of covariates. The stratified sample data includes unadjusted and adjusted models for low and high wealth groups. Notable trends include a stronger association between dietary diversity and depressive symptoms in the low wealth group compared to the high wealth group.
β, beta coefficient.
Wald P-value for interaction term; P < 0·0003.
Boldface denotes statistically significant associations (P < 0.05).
* Minimally adjusted model for wealth and education.
† Expanded adjusted model for wealth, education, work status, marital status, age and household size.
‡ Adjusted model for education.
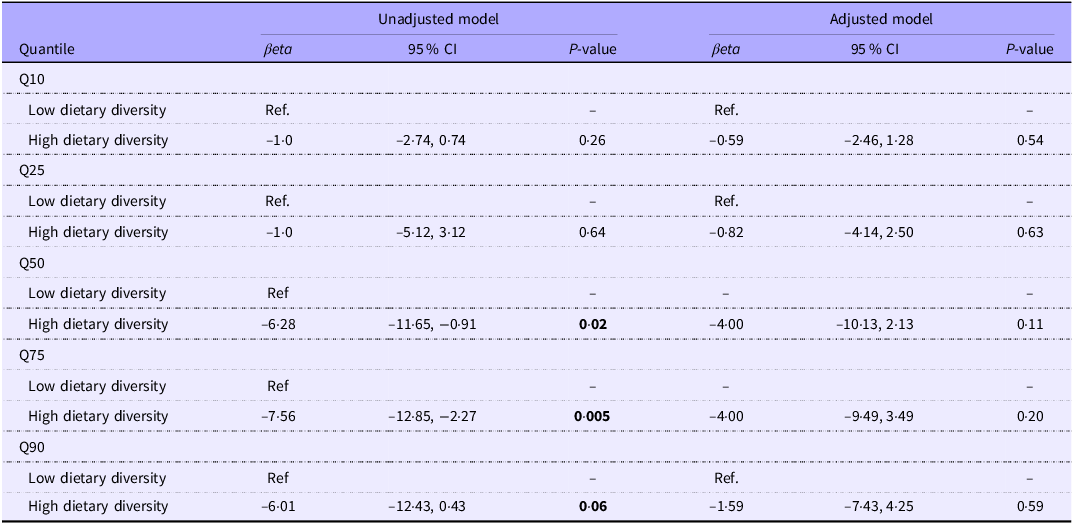
To further explore how the association varied across the distribution scores for depressive symptoms, we conducted a secondary analysis using quantile regression. Across all quantiles, the effect estimates consistently indicated lower scores for depressive symptoms among participants with higher dietary diversity, showing a negative association in both unadjusted and adjusted models. In the unadjusted model, the associations were strongest, with larger effect sizes observed across 75th (Q75: β = −7·56; 95 % CI: −12·82, −2·27) and 90th (Q90: β = −6·01; 95 % CI: −12·43, 0·43) quantiles, compared with effect sizes observed across lower quantiles for 10th (Q10: β = −1·0; 95 % CI: –2·74, 0·74) and 90th (Q90: β = −1·0; 95 % CI: −5·12, 3·12) quantiles. After adjustment for wealth and education, the magnitude of the associations was substantially attenuated, with the 95 % CI crossing the null at the 10th (Q10: β = −0·59; 95 % CI: −2·46, 1·28), 25th (Q25: β = −0·82; 95 % CI: −4·14, 2·50), 75th (Q75: β = –4·00; 95 % CI: –10·13, 2·13) and the 90th (Q90: β = –1·59; 95 % CI: –7·43, 4·25). Despite this attenuation, the direction of the association remained consistently negative across higher quantiles, suggesting an association with low depressive scores, albeit with reduced precision of the point estimates. Overall, these findings indicate that although covariate adjustment weakened the statistical precision of the associations, the general increasing trend of the effect sizes for the observed association between higher dietary diversity and lower depressive symptom scores persisted, particularly among individuals with more severe depressive symptoms. (Table 3).
Quantile regression estimates for the association between dietary diversity and depression scores across quantiles (n 311)

Table 3. Long description
The table presents quantile regression estimates for the association between dietary diversity and depression scores across different quantiles. It includes data for the 10th, 25th, 50th, 75th, and 90th quantiles, comparing unadjusted and adjusted models. The table has 11 rows and 7 columns, with headers for Quantile, Unadjusted model (beta, 95% CI, P-value), and Adjusted model (beta, 95% CI, P-value). Each row provides specific data points for low and high dietary diversity across the quantiles. Notable trends include stronger negative associations in the unadjusted model, particularly at the 75th and 90th quantiles, which weaken after adjustment for wealth and education. Despite this attenuation, the direction of the association remains negative, indicating lower depressive scores with higher dietary diversity, especially among individuals with more severe symptoms.
Covariates in the minimal adjustment set were education and wealth.
Boldface indicates significant finding; P < 0·05.
Sensitivity analysis
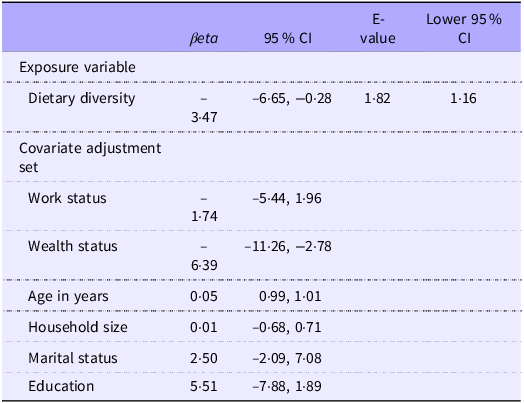
To explore how much unmeasured confounding might have influenced our results, we calculated the E-value for the association between dietary diversity and depression. The E-value for the adjusted effect estimate was 1·82, meaning that an unmeasured confounding factor would need to be fairly strongly related to both dietary diversity and depressive symptoms by a risk ratio of at least 1·82 each, to completely explain away the observed association. The lower bound of the 95 % confidence interval corresponded to an E-value of 1·16, indicating that unmeasured confounder with a more modest association could move the 95 % CI to overlap the null. Our sensitivity analysis results showed that the E-value for the point estimate was 1·82 (95 % CI lower bound: 1·16), suggesting that unmeasured confounder would need to have an association with both dietary diversity and depressive symptoms that is larger in magnitude than most of the measured covariates included in the model: age, work status, household size, wealth status and education, which were a priori considered among the strongest confounders to fully explain away the observed association. Overall, these results indicate that the observed association was reasonably robust to unmeasured confounding (Table 4). In another sensitivity analysis using ordinal logistic regression model, higher dietary was associated with lower cumulative odds of more severe depressive symptoms (adjusted odds ratio (AOR) = 0·64; 95 % CI: 0·41, 1·00), suggesting that, across thresholds, participants with higher dietary diversity had approximately 36 % lower cumulative odds of being in a worse depression category, after adjusting for covariates (see Supplementary Table). These results were consistent with our main results from linear regression model, indicating the robustness of our findings to alternative model specifications.
Linear regression estimates for covariates and E-value for the dietary diversity exposure

Table 4. Long description
The table presents linear regression estimates for various covariates and the E-value for the dietary diversity exposure. It includes columns for beta values, 95 percentage confidence intervals, E-values, and lower 95 percentage confidence intervals. The exposure variable, dietary diversity, has a beta range from negative 6.65 to 3.47. Covariate adjustments include work status, wealth status, age in years, household size, marital status, and education. Notable trends include the wide confidence intervals for wealth status and education, indicating significant variability. The E-value for dietary diversity is 1.82, suggesting robustness to unmeasured confounding.
E-value, evidence value.
Discussion
We examined the relationship between higher dietary diversity and depressive symptoms in rural Western Kenya. We found that higher dietary diversity was associated with lower depressive symptoms, particularly among participants from low-wealth backgrounds. We also found that the strength of association differed across the distribution of depression scores: Higher dietary diversity tended to be more strongly associated with lower depression scores in individuals with more severe symptoms. These findings highlight the potential of improving dietary diversity as a strategy to address mental health, particularly among individuals from lower-wealth backgrounds, and those with severe depression symptoms in low-resource settings.
Our main findings align with much of the evidence base in high-income countries, supporting the conclusion that higher dietary diversity is associated with lower depressive symptoms(Reference Akbaraly, Sabia and Shipley16,Reference Dipnall, Pasco and Meyer18–Reference Lai, Hiles and Bisquera21,Reference Oliván-Blázquez, Aguilar-Latorre and Motrico24,Reference Geldsetzer, Vaikath and Wagner39–Reference Matta, Hoertel and Airagnes42) . However, the strong associations we observed between dietary diversity and lower depressive symptoms among individuals from lower-wealth backgrounds was unexpected. A previous study found that food security was more strongly related to better psychological outcomes in high-income and education households compared with low-income and education households(Reference Militao, Uthman and Salvador43). The inconsistent findings may be explained by differences in how socio-economic status was measured between our study and prior work. In our study, wealth status was examined as an effect measure modifier for the association between dietary diversity and depressive symptoms, whereas the previous study used income and educational attainment as effect measure modifiers in assessing the relationship between food insecurity and depression outcome. These differences in the operationalisation of socio-economic status may have contributed to the observed discrepancies in results.
There are plausible pathways through which higher dietary diversity maybe associated with lower depressive symptoms. First, the consistent consumption of diverse food groups, specifically vegetables, cereals and proteins, may reduce oxidative stress and inhibit brain signalling, which could lead to reduced depressive symptoms among adults(Reference Lai, Hiles and Bisquera21). Specifically, the protective role of fibres found abundantly in vegetables and cereals, and fruits may prevent the onset of depressive symptoms by modifying the composition and activity of microbiota in the digestive system through the gut–brain axis and metabolic mechanisms involved in depression(Reference Liu, Cao and Zhang44,Reference Sanchez-Villegas, Zazpe and Santiago45) . Second, adequate dietary diversity may be associated with lower depression scores by providing broader and more sufficient nutrients, which can lower dietary inflammatory potential, support neurotransmitter synthesis, stabilise glycaemic control and reduce psychosocial stressors associated with the occurrence of depressive symptoms(Reference Jacka, O’Neil and Opie46). Finally and through psychosocial and socioeconomic pathways, higher dietary diversity may be associated with low risk for depression by reducing food insecurity and economic stress, which are established risk factors for depression(Reference Pengpid and Peltzer47), particularly among the socio-economically disadvantaged population sub-groups.
Some aspects of our current study require careful interpretation of results. Because we measured depression and dietary diversity at the same time point, we were unable to establish the temporal ordering between the two variables. Consequently, reverse causality cannot be ruled out. Future prospective studies should clarify the directionality of the observed association in these settings. Measurement error may have influenced our observed results, particularly stemming from social desirability bias in both depression and dietary diversity. To minimise the potential for social desirability bias, research assistants were trained to appropriately probe sensitive questions, and all validated instruments were translated into participants’ local language. The depression and dietary diversity measures were pilot-tested using tools previously validated and applied in a comparable settings. In addition, an introductory statement was included in the questionnaire to normalise experiences of depressive symptoms and encourage honest reporting. However, we acknowledge that some social desirability bias may have remained as well as measurement error from other sources: participant not understanding questions, and questions not reliably measuring the intended constructs.
Adequate control of confounding was a major concern in our study. We attempted to address this concern by controlling for wealth and education in the primary adjusted model, which were statistically associated with both dietary diversity and depressive symptoms. We then compared the magnitude of the effect estimates to a model that included all the measured covariates. The results suggested no statistically significant differences in either the magnitude or direction of the point estimates between the primary and fully adjusted models. The consistent results indicate that the observed association was not materially influenced by the inclusion of additional covariates, supporting the robustness and stability of our findings. We also computed E-values to assess for the minimum strength that an unmeasured confounder would need to have to completely explain away the observed association. The E-value analysis indicated that the observed association was reasonably robust to unmeasured confounding, thus strengthening the confidence in our findings. However, the possibility of uncontrolled, and residual confounding may have influenced our results, and future research using more robust approaches (e.g., natural experiments and cluster randomised controlled trials) would help strengthen inference.
Because our study sample was drawn from a non-probabilistic subset of microfinance members, it may not be fully representative of the target population. Furthermore, our study sample was restricted to participants in a group-based microfinance program in rural Western Kenya, so the generalisability of our findings to broader populations is untested. However, the plausible pathways through which we may have observed the association between dietary diversity and depressive symptoms (biological and socioeconomic pathways) may hold true across populations, supporting cautious generalisability of our study findings to other similar microfinance program contexts. Finally, our relatively small analytic sample may have resulted in imprecise effect estimates and that our study is likely underpowered to detect small effects and effects in smaller sub-groups. Future studies using large samples should confirm the generalisability of these findings using random sampling strategy and include more diverse populations to enhance external validity. Nevertheless, our study adds to the existing literature, the evidence on the association between higher dietary diversity and lower depressive symptoms from rural Western Kenya where depression and undernutrition often co-occur.
Conclusion
We found that high dietary diversity was associated with lower depressive symptoms, particularly among vulnerable individuals, and those with severe depression in rural Western Kenya, which is consistent with evidence from studies conducted in high-income countries. Future research in low-resource settings should prioritise longitudinal and quasi-experimental designs to strengthen causal inference and identify the mechanisms through which dietary diversity may influence depression.
Supplementary material
For supplementary material/s referred to in this article, please visit https://doi.org/10.1017/S0007114526107673
Acknowledgements
We are grateful to the (Bridging Income Generation through grouP Integrated Care) microfinance program participants who volunteered to participate in this study and to all the staff members of the Academic Model Providing Access to Healthcare who contributed to the successful completion of this study.
The research was supported by the Faculty and Graduate Research Promotion Incentive Award (Grant number GR000702) of the Indiana University School of Public Health-Bloomington, Indiana, USA.
C. O.: Study concept, funding acquisition, methodology, data analysis, writing, review and editing. J. O.: Project administration, study staff recruitment and data collection. J. A.: Review and editing. S. P.: Review and editing. M. R.: Funding acquisition, methodology, editing and supervision. All the authors read and approved the final manuscript.
All authors declared no competing interests
The study was conducted according to the guidelines laid down in the Declaration of Helsinki, and all procedures involving human participants were approved by the (Indiana University Institutional Review Board (#25993)), and (Moi University Institutional Research and Ethics Committee (#0005080)). Permission to conduct the study was granted by the Kenya National Commission for Science, Technology, and Innovation (#P/25/4175009). Written and verbal informed consent was obtained from all participants. Verbal consent was witnessed and formally recorded.
The primary data for this study are not publicly available due to sensitive information about study participants. However, they may be made available upon reasonable request to the corresponding author.


 Open access

