


“It’s probably the worst thing that happened to the Congress”
—Representative Don Young (R-AK) on the introduction of C-SPAN.Footnote 1
Representative Young is not alone in his assessment that when the cameras are rolling, policymaking processes deteriorate and outcomes are altered. Representative Jeff Jackson (D-NC) said in 2023, “I’ve been in committee meetings that are open to the press and committee meetings that are closed. The same people who act like maniacs during the open meetings are suddenly calm and rational during the closed ones. Why? Because there aren’t any cameras in the closed meetings.”Footnote 2 Outside observers share similar perspectives: Supreme Court Justice Sonia Sotomayor said on The Daily Show “…the partisanship in the Senate started to grow when cameras went into the Senate room.”Footnote 3 Live coverage of the legislative process is intended to increase transparency, but could reward intransigence or extremity, which may have deleterious effects on institutional processes and outcomes.
Not all observers believe that televised coverage fans the flames of partisanship. In January of 2023, C-SPAN cameras were rolling for a series of contentious votes to elect the Speaker. The footage was widely viewed by the public who observed, “lawmakers in conversation with their colleagues across the aisle, highlighting more of the inner workings of the intense debates….”Footnote 4 One video that garnered considerable attention showed a cordial conversation between Representatives Alexandria Ocasio-Cortex (D-NY), Paul Gosar (R-AZ), and Matt Gaetz (R-FL).Footnote 5 Voters appear to have noticed these exchanges, with Gaetz remarking, “I had constituents reach out to me about a friendly chat…with Sheila Jackson Lee…I’ve also found her to be a warm person interpersonally.”Footnote 6 These exchanges highlight a conflicting view: greater transparency may incentivize elected officials to embrace bipartisanship and civility. Given these differing accounts, we examine the effects on legislator behavior when televised “gavel-to-gavel” coverage is introduced in a legislature.
Nearly, all investigations of camera adoption focus on national legislatures, making it difficult to draw inferences about possible effects in the vast majority of legislative or policymaking institutions for which voters have less knowledge and receive less information. Further, because all legislators in national legislatures only receive the treatment once, and at a single point in time, a host of possible time-based factors unrelated to camera introduction (e.g., increasing wealth inequality) could explain pre- and post-treatment differences in outcomes such as polarization.
As an alternative approach, we introduce a new dataset on the adoption of broadcast or streaming gavel-to-gavel coverage of state legislative chambers. With data from 91 state-chambers on the implementation of television or streaming coverage occurring from 1987 to 2022,Footnote 7 we are able to use a difference-in-difference design with a significant number of observations, all of which occur within the same national context. These data allow us to answer substantively important questions about possible effects on individual- and chamber-level outcomes, while also clarifying findings from other institutional settings. At the chamber-level, we explore polarization, legislative productivity, and state budgets, and at the legislator-level, we assess ideology, party loyalty, and effectiveness.
Previous research finds some support for rhetorical changes as a result of greater visibility into the lawmaking process (i.e., more divisive language and tone), and there are compelling reasons to suspect that outcomes and processes will also deteriorate (e.g., Anderson, Butler, and Harbridge Reference Anderson, Butler and Harbridge2020). We find, however, limited evidence that adoption of live gavel-to-gavel coverage changes policymaking process and outcomes in state legislatures. State chambers do not become more or less polarized, dysfunctional, or productive. For individual legislators, the results are generally similar; there is no clear evidence that the adoption of gavel-to-gavel coverage alters their ideology, party loyalty, or legislative effectiveness.
While the timeline of gavel-to-gavel television or streaming coverage adoption coincides with significant changes in American politics, our evidence suggests live floor coverage is unlikely to be a cause of these changes. This finding is welcome as the use of cameras and televised/streamed proceedings exploded in popularity following the COVID-19 pandemic,Footnote 8 and as many advocate for more coverage of institutions, such as the American federal court system, that have long resisted them. Our results also contribute to the normatively important goal of better understanding the policymaking process within state legislatures and other less salient policymaking institutions. Because of gridlock at the federal level, states and local governments increasingly exercise policy control over substantively important and controversial issues in American politics such as abortion, gun control, education, the environment, and urban planning.
EXISTING EVIDENCE ON BEHAVIORAL CHANGES FROM CAMERA INTRODUCTION
Evidence from a wide range of national legislatures suggests that the presence of cameras induces some changes in the rhetorical behavior of legislators, specifically an increase in “grandstanding.” Grandstanding may change the policymaking dynamic on the floor, with members making rhetorical appeals to the cameras, rather than engaging in the substantive legislative process. In doing so, members may be more likely to appear in the news and other media outlets.Footnote 9
For example, the introduction of C-SPAN cameras resulted in more emotional language on the U.S. House floor, compared to the U.S. Senate where cameras were introduced years later (Gennaro and Ash Reference Gennaro and Ash2022). When cameras were introduced in the U.S. Senate, there was an increase in filibusters, arguably a form of grandstanding (Mixon, Gibson, and Upadhyaya Reference Mixon, Troy Gibson and Upadhyaya2003).Footnote 10 Evidence from parliamentary legislatures in Europe also suggests that differences in rhetorical behavior emerge when cameras are present, with members engaging in more constituent-focused speeches (Yildirim Reference Yildirim2020), and more divisive speech (Nieminen, Simola, and Tukiainen Reference Nieminen, Simola and Tukiainen2024).
The presence of cameras also has consequences for media coverage. U.S. House members were more likely to be mentioned on the evening news following the introduction of C-SPAN (Cook Reference Cook1986), and across a number of European parliaments, legislators who give more speeches receive more media coverage (Yildirim et al. Reference Yildirim, Thesen, Jennings and De Vries2023). The increase in coverage for performative legislators may amount to free campaign advertising for incumbents and increase electoral benefits (Mixon and Upadhyaya Reference Mixon and Upadhyaya2002; Park Reference Park2023).
While possible changes in media coverage and rhetorical strategies are normatively important, the outcomes we focus on measure institutional and member characteristics and behavior that affect the policymaking process and the types of laws produced. When the public, elected officials, the media, or other actors discuss possible effects of cameras capturing the policymaking process, they are not just worried about language and tone; they are concerned that policies become more extreme, that compromise becomes unobtainable, or that legislators become more beholden to co-partisans, leadership, or special interests. These outcomes are conceptually and empirically distinct from those related to grandstanding (Park Reference Park2021, for evidence of this claim, see Appendix J of the Supplementary Material).
GAVEL-TO-GAVEL COVERAGE AND LEGISLATOR INCENTIVES
We expect the introduction of televised or streamed gavel-to-gavel coverage to reduce monitoring costs for observers, making legislators more responsive to their preferences and increasing the difficulty of shirking. We identify two types of principals who may have an increased ability to monitor legislators once cameras are rolling. The first are voters who, on average, should have a moderating effect on legislator behavior. The second are those with non-moderate, outlying preferences such as party leaders or interest groups, who are likely to make legislator behavior and preferences more extreme.
Voters as Monitors
The normative motivation behind the adoption of gavel-to-gavel coverage assumes that voters can increase their monitoring of individual legislators and the institution as a whole. Citizens are largely unaware of who their legislators are, or what takes place in their state legislature (Carpini et al. Reference Carpini, Delli, David and Kennamer.1994; Rogers Reference Rogers2023). Easier access to information should result in more coherent and consistent electoral sanction if legislators produce policy outcomes inconsistent with citizen preferences (Kalt and Zupan Reference Kalt and Zupan1990). The result, according to advocates of gavel-to-gavel coverage, is likely to be normatively positive outcomes.
Reelection-oriented legislators are attuned to voter preferences and wary of voter sanction (Mayhew Reference Mayhew1974). A substantial literature demonstrates that even one “incorrect” vote results in electoral punishment for legislators at the congressional level (Ansolabehere and Kuriwaki Reference Ansolabehere and Kuriwaki2020; Canes-Wrone, Brady, and Cogan Reference Canes-Wrone, Brady and Cogan2002; Carson et al. Reference Carson, Koger, Lebo and Young2010; Nyhan et al. Reference Nyhan, McGhee, Sides, Masket and Greene2012) and that legislators are exceedingly risk averse when engaging in the policymaking process, such as casting roll call votes (Kingdon Reference Kingdon1973; Matthews and Stimson Reference Matthews and Stimson1975; Sullivan et al. Reference Sullivan, Earl Shaw, McAvoy and Barnum1993). Electoral punishment relies on voters knowing their legislator’s behavior, however (Canes-Wrone and Shotts Reference Canes-Wrone and Shotts2004), and the adoption of gavel-to-gavel coverage should increase the quantity and quality of relevant information transmitted to voters.
If gavel-to-gavel coverage decreases information acquisition costs for voters and allows them to exercise greater control over legislators, legislators should become more moderate, more willing to compromise, and less partisan. Survey data show elites are more polarized than the general public (Enders Reference Enders2021; Hill and Tausanovitch Reference Hill and Tausanovitch2015; Levendusky Reference Levendusky2009), citizens value compromise and wish to see elected officials set aside partisan differences (Hibbing and Theiss-Morse Reference Hibbing and Theiss-Morse2002; Wolak Reference Wolak2020), and even partisans broadly agree upon and support democratic norms (Holliday et al. Reference Holliday, Iyengar, Lelkes and Westwood2024).Footnote 11
Voters need not pay constant, close attention to policy discourse in order to incentivize legislator behavior. Salient issues or events may prompt the public to engage (Hutchings Reference Hutchings2001; Reny et al. Reference Reny, Newman, Holbein and Hassell2023) and cameras allow monitoring to occur at any time. For example, in 2013, Texas state senator Wendy Davis filibustered a bill which sought to restrict abortion in the state.Footnote 12 She received national attention, as over 180,000 people followed the filibuster via streaming, clips were posted to Twitter, and President Obama tweeted, “Something special is happening in Austin tonight. #StandwithWendy.”Footnote 13
Even if voters are lax in their oversight of elected officials, behavior can be revealed by other actors. Campaign advertisements, for example, can show video clips of undesirable behavior rather than describing it through verbal accounts. Local media outlets can also facilitate citizen learning by pulling videos of events that occur and showing them to viewers who may not have otherwise been exposed to them. All of these possibilities increase voter knowledge about the institution and legislators, and make representatives more responsive (Carpini and Keeter Reference Carpini and Keeter1996; Snyder and Stromberg Reference Snyder and Stromberg2010).
Moderation Hypothesis: Legislatures that adopt televised or streamed gavel-to-gavel coverage have less partisanship and more productivity at both the chamber- and individual-level, compared to those that do not adopt gavel-to-gavel coverage.
Interest Groups and Parties as Monitors
Opponents of camera introduction fear that the decrease in information acquisition costs may not be sufficient to engage the vast majority of voters, and may actually increase non-representative behavior by exacerbating information differences between voters and actors with outlying preferences such as interest groups, leaders, or activists (Bawn et al. Reference Bawn, Cohen, Karol, Masket, Noel and Zaller2012). Political elites and campaign donors are more polarized than the mass public (Enders Reference Enders2021; La Raja and Schaffner Reference La Raja and Schaffner2015), and activists have been central in driving conflict extension across issue domains (Layman et al. Reference Layman, Carsey, Green, Herrera and Cooperman2010). Parties in legislatures seek to produce outlying policy through agenda control and an incentive structure that rewards loyal partisans (Aldrich Reference Aldrich1995; Cox and McCubbins Reference Cox and McCubbins1993). These dynamics are exacerbated by electoral concerns as state legislators fear primary challenges in which interest groups and activists are heavily involved (Grumbach Reference Grumbach2020), and in which compromise and bipartisanship are perceived to be liabilities (Anderson, Butler, and Harbridge Reference Anderson, Butler and Harbridge2020).
Thus, if televised or streamed gavel-to-gavel coverage reduces information acquisition costs for interest groups or other partisan actors more than voters, legislators will adopt preferences and behaviors which appeal to them. The result is more extreme individual preferences and policy attitudes, greater institutional dysfunction, and less compromise.
Dysfunction/Extremity Hypothesis: Legislatures that adopt gavel-to-gavel televised or streamed coverage have more partisanship and less productivity at both the chamber- and individual-level, compared to those that do not adopt gavel-to-gavel coverage.
Possible Null Effects of Gavel-to-Gavel Coverage
There are also theoretical reasons to expect that the empirical effects of gavel-to-gavel coverage will be negligible. First, legislators may adjust their behavior to avoid increased monitoring. Even if gavel-to-gavel coverage increases floor transparency, legislators can respond by shifting the venues where important business is conducted. If the chamber floor is on display to the public, conversations and bargaining may move to private offices or other locations where cameras are absent (Anderson, Butler, and Harbridge Reference Anderson, Butler and Harbridge2020). Even in chambers where a camera is present, chamber rules may require focus on the floor speaker, allowing other interactions and conversations to remain out of sight.
Second, changes in the information provided to potential monitors may be overstated. Well organized and financed interest groups may already have full-time lobbyists in the capitol who watch legislative sessions (Butler and Miller Reference Butler and Miller2022; Grasse and Heidbreder Reference Grasse and Heidbreder2011), and roll-call voting records have always been available. Even if a lobbyist is not physically present, they are likely to hear about legislators’ relevant actions and votes. The same could be said of party leaders, who are often physically present in legislative chambers, and have numerous mechanisms to monitor their colleagues. Conversely, voters may not engage in monitoring even after the introduction of cameras as they are unlikely to seek out footage from gavel-to-gavel coverage in large numbers. The handful of voters who are motivated to do so were likely tuned into legislative activities before camera introduction. This aligns with research examining a different form of transparency—sunshine laws—that finds their effects on outcomes in state legislatures are minimal (Harden and Kirkland Reference Harden and Kirkland2021), likely due to low citizen knowledge and engagement with state government. With an apathetic and disengaged public, legislators may not be concerned about changes in monitoring from voters enough to alter their behaviors.
Finally, our definition of the treatment may not capture real changes in monitoring costs. Many states had audio recordings or part-time camera coverage prior to gavel-to-gavel adoption, and this form of coverage may have previously changed legislators’ behavior. These recordings establish a direct, first-hand record of speech on the floor, and provide material for campaigns, parties, and media. While we expect live video coverage to offer a more salient and effective form of monitoring, the subsequent introduction of cameras usually occurs in chambers that have already been altered by a different transparency initiative (e.g., audio recording, better record keeping or archiving, more accessible voting records, etc.), and we might observe limited effects from the addition of cameras.
These competing claims highlight that the linkages between gavel-to-gavel introduction and monitoring could cut in several different directions. It is also possible that the effects of increased monitoring by those with extreme and moderate preferences may conflict so as to produce no substantive effect on legislator behavior. The correlation between camera introduction and polarization may occur because cameras allow legislators to more efficiently transmit their existing preferences, rather than inducing a behavioral change in a legislator who would otherwise act reasonably. Thus, the null hypothesis is that the introduction of televised or streamed gavel-to-gavel coverage does not produce observable differences in partisanship or productivity at the chamber- or individual-level compared to legislatures which do not adopt gavel-to-gavel coverage.
WHY FOCUS ON TELEVISED/STREAMED GAVEL-TO-GAVEL COVERAGE?
There is significant variation in how cameras are introduced to legislatures. In some cases, it is a gradual process where media outlets are invited for specific events or important occasions, after which usage expands. In other cases, the shift is more sudden and sweeping—moving from no cameras to gavel-to-gavel floor coverage from one session to the next. In Texas, for example, a local Austin channel broadcast some sessions prior to adoption, while in Montana, the state “dove head first” into gavel-to-gavel coverage (from no televised coverage of any kind).Footnote 14 Crain and Goff (Reference Crain and Goff1986) find in the 1970s that many states had at least “occasional” television broadcasts, and in some states, it was “frequent.”
While we cannot rule out the possibility that audio recordings or part-time coverage induces behavioral changes in legislators, we argue that televised/streamed gavel-to-gavel coverage as our measure of increased transparency is the most conceptually distinct and empirically clear treatment effect. Unlike part-time coverage, where elected officials may be able to perform for the cameras when they are present, leaving other days for substantive legislative work (Yildirim Reference Yildirim2020), when cameras are always present the ability to be a performer one day and a legislator the next is highly constrained. Additionally, the part-time introduction of cameras that occurred in some states is fraught with measurement and comparability challenges. Part-time coverage may also be endogenous to the outcomes of interest. Local or state media may seek to cover legislative behavior on a particularly salient issue, or at a contentious moment in the policymaking process. This compromises our ability to draw inferences about the effects of camera adoption on outcomes. Once gavel-to-gavel is adopted, however, it is invariant and not correlated with changes in the outcomes of interest over time.Footnote 15
For these reasons, we focus on the adoption of gavel-to-gavel coverage through live broadcast or streaming. However, recognizing the diverse landscape of part-time camera usage across the states prior to gavel-to-gavel adoption, we also identified a subset of states in which we confirmed there was very little or no previous live coverage of the legislature prior to gavel-to-gavel, and we estimate effects separately for these “clean” treatment state-chambers (see Appendix B.4 of the Supplementary Material). In this subsample, we are confident that a large change in camera usage has occurred, and that the change in the treatment is comparable across the states. We find very similar results in these analyses to those using the full sample.
DATA COLLECTION PROCESS
A major inferential advantage of using state legislatures to identify possible effects of live floor coverage is that there exists significant variation in adoption timing, both within and across states.Footnote 16 This allows us to control for possible confounding state- and time-level factors. As our descriptive data show, some state-chambers adopted live television coverage of their floor proceedings in the early 1990s, while a number of state-chambers began web streaming or television broadcasting as recently as 2020, in response to limitations on public access to the chambers during the COVID-19 pandemic.
To the best of our knowledge, there is no existing, comprehensive dataset of state adoption of floor coverage. Our initial attempts to use online sources or other available references resulted in a limited subset of states. While the National Conference of State Legislatures lists states which currently televise or stream floor proceedings, their data do not list the year of implementation.Footnote 17 To obtain data on adoption, we called and emailed state legislative offices and requested the information. We identified a likely source within each legislature or chamber using web resources (e.g., the chamber reference librarian, the clerk, etc.), then requested contact information for other officials if our first contact was unavailable or did not know when coverage adoption occurred. Conversations with legislative officials were guided by a script (see Appendix A.3 of the Supplementary Material), but some variation exists due to the nature of these phone conversations. We explicitly asked about the House and Senate separately, and if the contact was not able to provide information about one chamber, we attempted to speak with someone else who could (necessary in a few cases). Across all conversations, three key questions were asked: (1) Do the House and Senate televise their floor proceedings or stream them on the internet? (2) Is the coverage gavel-to-gavel, or does it only include certain legislative activities? (3) What year did the broadcast (or streaming) coverage begin?
We maintained notes on the phone calls, including the name of the person who provided us with the information and their title. If we were not able to make contact with a state employee who could provide us with the requested information, we followed up with repeated emails and phone calls, necessary in the vast majority of states. We found for the majority of state-chambers that emails did not generate responses from state legislative offices. Even after multiple attempts across 2 years, we were not able to collect data for seven state-chambers, out of 98 total.Footnote 18 In a few cases, we could find information about adoption on the webpage of the broadcast networking, typically under a “FAQ” or “About Us” section.
Table 1 shows the year of adoption of gavel-to-gavel coverage ordered by state-chamber. Table A1 in the Supplementary Material contains additional details about the data, including the sources who provided the chamber-level information on adoption and Figure A1 in the Supplementary Material shows state-chambers ordered by adoption date. In most cases for which we were not able to obtain the date of adoption, it was due to an inability to make contact with an appropriate staffer at the state legislature (i.e., emails and phone calls went unanswered). In a few cases, we made contact with staffers, but they could not identify when adoption occurred.
Adoption of Gavel-to-Gavel Coverage by State-Chamber

Note: State-chambers with year of adoption. State-chambers listed as missing are those states for which an adoption date was not available. See Table A1 in the Supplementary Material for more details on data sources and coverage type, and see Figure A1 in the Supplementary Material for adoption ordered by date.
As part of a secondary data collection process to supplement our original analysis and identify states with discrete changes from no coverage to gavel-to-gavel (described subsequently in more detail), we recontacted a subsample of states and asked two specific questions: (1) Was our initial coding of gavel-to-gavel implementation correct and; (2) How frequently were floor proceedings televised or streamed prior to adoption of gavel-to-gavel coverage (see Appendix A.3 of the Supplementary Material for script)?
Additional Details and Assumptions
We assume the seven state-chambers for which we do not have data are missing at random. There is no correlation between state legislative professionalism and missingness. For example, we were unable to gather data for both Connecticut and South Carolina chambers, which have professionalism scores higher than average, and both Indiana chambers, which have lower than average professionalism scores (Squire Reference Squire2024). Though one might expect that legislatures with lower professionalism were less likely to respond, in our contacts with staffers, it was often more difficult to speak with someone in higher professionalism states, presumably because these staffers are busier.
The time units used in the analysis are years. In most states, staffers in the state legislative offices could not identify a specific month in which coverage began (though we requested this information). Further, most covariates used in the analysis are measured at the year-level. Thus, the empirical models assume that effects occur in the year of adoption. However, for those states in which we could identify a month, it was almost always at the beginning of a year or term, suggesting that this empirical assumption is valid. We also estimate lagged effects to account for possible delays in behavioral changes by legislators or parties.
Some states began broadcasting or streaming committee activity before or after floor coverage, and many states archived audio prior to video broadcasting or streaming. Because of inconsistencies in data availability across states, we consider treatment to occur when televised broadcasting or streaming of gavel-to-gavel floor coverage began. We are only interested in the first implementation of gavel-to-gavel coverage through broadcast/streaming. Some states initially adopted broadcasting and subsequently moved to streaming, or to both methods (e.g., Kentucky in 2015), but staffers’ knowledge about these changes is limited. Further, we expect moving from television broadcasting to web streaming has minimal effects on behavior given that our theory focuses on the presence of cameras rather than the medium of delivery.Footnote 19
CHAMBER- AND LEGISLATOR-LEVEL OUTCOMES
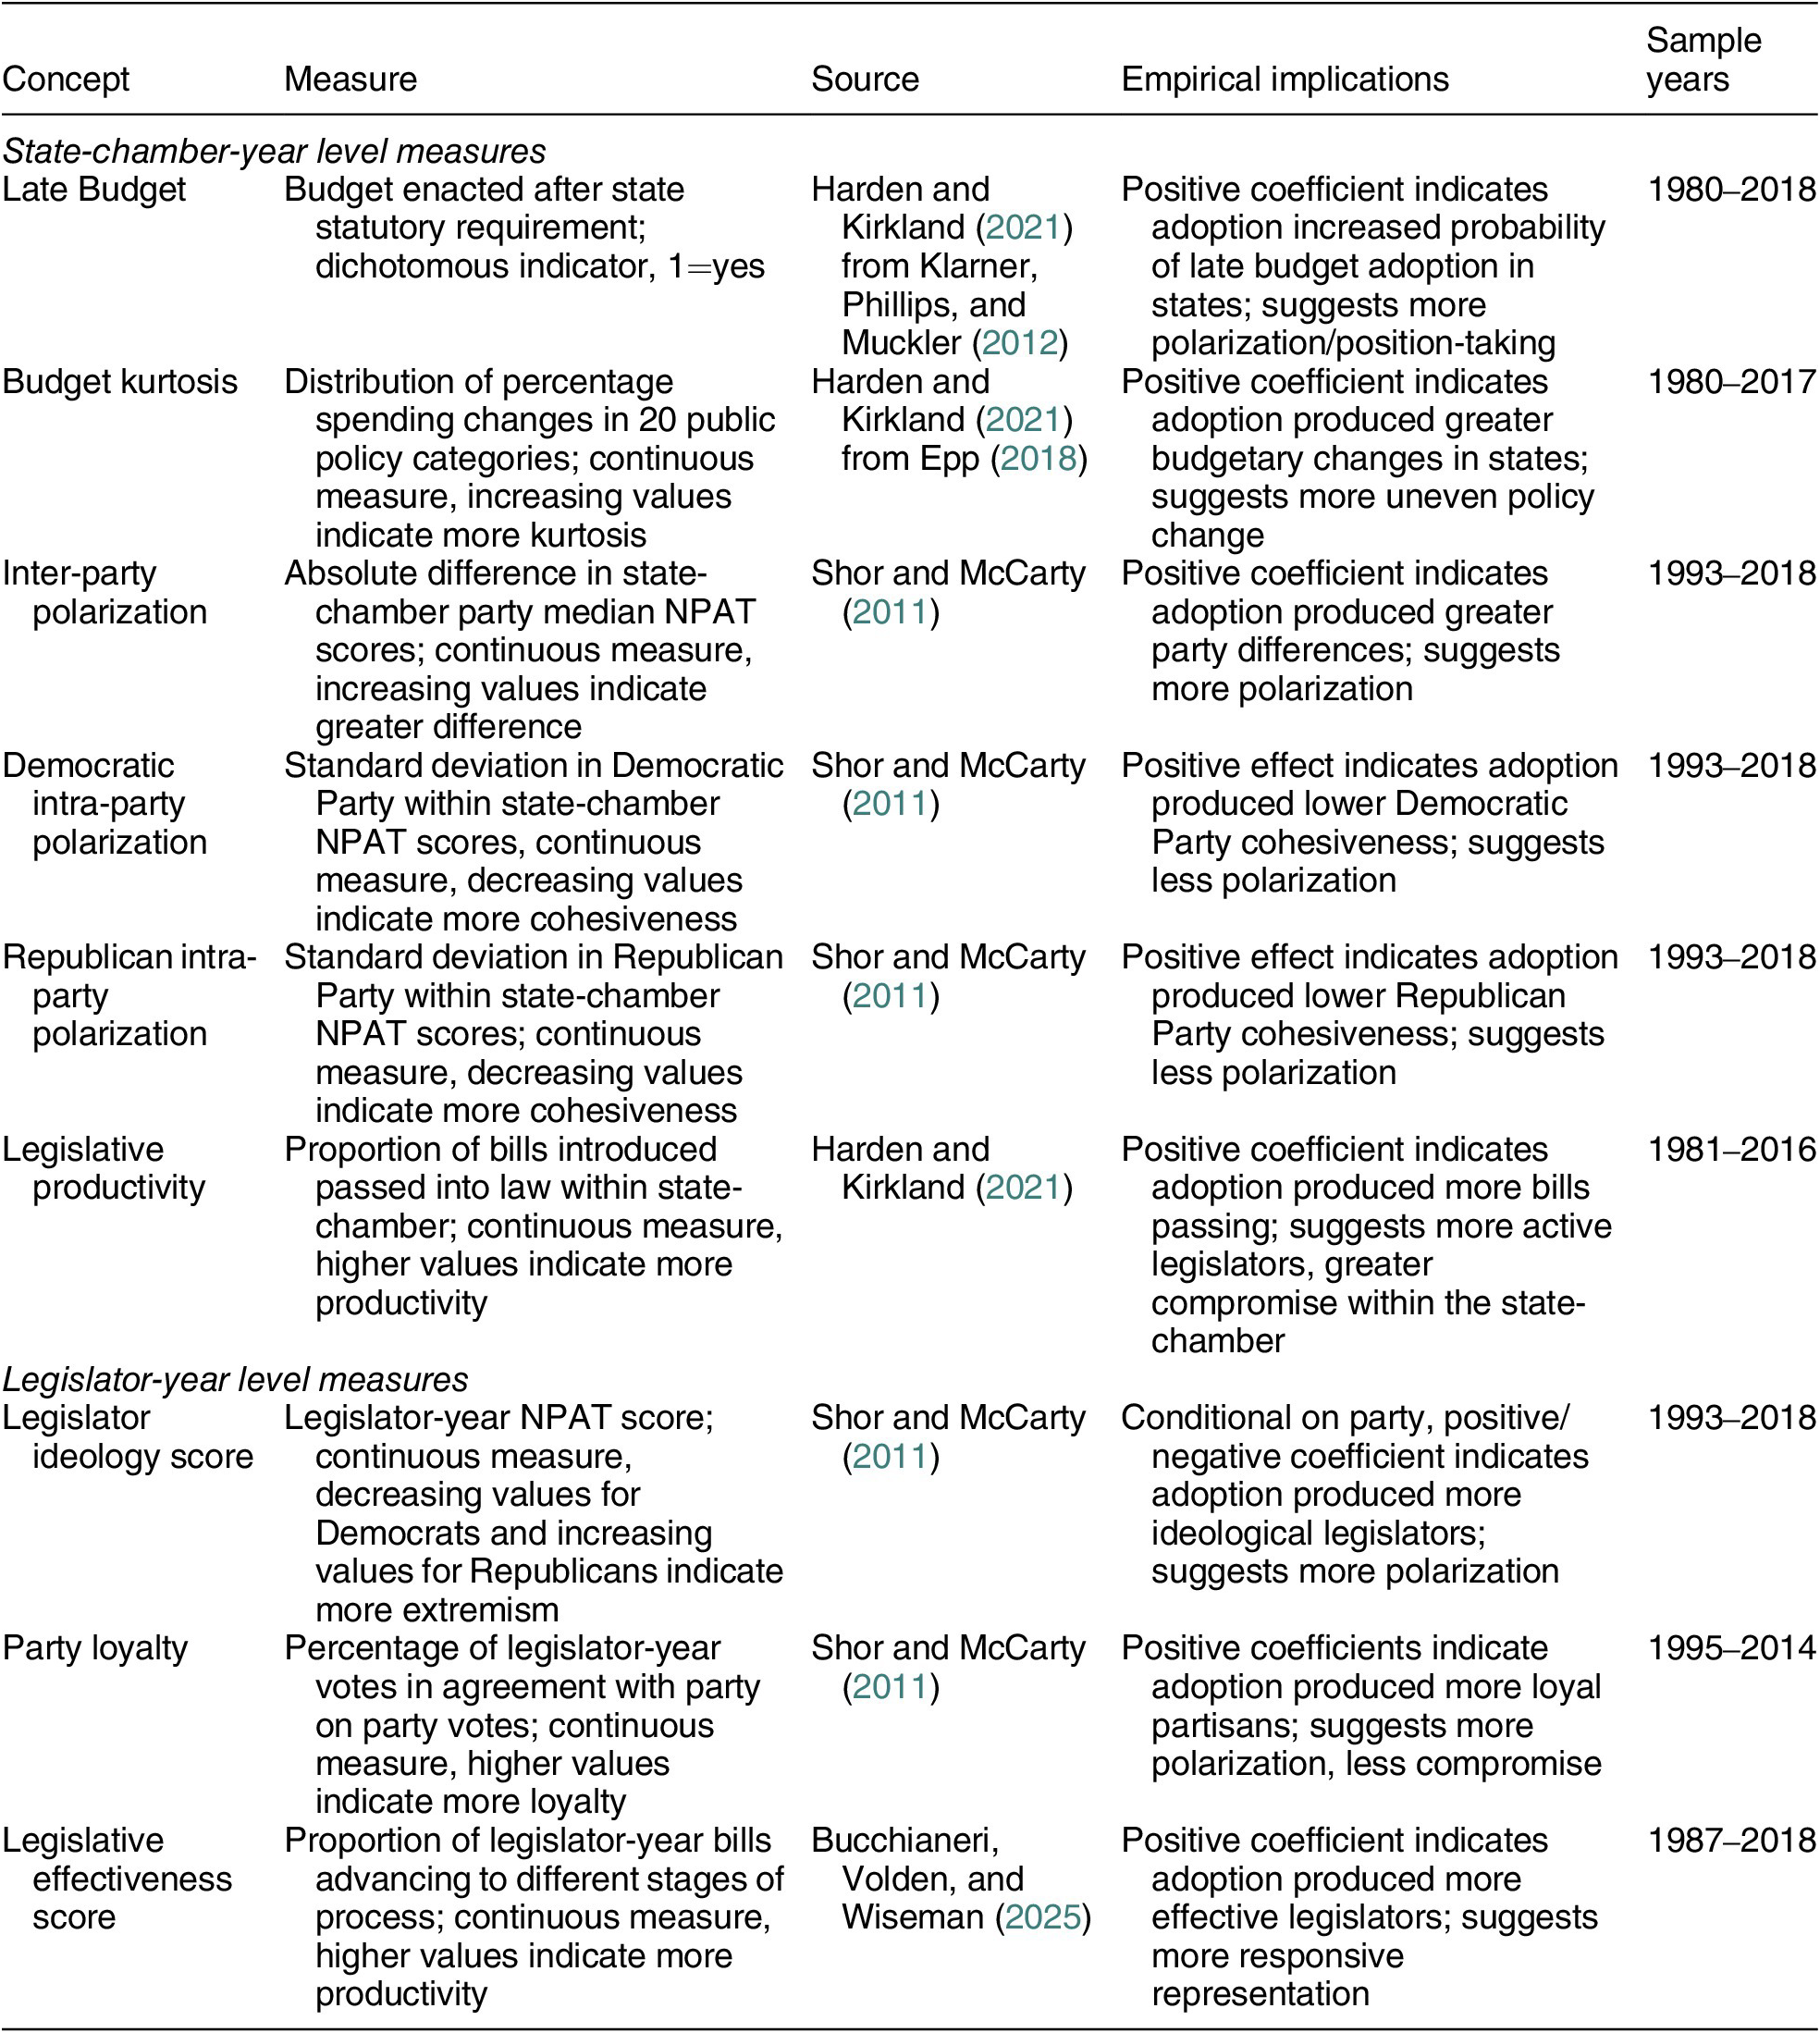
Our dependent variables of interest are largely drawn from Harden and Kirkland (Reference Harden and Kirkland2021) and measure chamber- and individual-level legislative outcomes. To these, we also add chamber-level within-party cohesion, a commonly used measure of chamber polarization for both Democrats and Republicans (Kirkland Reference Kirkland2014), and newly available individual-level legislator effectiveness data (Bucchianeri, Volden, and Wiseman Reference Bucchianeri, Volden and Wiseman2025). Table 2 shows these measures and the implications of a positive effect of coverage. These outcomes capture a broad set of observable institutional and behavioral changes that affect the policymaking process. Our measures are unable to directly capture different possible theoretical mechanisms but they do address the most normatively compelling claims about camera introduction: namely, that gavel-to-gavel coverage produces increased partisanship, dysfunction, and policy stasis.
Outcomes Predicted by Adoption of Gavel-to-Gavel Coverage

Note: Sample years indicate minimum and maximum years with at least one observation; not all state-years are available within the years noted.
Normative Implications of Outcomes
Most obviously, late passage of a budget has important fiscal and policy effects on state government, while also creating uncertainty for the public and financial institutions. For example, if a budget is passed late, public employees may receive IOUs rather than paychecks (as California most recently issued in 2009), financial lenders may not receive payments, and the state may have its credit rating downgraded, all of which harm the state’s economy while also imposing significant costs on individual state employees or other members of the public who depend on state spending (Andersen, Lassen, and Nielsen Reference Andersen, Lassen and Nielsen2012). A positive effect of state-chamber adoption of televised/streamed floor proceedings on the probability of late budget adoption indicates that polarization and unwillingness to compromise are a product of increased public attention and visibility.
The difference in party medians and a decrease of within-party heterogeneity are two related components of increased polarization within a chamber (Aldrich Reference Aldrich and Coleman Battista2002; Aldrich and Rohde Reference Aldrich and Rohde1998), and polarization is almost universally seen as normatively bad for the legislative process and policy outcomes. Polarization between Republicans and Democrats has been blamed for the decline in institutional comity, more extreme policy outcomes, a rise in negative partisanship and political violence, and mounting distrust of political institutions (Abramowitz and McCoy Reference Abramowitz and McCoy2019; Jones Reference Jones2015; Mason Reference Mason2015; Thomsen Reference Thomsen2014). A positive effect of live floor coverage via broadcast/streaming on party median difference (i.e., parties grow more ideologically distinct), and a negative effect on within party heterogeneity (i.e., party member ideology becomes more cohesive) indicate that gavel-to-gavel coverage helps accelerate polarization within the state’s legislature.
The policy literature treats budget kurtosis as symptomatic of a dysfunctional legislature (Harden and Kirkland Reference Harden and Kirkland2021). If the distribution of budgetary changes has heavy tails, there is a greater proportion of small and large values, indicating budgetary stasis and dramatic changes, respectively. These patterns are indicative of a legislature that does not engage in regular or routine budgetary maintenance, which may produce poorer policy outcomes (Epp Reference Epp2018; Jones and Baumgartner Reference Jones and Baumgartner2005), such as lower long-term growth rates (Breunig and Koski Reference Breunig and Koski2012).
Our three legislator-level outcomes are ideology, party loyalty, and effectiveness. Legislator ideology allows us to capture changes in the relative extremity of individual Democrats and Republicans. These ideology scores are the individual data points used to construct the chamber-level party measures (difference in party medians and party standard deviation) and are taken from voting records within each state legislative chamber and legislator survey responses (Shor and McCarty Reference Shor and McCarty2011). More extreme Democratic legislators (i.e., more liberal voting records) have increasingly negative scores, whereas more extreme Republicans have increasingly positive scores. Greater extremity on these scores promotes gridlock and vitriol within the legislature.
High levels of party loyalty is largely seen as normatively bad in modern American legislatures, despite the organizational and collective benefits cohesive parties provide within the legislature (Aldrich Reference Aldrich1995; Cox and McCubbins Reference Cox and McCubbins1993; Reference Cox and McCubbins1994). Instead, party loyalty is seen as a symptom of polarization, unwillingness to compromise, position taking in lieu of substantive lawmaking, and hardball procedural tactics (Jessee and Theriault Reference Jessee and Theriault2012). There will be a positive effect of streaming/broadcasting on party loyalty if increased public scrutiny gives rise to more polarization, and a greater ability of party actors, interest groups, or extremists to monitor individual legislators.
Finally, legislative effectiveness is a widely used measure of the extent to which individual legislators engage in substantive representation. The measure captures the weighted average of the number of bills advancing to various stages of the legislative process, which accounts for the total size of the agenda within a chamber-year and the number of total legislators (Volden and Wiseman Reference Volden and Wiseman2014). Bucchianeri, Volden, and Wiseman (Reference Bucchianeri, Volden and Wiseman2025) demonstrate that at the state-level, individual effectiveness is a combination of personal traits and institutional position. Members of the majority, committee leaders, and more senior members are more effective, but certain legislators seem to have innate characteristics that make them more willing to engage in the difficult and time-consuming activities necessary to push their bills through the lawmaking process, consistent with long-held notions of “workhorses,” and “showhorses” (Langbein and Sigelman Reference Langbein and Sigelman1989). We are interested in whether the addition of streamed/televised proceedings resulted in legislators substituting the hard work of legislating for grandstanding. If so, we expect a negative effect of the treatment on individual legislator effectiveness.
ESTIMATION STRATEGY FOR PREDICTING COVERAGE EFFECTS
Because we observe both state-chambers and districts over time, with treatment adoption occurring in staggered years, our primary estimation technique is a difference-in-difference estimation through a two-way fixed effects model:
 $$ \begin{array}{rl}{\hat{y}}_{it}={\alpha}_{it}+{\beta}_1{D}_{it}+{\gamma}_t+{\sigma}_i+{\beta}_j{x}_{it}+{\epsilon}_{it,}& \end{array} $$
where $ {\hat{y}}_{it} $
is the outcome of interest,
$ {\hat{y}}_{it} $
is the outcome of interest, $ {D}_{it} $
is the treatment (adoption of streaming or broadcast coverage of state legislative floor sessions),
$ {D}_{it} $
is the treatment (adoption of streaming or broadcast coverage of state legislative floor sessions), $ {\gamma}_t $
is a set of dummy variables for years,
$ {\gamma}_t $
is a set of dummy variables for years, $ {\sigma}_i $
is a set of dummy variables for state legislative chamber or state-chamber-district, depending on whether the outcome is at the chamber-level or the legislator-level, and
$ {\sigma}_i $
is a set of dummy variables for state legislative chamber or state-chamber-district, depending on whether the outcome is at the chamber-level or the legislator-level, and $ {\epsilon}_{it} $
are chamber- or district-year clustered standard errors. This model specification controls for factors that vary across years but not states, such as increasing polarization within the country, and controls for factors which vary across states but not time, such as the size of the legislature or other institutional rules. This model does not control for factors that vary within states across time, so we also include a set of covariates
$ {\epsilon}_{it} $
are chamber- or district-year clustered standard errors. This model specification controls for factors that vary across years but not states, such as increasing polarization within the country, and controls for factors which vary across states but not time, such as the size of the legislature or other institutional rules. This model does not control for factors that vary within states across time, so we also include a set of covariates $ {x}_{it} $
to control for these factors (see Table A2 in the Supplementary Material).
$ {x}_{it} $
to control for these factors (see Table A2 in the Supplementary Material).
The covariates are the same as those in Harden and Kirkland (Reference Harden and Kirkland2021) and include the total number of bills and resolutions vetoed in a state-year, first and second dimension legislative professionalism in state-year, the Berry et al. (Reference Berry, Ringquist, Fording and Hanson1998) measures of state citizen and government ideology, the Ranney political competition measure as compiled by Klarner (Reference Klarner2013), the logged gross state product, logged legislative expenditures, an indicator for whether the state has term limits, and the logged state population. To these measures, we also add the logged number of bills introduced in the legislature as a measure of agenda size within each state-chamber (Volden and Wiseman Reference Volden and Wiseman2009). For models estimating the effect on individual legislators, we also control for party identification and whether the legislator was in the majority party, as the majority is more likely to enforce party line voting (Carson et al. Reference Carson, Koger, Lebo and Young2010). Table A2 in the Supplementary Material shows descriptive statistics for all variables used in the analyses.
Recent literature on difference-in-difference estimation shows that the treatment estimate may be biased if the effect varies across time or units, or uninterpretable in the absence of strong assumptions concerning different treatment effects across time or units. Difference-in-difference estimation also requires that the treated units would not have differed in the absence of the treatment (parallel trends assumption). We address each of these complications through a series of robustness tests and assumption checks.
ESTIMATED EFFECTS ON CHAMBER-LEVEL OUTCOMES
Table B1 in the Supplementary Material shows our preferred models predicting each chamber-level dependent variable using the treatment (adoption of gavel-to-gavel coverage via streaming or broadcast) alone and with a full set of controls, including state-chamber and year fixed effects with clustered standard errors for state-chamber and year.Footnote 20 The first model is a logit estimate predicting a late state budget, while the other five columns are OLS estimates. Figure 1 displays the estimated coefficients with 95% confidence intervals, with the left panel showing the logit model estimate, while the right panel shows regression coefficients, which can be directly interpreted.
Estimated Chamber-Level Coefficients from Diff.-in-Diff. Analysis
Note: Estimated coefficients from Table B1 in the Supplementary Material with 95% confidence intervals. “Late Budget” outcome (left panel) is predicted using fixed effects logit, all other outcomes predicted using fixed effects regression. Scales differ between the two panels.

Gavel-to-gavel coverage has no effect on the late adoption of state budgets. As the left panel shows, the estimate is negative, though statistically insignificant. The substantive effect is equal to a decrease in the odds ratio of a late budget by about 21% (95% CI: 71% decrease to 111% increase). In the right panel, none of the other five outcomes—budget kurtosis, the difference between the Democratic and Republican party medians, the standard deviation of both parties, and legislative productivity— reach standard levels of statistical significance. Legislative productivity is the closest, with a negative coefficient and a p-value of 0.18 (95% CI: −0.06 to 0.011), suggesting that the adoption of coverage reduced the total number of bills passed. The effect is substantively small, equal to a reduction of about 2.3% in the proportion of total bills passed. For context, the average number of bills passed in a state-chamber is about 804, and the point estimate suggests that adoption decreased enacted bills by approximately 19. Overall, we find no evidence that introducing gavel-to-gavel coverage of state legislative sessions had any effect on our six chamber-level variables at conventional standards of statistical significance.
Using our subsample of “clean” treatment state-chambers, those in which we are confident there was little to no coverage prior to camera implementation, we find similar results (Table B4 in the Supplementary Material). Inter-party polarization is significant at the $ p<0.05 $
level in the bivariate model; however, when controls are added, it does not approach statistical significance (
$ p<0.05 $
level in the bivariate model; however, when controls are added, it does not approach statistical significance ( $ p=0.59 $
). Budget kurtosis is significant when controls are included, and the effect is slightly less than that found by Harden and Kirkland (Reference Harden and Kirkland2021), though with a larger standard error. We investigate this result further in additional analyses.
$ p=0.59 $
). Budget kurtosis is significant when controls are included, and the effect is slightly less than that found by Harden and Kirkland (Reference Harden and Kirkland2021), though with a larger standard error. We investigate this result further in additional analyses.
Precision of Null Effects
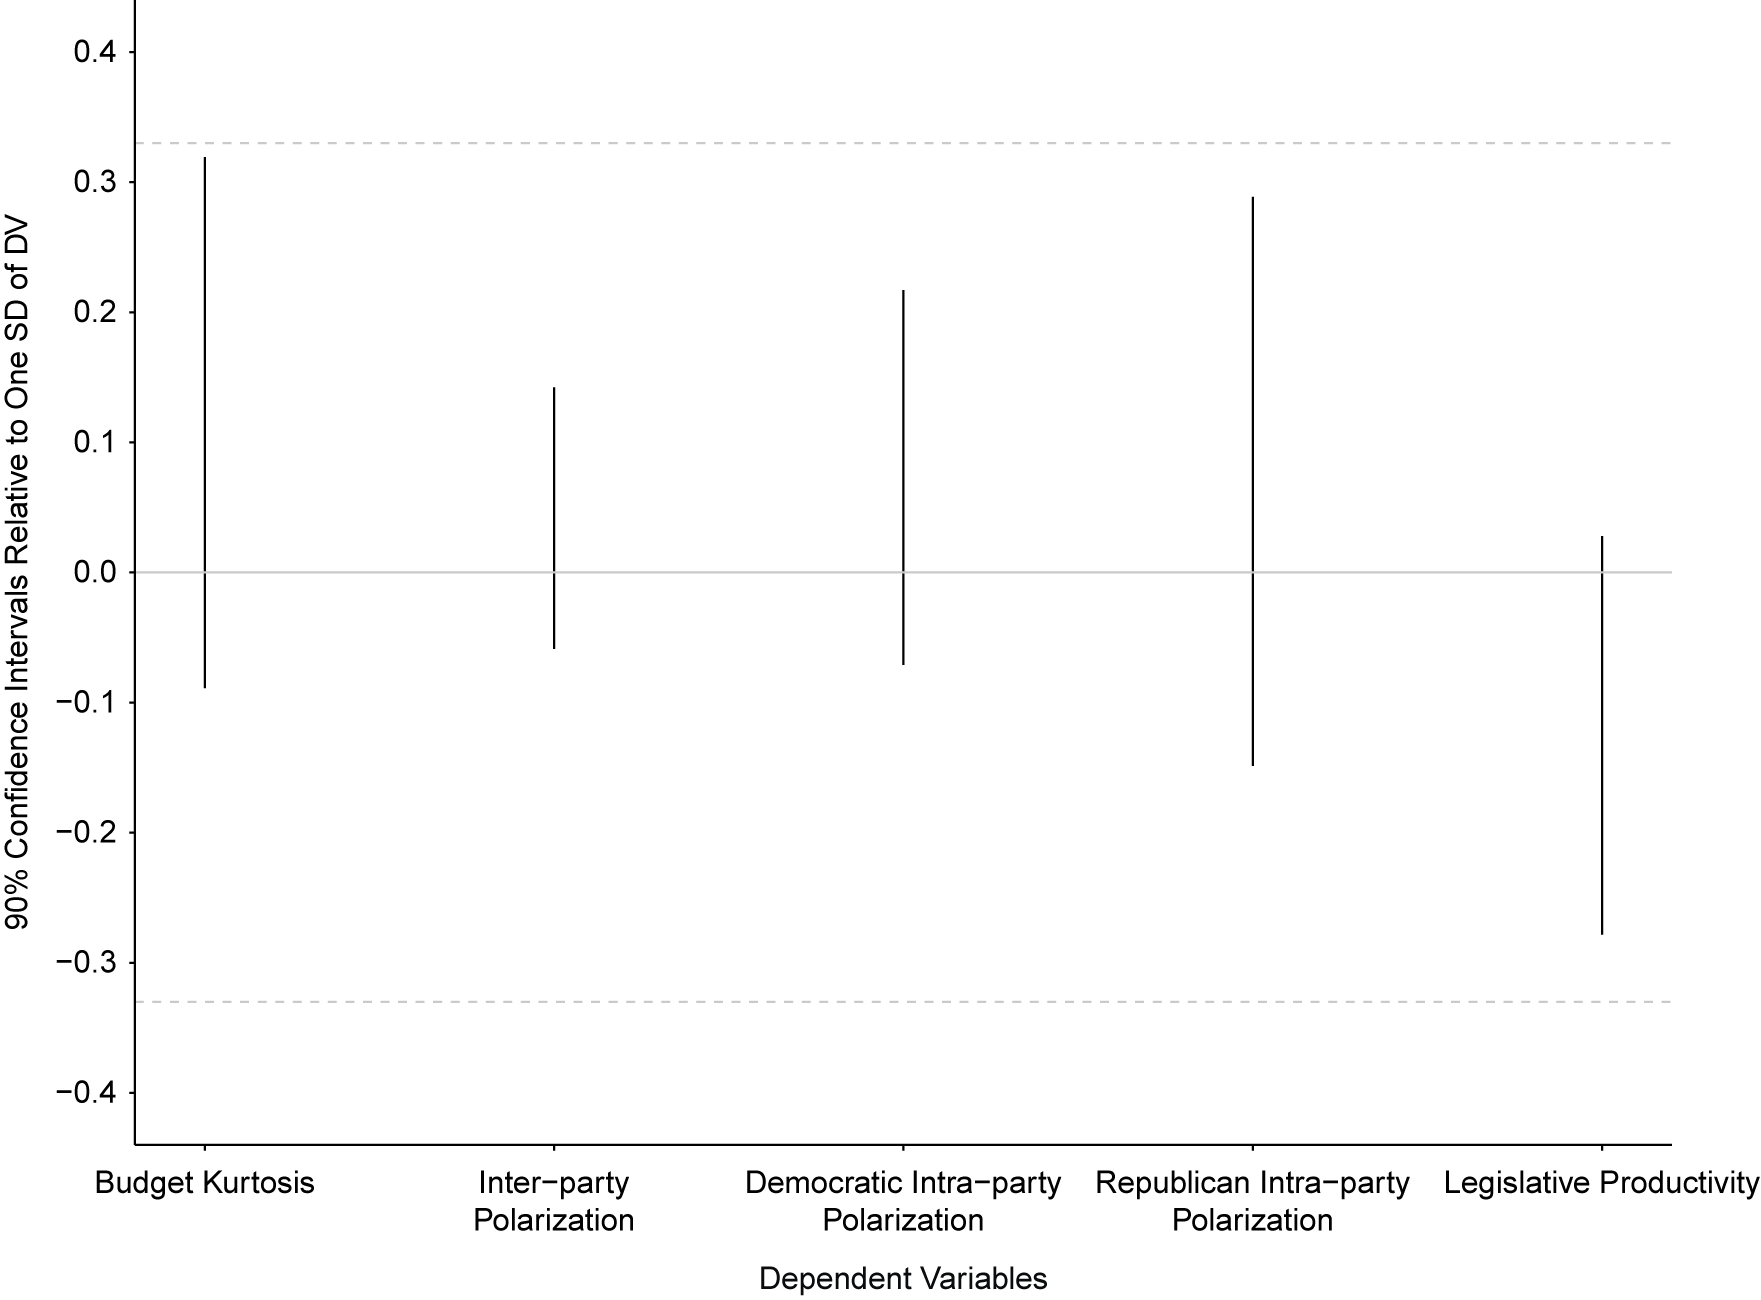
Because our estimates overwhelmingly point to insignificant effects for chamber-level outcomes, we estimate the precision of these null results (Rainey Reference Rainey2014). To do so, we must identify a substantively informative effect for each of the outcomes, develop a hypothesis which specifies the null relationship between the treatment and the outcome, and then estimate 90% confidence intervals around these substantive effects. Our hypothesis for each outcome is that adoption by a state-chamber of gavel-to-gavel broadcast/streaming coverage will not lead to a substantively meaningful change in our six chamber-level outcomes. 90% confidence intervals are equivalent to conducting two, one-tailed tests for the null that the estimated effect is greater (or smaller) than the substantive effect of interest.
We define substantive quantities of interest for each of our outcomes based on the results estimated in Harden and Kirkland (Reference Harden and Kirkland2021) and other literature (see Appendix B.3 of the Supplementary Material for more details). For late budget outcome, the estimate is sufficiently imprecise that nearly any substantive value will lie within the 90% confidence interval and as a result, this estimate should be treated with caution. For all other outcomes, we define a substantive effect of the treatment as producing at least a one-third standard deviation change in the outcome. Figure 2 displays the 90% confidence intervals of estimated effects in standard deviations.
Estimated Precision of Chamber-Level Null Effects
Note: Results from Table B1 in the Supplementary Material. About 90% confidence intervals scaled to standard deviations of each dependent variable. “Late Budget” outcome excluded because confidence interval encompasses all plausible values.

As the figure shows, all estimated effects are smaller than our substantive effect criteria. The effect for kurtosis is the least precisely estimated—though it is less than one-third of a standard deviation—and the standard error is substantially larger than that estimated by Harden and Kirkland (Reference Harden and Kirkland2021). In all other cases, the estimated effect size of gavel-to-gavel adoption is similar to or smaller than other recent estimated effects. We conclude that these effects are substantively small, do not encompass meaningful changes in the outcomes, and Type II errors are unlikely.
Parallel Trends Assumption
The key assumption of the difference-in-difference estimator is that states treated with adoption of coverage would have had the same trends, over time, in each outcome as states that were not treated. Alternatively, this assumption requires that non-treated state-chambers are comparable or effective controls for treated states. There is no direct way to test this assumption, but we conduct two standard empirical tests, both of which show no evidence that the parallel trends assumption is violated for our chamber-level outcomes (see Appendix C of the Supplementary Material for more details).
First, we predict whether change in treatment status is predicted by one of the outcomes. For example, do differences in state budget kurtosis predict treatment adoption? If so, this would indicate that states which are treated in year t systematically differ from those without the treatment in any given year, implying that adoption was not exogenous to the outcomes. Our second test uses treatment in the current year to predict each of the outcomes in the previous year, a common way of testing for violations of the parallel trends assumption (Barber and Holbein Reference Barber and Holbein2020). These combined results give confidence that the parallel trends assumption is satisfied.
CHAMBER-LEVEL HETEROGENEOUS TREATMENT EFFECTS AND LAGGED TREATMENT EFFECTS
Recent literature emphasizes how difference-in-difference estimates weight observations differently when treatment assignment is staggered, rather than in the canonical difference-in-difference setup in which all units receive the treatment at the same time (Baker, Larcker, and Wang Reference Baker, Larcker and Wang2022; Goodman-Bacon Reference Goodman-Bacon2021; Imai and Kim Reference Imai and Kim2021). This problem can bias the coefficients and, “staggered DiD treatment effect estimates can actually obtain the opposite sign of the true ATT” (Baker, Larcker, and Wang Reference Baker, Larcker and Wang2022, 371). This problem cannot be corrected by simply adding unit and time fixed effects, which can produce uninterpretable results (Kropko and Kubinec Reference Kropko and Kubinec2020).
It may be the case, for example, that adoption of gavel-to-gavel coverage in the 1990s had greater effects than adoption in the 2000s. Perhaps the novelty and limited channel selection drove greater viewership or greater engagement with legislative activity than in the 2000s after the rise of widespread broadband internet access. By examining heterogeneous treatment effects across time, we can discern whether different times of adoption affect the outcomes of interest.
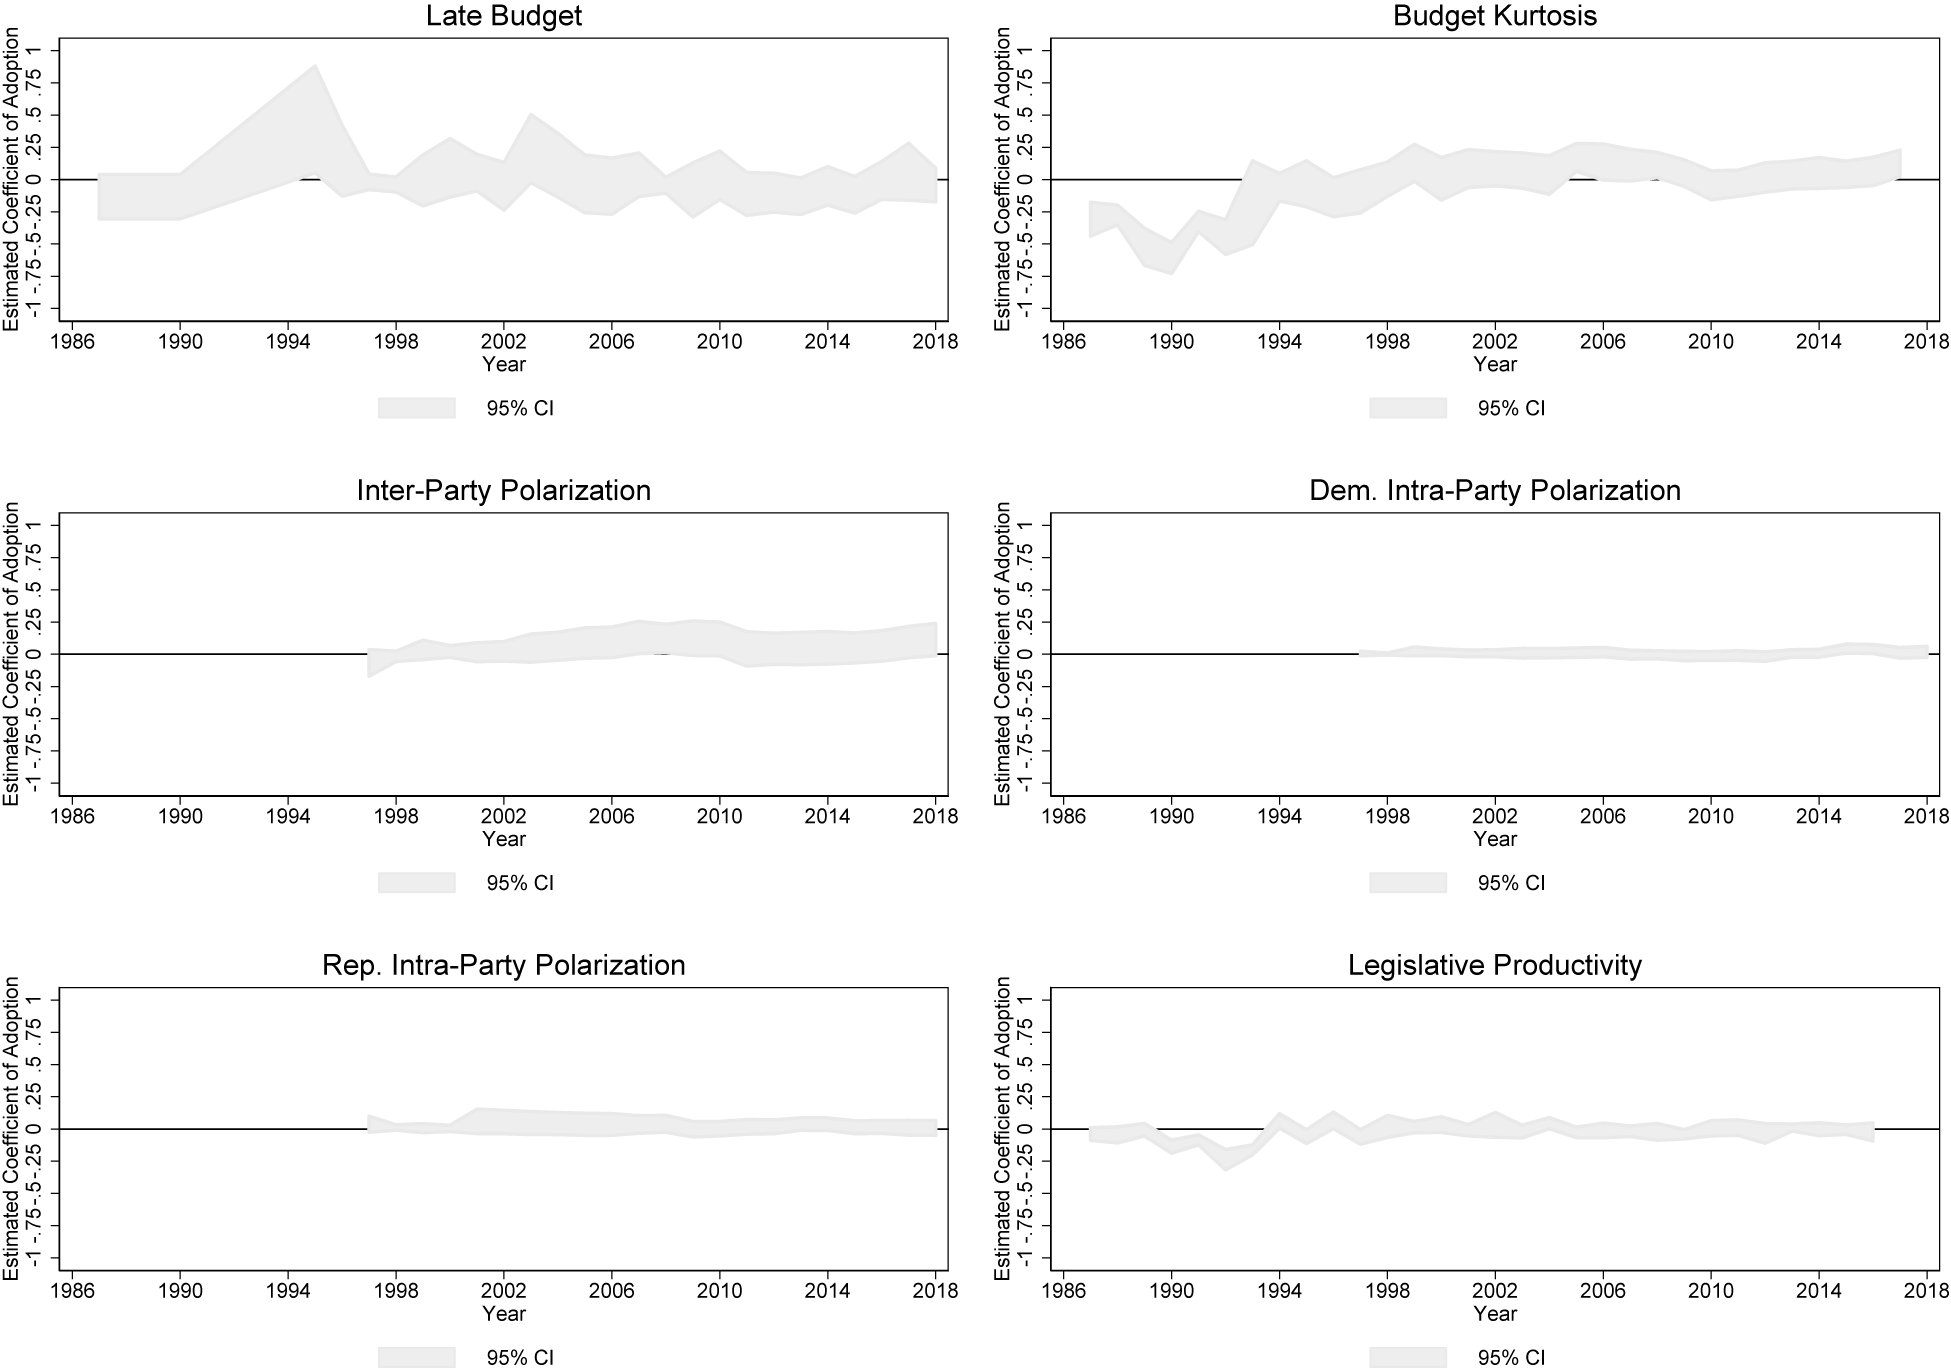
We separately estimate treatment effects across different cohorts, allowing us to examine whether the treatment effect differs across time by averaging treatment effects across different years and groups (state-chambers), then aggregating by year to determine whether the treatment effect differs for earlier or later treated states.Footnote 21 If effects do differ, it is evidence that the average treatment effect depends on when states were treated with gavel-to-gavel coverage, and suggests we need to take additional steps to account for these differing effects. The results are displayed in Figure 3 and shown in Table D1 in the Supplementary Material.
Estimated Chamber-Level Treatment Effects Over Time
Note: Results from Table D1 in the Supplementary Material. Estimated average treatment effects aggregated by time period, with 95% confidence intervals.

There is a positive significant effect for late budget only in 1995. There are significant effects in 2 years (out of approximately 20) for inter-party distance, and in 2 years for Democratic intra-party polarization, but none for Republican intra-party polarization. There is some evidence that adoption in the early 1990s decreased legislative productivity, but there are also years for which the effect is positive (1994 and 1996). States in which gavel-to-gavel coverage was adopted in the late 1980s and early 1990s show a negative effect on kurtosis (and in the subsample of states with a discrete adoption of gavel-to-gavel, Figure D1 in the Supplementary Material), but this is the opposite effect found in the difference-in-difference models on the “clean” treatment states (Table B4 in the Supplementary Appendix B) and when examining lagged effects (Figure 4).
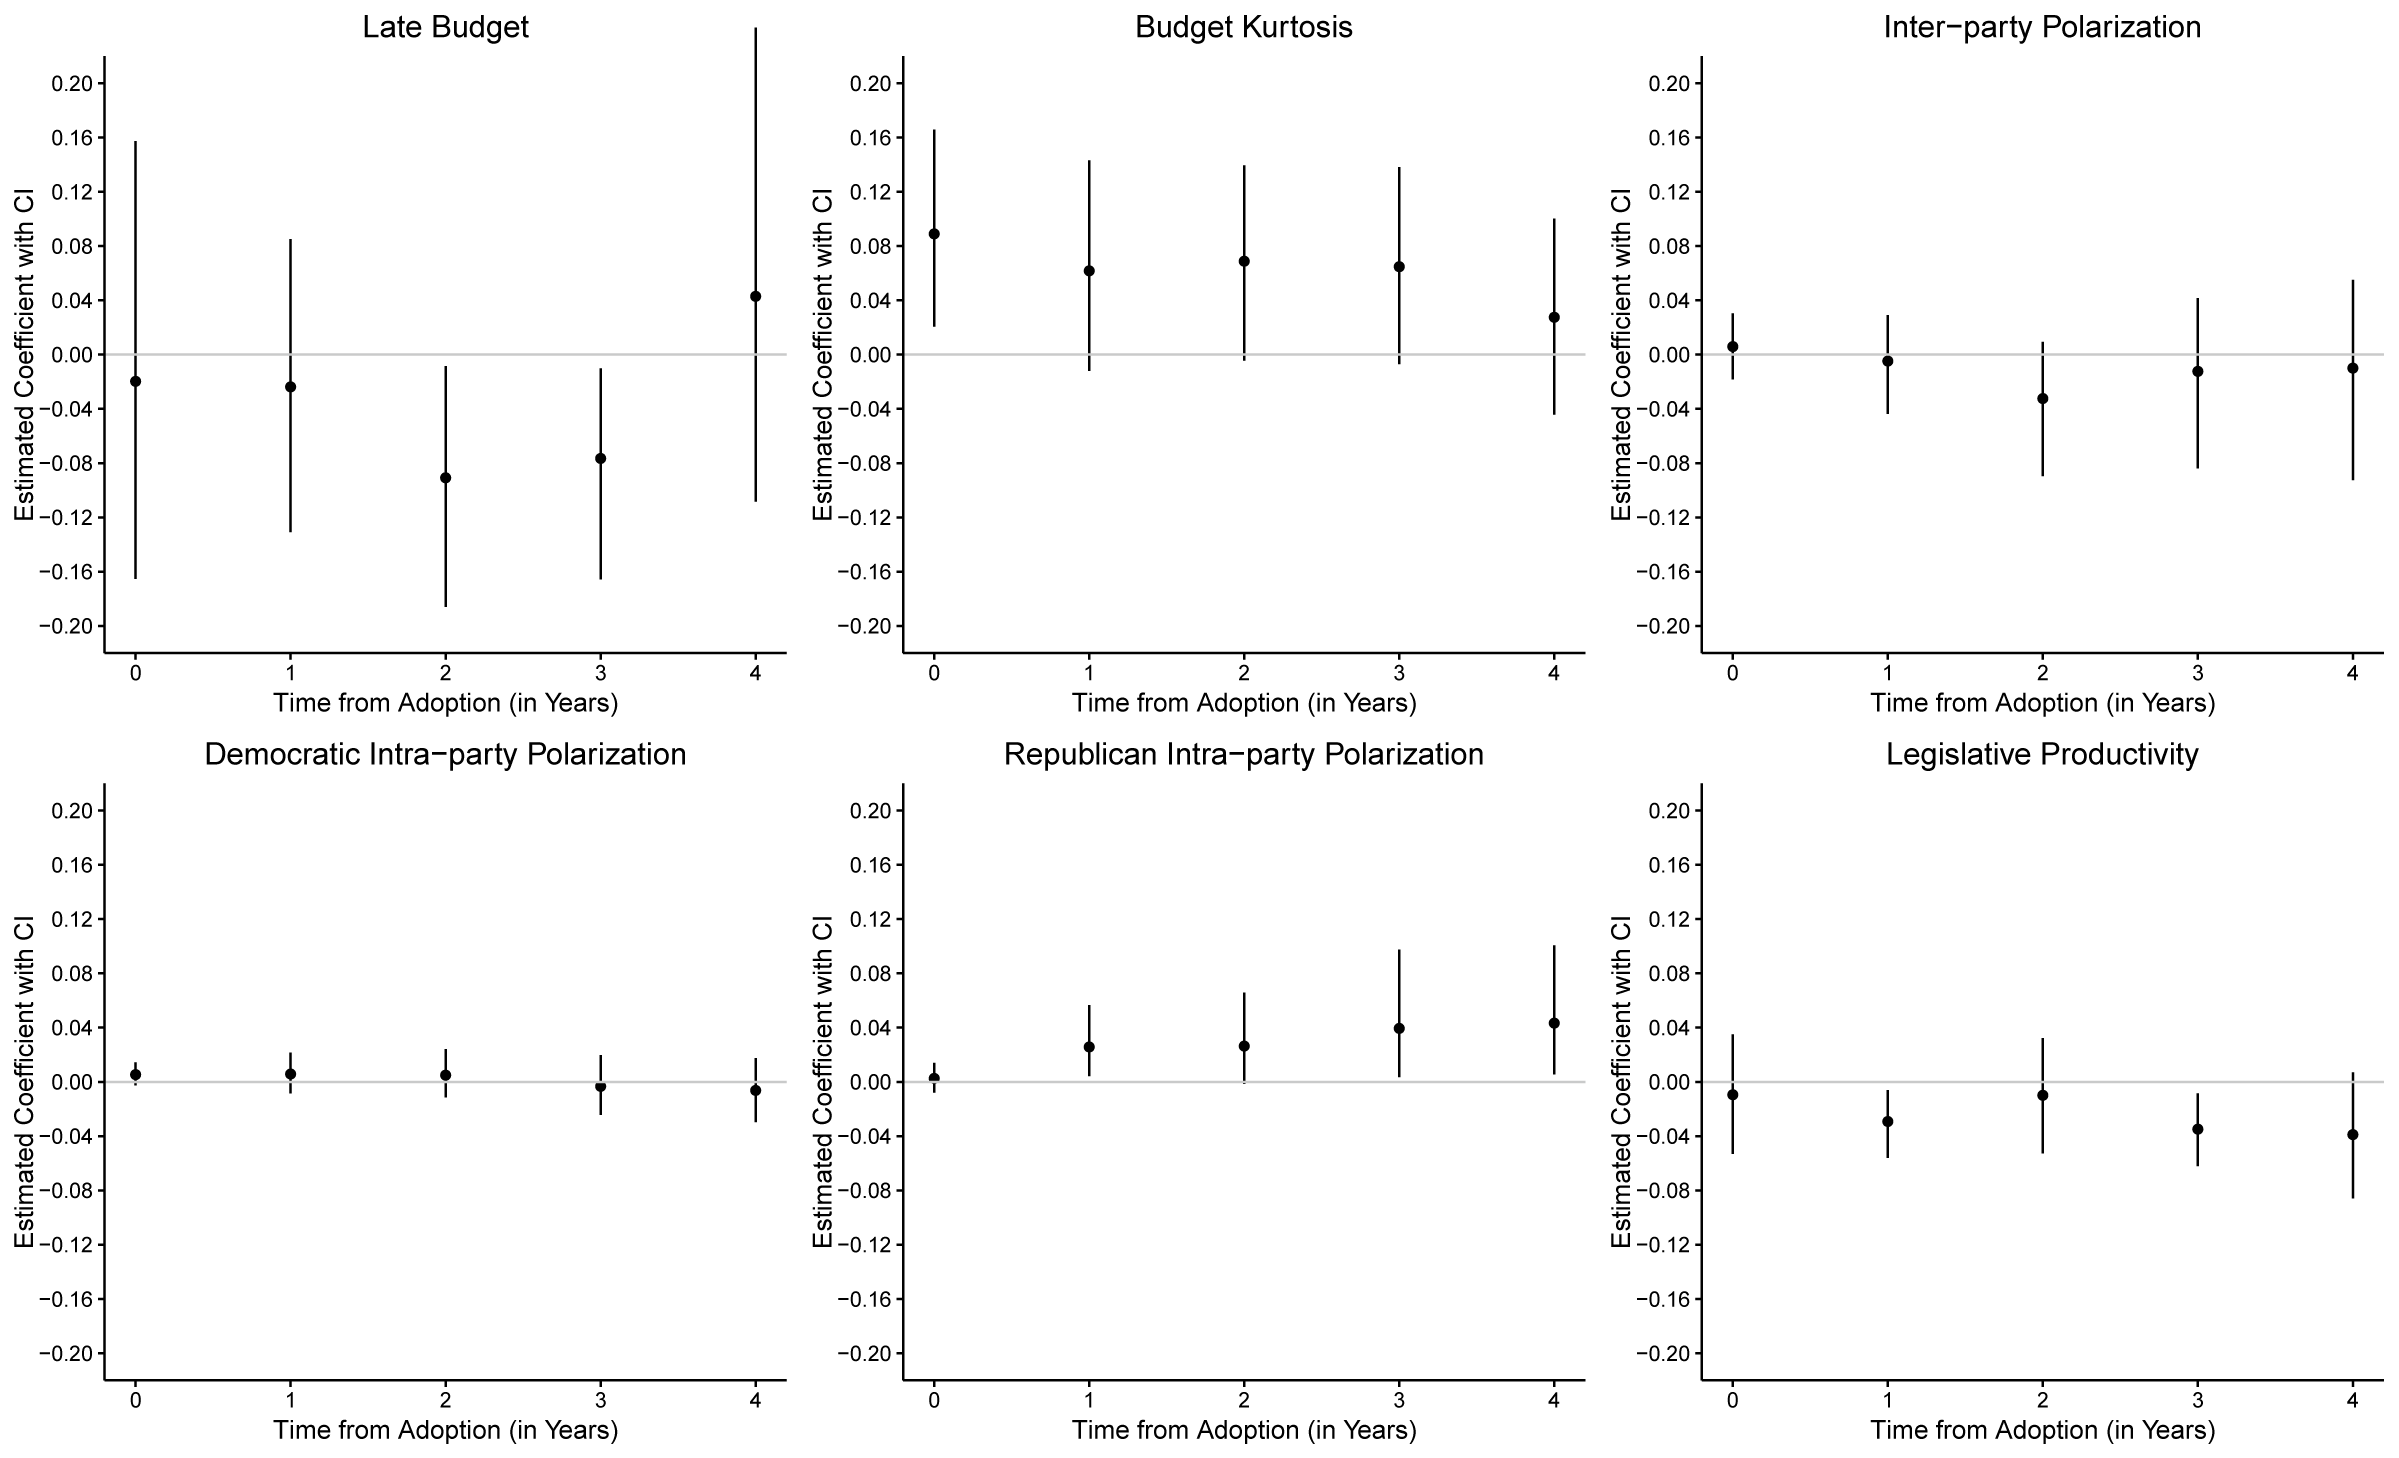
Estimated Chamber-Level Treatment Effects from PanelMatch
Note: Estimated average treatment effects from Table E1 in the Supplementary Material with 95% confidence intervals.

We also use an implementation of the Goodman-Bacon estimator (Goodman-Bacon Reference Goodman-Bacon2021) to determine the extent to which the treatment effects differ across different treatment cohorts, and the extent to which each different cohort is weighted when calculating the overall average treatment effect. Additional discussion and results are shown in Appendix D.2 of the Supplementary Material. There is very little evidence effects differ across cohorts (including for budget kurtosis), with the exception of inter-party polarization. This result, however, disappears when controls are included in any of the models.
Chamber-Level Lagged Effects
Finally, we seek to determine whether the effects of broadcast or streaming adoption on our chamber-level outcomes are lagged. Perhaps live coverage of floor activity produces more polarization, but only after a few years as legislators adjust their behavior. We use the PanelMatch estimator developed by Imai, Kim, and Wang (Reference Imai, Kim and Wang2023) that matches each treated observation with a control observation using observables, then estimates both short- and long-term treatment effects using difference-in-difference estimates averaged across all treated observations. We estimate possible current and future effects up to 4 years, for a total of 5 years per state-chamber. See Table E1 in the Supplementary Material for the results and Appendix E of the Supplementary for additional details on the PanelMatch process including covariate balance tests and the number of matched control units for each outcome.
Figure 4 shows the estimated point estimate and 95% confidence interval of broadcast or streaming adoption on late budget for the adoption year (time zero) and subsequent four years for each of the outcomes. Across 30 individual estimates, we find a few statistically significant results. There is a negative effect on late budgets in years two and three, indicating that adoption decreases the probability of a late budget. There is also a positive effect in the year of adoption for budget kurtosis, and positive effects for Republican intra-party polarization in the year after adoption, and in years three and four. The point estimate in year one is 0.026 (95% CI: 0.003 to 0.056), equal to 0.21 of a standard deviation, similar to the substantive effect found in the two-way fixed effects difference-in-difference models. The point estimates are larger at 3 and 4 years, equal to 0.039 and 0.043 (these effects disappear when we extend the time series past 4 years). However, these effects indicate that adoption decreased party cohesiveness, though this is the only estimation technique in which we find significant effects for this outcome.
Other statistically significant effects are found for legislative productivity, at years one and three. The substantive effect at year one is $ -0.029 $
(95% CI:
$ -0.029 $
(95% CI: $ -0.06 $
to
$ -0.06 $
to $ -0.004 $
), or about 0.05 of a standard deviation, and at year three it is 0.18 of a standard deviation, both very small substantive effects. None of these significant effects appear when examining the subset of “clean” treatment state legislatures. Separately, we examine whether legislative professionalism and term limits condition the relationship between adoption and our chamber-level outcomes. We find no evidence this is the case (see Appendix B.5 of the Supplementary Material).
$ -0.004 $
), or about 0.05 of a standard deviation, and at year three it is 0.18 of a standard deviation, both very small substantive effects. None of these significant effects appear when examining the subset of “clean” treatment state legislatures. Separately, we examine whether legislative professionalism and term limits condition the relationship between adoption and our chamber-level outcomes. We find no evidence this is the case (see Appendix B.5 of the Supplementary Material).
Overall, the chamber-level results offer little support for the claim that the adoption of broadcast or streaming coverage of state legislative floors affected any of the six outcomes we have examined. Even in those cases in which a significant or nearly significant result is found, the effects are not robust to different specifications or estimation techniques. These results lead us to conclude that at the chamber-level, effects of broadcasting or streaming floor proceedings are weak, and are not to blame for high levels of polarization or dysfunction in state legislatures.
ESTIMATED EFFECTS ON LEGISLATOR OUTCOMES
We now turn toward estimating effects on individual legislator outcomes: ideology (as measured by their NPAT score), party loyalty (as measured by the percentage of legislator-year votes in agreement with their party, only on party votes), and legislative effectiveness (as measured by their yearly state legislative effectiveness score). As with chamber-level outcomes, we take the year of adoption of gavel-to-gavel coverage as the treatment, and compare differences across legislators and across time.
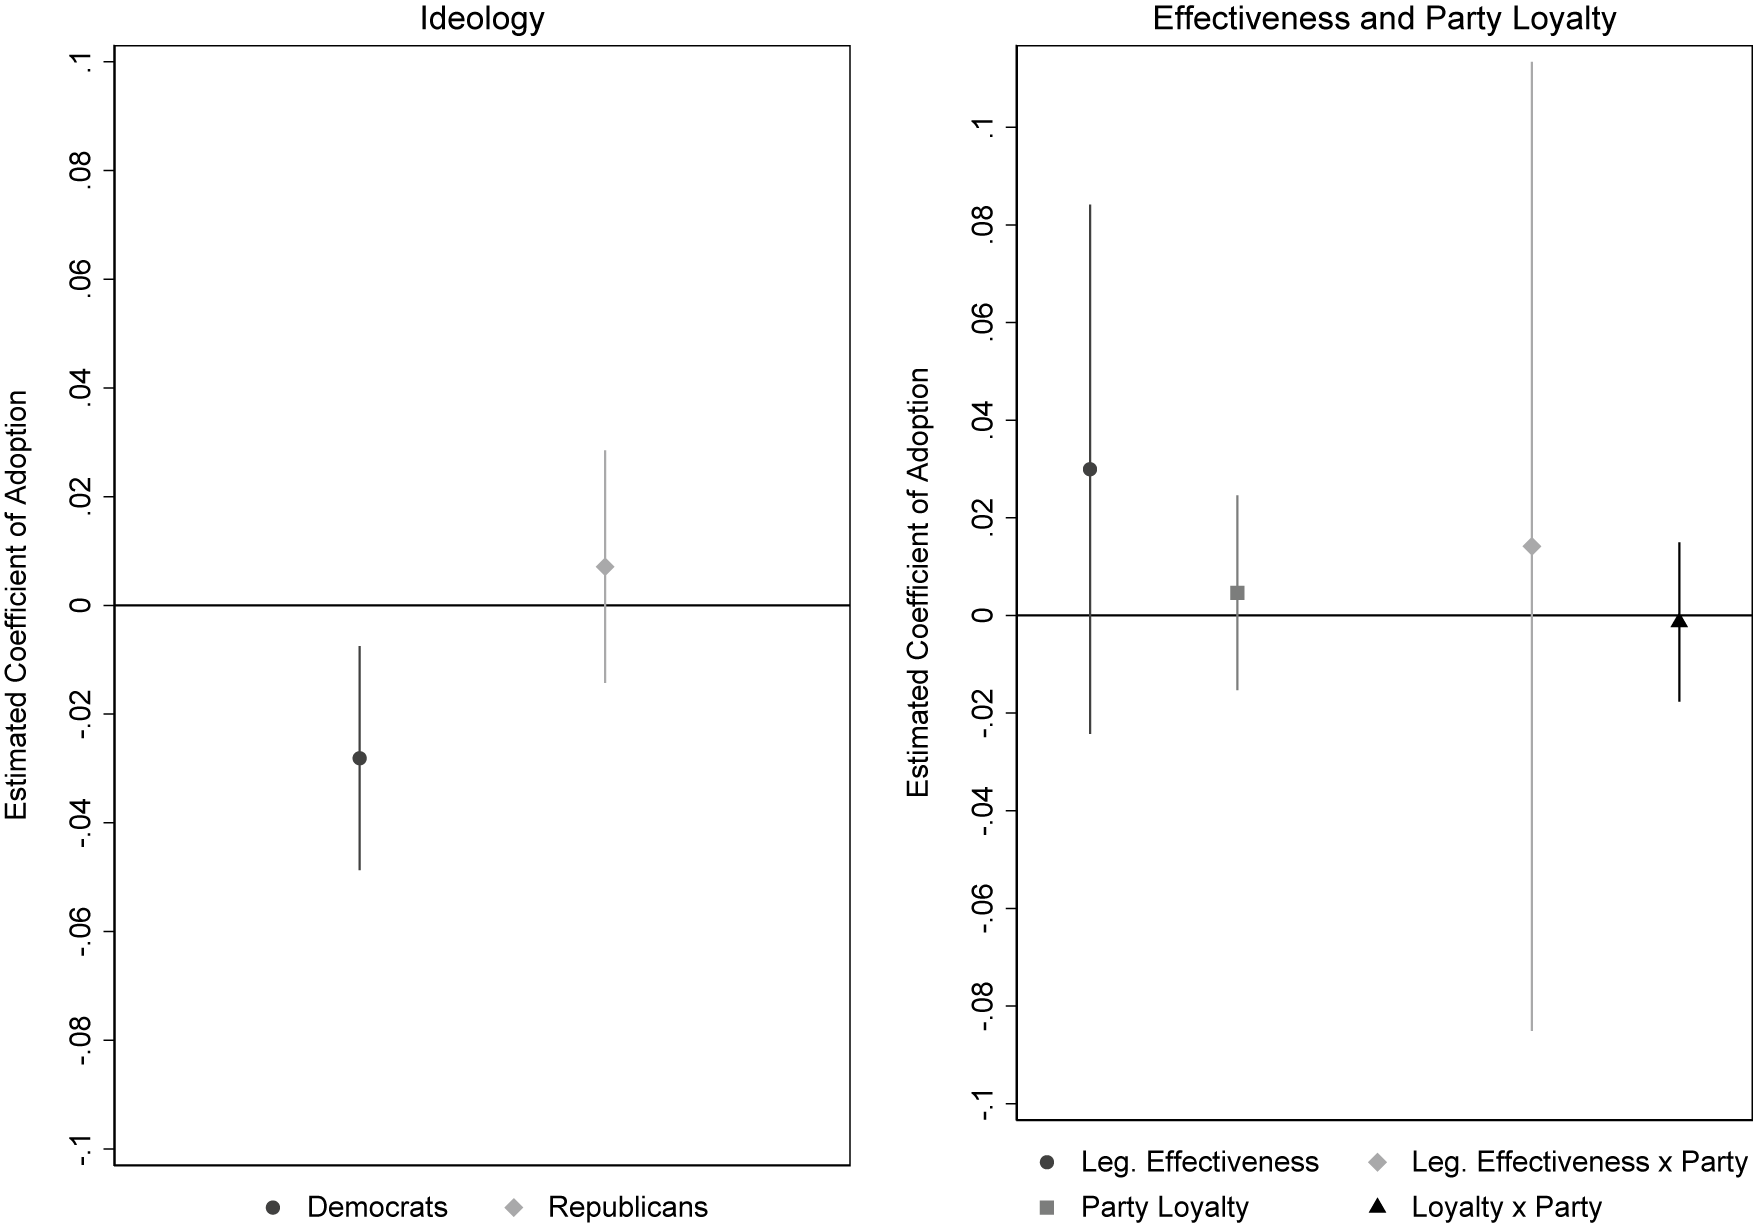
Our analyses use the same model specifications as for the chamber-level models, with additional legislator-level controls for majority party status and party identification.Footnote 22 We use fixed effects and clustered standard errors for year and district. Because we expect ideology scores to become more extreme due to floor coverage, the NPAT scores move in different directions for each party. That is, if adoption increases extremity, Republicans scores will increase while Democratic scores will decrease. Thus, when estimating ideology, we split the sample by party.Footnote 23 For the other two outcomes, we estimate one model with the treatment variable, and additional models with treatment interacted with party and majority status to examine different conditional effects. Figure 5 shows the two-way fixed effects difference-in-difference point estimates and associated confidence intervals, while Table F1 in the Supplementary Material shows the table of regression results.
Estimated Legislator-Level Coefficients from Diff.-in-Diff. Analysis
Note: Estimated coefficients from Table F1 in the Supplementary Material with 95% confidence intervals. Left panel shows coefficient of treatment separated by party; right panels shows treatment coefficients for both non-conditional effects when interacted with party. All models predicted using fixed effects regression.

We find a statistically significant and negative effect for Democratic ideology (left panel), indicating that Democrats became 0.028 points more ideologically extreme after the adoption of floor coverage (95% CI: $ -0.05 $
to
$ -0.05 $
to $ -0.01 $
). The estimated effect is quite small, however, equal to about 0.05 of a standard deviation.Footnote
24 We find no similar effect for Republicans. The right panel shows no effects for legislative effectiveness or party loyalty, either as unconditional effects or interacted with party.
$ -0.01 $
). The estimated effect is quite small, however, equal to about 0.05 of a standard deviation.Footnote
24 We find no similar effect for Republicans. The right panel shows no effects for legislative effectiveness or party loyalty, either as unconditional effects or interacted with party.
The Democratic Party component term is negative and statistically significant when interacted with majority party (Table F2 in the Supplementary Material), indicating that adoption of floor coverage makes Democrats more extreme when they are in the minority. Predicted probabilities also demonstrate that minority Democrats in states with floor coverage are distinct from minority Democrats in states without coverage. The effect is about 0.08 of a standard deviation (95% CI: 0.13 SDs to 0.02 SDs). None of the other floor coverage component terms or interaction terms are statistically significant in any of these models and there is no similar effect for Democrats in the majority, nor for Republicans under any condition.
As with our chamber-level analyses, we also replicate these models using only states which had a clean transition from no coverage to gavel-to-gavel coverage. The results are very similar, though there is a significant and negative effect of adoption on party loyalty. Marginal effects show the differences are driven by party rather than treatment status (Table F4 in the Supplementary Material). We also find no evidence that adoption affects any of our legislator-level outcomes conditional on term limits or legislative professionalism (Table F5 in the Supplementary Material).
Precision of Legislator-Level Null Effects
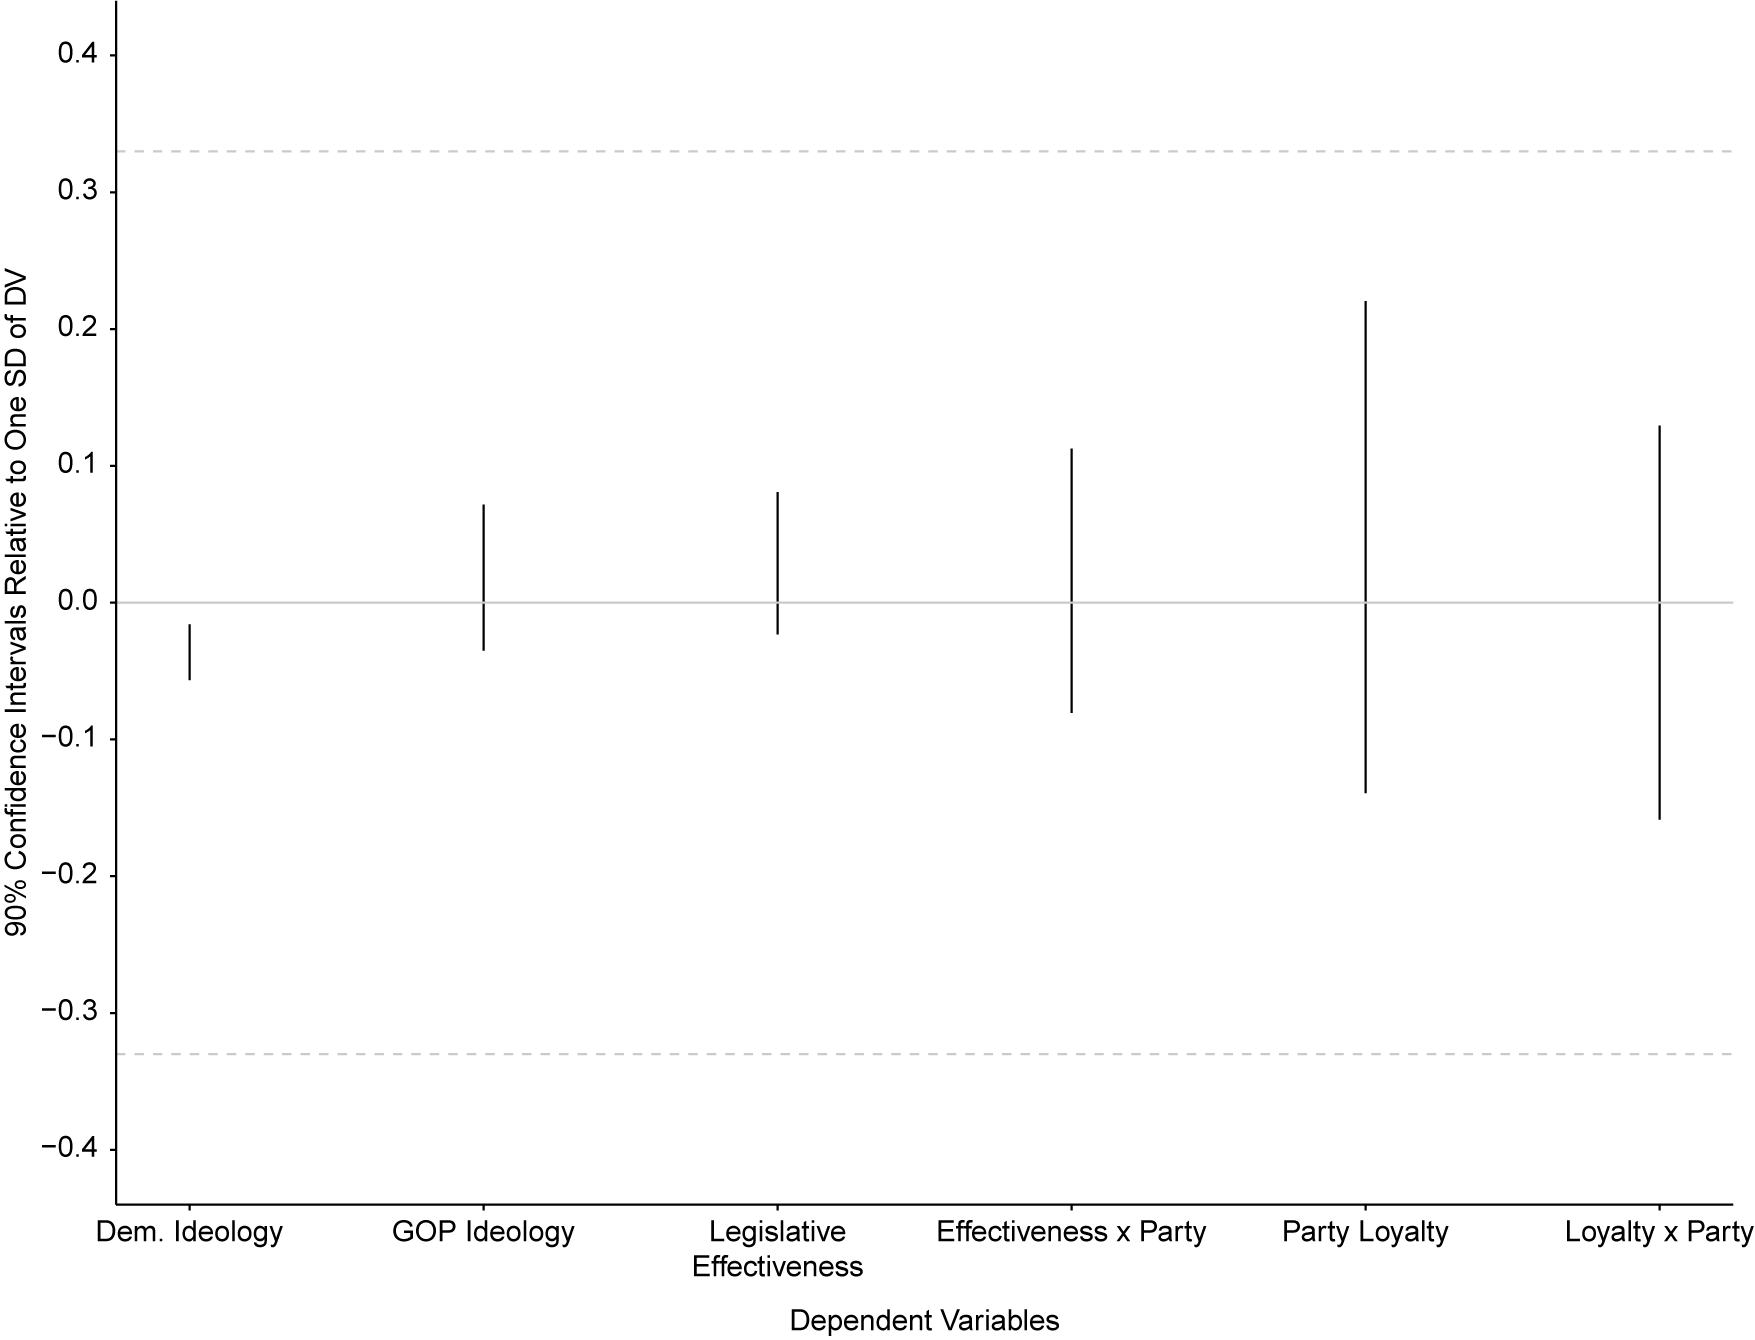
As we did with the chamber-level results, we explore how precise our null estimates are in Figure 6. We also display the significant result for Democratic Party ideology to contextualize its size. As with the chamber-level estimates, the substantive effects are exceedingly small—less than 0.33 of a standard deviation—and precisely estimated, giving us confidence that the true effect is not statistically different from zero (with the exception of the Democratic ideology score).
Estimated Precision of Legislator-Level Null Effects
Note: Results from Table F1 in the Supplementary Material. About 90% confidence intervals scaled to standard deviations of each dependent variable.

Parallel Trends Assumption for Legislators
We conduct two tests at the legislator-level to examine the parallel trends assumption (see Appendix G of the Supplementary Material). The first predicts change in treatment status using legislator ideology, legislative effectiveness and party loyalty, and the second predicts lagged outcomes using floor coverage adoption.
In both cases, there is some weak evidence that party loyalty predicts adoption. Specifically, greater party loyalty predicts change in treatment status in both the bivariate model and with controls. The component term is also significant when included in an interaction with party, but not when additional controls are included. Lagged treatment status also predicts party loyalty when controls are included, but not in the bivariate model.
These results suggest that legislators with greater party loyalty are more likely to be exposed to the treatment, perhaps because state-chambers with stronger parties are more likely to adopt these rules as a voting enforcement or monitoring mechanism. We interpret these results with caution, however, because there are no significant effects for related variables at the chamber-level (e.g., intra-party homogeneity). It is possible that adoption caused a reduction in these factors, but this is contrary to theoretical expectations; party leaders who adopt coverage presumably do so in order to strengthen their hand with legislators, not reduce it. Further, at the chamber-level, the parallel trends tests show no evidence that state-chambers which adopted gavel-to-gavel coverage are meaningful different than those that did not. Besides party loyalty, other variables predict change in treatment status, but the results are not consistent across models nor when predicting lagged treatment.
LEGISLATOR-LEVEL HETEROGENEOUS TREATMENT EFFECTS AND LAGGED EFFECTS
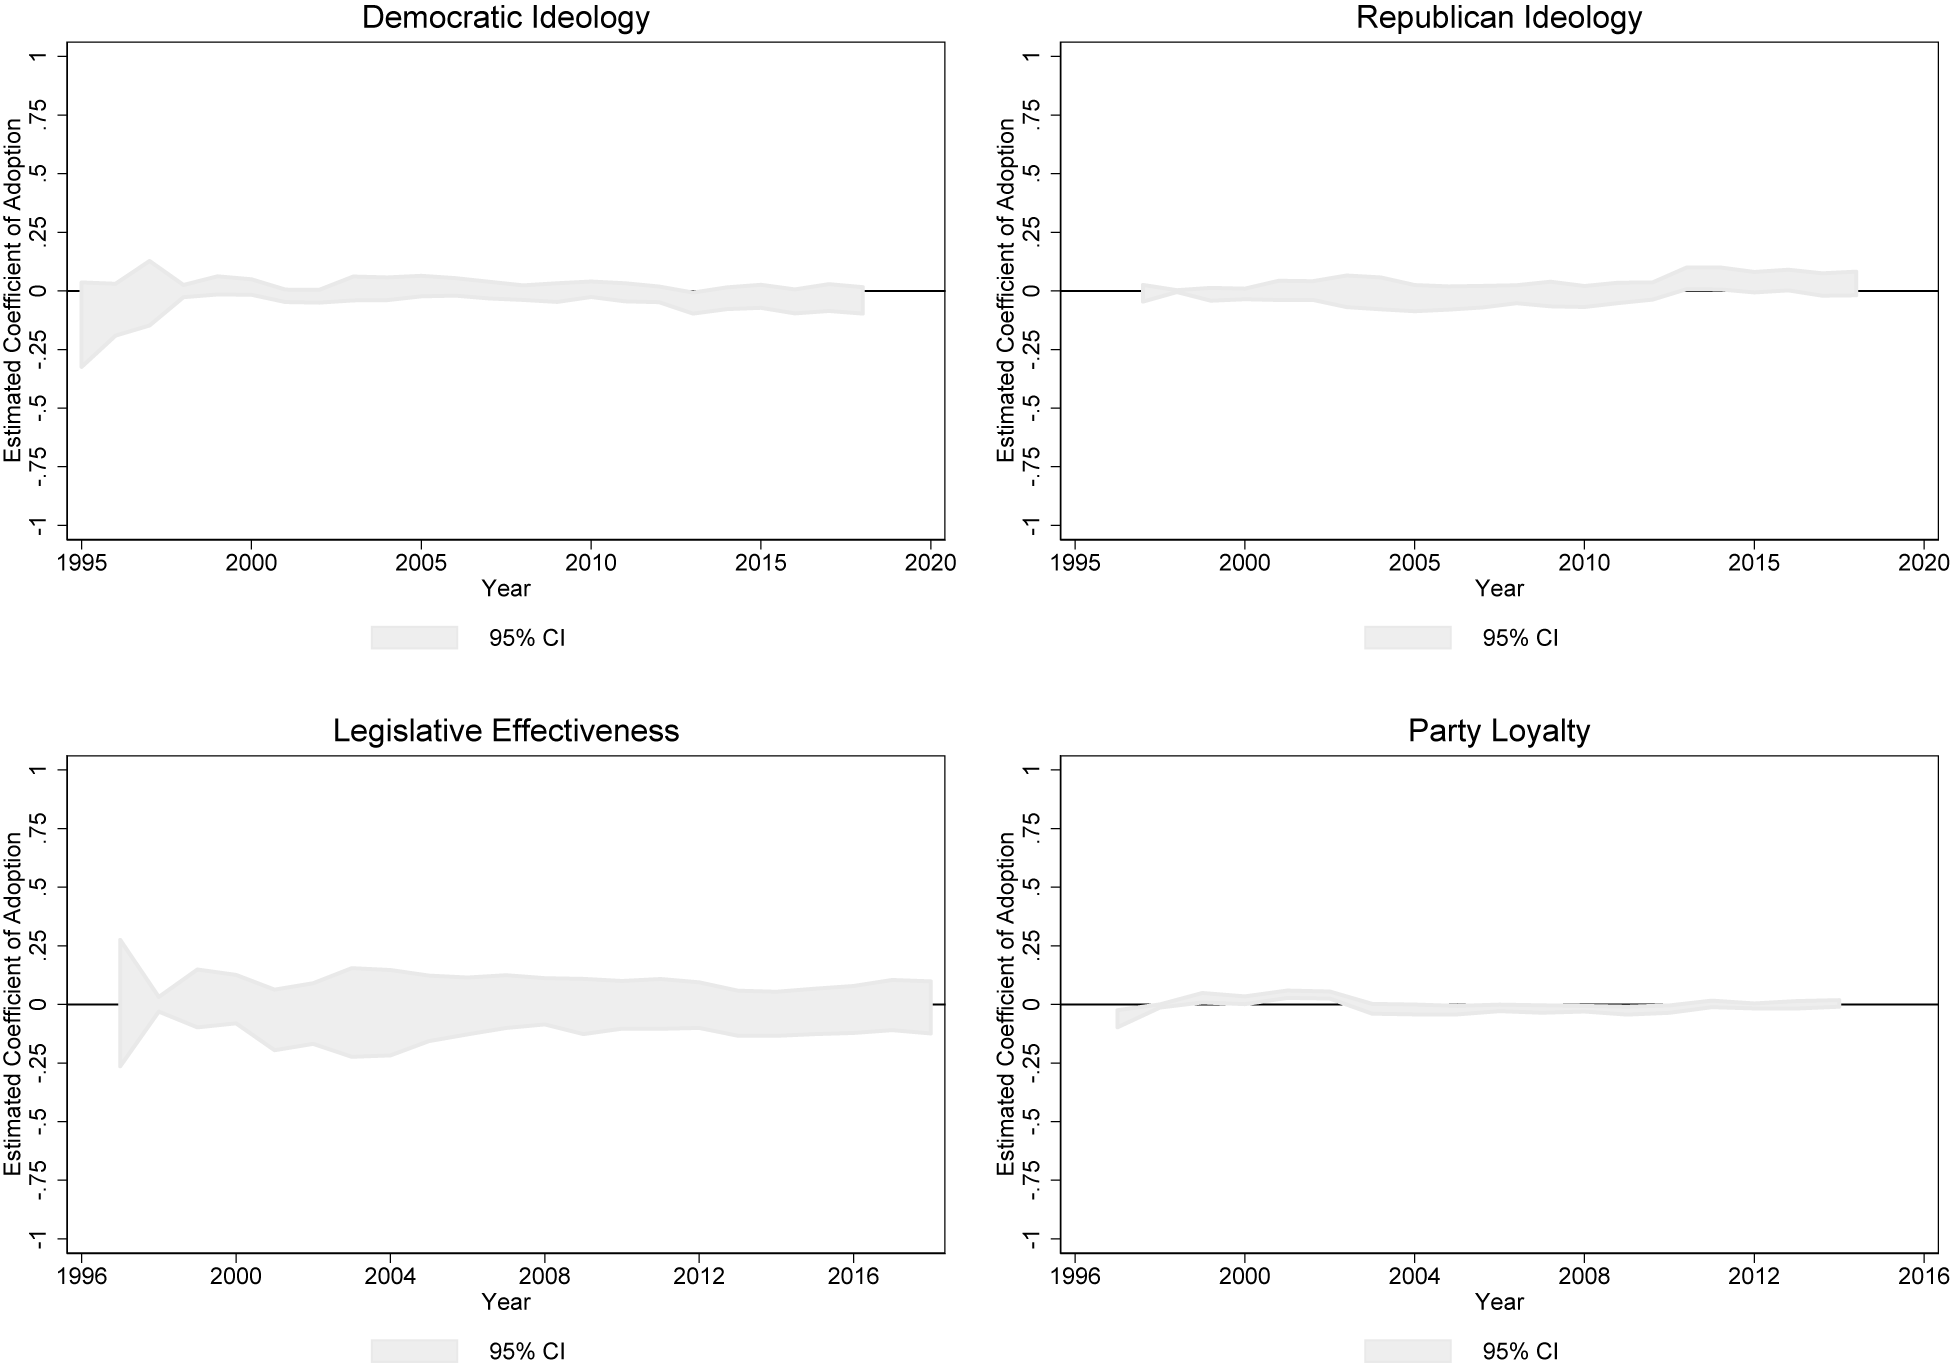
As with the chamber-level data, we also test for heterogeneous treatment effects based on time of adoption for individual legislators through a cohort analysis (see Appendix H of the Supplementary Material for details). Figure 7 shows the estimates using average treatment effects across different years and groups (districts), then aggregated by year to determine whether the treatment effect differs for earlier or later treated districts (results shown in Table H1 in the Supplementary Material).Footnote 25
Estimated Legislator-Level Treatment Effects Over Time
Note: Results from Table H1 in the Supplementary Material. Estimated average treatment effects aggregated by time period, with 95% confidence intervals. Calculated using regression adjustment technique in Stata.

There are no consistent results across cohorts for each of the four outcomes. Importantly, there is no significant effect of adoption on Democratic Party ideology except for 1 year. There is a statistically significant and negative effect on party loyalty for the years 1997 and 1998, a positive effect from 1999 to 2002, and a negative effect again from 2003 to 2010. As discussed, this negative result is inconsistent with theoretical expectations, and inconsistent with the occasional positive result. The results on states with discrete gavel-to-gavel adoption are very similar, though the statistically significant negative effect on party loyalty appears only after 2011 (Figure H1 in the Supplementary Material). Thus, we conclude that there is little systematic effect of adoption on party loyalty.
Legislator-Level Lagged Effects
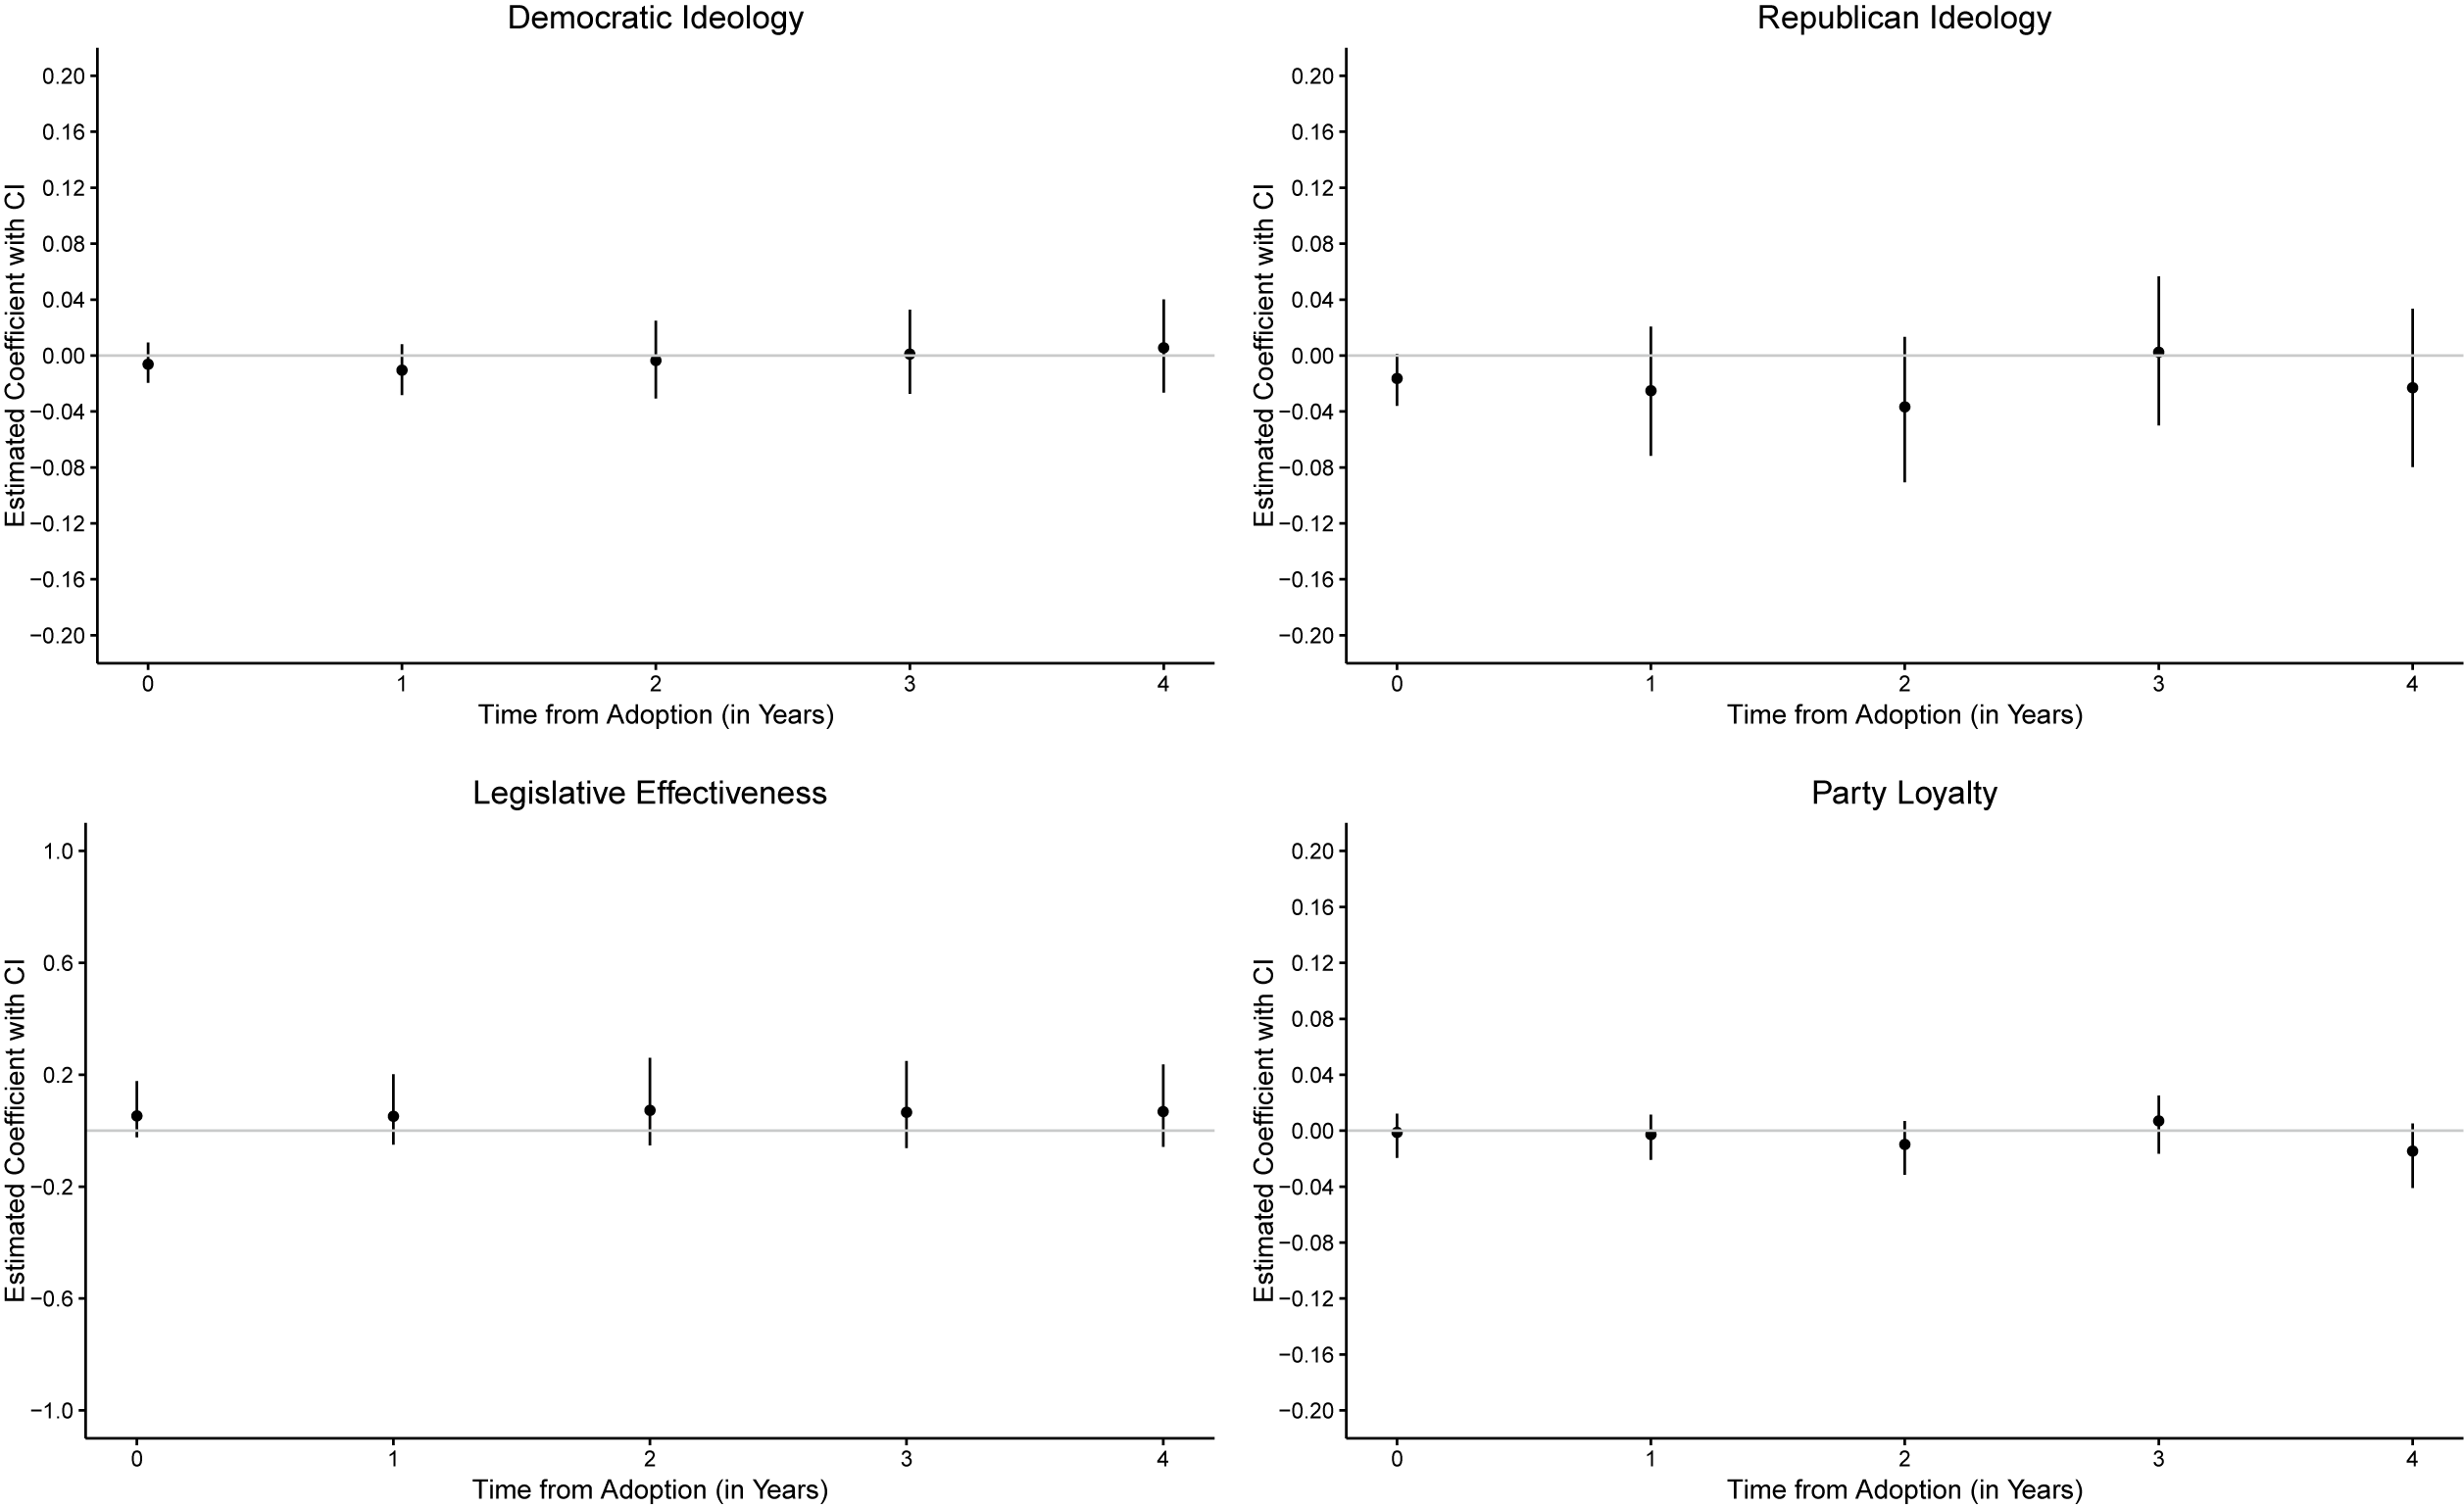
Our last analysis examines lagged or delayed effects on individual legislator behavior using PanelMatch. The unit is the district so the analysis matches on treatment history and the other covariates specified, then finds treatment effects for the year of adoption of coverage, plus 4 years into the future (Table I1 in the Supplementary Material). Unlike the chamber-level results which all used propensity score matching, the balancing technique differs for each outcome because the samples are slightly different (see Appendix I of the Supplementary Material).
Figure 8 shows the results for each of the four outcomes, with ideology separated by party. Consistent with the other legislator-level results, there are no statistically significant results across any of the four variables for each of the 5 years estimated. These results are also largely consistent with the estimates from the difference-in-difference models with respect to significance and substantive effect size. In particular, there was some evidence from those models that adoption of gavel-to-gavel coverage had a negative effect (i.e., more ideologically extremity) on Democratic ideology. We do not find evidence in this analysis for that finding. Figure I6 in the Supplementary Material shows the corresponding results for the “clean” subsample, with similar results.Footnote 26
Estimated Legislator-Level Treatment Effects from PanelMatch
Note: Estimated average treatment effects from Table I1 in the Supplementary Material with 95% confidence intervals. Matching method used is Mahalanobis distance for Democratic ideology, covariate balance propensity score matching for Republican ideology and party loyalty, and propensity score matching for legislative effectiveness.

DISCUSSION
We find virtually no evidence that the adoption of broadcast coverage or streaming has any substantive, sustained effect on our outcomes of interest. We occasionally find significant effects, but these findings appear to be idiosyncratic to an estimation strategy; there is little systematic evidence that any of our outcomes of interest are dramatically affected by the treatment. We certainly do not find compelling evidence that gavel-to-gavel coverage of state legislatures is to blame for the rapid rise in polarization or dysfunction in the chambers. While we cannot be certain that these findings extend to other levels of government or other types of transparency, they cast doubt on the claims of those who wish to restrict cameras within governing institutions for reasons centering on partisanship or dysfunction.
Elected officials who claim cameras produce bad behavior are astute observers of their colleagues and their chambers, but they are not immune to the challenges of making generalizable inferences from personal experiences, and rising polarization and partisanship are generally correlated over time with the introduction of cameras. C-SPAN first broadcast legislative proceedings in the U.S. House of Representatives in 1979, with the U.S. Senate following suit in 1986. This timeline corresponds with the acceleration of polarization and partisanship in these chambers (Poole and Rosenthal Reference Poole and Rosenthal1997). Most states in our dataset adopted gavel-to-gavel coverage after the U.S. Congress, at a time when polarization in state legislatures was increasing, tracking with national trends (Masket Reference Masket2011).
Beyond the temporal association, some elected officials may be motivated to blame cameras by self-interest. Cameras are an easy scapegoat, and blaming other possible sources of polarization—elected officials themselves, party organizations, voters, or donors—might be costly to legislators. Further, legislators may simply oppose more transparency and seek to undermine efforts to increase voter monitoring of their behavior. The association between the adoption of cameras and polarization underscores the utility of our empirical approach in which we make comparisons across a large number of legislatures over several decades, something that is impossible for an individual legislator or political observer to do.
Our results identify average treatment effects across states and across time. It is possible that a particularly shrewd party leader or legislator used the introduction of gavel-to-gavel coverage to affect polarization, party loyalty, or the policymaking process more generally, much as Newt Gingrich famously did in the House in the late 1980s (Maltzman and Sigelman Reference Maltzman and Sigelman1996). The factors that might explain such effects rely on individual legislator characteristics and the results of such behavior may not be seen for years or even decades. From an empirical perspective, such effects become much harder to identify as years increase. While beyond the purview of our manuscript, the identification of a particular legislator who used the adoption of gavel-to-gavel coverage to further their own or their party’s electoral goals offers a fruitful avenue for future research.
We focus on gavel-to-gavel coverage of legislative proceedings as the intervention most likely to alter outcomes and behaviors, but cameras were present in some legislatures on a part-time basis prior to gavel-to-gavel coverage (Crain and Goff Reference Crain and Goff1986). It is possible that this early usage is what altered behaviors and outcomes such that our measures of gavel-to-gavel adoption have missed the shift that occurred. With that in mind, we examined a subset of states in which there was little to no coverage prior to gavel-to-gavel adoption and find nearly identical results. Another possibility is that legislative business shifted away from venues captured by cameras. Leadership or committee offices, private conference rooms, and even local social venues such as restaurants may become places where bills are debated and language agreed to, rather than chamber floors. If that is the case, cameras may not shine a light on the inner workings of legislative institutions as much as advocates hope.
We also cannot discount the possibility that behavior remains unchanged, while rhetoric, tone, and the tenor of deliberations grow more contentious because of cameras. Perhaps legislators speak differently than they did before cameras, even if their voting behavior has not changed. How a message is conveyed is important, but our focus is on the dynamics of policymaking and deliberative outcomes, an appropriate first step in understanding the effect of increased transparency through gavel-to-gavel coverage. We acknowledge rhetorical outcomes are important as well, however, there is a significant measurement challenge at the state level. We are also careful to avoid drawing inferences about other kinds of transparency initiatives such as audio recordings, temporary camera usage, or even printed roll call voting results in the local media. While we have found that gavel-to-gavel camera coverage does not appear to have important substantive effects on legislative outcomes, it remains possible that these other reforms have consequences. Future research should explore how the adoption of these reforms may have altered the policymaking process.
Concerns about the effect of televising or streaming government proceedings are more pronounced recently. The COVID-19 pandemic and the increasing ease with which government entities may stream their deliberations on the internet via platforms like YouTube encourages gavel-to-gavel coverage. As a result, recent years have seen a dramatic increase in the prevalence of cameras in deliberative bodies. School districts, city councils, and bureaucratic entities now commonly provide streaming access to their meetings. All of these institutions feature government officials, either elected or appointed, making public policy decisions. And, all of these officials make policy decisions that are mostly obscure and unknown to voters. If their behavior changes because of awareness that their conversations, deliberations, and voting decisions are more easily accessible to the public, then it is important to understand the conditions and size of those effects. If there is no negative effect of the adoption of public broadcast/streaming on government officials’ behavior, then increased access to meetings, hearings, and legislative deliberations may produce greater adherence to constituent preferences (though we do not find evidence for that, either). Overall, the findings reveal few empirical effects resulting from the introduction of gavel-to-gavel televised or streamed coverage in state legislatures, and arguments for or against their usage in other governing institutions should be circumspect based on these results.
SUPPLEMENTARY MATERIAL
To view supplementary material for this article, please visit https://doi.org/10.1017/S0003055425101032.
DATA AVAILABILITY STATEMENT
Research documentation and data that support the findings of this study are openly available at the American Political Science Review Dataverse: https://doi.org/10.7910/DVN/W0ZMF8.
ACKNOWLEDGEMENTS
We thank Frankie Meehan, Timothy Papenfuss, and Derek Davidson for assistance with the data collection. Michael Crespin, Bill Schreckhise, Justin Kirkland, Jeff Harden, Carlos Algara, Michael Touchton, and Scott Meinke provided helpful comments and suggestions. Finally, we thank participants at the Utah State Political Economy Colloquium: Mike Findley, Greg Goelzhauser, Lauren Van De Hey, Austin Knuppe, Jia Li, Mike Lyons, Anna Pechenkina, Diego Romero, and Steve Sharp.
CONFLICT OF INTEREST
The authors declare no ethical issues or conflicts of interest in this research.
ETHICAL STANDARDS
The authors affirm this research did not involve human participants.





 Open access


Comments
No Comments have been published for this article.