


Non-technical Summary
Cambrian radiolarian genera, including Archeoentactinia, Echidnina, Fungomacula, and Varispiculum, were examined using Xray micro-computed tomography, unveiling exclusively spicular compositions. This prompts taxonomic revisions, such as synonymizing Archeoentactinidae with Echidninidae, and establishment of Fungomaculidae n. fam. By elucidating how diverse spicule types and configurations give rise to the varied morphologies in these early radiolarians, the study provides critical insights into the phylogenetic relationships, laying a foundation for a natural classification.
Detailed analysis of specimens assigned to the Archeoentactinia reveals significant intraspecific variations, leading to the establishment of different morphotypes. This enables recognition of spicule characteristics that were not yet fixed even within a single species in the middle Cambrian and later evolved into important characteristics for species differentiation. The first median-bar-centered spicule is observed in Archeoentactinia incaensis Morphotype 4. Detailed comparisons with the Lower Ordovician entactinarian Varispiculum ectospiculatum confirms a direct “missing” ancestral–descendant link between Archeoentactinia and Entactinaria. At least one Entactinarian lineage appears to have evolved from the point-centered spicular Echidninidae.
Introduction
Radiolarians are globally distributed, single-celled, silica-secreting marine zooplankton known for their intricate and diverse skeletal structures (Obut and Iwata, Reference Obut and Iwata2000; De Wever et al., Reference De Wever, Dumitrica, Caulet and Caridroit2001). Since their discovery in the 1830s (Ehrenberg, Reference Ehrenberg1838), they have captivated scientists due to their abundance and remarkable structural complexity, which also led to their early taxonomic classification scheme developed by Haeckel (Reference Haeckel1887). As a ubiquitous component in both the geological record and the present-day plankton population, they have played a critical role as key indicators in biostratigraphy, paleoecology, and ecological studies (De Wever et al., Reference De Wever, Dumitrica, Caulet and Caridroit2001). However, the application of Paleozoic radiolarians in various fields has been significantly hindered compared with their Mesozoic and younger counterparts due to less well-developed understanding of the evolution of their taxonomy (Riedel, Reference Riedel, Funnell and Riedel1971; Baumgartner et al., Reference Baumgartner, O’Dogherty, Gorican, Dumitrica-Jud, Dumitrica, Baumgartner, O’Dogherty, Gorican, Urquhart, Pillevuit and De Wever1995; De Wever et al., Reference De Wever, Dumitrica, Caulet and Caridroit2001; Noble et al., Reference Noble, Aitchison, Danelian, Dumitrica, Maletz, Suzuki, Cuvelier, Caridroit and O’Dogherty2017). Several Paleozoic radiolarian groups are hard to differentiate solely on their external features due to superficial similarities arising from convergent evolution, compounded by the inadequate resolution and depth of field of traditional imaging methods (De Wever et al., Reference De Wever, Dumitrica, Caulet and Caridroit2001). Diagenetic infilling of tests with secondary silica further compounds this problem. This has led to a somewhat artificial classification system with limited understanding of natural phylogeny, often resulting in inconsistencies in species differentiation (e.g., Won and Below, Reference Won and Below1999; Won and Iams, Reference Won and Iams2002; Kachovich et al., Reference Kachovich, Sheng and Aitchison2019). The failure to distinguish true homologous features has resulted in artificially extended radiolarian age ranges and diminished their perceived biostratigraphic potential in the Paleozoic (Kachovich et al., Reference Kachovich, Sheng and Aitchison2019). The taxonomic values of many morphological characteristics remain uncertain, and more basic research is needed to accurately determine their taxonomic hierarchy.
Over the past 35 years, abundant, diverse, and well-preserved assemblages of radiolarians have been recovered from middle Cambrian strata of the Georgina Basin, Australia, and upper Cambrian to Lower Ordovician strata from Newfoundland, Canada (Won and Below, Reference Won and Below1999; Won and Iams, Reference Won and Iams2002, Reference Won and Iams2011, Reference Won and Iams2013, Reference Won and Iams2015; Won et al., Reference Won, Iams and Reed2005, Reference Won, Iams and Reed2007; Pouille et al., Reference Pouille, Danelian and Maletz2014). Despite the excellent preservation of these radiolarians, structural descriptions of many groups remain vague and superficial due to the limitations of traditional imaging methods such as scanning electron microscopy (SEM) and transmitted light microscopy (TLM). The higher-level placements of numerous genera and even some families remain unresolved, and the relationships among different groups are poorly understood. A detailed understanding of the skeletal architecture of these fossils is crucial for developing lower Paleozoic taxonomy. X-Ray micro-computed tomography (MCT) offers a solution by providing high-resolution images that can be reconstructed into three-dimensional models for thorough investigations (e.g., Kachovich et al., Reference Kachovich, Sheng and Aitchison2019; Kachovich and Aitchison, Reference Kachovich and Aitchison2020; Perera et al., Reference Perera, Aitchison and Nothdurft2020; Perara and Aitchison, Reference Perara and Aitchison2022, Reference Perara and Aitchison2023).
This study aims to explore the taxonomic and phylogenetic information embedded in the intricate skeletal architecture of middle Cambrian and Lower Ordovician radiolarians using MCT. Exceptionally well-preserved radiolarians from the Wuliuan–Drumian Inca Formation, Georgina Basin, Australia, and two Lower Ordovician entactinarian radiolarians from the Cow Head Group, Newfoundland, were studied (Won et al., Reference Won, Iams and Reed2005; Won and Iams, Reference Won and Iams2015; Sheng et al., Reference Sheng, Kachovich and Aitchison2020). Significant intraspecific morphological variations were observed, leading to the recognition of various morphotypes and their importance in the speciation and diversification of early radiolarians, including the emergence of the Entactinaria.
Materials and methods
Laboratory-based MCT analysis of middle Cambrian radiolarians from the Inca Formation
Over 500 kg of limestone concretion samples were collected from a section through the Inca Formation near D-Tree on Thorntonia Station, located approximately 200 km north of Mount Isa (from 19∘44’15.7"S, 138∘53’51.9"E to 19∘43’57.6"S, 138∘53’47.7"E; WGS84) in the Georgina Basin for the study by Sheng et al. (Reference Sheng, Kachovich and Aitchison2020). The age of this unit is constrained to the Wuliuan–Drumian stages of the Miaolingian Series according to global correlation with trilobite assemblages, including the Ptychagnostus gibbus and Ptychagnostus punctuosus zones (Öpik, Reference Öpik1979; Shergold et al., Reference Shergold, Jago, Cooper, Laurie, Shergold and Palmer1985; Shergold, Reference Shergold1995; Shergold and Cooper, Reference Shergold, Cooper, Gradstein, Ogg and Smith2005; Babcock et al., Reference Babcock, Robison, Rees, Peng and Saltzman2007; Peng et al., Reference Peng, Babcock, Zuo, Lin and Zhu2009; Ogg et al., Reference Ogg, Ogg, Gradstein, Ogg, Ogg and Gradstein2016; Geyer, Reference Geyer2019; Zhao et al., Reference Zhao, Yuan, Babcock, Guo and Peng2019; Sheng et al., Reference Sheng, Kachovich and Aitchison2020).
While only a handful of specimens were recovered by the authors during the initial study, continued sample digestion over the following months revealed limestone laminae containing radiolarians and minute sponge spicules. In contrast to the just over a dozen specimens of low diversity reported in the 2020 study, these radiolarian-rich layers (sample SEES/TH12) produced a diverse assemblage of >50 specimens with superior preservation, reported in this study. Specimen imaging using SEM, X-Radia 500 MCT, and digital processing using Avizo and Dragonfly software followed procedures outlined in Sheng et al. (Reference Sheng, Kachovich and Aitchison2020).
Synchrotron MCT analysis of Lower Ordovician radiolarians loaned from the Geological Survey of Canada
Radiolarian assemblages from the upper Floian Cow Head Group, Newfoundland, reported in the study by Won and Iams (Reference Won and Iams2015), are curated by the Geological Survey of Canada. The specimens were mounted on SEM stubs using water-soluble glue by the lead author, M.-Z. Won, and this material was made available for our investigation. In preparation for illumination by synchrotron radiation, radiolarians were mounted at the center of the back of a 7 mm diameter pencil stub using double-sided carbon tape. They were scanned using the MCT beamline of the Australian Nuclear Science and Technology Organisation (ANSTO) Australian Synchrotron in Melbourne, a 3 GeV third-generation source with a circumference of 216 m. Utilizing a 15 keV monochromatic beam (3% bandwidth), the configuration was established with a source-to-sample distance of 21.5 m and a sample-to-detector distance of 0.16 m. The scan employed an exposure time of 1.5 seconds, taking a total of 1,201 projections over a scan range of 180°. The entire scanning procedure was completed in 20 minutes. Projection images were acquired using a high-resolution camera (2,560 × 2,160 pixels) coupled with 20× objective magnification, giving an effective pixel size of 0.36 × 0.36 μm. Data processing and three-dimensional (3D) reconstruction were undertaken using an MCT processing pipeline in high-performance computing resources, ASCI (Australian Synchrotron Computer Infrastructure) desktop. Dragonfly software was used for data analysis, segmentation, and 3D rendering presentation.
Repositories and institutional abbreviations
Specimens examined in this study are deposited in the micropaleontology collection of the School of the Environment, The University of Queensland, Australia (SENVS-UQ). SENV/TH12_xxx refers to the collection number, with the two characters and two digits after the solidus being the sample identification number. The last three digits correspond to the specimen identification number. The other repository mentioned herein is the National Type Collection of lnvertebrate and Plant Fossils, Geological Survey of Canada (GSC).
Results
Exceptionally well-preserved radiolarians were recovered from limestone concretion sample SEES/TH12 (Sheng et al., Reference Sheng, Kachovich and Aitchison2020). The specimens recovered belong to the Archaeospicularia and encompass three families (including one new family, Fungomaculidae n. fam.), four genera, and eight species, including two new species: Archeoentactinia incaensis Won in Won and Below, Reference Won and Below1999 (12 specimens), A. tetractinia Won in Won and Below, Reference Won and Below1999 (four specimens), A. hexactinia Won in Won and Below, Reference Won and Below1999 (four specimens), A. pentactinia n. sp. (three specimens), A. heptactinia n. sp. (one specimen), Echidnina irregularis Won and Iams, Reference Won and Iams2002 (eight specimens), Palaeospiculum arcussimile Won in Won and Below, Reference Won and Below1999 (>50 specimens), and Fungomacula barbatula Won in Won and Below, Reference Won and Below1999 (12 specimens).
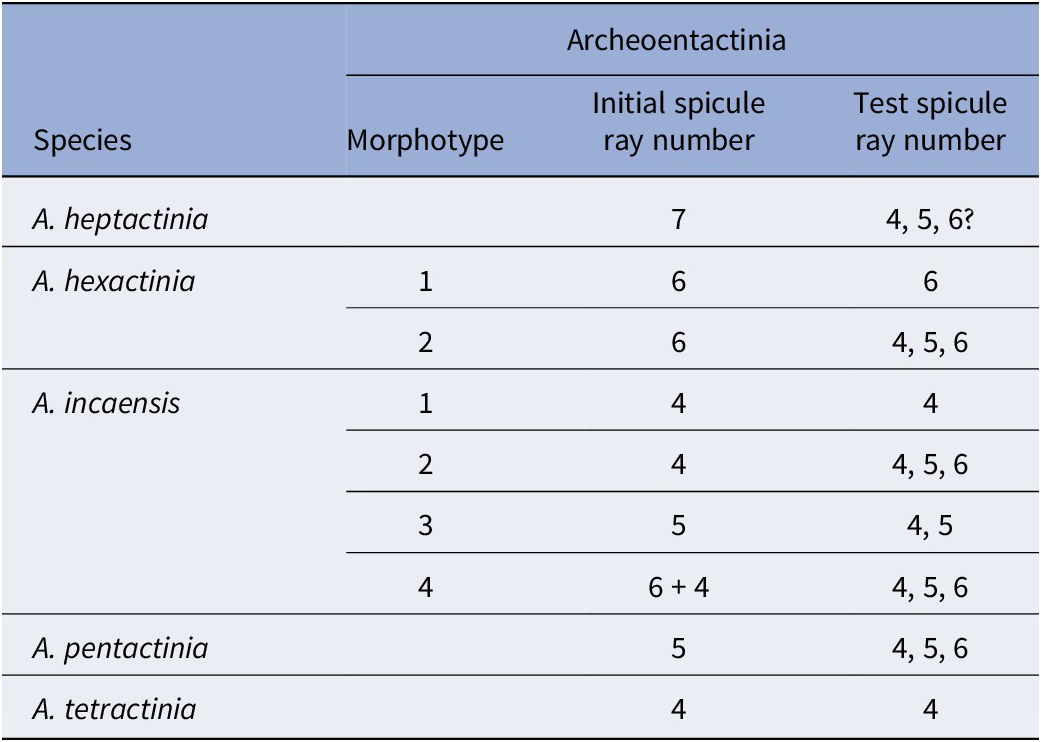
MCT analysis of specimens of Archeoentactinia reveals high intraspecific variation, most notably in the ray numbers of both initial spicules and those constructing the subspherical tests (referred to as test spicules in this study). For A. incaensis, three additional new morphotypes are identified (Figs. 1–3), while for A. hexactinia, two morphotypes are identified (Figs. 4, 5). A new species, A. pentactinia, is established on the presence of a large five-rayed initial spicule (Figs. 6.1, 6.2, 7). A. heptactinia n. sp. is established on the presence of a large seven-rayed initial spicule (Fig. 6.7; Table 1). The first median-bar-centered initial spicule is identified in a specimen of Archeoentactinia incaensis morphotype 4 (Fig. 3.6–3.9). MCT analysis of two Varispiculum ectospiculatum Won and Iams, Reference Won and Iams2015 specimens reveals an exclusive spicular composition and a construction mode resembling that of Archeoentactinia incaensis (Figs. 8, 9). MCT analysis of a specimen of Fungomacula barbatula reveals a test constructed by numerous small uni-rayed, four-rayed, and five-rayed spicules, along with a six-rayed internal spicule (Fig. 10). Fungomaculidae n. fam. is thus established with Fungomacula as its type genus.
SEM images of radiolarians recovered from sample SEES/TH12 (Sheng et al., Reference Sheng, Kachovich and Aitchison2020) from the Inca Formation, Georgina Basin, Australia. (1) Archeoentactinia incaensis Won in Won and Below, Reference Won and Below1999; SEES/TH12-AIN04. (2) A. incaensis Won in Won and Below, Reference Won and Below1999; SEES/TH12-AIN05. (3) Siliceous skeletal material of an undetermined taxon is lodged and fused onto the skeleton of A. incaensis Won in Won and Below, Reference Won and Below1999; SEES/TH12-AIN05. (4) A. incaensis Won in Won and Below, Reference Won and Below1999; SEES/TH12-AIN06. (5) A. incaensis Won in Won and Below, Reference Won and Below1999; SEES/TH12-AIN07. (6) A. incaensis Won in Won and Below, Reference Won and Below1999; SEES/TH12-AIN08. (7) A. incaensis Won in Won and Below, Reference Won and Below1999; SEES/TH12-AIN09. (8) A. incaensis Won in Won and Below, Reference Won and Below1999; SEES/TH12-AIN10. (9) A. incaensis Won in Won and Below, Reference Won and Below1999; SEES/TH12-AIN11. As specimens shown in (1–9) were imaged using an SEM, it was not possible to confidently determine the numbers of rays in each spicule in the framework. As a result, they could not be assigned to morphotypes with certainty and are instead grouped together under Archeoentactinia incaensis Won in Won and Below, Reference Won and Below1999. (10) A. incaensis Won in Won and Below, Reference Won and Below1999 morphotype 3; SEES/TH12-AIN12. (11) MCT model of A. incaensis Won in Won and Below, Reference Won and Below1999 morphotype 3; SEES/TH12-AIN12. (12) Digitally isolated basal framework of SEES/TH12-AIN12. (1, 2, 4–12) Scale bar = 100 μm; (3) scale bar = 10 μm.

X-Radia 500 Micro-CT models of Archeoentactinia incaensis Won in Won and Below, Reference Won and Below1999 morphotype 2 (SEES/TH12-AIN13 illustrating the complete specimen and segmented spicules. (1) Complete specimen. (2) Test rendered semi-transparent to display the initial spicule and the two largest spicules of the basal framework. (3) Digitally segmented individual spicules representing each type.

X-Radia 500 Micro-CT models of Archeoentactinia incaensis Won in Won and Below, Reference Won and Below1999 morphotypes 3 and 4 illustrating the complete specimens and segmented spicules. (1–5) Archeoentactinia incaensis morphotype 3 SEES/TH12-AIN14: (1) complete specimen; (2) test rendered semi-transparent to reveal the initial spicule and the second largest spicule of the basal framework; (3) specimen with the front half of the test digitally removed to better display the shell thickness; (4) specimen with several spicules false colored; (5) individual spicules representing each type. (6–9) Archeoentactinia incaensis Won in Won and Below, Reference Won and Below1999 morphotype 4 SEES/TH12-AIN15: (6) complete specimen; (7) test rendered semi-transparent to show the initial spicule and the basal framework; (8) specimen with several spicules false colored; (9) individual spicules representing each type.

X-Radia 500 Micro-CT model of Archeoentactinia hexactinia Won in Won and Below, Reference Won and Below1999 morphotype 1 (SEES/TH12-AHE01) illustrating the complete specimen and segmented spicules. (1) Complete specimen. (2) Test rendered semi-transparent to show the initial spicule and a few six-rayed test spicules. (3) Test removed, leaving only several basal framework spicules to best illustrate their configurations. (4) Translating the framework spicule configuration onto a 2D diagram, illustrating how the rays are curved toward the shell exterior and interior, creating a smooth internal and external surface. (5) Close-up view of the skeleton. (6) Same view with the six-rayed spicules annotated.

X-Radia 500 Micro-CT models of Archeoentactinia hexactinia Won in Won and Below, Reference Won and Below1999 morphotype 2 (SEES/TH12-AHE02) illustrating the complete specimen and segmented spicules. (1) Complete specimen. (2) Specimen with several spicules false colored to best present their configurations. (3) Individual spicules representing each type are digitally segmented.

SEM images of radiolarians recovered from sample SEES/TH12 (Sheng et al., Reference Sheng, Kachovich and Aitchison2020) from the Inca Formation, Georgina Basin, Australia. (1) Archeoentactinia pentactinia n. sp. Holotype SEES/TH12-APE01, dashed box indicates area of enlarged section of A. pentactinia n. sp. SEES/TH12-APE01 shown to the right with four- and five-rayed test spicules annotated. (2) Archeoentactinia pentactinia n. sp. SEES/TH12-APE02. (3) A. hexactinia Won in Won and Below, Reference Won and Below1999 morphotype 2; SEES/TH12-AHE03, dashed box indicates area of enlarged section of A. hexactinia Won in Won and Below, Reference Won and Below1999 morphotype 2 SEES/TH12-AHE03 with four- and six-rayed test spicules. Note that the rays of the six-rayed initial spicule appear hollow. (4) A. hexactinia Won, in Won and Below, Reference Won and Below1999 morphotype 2; SEES/TH12-AHE04. (5) A. hexactinia Won in Won and Below, Reference Won and Below1999 morphotype 1; SEES/TH12-AHE01. (6) A. tetractinia Won in Won and Below, Reference Won and Below1999; SEES/TH12-ATE01. 7: Archeoentactinia heptactinia n. sp. holotype SEES/TH12-AHP01. Scale bars = 100 μm.

X-Radia 500 Micro-CT models of Archeoentactinia pentactinia n. sp. (SEES/TH12-APE03) illustrating the complete specimen and segmented spicules. (1) Complete specimen. (2) Specimen with several spicules false colored to best present their configurations. (3) Individual spicules representing each type are digitally segmented.

Summary of species and morphotypes of Archeoentactinia based on ray number variations in initial and test spicules

Synchrotron Micro-CT models of Varispiculum ectospiculatum Won and Iams, Reference Won and Iams2015 (from Western Brook Pond South Section level 23, Newfoundland) illustrating the complete specimen and segmented spicules. (1) Complete specimen. (2) Specimen with several spicules false colored to best present their configurations. (3) Individual spicules representing each type are digitally segmented. (4) Close-up view of the skeleton. (5) Same view with two six-rayed median-bar-centered spicules and one four-rayed point-centered spicule annotated.

Synchrotron Micro-CT models of Varispiculum ectospiculatum Won and Iams, Reference Won and Iams2015 (from Western Brook Pond South Section level 23, Newfoundland) illustrating the complete specimen and segmented spicules. (1) Complete specimen. (2) Specimen with several spicules false colored to best present their configurations. (3) Individual spicules representing each type are digitally segmented. (4) Close-up view of the skeleton. (5) Same view with two spicules annotated.

A hypothetical evolutionary tree illustrating possible phylogenetic relationships among selected Cambrian and Ordovician genera discussed in this study. MCT models of Archeoentactinia incaensis Won in Won and Below, Reference Won and Below1999 morphotype 4 SEES/TH12-AIN16 and Varispiculum ectospiculatum Won and Iams, Reference Won and Iams2015 are shown side by side to emphasize their morphological similarity.

Discussion
Two specimens assigned to the genus Archeoentactinia were analyzed in detail using MCT by Sheng et al. (Reference Sheng, Kachovich and Aitchison2020). This study resolved the meshwork of the tests into individual four-rayed spicules fused together and indicated the family Archeoentactiniidae should be placed in synonymy with the Echidninidae (Won and Below, Reference Won and Below1999; Sheng et al., Reference Sheng, Kachovich and Aitchison2020). Importantly, Sheng et al. (Reference Sheng, Kachovich and Aitchison2020) highlighted the significant role spicules play in the skeletal construction and species differentiation of these early radiolarians. Five more specimens of Archeoentactinia were analyzed in three dimensions during this study. Their significant intraspecific morphological variability provides insight into how some characteristics, including the number of rays on initial spicules, spicule types, spicule sizes, and positioning of the initial spicule, which later carry significant taxonomic value for the differentiation of species, genera, and even orders, remain non-fixed features even at the species level in these earliest spicular radiolarians (Won and Below, Reference Won and Below1999; De Wever et al., Reference De Wever, Dumitrica, Caulet and Caridroit2001; Aitchison et al., Reference Aitchison, Suzuki, Caridroit, Danelian and Noble2017; Caridroit et al., Reference Caridroit, Danelian, O’Dogherty, Cuvelier and Aitchison2017).
Archeoentactinia incaensis is characterized by the construction of point-centered spicules with a wide size range, fused together with modified rays (Sheng, et al., Reference Sheng, Kachovich and Aitchison2020). Due to their great intraspecific variation, Won in Won and Below (Reference Won and Below1999) discussed the difficulty of selecting features for species differentiation. Considering some characteristics are difficult to observe with SEM imagery, she established a classification scheme for species of Archeoentactinia prioritizing characteristics that can most affect the general appearance, thus facilitating easy species identification (Won and Below, Reference Won and Below1999). For example, the number of spicule rays for the initial spicule is considered for species differentiation only when the initial spicule is large, thus specimens with initial spicules with various ray numbers may be classified within a single species such as A. incaensis when the initial spicule is of moderate size. This scheme was the best achievable using SEM imagery, which cannot provide more structural details. With the availability of more advanced imaging techniques, it is now suitable to look closer and establish a more detailed and appropriate classification scheme. MCT analysis reveals that one major variation among A. incaensis is the initial spicule ray numbers, as well as various ray numbers of spicules among the tests. Four morphotypes are thus identified: morphotype 1 with an initial spicule and spicules in the test that are exclusively four-rayed (see A. incaensis specimen analyzed using MCT by Sheng et al., 2020, figs. 2, 4.1–4.12 and description p. 69–70), morphotype 2 with one four-rayed initial spicule and a mixture of four- to six-rayed spicules in the test (Fig. 2), morphotype 3 with a five-rayed initial spicule and a mixture of four- to six-rayed spicules in the test (Fig. 3.1), and morphotype 4 with a median-bar-centered initial spicule (one six-rayed spicule joined with one four-rayed spicule) and a mixture of four- to six-rayed spicules in the test (Fig. 3.6–3.9).
Members of the genus Archeoentactinia with large initial spicules are classified as separate species according to ray numbers of the initial spicule. This includes A. tetractinia with a large four-rayed initial spicule and A. hexactinia with a large six-rayed initial spicule (Won and Below, Reference Won and Below1999; Sheng et al., Reference Sheng, Kachovich and Aitchison2020). MCT analysis was performed on two specimens of A. hexactinia, revealing two morphotypes. Morphotype 1 is constructed exclusively of six-rayed spicules (Fig. 4), while morphotype 2 has a test constructed by a mixture of four-, five-, and six-rayed spicules (Fig. 4). In addition, specimens of Archeoentactinia with large five-rayed and seven-rayed initial spicules were recovered, leading to the establishment of two new species, A. pentactinia n. sp. (Figs. 6.1, 6.2, 7) and A. heptactinia n. sp. (Fig. 6.7). We do not intend to revise the species classification schemes of Won and Below (Reference Won and Below1999) in this study, preferring to focus on describing and classifying the detailed morphological variations observed through MCT and classifying them as different morphotypes. Identifying such differences in their structures is critical as some of the features evolve into fixed characteristics enabling speciation.
The most significant observation is the first median-bar-centered initial spicule observed in the 3D model of A. incaensis morphotype 4 (Fig. 3.7, 3.9). This provides the first direct evidence supporting the hypothesis that entactinarians are descendants of point-centered spicular taxa (De Wever et al., Reference De Wever, Dumitrica, Caulet and Caridroit2001; Maletz and Bruton, Reference Maletz and Bruton2007; Maletz, Reference Maletz2011; Kachovich and Aitchison, Reference Kachovich and Aitchison2021). Median-bar-centered spicules were first described in A. incaensis by Sheng et al. (Reference Sheng, Kachovich and Aitchison2020), but they only appeared among spicules in the test. In specimens of A. incaensis morphotype 2 and A. hexactinia morphotype 2 analyzed in this study, additional median-bar-centered spicules are observed in the test (Figs. 2.3, 5.3). We suggest that the mechanism of skeletal genesis responsible for producing median-bar-centered spicules first evolved in the middle Cambrian Archeoentactinia, enabling random generation of such spicules. While most median-bar-centered spicules are found among spicules in the test due to their greater numbers, some also occur as initial spicules. Having an initial spicule that is median-bar-centered may have provided a selective advantage, allowing evolution into a fixed morphological character, ultimately contributing to the emergence and flourishing of the Entactinaria.
To further investigate this hypothesis, some of the earliest entactinarians from the Lower Ordovician are explored. Varispiculum is among the earliest entactinarians with a prominent median-bar-centered initial spicule. The diagnosis of this genus indicates the occurrence of minor spicules in the test “meshwork” (Won and Iams, Reference Won and Iams2015). By examining the illustrated SEM images, we were able to vaguely identify a spicular composition. To investigate those original materials with exceptional preservation recovered from the type locality in Newfoundland, the specimens were loaned from their curation for non-destructive 3D visualization at the Australian Synchrotron. Detailed 3D analysis of two specimens of Varispiculum ectospiculatum Won and Iams, Reference Won and Iams2015 supports the authors’ hypothesis, confirming that they are constructed by spicules exclusively (Figs. 8, 9). Each spicule can be traced and digitally segmented. In contrast to Archeoentactinia, the test spicules are dominated by median-bar-centered spicules with only sparse individual point-centered spicules. This change of the ratio of spicule types to favor median-bar-centered spicules may be evidence of the evolutionary process during which this morphological feature became dominant and true entactinarians first appeared. In addition to being exclusively spicular and sharing the same two spicule types, V. ectospiculatum resembles A. incaensis in its test construction mode by spicule fusion with modified basal rays. As in A. incaensis, the apical rays in V. ectospiculatum form more or less radial primitive spines. From the above observations, we suggest there is a direct ancestral–descendant relationship between A. incaensis and V. ectospiculatum (Fig. 10).
In evolutionary and ecological studies, the importance of intraspecific trait variation (ITV) has increasingly been discussed and acknowledged (Des Roches et al., Reference Roches, Post, Turley, Bailey, Hendry, Kinnison, Schweitzer and Palkovacs2018). ITV constitutes part of the raw material on which natural selection can act. The higher the ITV, the greater the niche breadth that can be achieved, potentially providing a species with improved chances of survival. This phenomenon is comparable to the critical role intraspecific morphological variation has played in radiolarian speciation. With greater intraspecific morphological variations and greater flexibility in the mix of these traits, ancestral radiolarians could generate more morphotypes, providing the raw material for natural selection to act on. This capacity encourages rapid speciation and diversification, ultimately enabling radiolarians to become an enormously successful group, persisting for more than half a billion years with thousands of species and becoming ubiquitous in modern oceans (De Wever et al., Reference De Wever, Dumitrica, Caulet and Caridroit2001).
Other intraspecific variations within Archeoentactinia include the ratio of spicule types, the range of spicule size variations, spicule orientations, median-bar length in median-bar-centered spicules, and the location of the initial spicule relative to the test. All these factors influence their overall morphology and may confer selective advantages or disadvantages, potentially leading to speciation or extinction. The detailed morphological traits of these early radiolarians, illuminated by MCT, provide a treasure trove of information for phylogenetic and evolutionary studies.
Digital analysis of 3D models of two specimens of Echidnina irregularis reveals that there is a great size variation in their spicules as observed in Archeoentactinia (Fig. 11). Each spicule center lies on the same spherical surface as determined with the aid of a digital sphere inserted into the specimen models (Fig. 12). This result contrasts with that for Archeoentactinia, where the smaller spicules are generated increasingly farther from the test center (Fig. 12.6), resulting in a subspherical framework and test that can attain great thickness (Fig. 4.2). The genera Archeoentactinia and Echidnina illustrate another important factor controlling radiolarian morphologies in addition to the compositional factor, specifically, the control of the regions of spicule genesis during cell growth.
SEM images of radiolarians recovered from sample SEES/TH12 (Sheng et al., Reference Sheng, Kachovich and Aitchison2020) from the Inca Formation, Georgina Basin, Australia. (1) Echidnina irregularis Won and Iams, Reference Won and Iams2002; SEES/TH12-EIR01. (2) Echidnina irregularis Won and Iams, Reference Won and Iams2002; SEES/TH12-EIR02. (3) Echidnina irregularis Won and Iams, Reference Won and Iams2002; SEES/TH12-EIR03. (4) Echidnina irregularis Won and Iams, Reference Won and Iams2002; SEES/TH12-EIR04. (5) Echidnina irregularis Won and Iams, Reference Won and Iams2002; SEES/TH12-EIR05. (6) Echidnina irregularis Won and Iams, Reference Won and Iams2002; SEES/TH12-EIR06. Scale bar = 100 μm.

X-Radia 500 Micro-CT models of two specimens of Echidnina irregularis Won and Iams, Reference Won and Iams2002 illustrating the complete specimen and segmented spicules. (1–6) Specimen 1: (1) SEES/TH12-EIR07 with each spicule segmented and false colored; (2) specimen with inserted sphere; (3) isolated spicule centers aligned on the same spherical surface; (4) spicule with evenly bent basal rays; (5) spicule with one markedly bent ray; (6) isolated spicule centers do not fall on the same spherical surface in Archeoentactinia, distances from spicule centers to the spherical surface are noted (μm) (figure from Sheng et al., Reference Sheng, Kachovich and Aitchison2020). (7–12) Specimen 2: (7) SEES/TH12-EIR08 with inserted sphere; (8) same specimen rotated 180°; (9) view from inside the inserted sphere showing minimal skeletal intrusion into the radiolarian interior; (10) specimen with two spicules highlighted to illustrate their configurations; (11) spicule with one basal ray more bent than the others; (12) spicule with evenly bent basal rays.

The genus Fungomacula was established by Won and Below (Reference Won and Below1999) to describe tests with a dense, fine, spongy meshwork and the presence of one or two spicules. It was placed in the Archeoentactiniidae. This family, which was established on the basis of superficial appearances with vague diagnoses, was later synonymized with Echidninidae (Sheng et al., Reference Sheng, Kachovich and Aitchison2020). In this study, the type species Fungomacula barbatula was investigated using MCT. This revealed that the thick shell (100 μm) is constructed by small-sized four- and five-rayed spicules, radially arranged uni-rayed spicules, and a robust, eccentrically placed six-rayed internal spicule (Figs. 13.1–13.11, 14). Being purely spicule-constructed, F. barbatula belongs to the Archaeospicularia. When considering family-level placement, its overall composition aligns with Echidninidae, but a key diagnostic feature of the Echidninidae is their hollow structure with no internal spicule. The origin and evolution of the internal spicule in radiolarians, and its effect on shell growth, are of great interest and taxonomic significance (De Wever et al., Reference De Wever, Dumitrica, Caulet and Caridroit2001). As the possession of an internal spicule (with the spicule center not incorporated into the test wall) is a unique feature of this genus among known middle Cambrian radiolarians, a new family, Fungomaculidae n. fam., is established with Fungomacula as the nominative genus.
SEM images of radiolarians recovered from sample SEES/TH12 (Sheng et al., Reference Sheng, Kachovich and Aitchison2020) from the Inca Formation, Georgina Basin, Australia. Illustrated to show range of intra-specific variation. (1) Fungomacula barbatula Won in Won and Below, Reference Won and Below1999, SEES/TH12-FBA01. (2) F. barbatula, SEES/TH12-FBA02. (3) F. barbatula, SEES/TH12-FBA03. (4) F. barbatula, SEES/TH12-FBA04. (5) F. barbatula, SEES/TH12-FBA0105. (6) F. barbatula, SEES/TH12-FBA06. (7) F. barbatula, SEES/TH12-FBA07. (8) F. barbatula, SEES/TH12-FBA08. (9) F. barbatula, SEES/TH12-FBA09. (10) F. barbatula, SEES/TH12-FBA10. (11) F. barbatula, SEES/TH12-FBA11. (12) Palaeospiculum arcussimile Won in Won and Below, Reference Won and Below1999; SEES/TH12-PAR01. Scale bars = 100 μm.

X-Radia 500 Micro-CT models of Fungomacula barbatula Won in Won and Below, Reference Won and Below1999 (SEES/TH12-FBA12) illustrating the complete specimen and segmented spicules. (1) Complete specimen with the segmented portion annotated. (2) The shell portion annotated in (1) is digitally dissected into individual spicules. (3) Half of the shell is digitally removed, and a semi-sphere is inserted to showcase the shell thickness and the position of the internal spicule; the internal spicule is segmented and rotated to display its six rays. (4) Individual spicules of the inner portion illustrated in 2, showing ray modification during fusion.

Systematic paleontology
Phylum Radiozoa Cavalier-Smith, Reference Cavalier‐Smith1987
Class Polycystina Ehrenberg, Reference Ehrenberg1838, emend. Riedel, Reference Riedel, Harland, Holland, House, Hughes, Reynolds, Rudwick, Satterthwaite, Tarlo and Willey1967
Order Archaeospicularia Dumitrica, Caridroit, and De Wever, Reference Dumitrica, Caridroit and De Wever2000
Superfamily Echidninacea Dumitrica, Caridroit, and De Wever, Reference Dumitrica, Caridroit and De Wever2000
Family Echidninidae Kozur, Mostler, and Repetski, Reference Kozur, Mostler and Repetski1996
Remarks
The diagnosis for the Echidninidae is revised by Sheng and Aitchison (Reference Sheng and Aitchison2025, p. 793): “Isolated, but interlocked or fused, point-centered or uni-rayed spicules forming a subglobular, loose, spongy, hollow shell.”
Genus Archeoentactinia Won in Won and Below, Reference Won and Below1999, revised Sheng, Kachovich, and Aitchison, Reference Sheng, Kachovich and Aitchison2020
Type species
Archeoentactinia incaensis Won in Won and Below, Reference Won and Below1999 from limestone concretions of the Inca Formation, Georgina Basin, Australia (Won and Below, Reference Won and Below1999).
Diagnosis
“A hollow, subspherical test was constructed from an indefinite number of fused spicules with modified rays. Basal framework was constructed of a number of robust spicules of a range of sizes with a meshwork of smaller spicules arranged at various orientations formed upon it. The initial spicule is positioned off-centered and may be larger or significantly larger compared to others” (revised by Sheng et al., Reference Sheng, Kachovich and Aitchison2020, p. 69).
Archeoentactinia heptactinia new species
Holotype
Specimen number SEES/TH12-AHP01 in the micropaleontology collection of the School of the Environment, University of Queensland, Australia. Collected from the middle Cambrian (Miaolingian Series) Inca Formation at the D-Tree, Thorntonia locality, Georgina Basin, Australia.
Materials
One specimen (SEES/TH12-AHP01) identified from sample SEES/TH12 from the middle Cambrian (Miaolingian Series) Inca Formation at the Thorntonia locality, Georgina Basin, Australia.
Diagnosis
A hollow, subspherical test constructed from fused spicules with various ray numbers, featuring one notably large seven-rayed point-centered initial spicule positioned off-center, forming a tent-like structure over the test. The test contains a basal framework made of large spicules of varying sizes, overlaid by a meshwork of smaller spicules arranged in various orientations.
Occurrence
Middle Cambrian (Miaolingian Series) Inca Formation at the D-Tree, Thorntonia locality, Georgina Basin, Australia.
Description
The specimen illustrated in Fig. 6.7 has a test diameter of approximately 150 μm, dominated by a large and robust initial spicule. It is incompletely preserved, with a portion of the test framework broken off. The initial spicule consists of seven rays, each thinnest at the center before gradually thickening to approximately twice its initial width and extending beyond the subspherical test as long, robust spines. The framework spicules are small, with thin rays. Individual framework spicules exhibit variation in ray number, with four, five, or six rays observed.
Etymology
Derived from seven-rayed initial spicule; hepta- meaning “seven” in Greek.
Remarks
This specimen was not selected for MCT scanning due to its incomplete preservation. Consequently, the exact ray count of each framework spicule could not be determined, and variation in framework spicule ray numbers is not included in its diagnosis. Despite this limitation, the species can be confidently established from its distinctive large initial spicule, with its radiating rays extending over the test. Future studies utilizing MCT analysis may provide further insights into the morphotypic variability of this species.
Archeoentactinia hexactinia Won in Won and Below, Reference Won and Below1999 revised
Reference Won and Below1999 Archeoentactinia hexactinia Won in Won and Below, p. 333, pl. 6, figs. 11–15, 18.
cf. Reference Won and Iams2002 Pararcheoentactinia reedae Won and Iams, p. 9, figs. 8.1–8.21, 9.1–9.20, 10.1–10.12, 10.19, 10.20.
Reference Sheng, Kachovich and Aitchison2020 Archeoentactinia hexactinia Won in Sheng, Kachovich, and Aitchison, p. 71, fig. 4.13, 4.14.
Holotype
Specimen 7430Y-2308 of Won and Below (Reference Won and Below1999, pl. 6 fig. 11) from sample 7430 collected ~155 km north–northwest of Mount Isa, in Section 423 D-Tree (Shergold and Southgate, Reference Shergold and Southgate1986), Thorntonia Station, far north Queensland, Australia.
Diagnosis
“A skeleton with a small spherical shell consisting of a disorderly interwoven meshwork and one very large, triaxially arranged six-rayed spicule, with or without a minor spicule of four or six rays” (Won and Below, Reference Won and Below1999, p. 333).
Revised diagnosis
A hollow, subspherical test was constructed from fused spicules, with one remarkably large initial hexactine spicule positioned off-center and forming a tent-like structure over the test. It contains a basal framework constructed from large spicules of a range of sizes and a meshwork formed on it by small spicules arranged at various orientations.
Remarks
Two morphotypes are recognized in this study. Both share the characteristic six-rayed initial spicule. A. hexactinia morphotype 1 is composed exclusively of six-rayed spicules, whereas morphotype 2 includes test spicules with four, five, and six rays. Pararcheoentactinia reedae Won and Iams, Reference Won and Iams2002 was described from uppermost Cambrian (Trempealeauan) carbonate rocks of the Cow Head Group in Newfoundland, Canada. It is also characterized by an eccentrically placed hexactine (point-centered six-rayed) spicule, around which a spongy-type shell is formed by numerous fused spicules. However, although very abundant in some of their Trempealeauan samples, no specimens were reported from underlying radiolarian-rich Franconian rocks examined in the same study (Won and Iams, Reference Won and Iams2002).
Archeoentactinia hexactinia Won in Won and Below, Reference Won and Below1999 morphotype 1
Materials
One specimen (SEES/TH12-AHE01) identified from sample SEES/TH12 from the middle Cambrian (Miaolingian Series) Inca Formation at the Thorntonia locality, Georgina Basin, Australia.
Description
Archeoentactinia hexactinia with six-rayed initial and test spicules. Specimens are constructed exclusively of six-rayed spicules, characterized by a notably large initial spicule with orthogonal rays. The subspherical test has a diameter ranging from 160 to 200 μm. The robust initial spicule has the longest preserved ray, measuring 400 μm. The test spicules have modified rays that curve inward or outward to conform to the test’s sphericity both internally and externally, resulting in a smoother appearance rather than a spiny look (Fig. 4).
Archeoentactinia hexactinia Won in Won and Below, Reference Won and Below1999 morphotype 2
Materials
Three specimens (SEES/TH12-AHE02– SEES/TH12-AHE04) identified from sample SEES/TH12 from the middle Cambrian (Miaolingian Series) Inca Formation at the Thorntonia locality, Georgina Basin, Australia.
Description
Archeoentactinia hexactinia with six-rayed initial and four, five, and six- rayed test spicules. The specimen illustrated in Fig. 5 has a test diameter of 150 μm, with the longest ray of the initial spicule measuring 330 μm. The initial spicule is notably large, with its three basal rays extending over the test. The test is constructed from a combination of four-, five-, and six-rayed spicules. A triple spicule with two median bars is identified (Fig. 5). The specimen in Fig. 6.3 has the same initial spicule orientation as that in Fig. 5, while the specimen in Fig. 6.4 has five rays acting as basal rays involved in the test framework. In the specimen shown in Fig. 6.3, the initial spicule rays appear to be hollow.
Archeoentactinia incaensis Won in Won and Below, Reference Won and Below1999, revised Sheng, Kachovich, and Aitchison Reference Sheng, Kachovich and Aitchison2020
Reference Won and Below1999 Archeoentactinia incaensis Won in Won and Below, p. 333, pl. 6, figs. 1–9, 16, 17; pl. 8, figs. 16, 19; pl. 10, figs. 5, 6.
Reference Sheng, Kachovich and Aitchison2020 Archeoentactinia incaensis Won in Sheng et al., p. 69, figs. 2, 4.11, 4.12.
Holotype
Specimen 7430Z-2287 of Won and Below (Reference Won and Below1999, pl. 6, fig. 9) from sample 7439Z collected ~155 km north–northwest of Mount Isa, in Section 423 D-Tree (Shergold and Southgate, Reference Shergold and Southgate1986), Thorntonia Station, far north Queensland, Australia.
Diagnosis
“A hollow, subspherical test was constructed from an indefinite number of fused spicules with modified rays. Basal framework was constructed from a number of robust spicules with a meshwork formed upon it of smaller spicules arranged at various orientations. Amongst the framework spicules, there is a range of sizes, with the initial spicule being the largest and positioned off-centered” (revised by Sheng et al., Reference Sheng, Kachovich and Aitchison2020, p. 69).
Remarks
The intraspecific variations in A. incaensis, particularly in the diversity of ray numbers among the initial spicule and spicules in the test, necessitates the establishment of distinct morphotypes. From the MCT models analyzed in this study and in Sheng et al. (Reference Sheng, Kachovich and Aitchison2020), four morphotypes are identified. With four morphotypes now recognized, the specimens described by Sheng et al. (Reference Sheng, Kachovich and Aitchison2020) represent Archeoentactinia incaensis morphotype 1.
Archeoentactinia incaensis Won in Won and Below, Reference Won and Below1999 morphotype 2
Materials
One specimen (SEES/TH12-AIN13) from sample SEES/TH12 from the middle Cambrian (Miaolingian Series) Inca Formation at the Thorntonia locality, Georgina Basin, Australia.
Description
Archeoentactinia incaensis with four-rayed initial and four-, five-, and six-rayed spicules among the tests. Diameter of 300 μm, with the longest ray of the robust initial spicule measuring 295 μm. A subspherical basal framework is constructed from large four-rayed spicules and has a diameter of 150 μm. While most of the spicules among the test are four-rayed, a few five- and six-rayed spicules are identified. In addition, a median-bar-centered spicule comprising one six-rayed and one four-rayed spicule is observed. Numerous primitive radial spines are formed by the apical rays of the four-rayed spicules.
Archeoentactinia incaensis Won in Won and Below, Reference Won and Below1999 morphotype 3
Figures 1.10–1.12, 3.1–3.5; Supplementary Dataset files SDS4, SDS5
Materials
Two specimens (SEES/TH12-AIN12 and SEES/TH12-AIN14) identified from sample SEES/TH12 from the middle Cambrian (Miaolingian Series) Inca Formation at the Thorntonia locality, Georgina Basin, Australia.
Description
Archeoentactinia incaensis with five-rayed initial and four- and five-rayed spicules among the tests. Diameter of 250 μm, with the longest ray of the robust initial spicule measuring 220 μm. The initial spicule is five-rayed, with three rays serving as basal rays that construct the framework and two apical rays acting as primitive spines. The basal framework is composed of a combination of five- and four-rayed spicules, while the spicules among the test are predominantly four-rayed. Notably, the second-largest spicule in the basal framework is also five-rayed and only slightly smaller than the initial spicule. The internal cavity has a diameter of 100 μm, and the test thickness is 50 μm.
Archeoentactinia incaensis Won in Won and Below, Reference Won and Below1999 morphotype 4
Materials
One specimen (SEES/TH12-AIN15) identified from sample SEES/TH12 from the middle Cambrian (Miaolingian Series) Inca Formation at the Thorntonia locality, Georgina Basin, Australia.
Description
Archeoentactinia incaensis with median-bar-centered initial spicule (six-rayed and four-rayed spicules) and four-, five-, and six-rayed spicules among the tests. Diameter of 300 μm, with the longest ray of the initial spicule measuring 230 μm. The initial spicule is a median-bar-centered spicule consisting of one six-rayed and one four- rayed spicule joined by sharing one basal ray. The basal framework is constructed from a combination of six-, five-, and four-rayed spicules. The internal cavity has a diameter of 100 μm, and the test thickness is 100 μm. Compared with the test spicules, the initial spicule has longer rays, but the difference in thickness is not as prominent as in the other three morphotypes. As a result, the initial spicule is not readily observable externally, and the overall appearance of the specimen is more even and radially symmetrical.
Archeoentactinia pentactinia new species
Holotype
Specimen SEES/TH12-APE01 in the micropaleontology collection of the School of the Environment, University of Queensland, Australia. Collected from the middle Cambrian (Miaolingian Series) Inca Formation at the D-Tree, Thorntonia locality, Georgina Basin, Australia.
Materials
Three specimens (SEES/TH12-APE01–SEES/TH12-APE03) identified from sample SEES/TH12 from the middle Cambrian (Miaolingian Series) Inca Formation at the Thorntonia locality, Georgina Basin, Australia.
Diagnosis
A hollow, subspherical test was constructed from fused tetractine, pentactine, and hexactine spicules, with one remarkably large initial pentactine spicule positioned off-center and forming a tent-like structure over the test. It contains a basal framework constructed from large spicules of a range of sizes and a meshwork formed on it by small spicules arranged at various orientations.
Occurrence
Middle Cambrian (Miaolingian Series) Inca Formation at the D-Tree, Thorntonia locality, Georgina Basin, Australia.
Description
The specimen illustrated in Fig. 7 has a test diameter of 170 μm, with the longest ray of the initial spicule measuring 340 μm. The initial spicule is notably large, with its two basal rays involved in the test framework construction. The test is constructed from a combination of four-, five-, and six-rayed spicules. In the two specimens illustrated in Fig. 6.1, 6.2, the large initial spicules have four basal rays contributing to the shell framework construction. The differing angles of the initial spicule relative to the test result in variations in the number of rays acting as basal or apical, significantly affecting the appearance of each morphotype.
Etymology
Derived from five-rayed initial spicule, with penta- meaning “five” in Greek.
Remarks
This variation exemplifies great morphological diversity among these early radiolarians.
Genus Echidnina Bengtson, Reference Bengtson1986, sensu Won and Iams, Reference Won and Iams2002
Type species
Echidnina runnegari Bengston, Reference Bengtson1986 (UNEF16424) from the upper Cambrian Mungerebar Limestone of Queensland, Australia.
Echidnina irregularis Won and Iams, Reference Won and Iams2002 revised
Figures 11, 12; Supplementary Dataset files SDS8, SDS9
Reference Won and Iams2002 Echidnina irregularis Won and Iams, p. 25, fig. 5.5–5.12.
Reference Sheng, Kachovich and Aitchison2020 Echidnina irregularis Sheng et al., p. 68, fig. 4.19, 4.20.
Holotype
Specimen GSC-121964 (MP2-26) of Won and Iams (Reference Won and Iams2002, fig. 5.10) from Martin Point section (MP2) unit 26 shown in James and Stevens, (Reference James and Stevens1986, fig. 13), Tuckers Cove Member, Shallow Bay Formation, Cow Head Group, western Newfoundland, Canada (Won and Iams, Reference Won and Iams2002).
Materials
Eight specimens (SEES/TH12-EIR01–SEES/TH12-EIR08) identified from sample SEES/TH12 from the middle Cambrian (Miaolingian Series) Inca Formation at the Thorntonia locality, Georgina Basin, Australia.
Diagnosis
“Skeleton consisting of several to numerous large, individual interlocked spicules that form a hollow, irregular to subspherical shell. Spicule consisting of two vertical rays and five, six, seven, or eight whorled rays” (Won and Iams, Reference Won and Iams2002, p. 25).
Revised diagnosis
Hollow, subspherical test consisting of several to numerous individual interlocked spicules of various sizes. Spicules are seven- to 10-rayed. Spicule rays facing inward toward the test are bent outward, creating a smooth internal cavity.
Description
Two specimens were analyzed using MCT. The skeletal structure of both specimens is dominated by eight-rayed spicules, with minor nine- and 10-rayed spicules. There is significant spicule size variation in both specimens. In one specimen, the longest ray of its largest spicule measures 175 μm, while that of the smallest measures 30 μm. The spicule rays facing inward toward the test center bend upward, creating a smooth surface for the internal cavity of the test (Fig. 12.2.3). Despite the significant spicule size variation, comparable to that in Archeoentactinids, their skeletal genesis centers lie on essentially the same spherical surface (Fig. 12.3).
Remarks
The spicule ray arrangement, previously described as vertical or whorled (Won and Iams, Reference Won and Iams2002; Maletz and Bruton, Reference Maletz and Bruton2007), is not consistently observed in the analyzed specimens. This arrangement appears to be more of an artifact, depending on the spicule orientation relative to the central capsule (Fig. 12.4, 12.5, 12.11, 12.12). When one ray is positioned at a higher angle toward the test center, it exhibits a stronger bend, described in previous studies as a vertical ray. However, if the spicule is positioned in such a way that more than one ray is directed inward at similar angles, they bend outward to the same degree, and no vertical rays can be identified. Therefore, the characteristic of vertical and whorled rays is omitted from the revised diagnosis.
Family Fungomaculidae new family
Diagnosis
A spherical test with a dense shell constructed exclusively of spicules of similar sizes. An internal spicule is present and eccentrically positioned.
Etymology
After the nominative genus Fungomacula Won in Won and Below, Reference Won and Below1999.
Remarks
Family characterized by exclusive spicular composition and the presence of a robust, eccentrically placed internal spicule. It is distinguished from Echidninidae by the presence of this internal spicule (absent in Echidninidae) and from Palaeospiculidae by its dense meshwork test constructed of small spicules (Won and Below, Reference Won and Below1999; De Wever et al., Reference De Wever, Dumitrica, Caulet and Caridroit2001; Sheng et al., Reference Sheng, Kachovich and Aitchison2020). The appearance of an internal spicule in this family represents the earliest known occurrence of this feature in radiolarians, marking an important step in the evolution of shell construction. Therefore, the family is established to recognize this important evolutionary distinction.
Genus Fungomacula Won in Won and Below, Reference Won and Below1999
Type species
Fungomacula barbatula Won in Won and Below, Reference Won and Below1999 from limestone concretions of the Inca Formation, Georgina Basin, Australia (Won and Below, Reference Won and Below1999).
Diagnosis
“A spherical shell with a densely interwoven fine spongy meshwork and one or two spicules, each having four or six delicate rays, with or without outer spines, and sparsely distributed thin skeletal elements in the inner empty space between shell wall and rays” (Won and Below, Reference Won and Below1999, p. 336).
Revised diagnosis
A spherical test with a dense and thick shell constructed by numerous small point-centered and uni-rayed spicules of similar sizes. Uni-rayed spicules are radially arranged. An internal spicule is present and eccentrically positioned.
Remarks
The diagnosis is revised from the analysis of an MCT 3D model of the type species Fungomacula barbatula Won in Won and Below, Reference Won and Below1999. Digital dissection of the test revealed that the “fine spongy meshwork” is constructed by numerous small spicules.
Fungomacula barbatula Won in Won and Below, Reference Won and Below1999 revised
Figures 13.1–13.11, 14; Supplementary Dataset file SDS10
Reference Won and Below1999 Fungomacula barbatula Won in Won and Below, p. 336, pl. 9, figs. 8, 9, pl. 10, fig. 3
Holotype
Specimen 7430X-2146 of Won and Below (Reference Won and Below1999, pl. 9, fig. 9) from sample 7430X collected ~155 km north–northwest of Mount Isa in Section 423 D-Tree (Shergold and Southgate, Reference Shergold and Southgate1986), Thorntonia Station, far north Queensland, Australia.
Materials
Twelve specimens (SEES/TH12-FBA01–SEES/TH12-FBA12) identified from sample SEES/TH12 from the middle Cambrian (Miaolingian Series) Inca Formation at the Thorntonia locality, Georgina Basin, Australia.
Diagnosis
“A spherical and fairly thin to moderately thick spongy shell with one delicate six-rayed spicule, no outer spines, but clustered thorns on one area of the shell surface” (Won and Below, Reference Won and Below1999, p. 336).
Revised diagnosis
A spherical test with a dense and thick shell constructed by numerous small point-centered and uni-rayed spicules of similar sizes. Uni-rayed spicules are radially arranged. On one area of the shell surface, spicules have longer rays forming a “bearded” region. A six-rayed internal spicule is present and eccentrically positioned.
Description
One specimen was thoroughly investigated using MCT. The test diameter measures 380 μm, with a test thickness of 100 μm. The test spicules have similar dimensions, with ray lengths ranging from 30 to 50 μm. The largest spicules are found in the bearded region, where their apical rays are significantly longer than the basal rays, with apical rays measuring up to 120 μm. The test is partially infilled, and careful digital separation revealed a poorly preserved six-rayed internal spicule. The specimen imaged using SEM show a big variation in spine length, formed by spicule apical rays.
Remarks
The tests of most preserved specimens of Fungomacula barbatula are infilled.
Family Palaeospiculidae Won in Won and Below, Reference Won and Below1999
Palaeospiculumidae Won in Won and Below Reference Won and Below1999, p. 338 (nom. corr. Maletz, Reference Maletz2011, p. 130)
Genus Palaeospiculum Won in Won and Below, Reference Won and Below1999
Type species
Palaeospiculum burkensis Won in Won and Below, Reference Won and Below1999 from limestone concretions of the Inca Formation, Georgina Basin, Australia (Won and Below, Reference Won and Below1999).
Palaeospiculum arcussimile Won in Won and Below, Reference Won and Below1999
Reference Won and Below1999 Palaeospiculum arcussimile Won in Won and Below, p. 340, pl. 1, figs. 1–4, 16, 17, pl. 2, fig. 1.
Reference Sheng, Kachovich and Aitchison2020 Palaeospiculum arcussimile Won in Sheng et al., p. 73, fig. 4.1–4.10.
Holotype
Specimen 7306J-2373 of Won and Below (Reference Won and Below1999, pl. 2, fig. 1) from Sample 7306J collected north of Rogers Ridge, 250 m south of telegraph line, 139°58’36.6”E, 21°44’50.4’’S far north Queensland, Australia.
Materials
Abundant specimens identified from sample SEES/TH12 from the middle Cambrian (Miaolingian Series) Inca Formation at the Thorntonia locality, Georgina Basin, Australia.
Diagnosis
Point-centered spicular skeleton constructed by the crossing of three curved rods at a point, three long basal rays with short spinules, three short apical rays without spinules.
Description
Small specimen with ray lengths around 80 μm, spinules on basal rays, apical rays smooth. Rays hollow.
Remarks
Only one specimen is illustrated in this study as this taxon has simple structures that can be adequately visualized using SEM. Thus, they are not the primary focus of this study.
Order Entactinaria Kozur and Mostler, Reference Kozur and Mostler1982
Diagnosis
Polycystina having as initial skeleton a spicule with a variable number of spines arising from the two ends of a median bar or from a center. Spines equal or unequal, disposed in variable patterns, and usually separated into an apical and a basal group. Shell usually present, latticed or spongy, or a combination of both; when multiple, it is usually concentrically disposed, never along an axis. Median bar or spicule center located inside the innermost shell or quite eccentric in its wall (De Wever et al., Reference De Wever, Dumitrica, Caulet and Caridroit2001).
Remarks
The Protoentactiniidae Kozur et al., Reference Kozur, Mostler and Repetski1996 and the Sphaeroentactiniidae Maletz and Bruton, Reference Maletz and Bruton2007 are the earliest known entactinarians. During the Paleozoic and Mesozoic, Entactinaria were the most prevalent and widespread radiolarians (Kozur and Mostler, Reference Kozur and Mostler1982).
Family Sphaeroentactiniidae Maletz and Bruton, Reference Maletz and Bruton2007 revised
Diagnosis
Entactinarian radiolarians with a bar-centered eccentrically placed initial spicule and a 3D shell formed from apophyses, enclosing a hollow inner cavity (Maletz and Bruton, Reference Maletz and Bruton2007).
Revised diagnosis
Entactinarian radiolarians with a bar-centered eccentrically placed initial spicule and a 3D shell formed from apophyses or fused spicules, enclosing a hollow inner cavity.
Remarks
Further MCT analysis of specimens assigned to Sphaeroentactinia is required for a more definitive diagnosis regarding test structure. Careful examination of specimens of Sphaeroentactinia illustrated by Maletz and Bruton (Reference Maletz and Bruton2007) and by Kachovich and Aitchison (Reference Kachovich and Aitchison2021) suggests that these species may have a spicular composition, which awaits confirmation using MCT.
Genus Varispiculum Won and Iams, Reference Won and Iams2015 revised
Type species
Varispiculum ectospiculatum Won and Iams, Reference Won and Iams2015 lower/middle Arenig (upper Floian) Cow Head Group, western Newfoundland, Canada.
Diagnosis
“Spherical shell with a prominent median bar-centered spicule, which may be located within the shell wall, or under it, or in the shell cavity. Shell characterized by an intricate interlacing of straight bars in an irregular and angular three-dimensional meshwork. Minor spicule(s) or fused spicule structure commonly developed. Rays with spinules connected to shell meshwork. Outer surface rough with variably directed projections and inner surface smooth” (Won and Iams, Reference Won and Iams2015, p. 17).
Revised diagnosis
Spherical shell with a prominent median-bar-centered spicule, which may be located within the shell wall or under it or in the shell cavity. Shell constructed by fusion of median-bar-cantered spicules and point-centered spicules. Rays with spinules connected to shell meshwork. Outer surface spiny and inner surface smooth.
Remarks
Two specimens of the type species Varispiculum ectospiculatum were analyzed in three dimensions, revealing an exclusive spicule composition. With discovery of the presence of a prominent median-bar-centered initial spicule, Varispiculum is moved from the Echidninidae (Won and Iams, Reference Won and Iams2015) to the Sphaeroentactiniidae (revised herein). The key characteristics of the skeletal architecture of this genus are identical to those of Archeoentactinia: both are constructed exclusively by the fusion of modified spicules and possess a large initial spicule. The distinction between the two genera is that the median-bar-centered initial spicule has developed into a stable feature in Varispiculum, giving rise to the order Entactinaria.
Median-bar-centered spicules in archeoentactinids can have various numbers of rays at each end of the median bar, the length of which is also a variable feature in Archeoentactinia, indicating high intraspecific variability. However, in entactinarians such as Varispiculum, variations in ray numbers of the median-bar-centered initial spicule are taxonomically important for species differentiation. The length of the median bar also gained taxonomic value for species differentiation. For example, a diagnostic feature of Varispiculum multiradiatum (Won and Iams, Reference Won and Iams2013) is a very long median bar (Won and Iams, Reference Won and Iams2015).
Varispiculum ectospiculatum Won and Iams, Reference Won and Iams2015 revised
Figures 8, 9; Supplementary Dataset files SDS11, SDS12
Reference Won and Iams2015 Varispiculum ectospiculatum Won and Iams, p. 17, pl. 4, figs. 12, 13, pl. 5. figs. 8–14.
Reference Kachovich and Aitchison2021 Varispiculum ectospiculatum; Kachovich and Aitchison, p. 919, figs. 3.5– 3.7, 6.8, 6.13, supplemental data file 2.
Holotype
Specimen GSC 131232 of Won and Iams (Reference Won and Iams2015, pl. 5, fig. 9a, b) from Unit 23h of Western Brook Pond South Section, shown in James and Stevens (Reference James and Stevens1986, fig. 10). Lower/middle Arenig (upper Floian) Cow Head Group, western Newfoundland, Canada. National Type Collection of lnvertebrate and Plant Fossils, Geological Survey of Canada (GSC).
Materials
Two specimens from lower/middle Arenig (upper Floian) strata of the Cow Head Group, Western Brook Pond South Section level 23 reported by Won and Iams (Reference Won and Iams2015).
Diagnosis
Skeleton consisting of a bar-centered, six-rayed, prominently developed major spicule and a spherical shell constructed of a 3D meshwork of fused bars. Median bar located generally within the thickness of the shell wall and usually connected to the shell meshwork. Some of the rays of the major spicule modified or reduced or protrude from the shell as outer spines and usually connected to shell meshwork. Modified or fused minor spicules commonly present (Won and Iams, Reference Won and Iams2015).
Revised diagnosis
Skeleton consisting of a six-rayed, median-bar-centered prominently developed initial spicule. A subspherical test constructed on it of fused spicules of various sizes, which are median-bar-centered or point-centered.
Description
For the two specimens (Figs. 8, 9), test diameters are 200 μm and 145 μm; median bars of initial spicules are short, measuring 19 μm and 12 μm. In both specimens, the initial spicules have two apical rays and four basal rays, with the basal rays forming part of the test framework. Among the test spicules, there are two types: six-rayed median-bar-centered spicules and four-rayed point-centered spicules, with the former being the dominant type. The median bars in the test spicules are generally longer than those in the initial spicule. These test spicules resemble the median-bar-centered spicules observed in specimens of Archeoentactinia. As in Archeoentactinia, the test spicules have modified rays that fuse to one another to construct the test. While they vary in size, the size range is not as great as in Archeoentactinia. The apical rays of the spicules form essentially radial primitive spines.
Remarks
The two specimens analyzed using synchrotron MCT are material reported by Won and Iams (Reference Won and Iams2015), loaned from the curation of the Geological Survey of Canada for noninvasive digitization for this study.
Acknowledgments
We thank L. Deer at the University of Queensland School of the Environment for her assistance in sample collection in the Georgina Basin. We thank L. Hick and W. Hick of Thorntonia Station for allowing us to have access to the fossil locations. We thank C. Evans at the University of Queensland Julius Kruttschnitt Mineral Research Centre (Brisbane, Australia) for imaging the mini cores using Xradia Versa 500 for initial assessment of the feasibility of the MCT method. Financial support toward investigation of early Paleozoic radiolarians was provided by the Australian Research Council (ARC DP 1501013325 to J.C.A.). Access to, and use of, Australian Synchrotron MCT Beamline the was supported by ANSTO Australian Synchrotron funding (AS241/IRM/20980).
Competing interests
The authors declare none.
Data availability statement
Surface files of each specimen analyzed using MCT in this study are exported as .stl files. These files can be used to generate interactive 3D models. They are deposited in Dryad Digital Repository (https://doi.org/10.5061/dryad.9zw3r22vn). The files can be downloaded and viewed interactively on open-source 3D software sites, such as FreeCAD (https://www.freecad.org) and Sketchfab (https://sketchfab.com/feed). Readers can rotate and enlarge the 3D models to examine them from all angles.
Supplementary dataset
Index of downloadable .stl files
SDS1 Archeoentactinia hexactinia morphotype 1 (Fig. 4)
SDS2 Archeoentactinia hexactinia morphotype 2 (Fig. 5)
SDS3 Archeoentactinia incaensis morphotype 2 (Fig. 3)
SDS4 Archeoentactinia incaensis morphotype 3 (Fig. 1.10–1.12)
SDS5 Archeoentactinia incaensis morphotype 3 (Fig. 3.1–3.5)
SDS6 Archeoentactinia incaensis morphotype 4 (Fig. 3.6–3.9)
SDS7 Archeoentactinia pentactinia n. sp. (Fig. 6)
SDS8 Echidnina irregularis Won and Iams, Reference Won and Iams2002 (Fig. 12.1)
SDS9 Echidnina irregularis Won and Iams, Reference Won and Iams2002 (Fig. 12.2)
SDS10 Fungomacula barbatula Won in Won and Below, Reference Won and Below1999 (Fig. 14)
SDS11 Varispiculum ectospiculatum Won and Iams, Reference Won and Iams2015 (Fig. 8)
SDS12 Varispiculum ectospiculatum Won and Iams, Reference Won and Iams2015 (Fig. 9)


 Open access