The WHO currently recommends ‘In both adults and children, the intake of free sugars should be reduced to less than 10 % of total energy intake’ (1) and ‘A reduction to less than 5 % of total energy intake would provide additional health benefits’ (1). These recommendations are based on associations between sugar consumption and increased risk of dental caries, type 2 diabetes and CVD, and on associations between energy intake, overweight and obesity(1).
In order to facilitate this reduced sugar consumption, the WHO and various public health agencies currently recommend reducing our consumption of sweet taste, regardless of the source of the sweet taste, that is, regardless of whether the sweet taste stems from sugars, low-energy sweeteners or other sweet-tasting food items such as fruit(2,3) . The rationale here is that reducing exposure to sweet taste will reduce preferences for sweetness and thus reduce the consumption of other sweet-tasting foods and beverages, including sugar.
There is however very little empirical evidence to support the relationship between repeated sweet taste exposure (regardless of source) and subsequent preferences or intakes of other sweet foods. A recent systematic review of the published literature(Reference Appleton, Tuorila and Bertenshaw4) found no clear consistent effects in cohort studies (n 7) or long-term interventions (n 5). Some evidence for an inverse relationship between repeated sweet taste exposure and preferences for other sweet foods was found in short-term intervention studies (n 9), but no effects were found on sweet food intakes(Reference Appleton, Tuorila and Bertenshaw4). An inverse relationship between sweet taste exposure and subsequent preferences was found in two short-term studies in several measures(Reference Griffioen-Roose, Hogenkamp and Mars5,Reference Hetherington, Bell and Rolls6) , although no effects were found in four other studies(Reference Liem and de Graaf7–Reference Sullivan and Birch10), and one study found increased demands for other sweet foods following increased exposure(Reference Ogden, Cordey and Cutler9). Since the systematic review was undertaken, Fantino et al. (Reference Fantino, Fantino and Matray11) also reported no effects of 5-week exposure to low-energy-sweetened beverages compared with water on sweet food intakes, Carroll et al. (Reference Carroll, Chen and Templeman12) reported no effects of 3-week exposure to sweet v. plain breakfasts on subsequent sweet food preferences or intakes and we recently reported no effects of sweet taste exposure from four portions of a low-energy-sweetened beverage compared with water on sweet food intakes(Reference Appleton13).
Effects are inconsistent, and the evidence investigating the impacts of sweet taste exposure on subsequent preferences or intakes of other sweet foods is limited. Few studies are available, the majority of studies did not investigate effects of sweet taste exposure as a primary research aim and not all studies report necessary measures or appropriate data to address this research question (e.g. sweet food intake is not separated in all studies from non-sweet food intake). Preferences and intakes are also often considered synonymous, yet preferences and intakes can be unrelated during everyday consumption(Reference Flint, Raben and Blundell14–Reference van Langeveld, Teo and de Vries17), where intake can be highly varied, while preferences tend to be more constant(Reference Rogers and Hardman15,Reference van Langeveld, Teo and de Vries17) .
This study was conducted to contribute directly to the evidence base investigating the effects of a repeated exposure to sweet taste. Our primary aim was to investigate the effects of sweet taste exposure on subsequent perceptions and intakes of other sweet foods, using a short-term intervention study. Secondary aims further investigated effects as a result of duration of exposure (1 week and 3 weeks) and test context (breakfast and lunch), and associations between the perceived pleasantness, desire for, sweetness and intake of sweet-tasting foods. Note: throughout this work, sweet taste refers solely to the taste of a food item (sweet v. non-sweet); this does not necessarily reflect its sugar content.
Methods
Design
A randomised controlled parallel-group trial was undertaken, in which participants were randomised to consume either a sweet breakfast or a non-sweet breakfast for 3 weeks. Ratings and intakes of other sweet and non-sweet foods were assessed at breakfast and at lunch on day 0 (baseline), day 7 and day 21.
Participants
Fifty-four adults (18 male, 36 female, with a mean age of 23·9 (sd 5·8) years and a mean BMI of 23·6 (sd 3·5) kg/m2) took part. Participants were required to regularly consume breakfast, to be non-smokers, not dieting, to have no known taste or appetite disorders, to have no known food allergies, and to be able to visit Bournemouth University, UK, and undertake all measures on six scheduled occasions. Fifty participants were required (twenty-five per group), to detect a difference between groups in change in pleasantness from day 0 to day 21, of 15/100 mm with a standard deviation of 19/100 mm, at a power of 0·8, assuming an α of 0·05(Reference Howell18). This effect size was calculated based on the pleasantness ratings reported in response to sweet taste exposure in the comparable short-term intervention studies of Hetherington and colleagues(Reference Hetherington, Bell and Rolls6,Reference Hetherington, Pirie and Nabb19) , where changes in pleasantness ratings over 15–22 d of sweet taste exposure ranged between 8·6 and 19·6 mm with standard deviations of 16·2–27·7 mm, and assumes no change in pleasantness ratings in response to the non-sweet taste exposure, as was also demonstrated in these studies(Reference Hetherington, Bell and Rolls6,Reference Hetherington, Pirie and Nabb19) . Participants were recruited from Bournemouth University and the surrounding area and enrolled by researchers for a ‘Study investigating sweet food consumption, choices and preferences’. Participants were not informed about the study purpose, but the specification of sweet food consumption in the study title was intended to facilitate the recruitment of participants who would like and be willing to consume all study foods, and to adhere to all study procedures.
The study was given ethical approval by the Research Ethics Committee of Bournemouth University, UK, prior to commencement and was registered as a clinical trial on clinical trials.gov (ID: NCT03442829) on 21 February 2018. The study was run in accordance with the Declaration of Helsinki and the ethical guidelines of the British Psychological Society. All participants provided written informed consent in advance of their participation. The trial was run as detailed in the registration, although data were also analysed using alternative methods as described in the analysis section.
Participants were randomised to intervention arms by block randomisation using an allocation ratio of 1:1 (block size = 8 participants), using a random number generator, by a researcher with no contact with participants. Randomisation was stratified by self-reported habitual consumption of a sweet or a non-sweet breakfast, as some effects of habitual consumption have previously been found in exposure studies(Reference Hoek, Elzerman and Hageman20,Reference Song, Chung and Cho21) , and differences in appetite have been found based on habitual breakfast v. no breakfast consumption(Reference Alwattar, Thyfault and Leidy22,Reference Thomas, Higgins and Bessesen23) .
Intervention/Control
Participants were randomised to two study arms: sweet taste exposure or no sweet taste exposure. Exposure was undertaken at breakfast using the whole breakfast meal; thus, participants either consumed an entirely sweet breakfast or an entirely non-sweet breakfast for the duration of the study. Breakfast was chosen for the exposure manipulation as a meal that is commonly consumed in the UK in both entirely sweet and entirely non-sweet forms. To deliver the manipulation, participants were provided with a packet of a typical UK non-sweet boxed breakfast cereal (Cornflakes; Sainsbury’s Supermarkets Ltd) per week, for consumption at home, which contained either a bag of sucralose or no sucralose. This breakfast cereal is commonly available in sweet and non-sweet versions in the UK and also represents a plain breakfast cereal compared with those with additional tastes, such as fruit, nuts or chocolate. Sucralose (Granulated Sweetener, Asda, 18 kJ/g), a low-energy sweetener approved for use in foods and beverages globally(Reference Magnuson, Roberts and Nestmann24), was used to provide a sweet taste without significant additional energy. Participants were instructed to consume the cereal every day, for breakfast, and in the event that they also received a bag of sweetener were asked to add two teaspoons of the provided sweetener (2 × 3 g sweetener, providing 2 × 0·5 g sucralose) to each bowl of cereal (equivalent in taste to 2 teaspoons (2 × 5 g) of sucrose), and one teaspoon of sweetener (3 g sweetener, 0·5 g sucralose) to any drinks consumed at the time. Participants who did not receive sweetener were asked to avoid adding anything to their cereal (except for milk) and to avoid other sweetened foods and beverages during breakfast. In the event that a participant was unwilling to add sweetener to a habitual breakfast drink, they were asked instead to consume the drink throughout the meal, to maintain a sweet taste experience overall, while enhancing compliance with other study procedures. Our intention was that participants experienced either an entirely sweet breakfast or an entirely non-sweet breakfast for the exposure period. The non-sweet breakfast furthermore was simply not sweet, as opposed to savoury or salty. Adherence to all instructions was checked verbally at each subsequent test day.
Packets of cereal were created by a researcher with no contact with participants and provided sealed; thus, all researchers in direct contact with participants were blinded to intervention allocation. Participants were not blinded to taste condition but were blind to other study conditions and were not told the specific sweetener (sugar or low-energy sweetener) used. Exposure was undertaken for 3 weeks, allowing for outcome assessments on days 0, 7 and 21.
Outcomes
Our primary outcomes were ratings of pleasantness, desire for and sweetness of other sweet foods, and intakes of other sweet foods, at breakfast. Secondary outcomes were ratings of pleasantness, desire for and sweetness of other sweet foods and intakes of other sweet foods at lunch, and ratings of pleasantness, desire for and sweetness of non-sweet foods at breakfast and lunch.
Pleasantness, desire to eat and sweetness
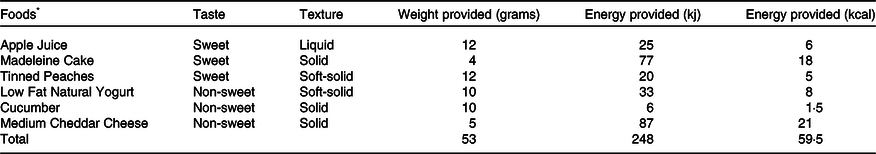
For these measures, pleasantness refers to the pleasantness of the taste of the foods, desire to eat represents motivation to consume the food in question, which is partly but not fully determined by liking for the food(Reference Rogers and Hardman15), and sweetness refers to the perceived level (intensity) of sweetness of the foods. These measures were made using a taste test, where participants were required to consume a small sample of each of three sweet foods and three non-sweet foods, as detailed in Table 1. These foods were chosen as foods that consistently differ in taste, were familiar to all participants, represented a variety of textures and were also served in the buffet meal to assess sweet food intakes. Real foods as opposed to sugared water solutions or similar were used to enhance the validity of the ratings(Reference Hoek, Elzerman and Hageman20,Reference Kremer, Shimojo and Holthuysen25) . Participants were asked to consume each food in full in a pre-specified order, focus purely on the taste of the food and then rate it immediately after consumption. Participants were then asked to rinse their mouths with water and move to the next pre-specified food. Participants rated the samples using 100 mm visual analogue scales of: Pleasantness: ‘How PLEASANT does this food taste to you right now?, anchors ‘not at all pleasant’, ‘extremely pleasant’; Desire to Eat: ‘Now, rate how strong your DESIRE TO EAT more of this food is right now?’, anchors ‘not at all strong’, ’extremely strong’ and Sweetness: ‘How SWEET does this food taste to you right now?’, anchors ‘not at all sweet’, ‘extremely sweet’. Data were collected using pen and paper measures, and data for each measure were then combined across all three sweet foods and all three non-sweet foods for analysis.
Details of the foods provided in the taste test (taste, texture, weight and energy provided)

* All foods were manufactured for Sainsbury’s Supermarkets Ltd, London, UK, with the exception of the Madeleine Cakes, which were manufactured by Bon Maman, Contres, France.
Intakes
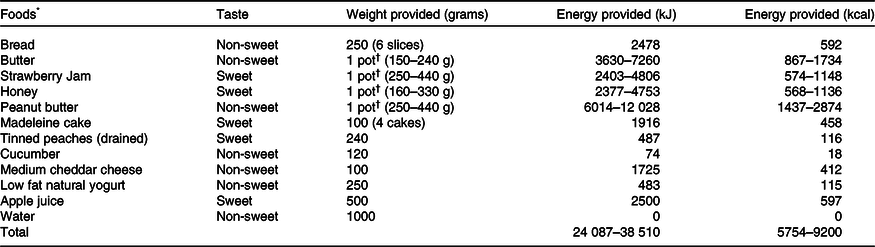
Sweet and non-sweet food intakes were assessed using a buffet meal composed of a variety of sweet foods and non-sweet foods, as detailed in Table 2. The meal represented a standard UK cold buffet meal that could be acceptable for breakfast or lunch, and where an acceptable meal that was entirely sweet, entirely non-sweet or a mixture of sweet and non-sweet foods could be composed. All foods were familiar to all participants and are commonly consumed in the UK. Importantly, the foods were selected based on taste (sweet v. non-sweet), familiarity and acceptability, not based on their sugar content. Participants were free to consume as little or as much as they wished, and intake was assessed by covertly measuring weight of foods consumed(Reference Flint, Raben and Blundell14). Participants were provided with their own individual tray of all foods, and all foods were covertly weighed as provided by the kitchen and again as returned to the kitchen. Returned food included all that was not consumed by each participant, whether they served the food onto their dining plate or not. Weight of food consumed was then converted into energy consumed and sugars consumed using manufacturers’ information. Sweet food intake was measured using: percentage weight consumed from sweet foods, percentage energy consumed from sweet foods, weight of sugars consumed and percentage energy consumed from sugars. Several measures of sweet food intake were included because at present there is no consensus on the most clinically relevant measure of sweet food intake(Reference Trumbo, Appleton and de Graaf16). Sugar content is commonly used as a measure for sweet food consumption, but this measure can be criticised where foods are sweetened with low-energy sweeteners, or where non-sweet foods contain ‘hidden’ sugars, where the sweet taste is masked by other tastes(Reference Trumbo, Appleton and de Graaf16).
Details of the foods provided in the buffet meal (taste, weight and energy provided)

* All foods were manufactured for Sainsbury’s Supermarkets Ltd, London, UK, with the exception of the Bread, which was manufactured by KingsMill 50/50, Allied Bakeries, Maidenhead, UK; the Butter, which was manufactured by Lurpak spreadable, Arla Foods, Denmark; the Peanut Butter, which was manufactured by Whole Earth, Kallo Foods Ltd, Surrey, UK and the Madeleine cakes, which were manufactured by Bon Maman, Contres, France.
† Variable amounts provided in standard manufacturer’s jars that ranged from half-full to almost complete.
Outcomes were assessed at breakfast and lunch, on day 0 before the intervention was implemented, after 1 week of exposure on day 7 and after 3 weeks of exposure on day 21. Taste tests were consistently undertaken immediately in advance of the buffet meal. This ensured that measures of pleasantness, desire to eat and sweetness were unaffected by any intake immediately prior to the taste tests that may mask, distort or alter the perception of tastes during the taste test(Reference Li, Hayes and Ziegler26). The taste tests also involved the consumption of stipulated amounts of foods, and this was consistent for all participants and on all test occasions; thus, consumption during the taste test would be unlikely to differentially effect consumption during the following ad libitum test meals(Reference Flint, Raben and Blundell14).
Additional measures
Sex and age were recorded. BMI was calculated from measures of height and body weight, undertaken by a study researcher. Appetite ratings for hunger, fullness and thirst were also measured prior to each meal. These measures were made using 100 mm visual analogue scales of: Hunger: ‘How HUNGRY do you feel right now?’, anchors ‘not at all hungry’, ‘extremely hungry’; Fullness: ‘How FULL does your stomach feel right now?, anchors ‘not at all full’, ‘extremely full’ and Thirst: ‘How THIRSTY do you feel right now?’, anchors ‘not at all thirsty’, ‘extremely thirsty’.
Procedure
The study was run in the Eating Behaviours Laboratory at Bournemouth University, UK, from February–May 2018, February–May 2019, and February–March 2020. Participants came to the laboratory on six occasions: for breakfast and lunch on day 0 (baseline), day 7 and day 21. On each day, participants were asked to arrive fasted, having consumed no alcohol or undertaken any heavy exercise the day before. On each occasion, participants undertook the taste test and then ate from the ad libitum test meal. Breakfast test sessions were run between 08.00 and 09.30 hours on each day, and lunch test sessions were run 4 h later. Participants adhered to the same times for both test sessions on each test day. Between test sessions, participants were instructed to consume nothing but water. A timeline for each test day is given in Fig. 1. Sex, age, height, body weight and acceptability of all study foods and study procedures were checked in a screening session prior to the first breakfast test session. The acceptability of all study foods was assessed by asking participants to rate their willingness to consume each study food on a nine-point scale from ‘not willing’ (scored 1) to ‘extremely willing’ (scored 9), with a cut-off of a rating >4 for every study food for study inclusion. To help conceal the study purpose from participants, this list of study foods was described as ‘a list of foods that may be included in the study’ and included a number of commonly consumed sweeteners and breakfast cereals, that were then not actually part of the study. As part of the screening measures, participants were also asked ‘Do you usually consume a sweet or a non-sweet breakfast?’ This question was asked to allow participants to be randomised based on habitual breakfast consumption, but it was asked in a casual manner to avoid drawing attention to the taste of breakfast. Acceptability of all study procedures was checked following detailed explanation of all study instructions, including the requirement to consume a specified breakfast, as instructed, for 3 weeks. At the end of day 0 and day 7, participants received a designated box of cereal (with or without sweetener) identified by ID number, to consume from the following day onwards as instructed. At the start of day 7 and day 21, participants were queried regarding compliance using the questions ‘Have you consumed your breakfast each day as instructed?’ and ‘Have you had any difficulties?’, and the amount of cereal remaining in each cereal box was checked to ensure a sufficient amount had been removed. These questions were asked in a casual manner, as stated, to encourage participants to admit if they had failed to adhere to any instruction, and to maintain blinding of the researchers during the study. At the end of day 21, participants were also queried over the taste of the breakfasts they had consumed using the question ‘Would you describe the breakfasts you have consumed as part of the study as sweet or non-sweet?’ and debriefed. This question was asked to verify that all participants perceived the intervention exposure as sweet or non-sweet as intended.
Diagram of the study procedure for each test day1. 1 A, appetite ratings (Hunger, Fullness, Thirst); TMI, test meal intake; TT, taste test.

Analysis
First, all data were double-measured and double-entered into spreadsheets by two researchers who were blind to allocated breakfast condition. Data were then checked for normality, normality was confirmed and baseline data were inspected for meaningful differences between exposure groups in all background characteristics.
Rating data were then analysed using 2 × 3 × 2 × 2 repeated-measures ANOVA for differences between exposure conditions (sweet v. non-sweet) over time (days 0, 7 and 21), for the sweet and the non-sweet foods (sweet v. non-sweet). Considering our interest in generalised taste preferences, analyses were conducted for rating data that were combined across all three sweet foods and all three non-sweet foods. Correlations between these combined measures and the measures for each of the individual foods are given in Supplementary Tables 1 and 2. Analyses for the measures from each of the individual foods are also given in Supplementary Results 1 and 2. These analyses should be considered exploratory; we had no hypotheses specific to the individual foods or referring to differences between the foods within the sweet and non-sweet food categories. Intake data were analysed using 2 × 3 × 2 repeated-measures ANOVA for differences between exposure conditions (sweet v. non-sweet) over time (days 0, 7 and 21). Sex was also included in these analyses, as a variable known to effect food intake(Reference Rogers and Hardman15,Reference van Langeveld, Teo and de Vries17) . Sex was also included in the analyses on rating data for completeness; however, effects of sex on taste perceptions are inconsistent, and no main effects of sex were found in our rating data (largest F 1,50 = 0·62, P = 0·44, ηp2 = 0·01). Effects of sex in the rating data should again be considered exploratory. Analyses were undertaken for measures taken at breakfast and repeated for measures taken at lunch. These analyses were undertaken on an intention-to-treat basis, with missing data imputed using models based on sex, age, BMI and baseline data(Reference Li and Stuart27). Imputation was undertaken in place of the use of last observation carried forward as pre-specified in our trial registration, to allow consideration of the natural variation in perceptions and intakes(Reference Li and Stuart27). Analyses using last observation carried forward are also provided in Supplementary Results 3. Both sets of analyses revealed comparable effects. Significant effects of time in all analyses were investigated using post hoc Bonferroni t tests. Effect sizes (ηp2) are also reported in the text. Bayes factors demonstrating the evidence supporting the alternative hypothesis (BF10) are also provided where significant effects were found, and Bayes factors demonstrating the evidence supporting the null hypothesis compared with that supporting the alternative hypotheses (BF01) are reported for all exposure × time interactions.
Finally, associations between rating and intake outcomes were investigated using partial correlations across the whole data set. For these correlations, all data were treated equally, regardless of day and breakfast/lunch test context, resulting in the inclusion of 310 data points (54 participants × 6 assessment time points, minus missing data due to drop out). Participant ID was used as a controlling variable, to account for the use of data from multiple time points.
ANOVA and correlational analyses were conducted using IBM SPSS (version 23.0). Significance was set at P < 0·01 to account for multiple testing; significant values from P = 0·01 to P = 0·05 were considered as trends to ensure no effects were missed. Bayes factors were computed using JASP (version 0.14.1.0), using the comparison to a null model option and 10 000 posterior samples. Bayes factors can be interpreted in terms of the strength of support provided for a hypothesis. BF01 < 3 is regarded as weak evidence in support of the null hypothesis, BF01 = 3 to 10 is regarded as moderate evidence, BF01 = 10 to 150 is regarded as strong evidence and BF01 > 150 is regarded as very strong evidence in support of the null hypothesis. Data are reported as mean and standard deviation in Tables, and as mean and standard error in Figures, unless otherwise stated.
Results
Participants
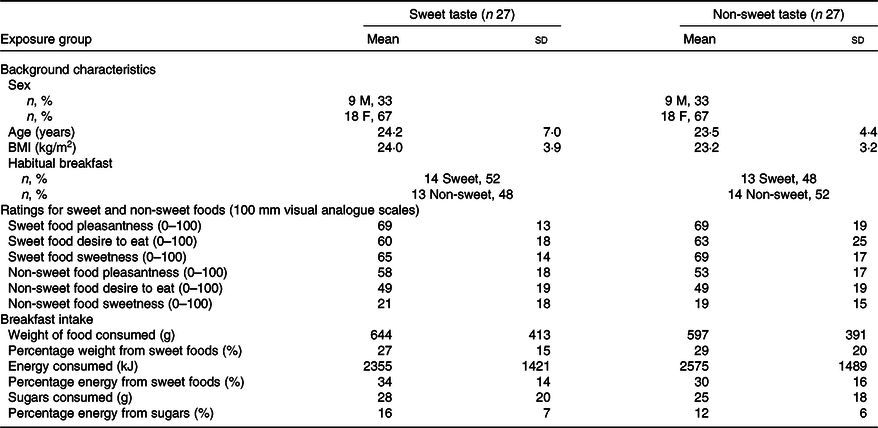
Of the fifty-four participants recruited, twenty-seven participants were randomised to consume sweet breakfasts and twenty-seven were randomised to consume non-sweet breakfasts. The two groups were comparable in sex, age, BMI, habitual self-reported breakfast type and baseline (day 0) ratings of the foods and intakes at breakfast. See Table 3 for all baseline data.
Descriptive statistics for all participants in the sweet taste (n 27) and non-sweet taste (n 27) exposure groups *

* Values are mean and standard deviation, unless otherwise stated.
Compliance
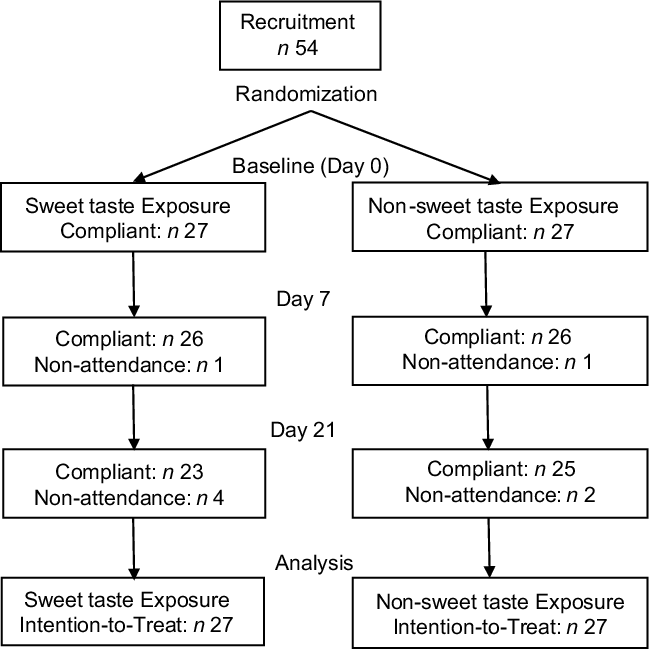
The flow of participants through the study is given in Fig. 2. All fifty-four participants completed baseline breakfast and lunch measures, 52 (96 %) participants completed breakfast and lunch measures on day 7 (twenty-six participants in the sweet exposure condition, twenty-six participants in the non-sweet exposure condition) and forty-eight (89 %) participants completed breakfast and lunch measures on day 21 (twenty-three participants in the sweet exposure condition, twenty-five participants in the non-sweet exposure condition). Drop outs were due to scheduling clashes or were due to illness unrelated to the study. Self-reported compliance with study procedures outside the laboratory was good. All participants reported following all study instructions, no difficulties and consumption of sweet or non-sweet breakfasts as intended based on group allocation, without harm.
CONSORT flow diagram, detailing participant flow through the trial, n 54.

Pleasantness
Breakfast
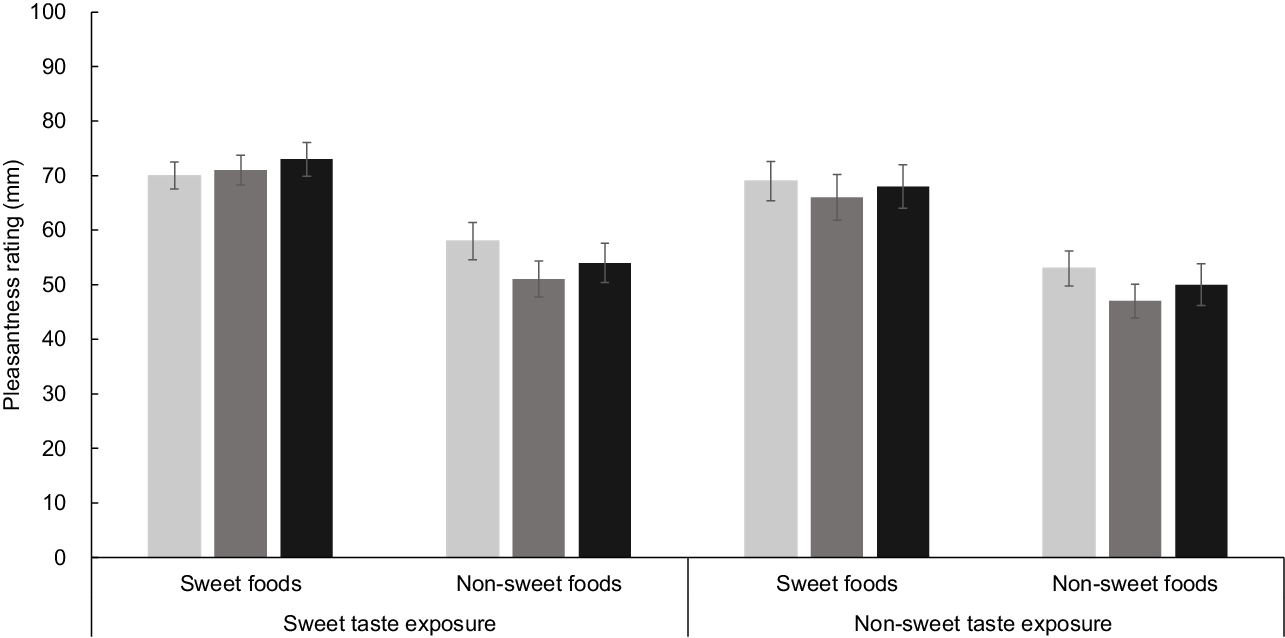
In pleasantness ratings at breakfast, higher ratings were given for the sweet compared with the non-sweet foods (F 1,50 = 33·99, P < 0·001, ηp2 = 0·41; BF10 > 1500 (BF10error =0·77 %)). Pleasantness of all foods also tended to decrease over time (F 2,100 = 3·19, P = 0·05, ηp2 = 0·06), specifically from day 0 to day 7 (t(53) = 2·78, P < 0·01) (see Fig. 3). This effect was strongest for the non-sweet foods as rated by females (F 2,100 = 3·13, P = 0·05, ηp2 = 0·06), from day 0 to day 7 (t(35) = 2·88, P = 0·01) and from day 0 to day 21 (t(35) = 2·07, P = 0·05). There were no statistically significant exposure × time interactions (largest: F 2,100 = 0·53, P = 0·59, ηp2 = 0·01; smallest: BF01 = 297·97 (BF01error = 2·68 %)).
Pleasantness ratings during the taste test at breakfast for sweet and non-sweet foods on days 0, 7 and 21, following sweet taste or non-sweet taste exposure. Values are mean with their standard errors, n 54. Sweet and non-sweet foods differ when exposure groups and time points are combined, P < 0·01; no significant differences between exposure groups. ![]() , Day 0;
, Day 0; ![]() , Day 7;
, Day 7; ![]() , Day 21.
, Day 21.

Lunch
At lunch, higher pleasantness ratings were again found for the sweet compared with the non-sweet foods (F 1,50 = 20·99, P < 0·001, ηp2 = 0·38, BF10 > 1500 (BF10error = 1·62 %)). There were no statistically significant exposure × time interactions (largest F 2,100 = 0·61, P = 0·55, ηp2 = 0·01; smallest: BF01 = 1275·38 (BF01error = 6·36 %)).
Desire to eat
Breakfast
In desire to eat ratings at breakfast, higher ratings were given for the sweet compared with the non-sweet foods (F 1,50 = 20·88, P < 0·001, ηp2 = 0·30; BF10 > 1500 (BF10error =1·24 %)). There were no statistically significant exposure × time interactions (largest: (F 2,100 = 1·61, P = 0·21, ηp2 = 0·03; smallest: BF01 = 687·38 (BF01error = 1·76 %)).
Lunch
At lunch, higher desire to eat ratings were given for the sweet compared with the non-sweet foods (smallest F 1,50 = 13·22, P < 0·001, ηp2 = 0·21; BF10 > 1500 (BF10error =1·04 %)). There were no statistically significant exposure × time interactions (largest (F 2,100 = 0·83, P = 0·44, ηp2 = 0·02; smallest: BF01 = 440·96 (BF01error = 5·01 %)).
Sweetness
Breakfast
In sweetness ratings at breakfast, large differences between sweet and non-sweet foods were found (F 1,50 = 259·51, P < 0·001, ηp2 = 0·84; BF10 > 1500 (BF10error = 1·24 %)). Ratings of sweetness for the non-sweet foods were also found to increase specifically in females (F 1,50 = 3·08, P = 0·05, ηp2 = 0·06), from day 0 to day 7 (t(35) = 2·50, P = 0·02). There were no statistically significant exposure × time interactions (largest: F 2,100 = 1·87, P = 0·16, ηp2 = 0·04; smallest: BF01 > 1500 (BF01error = 4·96 %)).
Lunch
At lunch, large differences in sweetness ratings between sweet and non-sweet foods were found (F 1,50 = 229·91, P < 0·001, ηp2 = 0·82; BF10 > 1500 (BF10error = 0·79 %). There were no statistically significant exposure × time interactions (largest: F 2,100 = 1·58, P = 0·21, ηp2 = 0·03; smallest: BF01 > 1500 (BF01error = 1·62 %)).
Intakes
In weight of food, energy and sugars consumed, males consumed significantly more than females at breakfast and lunch (smallest: F 1,52 = 7·19, P = 0·01, ηp2 = 0·12; smallest: BF10 = 5·02 (BF10error = 1·17 %)). No further statistically significant effects of sex were found (largest: F 2,100 = 2·76, P = 0·07, ηp2 = 0·05).
Breakfast
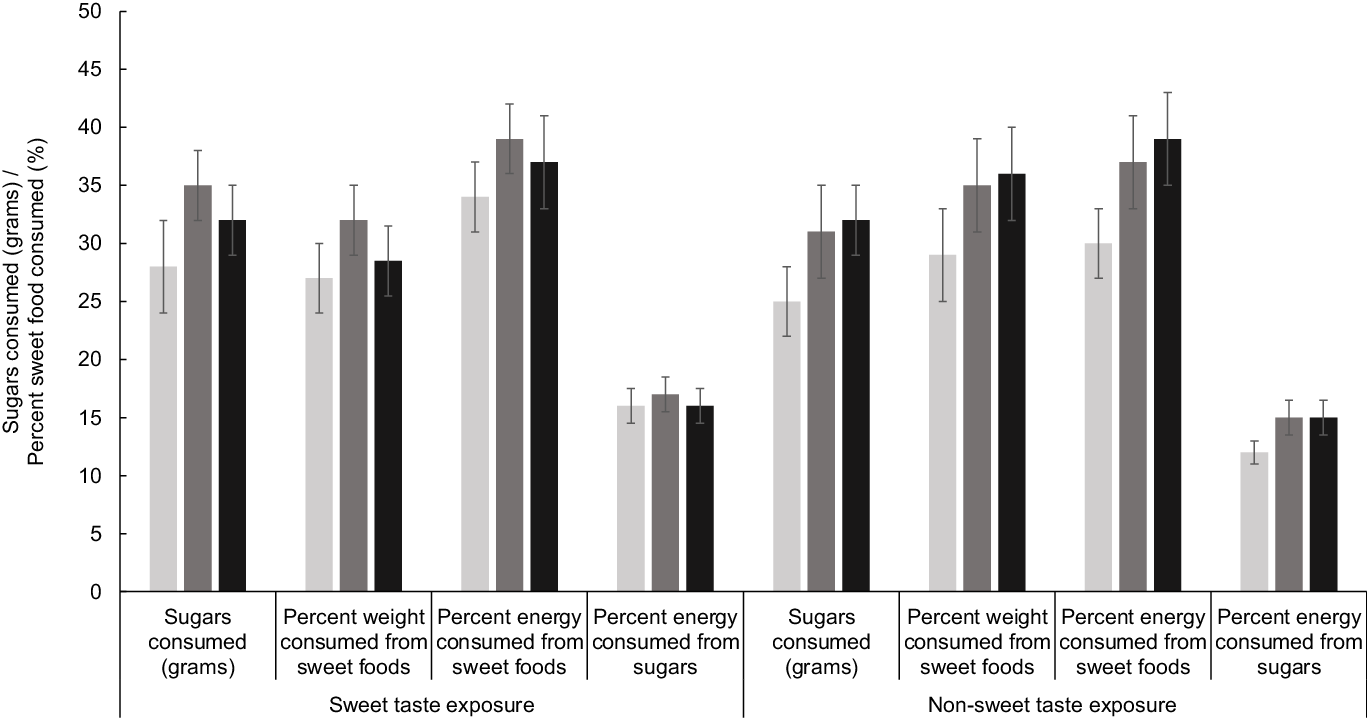
Percentage energy consumed from sweet foods increased at breakfast (F 2,100 = 4·55, P = 0·01, ηp2 = 0·08; BF10 = 2·78 (BF10error = 0·92 %)), and there was a trend for sugars consumed to also increase over the 3 weeks (F 2,100 = 3·57, P = 0·03, ηp2 = 0·07; BF10 = 2·92 (BF10error = 0·77 %). Increases occurred from day 0 to day 7 (smallest t(53) = 2·43, P = 0·02) and from day 0 to day 21 (smallest t(53) = 2·23, P = 0·03) (see Fig. 4). No statistically significant exposure × time interactions were found (largest F 2,100 = 2·76, P = 0·07, ηp2 = 0·05; smallest: BF01 = 0·22 (BF01error = 1·88 %)).
Food intake (sugars, percentage weight consumed from sweet foods, percentage energy consumed from sweet foods and percentage energy consumed from sugars) at breakfast on days 0, 7 and 21, following sweet taste or non-sweet taste exposure. Values are mean with their standard error, n 54. Percentage energy consumed from sweet foods (and sugars consumed) differs over time when sweet taste and non-sweet taste exposure groups are combined, P = 0·01; no significant differences between exposure groups. ![]() , Day 0;
, Day 0; ![]() , Day 7;
, Day 7; ![]() , Day 21.
, Day 21.

Lunch
Percentage energy consumed from sweet foods at lunch increased over the 3 weeks (F 2,104 = 5·38, P = 0·01, ηp2 = 0·10; BF10 = 2·51 (BF10error = 0·86 %)), from day 0 to day 21 (t(53) = 2·68, P = 0·01). There were no statistically significant exposure × time interactions (largest F 2,100 = 1·09, P = 0·34, ηp2 = 0·02; smallest: BF01 = 7·54 (BF01error = 1·62 %)).
Hunger
Breakfast
Hunger increased and fullness decreased at breakfast over the 3 weeks (smallest F 2,104 = 4·44, P = 0·01, ηp2 = 0·08; smallest: BF10 = 2·80 (BF10error = 2·04 %)). No effects were found in thirst (F 2,104 = 2·55, P = 0·08, ηp2 = 0·05). No statistically significant effects of exposure × time were found (largest F 2,104 = 1·37, P = 0·26, ηp2 = 0·03; smallest: BF01 = 1·61 (BF01error = 2·17 %)).
Lunch
Hunger and fullness at lunch did not change over the 3 weeks (largest F 2,104 = 2·44, P = 0·09, ηp2 = 0·05). There was a trend for thirst to increase over the 3 weeks (F 2,104 = 4·08, P = 0·02, ηp2 = 0·07). No statistically significant effects of exposure × time were found (largest F 2,104 = 0·57, P = 0·57, ηp2 = 0·01; BF01 = 8·07 (BF01error = 4·53 %)).
Associations between ratings and intake
Hunger was negatively correlated with fullness (r = –0·610, P < 0·01). Neither hunger nor fullness was correlated with energy consumed (largest r = –0·078, P = 0·17), but there was a weak negative correlation between fullness and weight of food consumed (r = –0·135, P = 0·02). Weight of food consumed, energy consumed and sugars consumed were positively correlated (smallest r = 0·654, P < 0·01).
Percentage weight consumed from sweet foods, percentage energy consumed from sweet foods, sugars consumed and percentage energy consumed from sugars were positively correlated (smallest r = 0·282, P < 0·01), but only sugars consumed were associated with overall weight (r = 0·694, P < 0·01) and energy consumed (r = 0·654, P < 0·01). Percentage measures were not correlated with overall weight or energy consumed (largest r = –0·105, P = 0·06).
Pleasantness, desire to eat and sweetness ratings for all sweet foods were correlated (smallest r = 0·459, P < 0·01). Pleasantness, desire to eat and sweetness ratings for all non-sweet foods were correlated (smallest r = 0·231, P < 0·01). Pleasantness ratings for sweet and non-sweet foods (r = 0·269, P < 0·01) and sweetness ratings for sweet and non-sweet foods were also correlated (r = 0·166, P = 0·01).
Pleasantness and desire to eat ratings for all foods in the taste test were correlated with weight of that food subsequently consumed (smallest r = 0·210, P < 0·01). Pleasantness and desire to eat ratings for sweet foods were not correlated with total weight or energy consumed (largest r = 0·085, P = 0·14) but were correlated with sugars consumed, percentage weight consumed from sweet foods, percentage energy consumed from sweet foods and percentage energy consumed from sugars (smallest r = 0·137, P < 0·01). Ratings of pleasantness and desire to eat for the non-sweet foods were positively correlated with total weight and energy consumed (smallest r = 0·132, P = 0·02) and were negatively correlated with percentage weight consumed from sweet foods, percentage energy consumed from sweet foods and percentage energy consumed from sugars (smallest r = –0·218, P < 0·01).
Discussion
The primary aim of this study was to add to the limited evidence on the effects of repeated sweet taste exposure on subsequent perceptions and intakes of other sweet foods. We found no statistically significant effects of sweet taste exposure at breakfast for 3 weeks on ratings of pleasantness, desire to eat or sweetness of other sweet foods, or on intakes of other sweet foods. The evidence in support of a lack of effect in all ratings was also strong to very strong, allowing firm conclusions. The strength of the evidence provided by the rating measures is an important finding of this study. These results confirm the findings of previous short-term studies(Reference Liem and de Graaf7–Reference Sullivan and Birch10,Reference Carroll, Chen and Templeman12) and conclusions based on longer time frames(Reference Appleton, Tuorila and Bertenshaw4). The evidence for a lack of effect in the intake measures was inconsistent, ranging from weak to very strong. This evidence in the intake measures is likely weakened by the high natural variation in individuals’ food intake(Reference Rogers and Hardman15,Reference van Langeveld, Teo and de Vries17) . Studies of larger sample sizes may be of value for determining the effects of sweet taste exposure on sweet food intakes, but our findings do mirror those of other studies with a similar design(Reference Mattes8,Reference Ogden, Cordey and Cutler9,Reference Fantino, Fantino and Matray11,Reference Carroll, Chen and Templeman12) .
In relation to our secondary aims, we also found no statistically significant effects of sweet taste exposure at breakfast based on duration of exposure (1 week, 3 weeks) or test context (breakfast, lunch), but associations were found between ratings of pleasantness, desire for and intake of sweet-tasting foods. We specifically used foods from the buffet meal for the taste test to investigate these associations, and close associations between taste test ratings and subsequent intake of the specific foods were found. Pleasantness and desire for the sweet foods and all measures of sweet food intake were also correlated with each other, but not with overall weight or energy consumed. Pleasantness and desire for the non-sweet foods were also correlated not only with pleasantness and desire for the sweet foods but also with overall weight and energy consumed. These findings may suggest that pleasantness and desire for non-sweet foods are more closely related to eating and appetite in general(Reference Griffioen-Roose, Hogenkamp and Mars5,Reference Appleton, Rogers and Blundell28–Reference De Graaf, Schreurs and Blauw30) ; these findings thus suggest some degree of specificity to our sweet food perception measures, and that measures of perceptions of non-sweet foods may add little value to studies on sweet taste.
Effects as a result of study duration were also found. Over the 3-week study period (regardless of exposure group), percentage energy consumed from sweet foods and sugars consumed in the test meals increased and there was a suggestion that the pleasantness of all foods and specifically the non-sweet foods reduced. Effects of duration most likely result from the repeated experience of the test meals. Various work demonstrates changes in the pleasantness and intake of foods with experience, where liking and intake can increase as a result of increased familiarity, learned safety or learned benefit(Reference Liem and de Graaf7,Reference Sullivan and Birch10,Reference Song, Chung and Cho21,Reference Kremer, Shimojo and Holthuysen25) , or where liking and intake can decrease as a result of monotony, boredom or a form of diminished pleasure from the sensory experience or act of consumption(Reference Hoek, Elzerman and Hageman20,Reference Dalenberg, Nanetti and Renken31–Reference Rolls34) . Monotony, boredom or similar perceptions with the foods to be consumed may explain the reduced acceptability and selection of the non-sweet foods in this study(Reference Hoek, Elzerman and Hageman20,Reference Zandstra, Weegels and van Spronsen33) , to also drive the increased selection of sweet foods. It is possible furthermore that this effect of monotony is stronger for non-sweet foods than for sweet foods and that this effect can occur following a single experience of a taste or food item, as this has been demonstrated in single exposure studies(Reference Appleton, Rogers and Blundell28,Reference Griffioen-Roose, Finlayson and Mars35,Reference Griffioen-Roose, Mars and Finlayson36) . A range of other food product attributes, such as familiarity, liking, intensity, complexity and consideration as a staple food, may also be important in food monotony and may explain effects over time(Reference Hetherington, Bell and Rolls6,Reference Hetherington, Pirie and Nabb19,Reference Hoek, Elzerman and Hageman20,Reference Weijzen, Zandstra and Alfieri32,Reference Zandstra, Weegels and van Spronsen33) . Importantly, however, we suggest monotony with the test foods as an explanation for our observations – we were not investigating monotony specifically, and further work is needed to confirm this explanation.
Can we also explain why three earlier short-term intervention studies did find effects of sweet taste exposure? In the study by Ogden et al. (Reference Ogden, Cordey and Cutler9), a lower restriction of chocolate coins led to higher demands for other sweet foods (study 1), but a follow-up study conducted to address the methodological limitations of this study (study 2) failed to find similar effects. In the study by Hetherington et al. (Reference Hetherington, Bell and Rolls6), ranked preferences for sweet foods declined following 15 d chocolate exposure. Here, the combined measures of sweet foods included the measures for chocolate – the eaten food; thus, the extent of effects in other sweet foods (separate from those for chocolate) is consequently unclear. In the study by Griffioen-Roose et al. (Reference Griffioen-Roose, Hogenkamp and Mars5), reduced preferences for sweet foods were found following 24 h of a solely sweet diet (with the exception of tea and coffee). These effects may again have been found due to a satiety or monotony with sweet taste. The solely sweet manipulation by Griffioen-Roose et al. (Reference Griffioen-Roose, Hogenkamp and Mars5), however, clearly differs from our manipulation which was undertaken only at breakfast and from manipulations which focus on specific food products(Reference Liem and de Graaf7,Reference Ogden, Cordey and Cutler9,Reference Sullivan and Birch10) and/or are rendered impure by the simultaneous consumption of other sweet tasting food items(Reference Mattes8). It is important to note that because our manipulation was undertaken solely at breakfast, participants likely consumed sweet foods over the rest of each day and we have no measures of this intake. It is possible, therefore, that this sweet food intake was adjusted to counteract any manipulation at breakfast. Investigation of the effects of a longer exposure to a solely sweet diet, or a longer exposure to a more-than-usual sweet diet, would clearly be of value.
The possible influences of test context, test stimuli and test manipulation may suggest important criteria for the demonstration of taste associations in the laboratory(Reference Liem and de Graaf7,Reference Hoek, Elzerman and Hageman20,Reference Kremer, Shimojo and Holthuysen25) . Additional effects may also be suggested as a result of interactions with texture, temperature and other product attributes, various characteristics of the consumer, and so on(Reference Sullivan and Birch10,Reference Hoek, Elzerman and Hageman20,Reference Song, Chung and Cho21,Reference Kremer, Shimojo and Holthuysen25,Reference Li, Hayes and Ziegler26,Reference Dalenberg, Nanetti and Renken31,Reference Zandstra, Weegels and van Spronsen33) . These differences may contribute to the inconsistencies between study findings on sweet taste exposure. However, if very specific criteria are required to demonstrate effects in carefully controlled laboratory settings, there are clear questions over the generalisability of findings to the real world. The findings of an increasing number of studies now demonstrate no effects of sweet taste exposure on subsequent desires for and intakes of other sweet foods. The value of recommendations to reduce sweet taste exposure in order to facilitate reduced intakes of other sweet foods, including sugars can clearly be questioned. Further evidence would strengthen the evidence base, but a revision of the recommendations may soon be required.
This study may be limited by the specific methodology used, as detailed above. Alongside these, our manipulation was undertaken using sucralose and our effects or lack of effects may have resulted specifically from our use of sucralose. Sucralose is a low-energy sweetener, which is perceived as highly sweet, and in our study provided a sweet taste while also providing little additional energy, to result in the consumption of breakfasts that were reported as sweet. Some work suggests differing or reduced impacts of sucralose compared with sucrose on taste pathways(Reference Frank, Oberndorfer and Simmons37–Reference Low, McBride and Lacy39). However, in these studies, effects of sucralose are still reported and the sucralose in our study was not compared with sucrose, but to non-sweet tastants. A more detailed question on the sweetness of the breakfasts, or repeated reporting on each day of breakfast consumption, may have revealed additional insights. Some evidence, furthermore, also suggests differing effects of different low-energy sweeteners on taste quality and taste mechanisms, thus use of a different low-energy sweetener may have resulted in differing results(Reference Low, Lacy and Keast38). We also relied on participants to undertake the exposure period as instructed in their own homes. While all participants reported good compliance and consumption of breakfasts that tasted sweet or not sweet as intended, we have no other evidence that this was the case. Participants may also have varied in liking for their allocated breakfast but, based on our screening measures and study design, we have no reason to believe this would have systematically differed between exposure groups. Furthermore, based on our choice of a plain breakfast cereal and our compliance checks, we have no reason to believe that either breakfast was aversive to any participant. Effects related to liking/disliking of the allocated breakfast however may have occurred. There may also have been some impact on our findings of participant awareness of their consumption of a sweet or non-sweet breakfast. Participants could not be blinded to the taste exposure, and various evidence suggests that participant beliefs can effect study outcomes(Reference Coolican40). We aimed to minimise any impact of beliefs by withholding the study purpose from participants and ensuring participants were unaware of all exposure conditions, and anecdotal comments during the debrief session suggested that none of the participants held any beliefs about the study that may have influenced our results. Indeed, the majority of participants assumed that the study was almost entirely observational, where the question on habitual breakfast consumption had been asked during screening to ensure that a habitual breakfast was subsequently provided or was specifically not provided. Participants thus, assumed the study was more about habit than sweet taste. Furthermore, if beliefs were important, the popular belief that sweet taste exposure may increase sweet taste preferences(Reference Appleton, Tuorila and Bertenshaw4) would likely have resulted in the demonstration of effects of exposure, while we did not demonstrate these effects. Finally, despite reaching sufficient numbers for our a priori power calculations, our study is relatively small in size. Using Bayesian analyses, the evidence provided by all of our rating measures (pleasantness, desire to eat and sweetness) was strong to very strong, but the evidence for a lack of effect in the intake measures was inconsistent, ranging from weak to very strong.
In conclusion, we found no statistically significant effects of sweet taste exposure at breakfast for 3 weeks, compared with no exposure, on the subsequent pleasantness, desire for, sweetness or intake of other sweet foods, and the evidence for an absence of effect was strong to very strong for the pleasantness, desire for and sweetness measures. Our findings confirm those of other short-term intervention studies. We also found no statistically significant effects of 1 v. 3 weeks of sweet taste exposure, or dependent on the breakfast or lunch test-meal context. We did, however, find significant associations between our pleasantness, desire for and intake measures, and we found significant changes in sweet food intakes over the course of the study regardless of exposure group, most plausibly due to monotony with the foods used in the test meal. Our findings, taken together with the results of other similar short-term intervention studies, suggest no effects of repeated sweet taste exposure on the pleasantness, desire for, sweetness or intake of other sweet foods.
Acknowledgements
The authors gratefully thank Kirsty Probert and Alejandra Torres Sanchez, Faculty of Health and Social Sciences, Bournemouth University, for help with data collection, and all participants who took part.
This work was funded by Bournemouth University, UK.
K. M. A. and P. J. R. conceptualised and designed the study; K. M. A., J. R. and P. J. R. contributed to the methodology; J. R., S. M. W. and K. M. A. conducted the research; K. M. A. undertook the analyses and wrote the initial draft of the paper; all authors reviewed and edited the initial drafts. All authors read and approved the final manuscript.
In connection with research on sweet taste, K. M. A. has received funding for research from Unilever R&D Vlaardingen, NL and ILSI-North America; has current funding from TopConsortium for Knowledge and Innovation (TKI) Agri&Food, NL (in collaboration with Arla Foods, DK, American Beverage Association, USA, Cargill, USA, Dutch Knowledge Centre for Sugar, NL, Firmenich, CH, International Sweeteners Association, BE, SinoSweet, China, Unilever, NL); and from the International Sweeteners Association and has received speaker’s expenses from the International Sweeteners Association, PepsiCo and ILSI-North America. P. J. R. has received funding for research from Sugar Nutrition UK; provided consultancy services for Coca-Cola Great Britain; received speaker’s fees from the International Sweeteners Association, the Global Stevia Research Institute, ILSI-Brasil, ILSI-Europe and ILSI-India and received honoraria from ILSI-Europe. J. R., S. M. W.: no conflicts of interest.
Supplementary material
For supplementary materials referred to in this article, please visit https://doi.org/10.1017/S000711452100235X