


1. Introduction
With climate change, the intensity and frequency of extreme meteorological events are expected to increase in coastal regions. In this context, our ability to predict the evolution of a beach's morphology during extreme events is bound to our understanding of the physical processes involved such as erosion, deposition and sand transport rate in the oscillating boundary layer generated by strong flow forcing.
To achieve this goal, a large number of experiments have been conducted in oscillating water tunnels (OWTs) consisting of a closed tunnel (without free surface) in which an oscillatory flow is generated by the movement of a piston. This methodology is used to study sheet flows in the oscillatory boundary layer, an idealisation of the wave bottom boundary layer. The sheet flow regime is characterised by sediment transported as a flat layer of thickness  $\delta _s$ of the order of 20–60 particle diameters above the bed under the action of wave-generated large bed shear stress (Ribberink & Al-Salem Reference Ribberink and Al-Salem1995; Dohmen-Janssen & Hanes Reference Dohmen-Janssen and Hanes2002; Dohmen-Janssen et al. Reference Dohmen-Janssen, Kroekenstoel, Hassan and Ribberink2002). Experiments in OWTs allow one to reproduce idealised coastal configurations in a controlled laboratory environment and offer the advantage of being easily reproduced numerically due to the absence of a free surface. However, contrary to real waves, the vertical components of the flow are suppressed due to the presence of the lid at the top of the tunnel. Even if some features such as greater sediment suspension or wave boundary layer streaming effects are missing in OWTs, the essential mechanisms involved in sheet flows, such as the effect of wave skewness and asymmetry and the phase-lag effect, are similar (Dohmen-Janssen & Hanes Reference Dohmen-Janssen and Hanes2002). Such idealised flow configurations are very useful for model validation and the investigation of fluid mechanics processes on unsteady boundary layer and transport (Jensen, Sumer & Fredsøe Reference Jensen, Sumer and Fredsøe1989; O'Donoghue & Wright Reference O'Donoghue and Wright2004).
Time-dependent concentration measurements in OWT experiments have provided insight into features of the sheet flow transport layer. Experiments involving medium sand of median diameter  $d_{50}=210\,\mathrm {\mu }{\rm m}$ under flow forcing typical of the near-shore environment with maximum free-stream velocity $U^f_{m}\sim 0.5\unicode{x2013}1.5\,{\rm m}\,{\rm s}^{-1}$ and wave period $T\sim 6\unicode{x2013}9\,{\rm s}$ from Ribberink & Al-Salem (Reference Ribberink and Al-Salem1995) and Dohmen-Janssen & Hanes (Reference Dohmen-Janssen and Hanes2002) showed that $\delta _s$ is well represented by the empirical relation proposed for steady sheet flow by Sumer et al. (Reference Sumer, Kozakiewicz, Fredsøe and Deigaard1996). The dimensionless erosion depth $\delta _e/d_p$, defined as the location where the flow velocity returns back to zero in the bed, made dimensionless by the particle diameter $d_p$ (assumed to be equal to $d_{50}$), increases linearly with the Shields parameter $\theta =u_\tau ^2/(s-1)gd_p$ representing the dimensionless bed shear stress, with $u_\tau$ the bottom friction velocity, $s=\rho ^f/\rho ^s$ the density ratio between the fluid and the particles and $g$ the acceleration of gravity (Ribberink et al. Reference Ribberink, van der Werf, O'Donoghue and Hassan2008). In other words, for the flow and particle parameters investigated in those experiments, the evolution of the sheet flow layer thickness during a wave period can be represented approximately as a succession of quasi-steady states. According to Dohmen-Janssen & Hanes (Reference Dohmen-Janssen and Hanes2002), for medium sand, the sediment bed response to changes of velocity is very rapid because the sheet flow layer is relatively thin close to the bed. O'Donoghue & Wright (Reference O'Donoghue and Wright2004) further confirmed this observation by showing that the time evolution of erosion depth for medium and coarse sands ( $d_{50}=280$ and $510\,\mathrm {\mu }{\rm m}$, respectively) is fully correlated with the instantaneous Shields parameter from their experiments involving similar wave conditions.
In more detail, Ribberink & Al-Salem (Reference Ribberink and Al-Salem1995) and Dohmen-Janssen & Hanes (Reference Dohmen-Janssen and Hanes2002) highlighted the existence of three layers in the sediment concentration profile. In the lower part of the sheet flow layer (pick-up layer), successive erosion and deposition phases occur during acceleration and deceleration phases of the wave, respectively. In the upper part of the sheet flow layer, concentration increases during acceleration phases and decreases during deceleration phases. Above the sheet flow layer, the suspension layer is characterised by dilute particles driven into suspension by the fluid-phase turbulence. Visually, this evolution of the concentration profile can be represented as a clockwise rotation of the concentration profile around an almost constant concentration ‘pivot’ during flow acceleration and an anticlockwise rotation during flow deceleration (O'Donoghue & Wright Reference O'Donoghue and Wright2004) (see figure 1). The erosion depth  $\delta _e$ and, symmetrically, the location of the top of the sheet flow layer defined as the position where sediment volume concentration equals $8\,\%$ increase and decrease during successive flow accelerations and decelerations.
Schematic representation of the concentration profile rotating clockwise during flow acceleration and anticlockwise during flow deceleration around the concentration pivot (drawn from O'Donoghue & Wright Reference O'Donoghue and Wright2004).

For more severe wave conditions or under asymmetric wave shapes in the surf zone, the effect of the horizontal pressure gradient (or flow acceleration) can become dominant at flow reversal resulting in a totally different sheet flow layer behaviour. Experimental studies from Zala-Flores & Sleath (Reference Zala-Flores and Sleath1998) and Sleath (Reference Sleath1999) revealed the existence of bed failure and formation of a plug flow under strong flow acceleration. For a horizontal pressure gradient greater than a certain threshold, the bed loses its yield strength and sediments move as a plug. As flow velocity increases, a shear layer develops to further erode the plug, and the sheet flow layer recovers the classical characteristics with a larger thickness. To characterise the flow acceleration, a dimensionless number called the Sleath parameter  $Sl=U^f_{m}\omega /(s-1)g$, with $\omega =2{\rm \pi} /T$ the wave angular frequency, has been introduced by Sleath (Reference Sleath1999). Based on a force balance, Sleath (Reference Sleath1999) found a critical value for plug formation to be $Sl>0.3$, but field measurements showed the occurrence of plug flow for values of Sleath parameter as low as $Sl=0.1\unicode{x2013}0.2$ (Foster et al. Reference Foster, Bowen, Holman and Natoo2006). In the configurations investigated in this paper, the Sleath parameter is of the order of $0.1$ meaning that plug flow is very unlikely to occur.
Another factor playing a major role in the behaviour of the sheet flow layer is the size of the particles. Empirical models to determine the erosion depth become less accurate for decreasing grain size (O'Donoghue & Wright Reference O'Donoghue and Wright2004). Dohmen-Janssen, Hassan & Ribberink (Reference Dohmen-Janssen, Hassan and Ribberink2001) showed that the erosion depth, sheet flow layer thickness and their ratio were greater for fine sand. This result is in contradiction to previous observations suggesting that the normalised erosion depth and sheet flow layer thickness by the grain diameter were only dependent on the Shields parameter. The particle diameter being in the denominator in the expression of the Shields parameter, the sheet flow layer thickness and the erosion depth only scale as the square of the bottom friction velocity and are independent of the particle diameter for a given flow condition. According to Dohmen-Janssen et al. (Reference Dohmen-Janssen, Hassan and Ribberink2001), the enhanced sheet flow layer thickness and erosion depth dependence on the grain size indicate that fine sand is transported in a different flow regime compared with medium and coarse sand.
Large particles that have been picked up from the bed during the acceleration phase of a wave have sufficient time to settle back to the bed during flow deceleration. However, smaller particles, having smaller settling velocity, may still be suspended at flow reversal. This phenomenon is further amplified by the fact that for a given wave condition, the thickness of the transport layer is observed to increase significantly for fine sand (Dohmen-Janssen et al. Reference Dohmen-Janssen, Hassan and Ribberink2001). In other words, smaller particles need to travel across a greater distance at a smaller settling velocity. The observed behaviour, generally called the phase-lag effect, has therefore been parameterised by the relations between the particle settling velocity  $v_s$ and the wave period $T$ (Dohmen-Janssen & Hanes Reference Dohmen-Janssen and Hanes2002).
The difference in behaviour between fine and medium/coarse sand for typical wave conditions in the near-shore environment is the result of the phase-lag effect and enhanced transport layer thickness defined more generally as unsteady effects generated by competition between the wave period and the time scale associated with particle settling. A more general description for wave-driven transport rate may also involve nonlinear wave shapes and boundary layer streaming.
The physical processes responsible for unsteady effects in the behaviour of the sheet flow layer remain poorly understood. To further characterise the physical processes associated with the effect of grain size, detailed high-resolution measurements of concentration, velocity and turbulent statistics are required. However, detailed measurements in the near bed are very difficult in laboratory experiments (Ribberink & Al-Salem Reference Ribberink and Al-Salem1995). To overcome this experimental limitation, the development of numerical models can significantly contribute to improving our physical understanding of the granular and turbulent processes involved in unsteady effects in oscillatory sheet flow.
Unfortunately, turbulence-averaged two-phase flow numerical models supposed to provide a deeper insight into the physical processes involved in oscillatory sheet flow show limited predictive capabilities when it comes to fine sand (Liu & Sato Reference Liu and Sato2006; Amoudry Reference Amoudry2014). Simulation results are extremely sensitive to the turbulence–particle interaction closure models and need to be fine-tuned for a wide range of flow and particle parameters (Kranenburg, Hsu & Ribberink Reference Kranenburg, Hsu and Ribberink2014). In this context, turbulence-resolving two-phase flow simulations appear to be the best option for investigating the physical origin of unsteady effects occurring in oscillatory sheet flow.
Given the large Reynolds numbers and large number of particles involved in oscillatory sheet flow, fully resolved direct numerical simulation methodology is currently computationally unfeasible. Although significant effort has been recently made to characterise some of the features of the oscillating boundary layer, such as initiation of transport (Mazzuoli et al. Reference Mazzuoli, Blondeaux, Vittori, Uhlmann, Simeonov and Calantoni2020), laminar rolling-grain ripple formation (Mazzuoli, Kidanemariam & Uhlmann Reference Mazzuoli, Kidanemariam and Uhlmann2019) or bed load transport (Vittori et al. Reference Vittori, Blondeaux, Mazzuoli, Simeonov and Calantoni2020), flow conditions are far less intense than the flow conditions targeted in oscillatory sheet flow. The most energetic flow conditions investigated using fully resolved direct numerical simulation corresponded to  $\theta$ of the order of 0.5, whereas typical values for the Shields number in configurations involving fine sand can reach $\theta =5$ (O'Donoghue & Wright Reference O'Donoghue and Wright2004).
Another methodology that could be considered is the Lagrangian point-particle methodology. Particles are considered punctual, the flow is not resolved at the particle scale and fluid–particle interactions are modelled. Compared with fully resolved direct numerical simulation, the point-particle methodology is less computationally expensive given the fact that requirements in term of flow resolution can be relaxed. Indeed, equations can be filtered to perform large-eddy simulation (LES) and still provide quantitative results as long as the effect of unresolved turbulent scales is accurately modelled (Balachandar Reference Balachandar2009; Finn & Li Reference Finn and Li2016). An oscillatory sheet flow configuration from O'Donoghue & Wright (Reference O'Donoghue and Wright2004) involving medium sand has been successfully reproduced by Finn, Li & Apte (Reference Finn, Li and Apte2016) using a point-particle model. Despite the effort made to reduce the number of particles to be tracked in the numerical domain, their simulations involved 3.8 million particles. Compared with the configuration simulated by Finn et al. (Reference Finn, Li and Apte2016), in configurations involving fine sand with similar wave conditions, the Shields number and  $\delta _s$ will become even greater. As a consequence, the number of transported particles would increase by several orders of magnitude making the computational cost of such simulations prohibitive.
Recently, two-fluid modelling methodology for LES was successfully applied to sediment transport configurations (Cheng, Hsu & Chauchat Reference Cheng, Hsu and Chauchat2018; Mathieu et al. Reference Mathieu, Chauchat, Bonamy, Balarac and Hsu2021). In the Eulerian two-fluid methodology, the dispersed phase composed of the particles and the carrier fluid phase are seen as two interpenetrating continua. Coupled mass and momentum equations are solved for both phases. The specific behaviour of sediment is reproduced using a closure model for the granular stresses. Compared with fully resolved direct numerical simulation and point-particle methodologies, there is no limitation in terms of the number of particles. Indeed, from an Eulerian point of view, only the volume concentration of sediment is resolved. Therefore, such modelling methodology represents a great opportunity to numerically investigate oscillatory sheet flow configurations involving fine sand to provide a new insight into the dominant physical processes responsible for unsteady effects.
In this paper, the two-fluid model is applied to oscillatory sheet flow configurations involving fine and medium sand under a sinusoidal flow forcing similar to OWT experiments reported by O'Donoghue & Wright (Reference O'Donoghue and Wright2004). The main objective is to study the mechanisms responsible for the observed vast difference between medium and fine sand in oscillatory sheet flow. We prove that the commonly recognised phase-lag effect is not only due to the small settling velocity of fine sand but is directly related to the enhanced transport layer thickness due to instabilities in the transitionally turbulent flow and turbulence attenuation by the presence of sediment.
In § 2, constitutive equations and closure models are presented. In § 3, a clear water (CW; i.e. without particles) configuration is reproduced using the two-fluid model to validate its implementation. In section § 4, oscillatory sheet flow simulations and investigation of unsteady effects are presented. A summary of the results and conclusions are presented in § 5.
2. Model formulation
2.1. Filtered two-phase flow equations
The turbulence-resolved two-phase flow model is the same as that used in Mathieu et al. (Reference Mathieu, Chauchat, Bonamy, Balarac and Hsu2021) but extended to tackle dense granular flows. It is adapted from the turbulence-averaged model sedFoam (https://github.com/sedFoam/sedFoam) (Chauchat et al. Reference Chauchat, Cheng, Nagel, Bonamy and Hsu2017; Cheng, Hsu & Calantoni Reference Cheng, Hsu and Calantoni2017) implemented in the open-source computational fluid dynamics toolbox OpenFoam (Jasak & Uroić Reference Jasak and Uroić2020) and can be downloaded on Zenodo (https://zenodo.org/record/5095239). In the Eulerian–Eulerian two-phase flow LES formalism, a given flow variable  $\psi (x_i, t)$, e.g. velocity or concentration, with $x_i=(x, y, z)^T$ the position vector and $i$ representing the three spatial components, can be decomposed into the sum $\psi (x_i, t) = \tilde \psi (x_i, t) + \psi {''}(x_i, t)$, with $\tilde \psi (x_i, t)$ the resolved Favre-filtered part and $\psi {''}(x_i, t)$ the unresolved subgrid part. The Favre-filtering operator is similar to the conventional filtering operator in LES but the filtered variable is weighted by its phase volume fraction. Favre-filtered fluid and solid velocities, $\tilde u^f_i = (\tilde u^f, \tilde v^f, \tilde w^f)^T$ and $\tilde u^s_i = (\tilde u^s, \tilde v^s, \tilde w^s)^T$, are defined as
 \begin{equation} \tilde u^f_i = \frac{\overline{(1-\phi)u^f_i}}{(1-\bar\phi)}, \quad \tilde u^s_i = \frac{\overline{\phi u^s_i}}{\bar\phi}, \end{equation}
with the operator  $\bar {\cdot }$ denoting the conventional filtering operator and $\phi$ the solid-phase volume concentration.
The filtered two-phase flow equations are composed of the filtered fluid- and solid-phase continuity (2.2) and (2.3) and the filtered fluid- and solid-phase momentum equations (2.4) and (2.5):
 \begin{gather} \frac{\partial (1-\bar\phi)}{\partial t} + \frac{\partial (1- \bar\phi)\tilde u_i^f}{\partial x_i} = 0, \end{gather}
 \begin{gather} \frac{\partial \bar\phi}{\partial t} + \frac{\partial\bar\phi\tilde u_i^s}{\partial x_i} = 0, \end{gather}
 \begin{gather} \dfrac{\partial\rho^f(1-\bar\phi)\tilde u^f_i}{\partial t} + \dfrac{\partial \rho^f(1-\bar\phi)\tilde u^f_i \tilde u^f_j}{\partial x_j} = \dfrac{\partial}{\partial x_j}\left(\tilde\varSigma_{ij}^f + \sigma^{f, sgs}_{ij}\right)\nonumber\\ - \bar M_i + \varPhi^{f,sgs}_i + (1-\bar \phi)(\rho^fg_i + f^v_i), \end{gather}
 \begin{gather} \dfrac{\partial\rho^s\bar\phi \tilde u_i^s}{\partial t} + \dfrac{\partial \rho^s\bar\phi \tilde u_i^s \tilde u_j^s}{\partial x_j} = \dfrac{\partial}{\partial x_j}\left(\tilde\varSigma_{ij}^s + \sigma^{s, sgs}_{ij}\right) + \bar M_i + \varPhi^{s,sgs}_i + \bar\phi(\rho^s g_i + f^v_i), \end{gather}
where  $\rho ^f$ and $\rho ^s$ are the fluid and solid densities, $\tilde \varSigma _{ij}^f$ and $\tilde \varSigma _{ij}^s$ are the fluid- and solid-phase effective stress tensors written in terms of Favre-filtered variables, respectively, $\sigma ^{f, sgs}_{ij}$ and $\sigma ^{s, sgs}_{ij}$ are the fluid and solid subgrid stress tensors, $\bar M_i$ is the filtered momentum exchange term between the two phases, $\varPhi ^{f,sgs}_i$ and $\varPhi ^{s,sgs}_i$ are other subgrid-scale contributions (see § 2.3.1), $g_i$ is the acceleration of gravity and $f^v_i$ is the volume force driving the flow. Indices ( $i,j,k=1,2,3$) appearing twice in a single term imply summation of that term over the three spatial components following Einstein's repeated index notation.
2.2. Closure models for the effective stress tensors
The effective fluid- and solid-phase stress tensors are decomposed into normal and shear stress, respectively, following  $\tilde \varSigma _{ij}^f = -\bar P^f\delta _{ij} + \tilde T_{ij}^f$ and $\tilde \varSigma _{ij}^s = -\bar P^s\delta _{ij} + \tilde T_{ij}^s$, with $\bar P^f$ and $\bar P^s$ the filtered fluid and solid pressures, $\delta _{ij}$ the Kronecker symbol and $\tilde T_{ij}^f$ and $\tilde T_{ij}^s$ the fluid and solid shear stress tensors expressed in terms of Favre-filtered variables defined by
 \begin{gather} \tilde T^f_{ij}=\rho^f(1-\bar\phi)\nu^f\left(\dfrac{\partial \tilde u_i^f}{\partial x_j} + \dfrac{\partial \tilde u_j^f}{\partial x_i} - \dfrac{2}{3}\dfrac{\partial \tilde u_k^f}{\partial x_k}\delta_{ij}\right), \end{gather}
 \begin{gather} \tilde T^s_{ij}=\rho^s\bar\phi\nu^s\left(\dfrac{\partial \tilde u_i^s}{\partial x_j} + \dfrac{\partial \tilde u_j^s}{\partial x_i} - \dfrac{2}{3}\dfrac{\partial \tilde u_k^s}{\partial x_k}\delta_{ij}\right), \end{gather}
with  $\nu ^f$ and $\nu ^s$ the fluid and solid viscosities, respectively.
The fluid is considered Newtonian with a constant viscosity but the solid-phase pressure and viscosity taking into account frictional, collisional and kinetic effects in the granular flow are modelled using the novel kinetic theory of granular flows proposed by Chassagne, Chauchat & Bonamy (Reference Chassagne, Chauchat and Bonamy2021).
In the kinetic theory of granular flows, an analogy is made between the behaviour of a granular flow for moderate to low volume fraction and the behaviour of molecules in a gas. It is extended to tackle high volume fraction for which friction between the particles is dominant by the inclusion a frictional model. The solid-phase pressure  $\bar P^s$ and shear stress tensor $\tilde T^s_{ij}$ are given by $\bar P^s= \bar P^c + \bar P^{fr}$ and $\nu ^s=\nu ^c+\nu ^{fr}$, with $\bar P^c$ and $\nu ^c$ the granular pressure and viscosity due to collisions and kinetic effects and $\bar P^{fr}$ and $\nu ^{fr}$ the granular pressure and viscosity due to friction between the particles. The frictional granular pressure is modelled following Johnson & Jackson (Reference Johnson and Jackson1987):
 \begin{equation} \bar P^{fr} = \left\{ \begin{array}{ll} 0, & \text{for } \bar \phi<\phi^{fr},\\ 0.05\dfrac{\left(\bar \phi-\phi^{fr}\right)^{3}}{\left(\phi^{m}-\bar\phi\right)^{5}}, & \text{for } \bar\phi>\phi^{fr}, \end{array} \right. \end{equation}
where  $\phi ^{fr}=0.57$ is the minimum volume fraction for which friction occurs and $\phi ^{m}=0.635$ the maximum volume fraction. To define the frictional viscosity, shear and normal stresses are related to the friction angle $\theta ^{fr}$ ( $32^\circ$ for sand particles) following Schaeffer (Reference Schaeffer1987):
 \begin{equation} \nu^{fr}=\dfrac{\bar P^{fr}\sin(\theta^{fr})}{\rho^s\sqrt{\Vert {\tilde{\boldsymbol S}}^s\Vert^2 + S_{small}^2}}, \end{equation}
with  ${\tilde {\boldsymbol S}}^s$ the resolved solid-phase strain rate tensor and $S_{small}=1\times 10^{-4}\,{\rm s}^{-1}$ a regularisation parameter.
The filtered granular pressure  $\bar P^c$ and viscosity $\nu ^c$ induced by collisions and kinetic effects are given by
 \begin{equation} \bar P^c = \rho^s\bar \phi\left[1 + 2(1+e)\bar\phi g_{0}\right]\bar\varTheta - \rho^s\lambda\dfrac{\partial\tilde u^s_k}{\partial x_k} \end{equation}
and
 \begin{equation} \nu^c = d_p\dfrac{5\sqrt{\rm \pi}}{96}(\nu^*_k+\nu^*_c+\nu^*_b)\sqrt{\bar\varTheta}, \end{equation}
with  $\lambda$, $\nu ^*_k$, $\nu ^*_c$ and $\nu ^*_b$ the compressible, kinetic, collisional and bulk viscosity contributions following
 \begin{gather} \lambda = \frac{4}{3}\bar\phi^2\rho^sd_pg_{s0}(1+e)\sqrt{\frac{\bar\varTheta}{\rm \pi}}, \end{gather}
 \begin{gather} \nu^*_k = \dfrac{48/(5\sqrt{\rm \pi})\bar\phi-2/5(1+e)(1-3e)\bar\phi g_0}{(1-1/4(1-e)^2-5/24(1-e^2))g_0}, \end{gather}
 \begin{gather} \nu^*_c = \dfrac{4}{5}(1-e)\bar\phi g_0\nu^*_k, \end{gather}
 \begin{gather} \nu^*_b = \dfrac{384}{25{\rm \pi}}(1-e)\bar\phi^2g_0, \end{gather}
where  $e$ is the restitution coefficient for binary collisions (0.8 for sand particles), $\bar \varTheta$ is the filtered granular temperature representing the pseudo-thermal kinetic energy associated with the uncorrelated random motions of the particles and
 \begin{equation} g_{0} = \dfrac{2-\bar\phi}{2(1-\bar\phi)^3} + \dfrac{2.71\bar\phi^2}{(\phi^{b}-\bar\phi)^{3/2}} \end{equation}
is the radial distribution function adapted for sand particles. Compared with the definition proposed by Chassagne et al. (Reference Chassagne, Chauchat and Bonamy2021), the radial distribution function does not diverge for  $\bar \phi =\phi ^m$ but for a smaller value $\bar \phi =\phi ^b=0.612$, with $\phi ^b$ the effective maximum concentration in the bed. The fact that a radial distribution function diverging for a slightly smaller value of the volume fraction provides better results can be explained by the increased frictional contact for real sediment compared with the smooth spherical spheres used in the discrete element method simulations of Chassagne et al. (Reference Chassagne, Chauchat and Bonamy2021).
The filtered granular temperature  $\bar \varTheta$ is obtained by solving the following transport equation:
 \begin{equation} \frac{3}{2}\left[\frac{\partial\bar\phi\rho^s\bar\varTheta}{\partial t} + \frac{\partial\bar\phi\rho^s \tilde u^s_i\bar\varTheta}{\partial x_j}\right] = \varPi_R + \varPi_q + J_{int} - \gamma. \end{equation}
Here  $\varPi _R$ is the production of granular temperature given by
 \begin{equation} \varPi_R = \left(- \bar P^c\delta_{ij} + \rho^s\bar\phi\nu^c\tilde S^s_{ij}\right)\frac{\partial \tilde u^s_i}{\partial x_j}, \end{equation}
and  $\varPi _q$ is the divergence of the granular temperature flux analogous to Fourier's law of conduction, given by
 \begin{equation} \varPi_q = \dfrac{\partial}{\partial x_i}\left[-\kappa\frac{\partial\bar\varTheta}{\partial x_i}\right], \end{equation}
where  $\kappa$ is the conductivity of the granular temperature calculated following
 \begin{equation} \kappa = \rho^sd_p\dfrac{225\sqrt{\rm \pi}}{1152}(\kappa^*_k + \kappa^*_c + \kappa^*_b)\sqrt{\bar\varTheta}, \end{equation}
with  $\kappa ^*_k$, $\kappa ^*_c$ and $\kappa ^*_b$ the kinetic, collisional and bulk conductivity contributions given by
 \begin{gather} \kappa^*_k=\dfrac{2[576/(225\sqrt{\rm \pi})\bar\phi+3/5(1+e)^2(2e-1)\bar\phi g_0]}{(1-7/16(1-e))(1+e)g_0}, \end{gather}
 \begin{gather} \kappa^*_c=\dfrac{6}{5}(1+e)\bar\phi g_0\kappa^*_k \end{gather}
and
 \begin{equation} \kappa^*_b=\dfrac{2304}{225{\rm \pi}}(1+e)\bar\phi^2 g_0. \end{equation}
Parameter  $\gamma$ is the dissipation rate of granular temperature given by
 \begin{equation} \gamma = 3(1-e_{eff}^2)\bar\phi^2\rho^sg_{s0}\bar\varTheta\left[\frac{4}{d_p}\sqrt{\frac{\bar\varTheta}{\rm \pi}}-\frac{\partial \tilde u^s_j}{\partial x_j}\right], \end{equation}
with  $e_{eff}=e-3/2\mu ^p\exp (-3\mu ^p)$ the effective restitution coefficient for dissipation taking into account the effect of friction through the friction coefficient $\mu ^p$ (0.4 for sand particles).
Finally,  $J_{int}$ is the fluid–particle interaction term representing the balance between dissipation of granular temperature due to drag and production due to the fluid pseudo-thermal kinetic energy $\bar \varTheta ^f$ and is given by
 \begin{equation} J_{int} = 3\frac{\rho^s\bar\phi}{\tilde t_s}(\bar\varTheta^f - \bar\varTheta), \end{equation}
with  $\tilde t_s$ the response time of the particle defined in § 2.3 and $\bar \varTheta ^f=2(k^{f}_{sgs})/3$ with $k^{f}_{sgs}$ the fluid-phase subgrid turbulent kinetic energy (TKE) modelled using the relation proposed by Yoshizawa & Horiuti (Reference Yoshizawa and Horiuti1985) (more details are available in the model description of Mathieu et al. (Reference Mathieu, Chauchat, Bonamy, Balarac and Hsu2021)).
2.3. Closure models for the momentum exchange term
The filtered momentum exchange term  $\bar M_i$ between the two phases is composed of buoyancy and drag forces $B_i$ and $D_i$, respectively:
 \begin{equation} \bar M_i = \bar B_i + \bar D_i \quad \text{with } \left\{ \begin{array}{@{}l} \bar B_i ={-}\bar\phi\dfrac{\partial \bar P^f}{\partial x_i}, \\ \bar D_i = \dfrac{\rho^s\bar\phi}{\tilde t_s}\left(\tilde u^f_i - \tilde u^s_i\right), \end{array} \right. \end{equation}
where  $\tilde t_s$ is the particle response time following the drag law proposed by Ding & Gidaspow (Reference Ding and Gidaspow1990) gathering the Darcy law for high concentrations ( $\bar \phi >0.2$) and the modified drag law from Schiller & Naumann (Reference Schiller and Naumann1933) for an isolated sphere to take into account hindered settling induced by neighbouring particles following
 \begin{equation} \tilde t_s = \left\{ \begin{array}{@{}ll} \rho^s\left(\dfrac{150\bar\phi\nu^f\rho^f}{(1-\bar\phi)d_p^2}+\dfrac{1.75\rho^f\Vert \tilde u^f_i - \tilde u^s_i\Vert}{d_p}\right)^{{-}1}, & \bar\phi>0.2,\\ \dfrac{4}{3}\dfrac{\rho^s}{\rho^f}\dfrac{d_p}{C_D\Vert \tilde u^f_i - \tilde u^s_i\Vert}(1-\bar\phi)^{1.65}, & \bar\phi<0.2, \end{array} \right. \end{equation}
with  $C_D$ the drag coefficient given by
 \begin{equation} C_D = \dfrac{24}{{\textit{Re}}_p}\left(1+0.15{\textit{Re}}_p^{0.687}\right) \end{equation}
and the particle Reynolds number  $ {\textit {Re}}_p$ expressed as
 \begin{equation} {\textit{Re}}_p= \dfrac{(1-\phi)d_p\Vert \tilde u^f_i - \tilde u^s_i\Vert}{\nu^f}. \end{equation}
Phase-average contributions of the added mass and lift force are also available in the two-fluid formalism but were shown to have a negligible effect for similar flow and particle parameters presented in Mathieu et al. (Reference Mathieu, Chauchat, Bonamy, Balarac and Hsu2021). Sensitivity analysis of the momentum coupling between the two phases revealed that drag is the dominant interaction force for the configurations investigated in this paper.
2.3.1. Subgrid-scale modelling
Similarly to the numerical model presented in Mathieu et al. (Reference Mathieu, Chauchat, Bonamy, Balarac and Hsu2021), fluid- and solid-phase subgrid stress tensors resulting from the filtering of nonlinear advection terms  $\sigma ^{f,sgs}_{ij}=\rho ^f(1-\bar \phi )(\widetilde {u^f_iu^f_j} - \tilde u^f_i \tilde u^f_j)$ and $\sigma ^{s,sgs}_{ij}=\rho ^s\bar \phi (\widetilde {u^s_iu^s_j} - \tilde u^s_i \tilde u^s_j)$ are modelled using the dynamic Lagrangian procedure proposed by Meneveau, Lund & Cabot (Reference Meneveau, Lund and Cabot1996). The subgrid stress tensors are written as
 \begin{equation} \sigma^{f,sgs}_{ij} = 2\rho^f(1-\bar\phi)\varDelta^2 \vert \tilde{\boldsymbol S}^f \vert \left(C_1^f\tilde S_{ij}^f - \frac{1}{3}C_2^f\tilde S_{kk}^f\delta_{ij}\right) \end{equation}
and
 \begin{equation} \sigma^{s,sgs}_{ij} = 2\rho^s\overline\phi\varDelta^2 \vert \tilde{\boldsymbol S}^s \vert\left(C_1^s\tilde S_{ij}^s - \frac{1}{3}C_2^s \tilde S_{kk}^s\delta_{ij}\right), \end{equation}
with  $\varDelta$ the filter size imposed by the mesh, $\tilde S^f_{ij}$ and $\tilde S^s_{ij}$ the fluid and solid resolved strain rate tensors, respectively, and $C_1^f$, $C_2^f$, $C_1^s$, $C_2^s$ the dynamically computed model coefficients averaged over streamlines (more details of the dynamic Lagrangian model are provided in appendix A of Mathieu et al. (Reference Mathieu, Chauchat, Bonamy, Balarac and Hsu2021)).
The other subgrid contributions resulting from the filtering of the pressure, stress and momentum exchange terms represented by  $\varPhi ^{f,sgs}_i$ and $\varPhi ^{s,sgs}_i$ take into account the effect of unresolved particle clusters and streamers having length scales of the order of 10–100 particle diameters (Agrawal et al. Reference Agrawal, Loezos, Syamlal and Sundaresan2001). Similarly to Mathieu et al. (Reference Mathieu, Chauchat, Bonamy, Balarac and Hsu2021), the filter width $\varDelta$ in the present simulations is always of the order of the particle diameter, and therefore $\varPhi ^{f,sgs}_i$ and $\varPhi ^{s,sgs}_i$ can be neglected (Ozel, Fede & Simonin Reference Ozel, Fede and Simonin2013).
3. Clear water oscillatory boundary layer
In order to validate the two-fluid model and its implementation for turbulence-resolving simulations, a CW (i.e. without particles) configuration of an oscillating boundary layer similar to the OWT experiment of Jensen et al. (Reference Jensen, Sumer and Fredsøe1989) is reproduced using the present model. The volume fraction in the domain is set to  $\bar \phi = 0$ so that the two-fluid model behaves as a single-phase model.
The CW configuration investigated herein corresponds to test number 8 of Jensen et al. (Reference Jensen, Sumer and Fredsøe1989) with a sinusoidal free-stream velocity of period  $T=9.72\,{\rm s}$, a smooth bottom boundary and a Reynolds number $ {\textit {Re}}=aU^f_{m}/\nu ^f=1.6\times 10^{6}$ based on the maximum free-stream velocity $U^f_{m}=1.02\,{\rm m}\,{\rm s}^{-1}$, the fluid viscosity $\nu ^f=1\times 10^{-6}\,{\rm m}^2\,{\rm s}^{-1}$ and the orbital excursion length $a=U^f_{m}/\omega =1.58\,{\rm m}$ representing the distance travelled by a free-stream fluid parcel during a wave period. The Reynolds number based on the thickness of the laminar boundary layer given by the Stokes theory and called the Stokes-layer thickness $\delta =\sqrt {2\nu ^f/\omega }=1.76\times 10^{-3}\,{\rm m}$ is $ {\textit {Re}}_\delta =U^f_{m}\delta /\nu ^f=1790$ and the maximum friction velocity is $u^m_\tau =0.047\,{\rm m}\,{\rm s}^{-1}$. The hydrodynamic parameters are presented in table 1 and are close to the parameters used for the particle-laden configurations investigated hereafter.
Flow and particle parameters of CW configuration from Jensen et al. (Reference Jensen, Sumer and Fredsøe1989) and the sheet flow configurations from O'Donoghue & Wright (Reference O'Donoghue and Wright2004) involving medium sand (M512) and fine sand (F512).

3.1. Numerical configuration
The numerical domain is a box of dimensions  $80\delta \times 50\delta \times 40\delta$ in $x$,
$x$,  $y$ and $z$ directions. A symmetry boundary condition is applied at the top boundary, a smooth-wall boundary condition is applied at the bottom boundary and cyclic boundary conditions are applied for the lateral boundaries. Mesh dimensions and boundary conditions are presented in figure 2. Second-order-accuracy centred schemes with high-frequency filtering are used for advection terms, a backward scheme is used for temporal integration and gradients are calculated using a second-order centred scheme.
Sketch of the geometry and boundary conditions of the numerical domain for the simulation of the CW configuration from Jensen et al. (Reference Jensen, Sumer and Fredsøe1989).

The mesh is decomposed into  $60\times 60\times 55$ elements for a total of $198\,000$ cells with a non-uniform grid size distribution along the $y$ axis. Cell size expands from the bottom wall towards the top boundary with an expansion ratio of 1.0135 giving a size ratio between the smallest and largest cells equal to $5.8446$. The dimensionless grid spacing based on the maximum friction velocity is $\Delta x^+=\Delta x u^m_\tau /\nu ^f=110$, $\Delta z^+=60$ and dimensionless cell size at the wall is $\Delta y^+_{wall} = 25$. Typical mesh resolution to resolve the laminar sublayer imposes a mesh requirement of $\Delta y^+_{wall}<4$. The mesh resolution in the CW configuration therefore appears to be coarse compared with typical wall-resolved LES in the literature (Salon, Armenio & Crise Reference Salon, Armenio and Crise2007). The numerical resolution could be further refined for single-phase CW configuration. However, for the particle-laden flow configurations investigated in the next section, the constraint that prevents us from using very high numerical resolution is related to the hypothesis made to derive the two-fluid model. Ideally, the grid size should be of the order of the particle diameter and therefore limiting the maximum resolution. To comply with the constraint set by the two-fluid methodology, our objective is to show that accurate second-order turbulent statistics relevant to sediment transport can be predicted using a mesh size similar to the particle size. This constraint and its limitation are further discussed in § 3.3.
The time step is calculated to ensure a Courant–Friedrichs–Lewy value below 0.3. The volume force driving the flow in the  $x$ direction is given by
 \begin{equation} f^v_i={-}\rho^f\dfrac{\partial u^f_\infty}{\partial t}=\left(-\rho^fU_{m}^f\omega \cos(\omega t), 0, 0\right), \end{equation}
with  $u^f_\infty =U^f_{m}\sin (\omega t)$ the free-stream velocity.
In a given simulation, four periods are simulated to let the oscillating boundary layer develop into a statistically steady state in terms of phase-averaged variables and the simulation is continued for another four wave periods to provide more realisations to calculate turbulence statistics. A double average procedure (operator  $\langle \cdot \rangle$ with corresponding fluctuation $\cdot '$) is performed to increase statistical convergence. Indeed, the quantity of interest at a given moment of the wave period is averaged over the last four periods (phase-averaging), and then a spatial average is performed over the homogeneous directions of the flow ( $x$ and $z$ directions) to obtain intra-wave one-dimensional vertical profiles.
In the next sections, given that the wave forcing is symmetric, intra-wave profiles are presented only for the first half of the wave period (between  $0^\circ$ and $180^\circ$). For a given configuration, the figures are composed of six panels showing profiles at $0^\circ$, $30^\circ$, $60^\circ$, $90^\circ$, $120^\circ$ and $150^\circ$ (see figure 3).
Time series of the free-stream velocity with indications on the wave phases for which intra-wave profiles are shown in this paper.

3.2. Results
The time evolution of the bottom friction velocity predicted by the two-phase flow model with resolution  $60 \times 60 \times 55$ is compared with experimental data and numerical simulation with resolution $120 \times 240 \times 110$ having $\Delta y^+_{wall}=1$ comparable to the numerical configuration from Salon et al. (Reference Salon, Armenio and Crise2007) in figure 4. The agreement is very good between experiments and simulations. It can also be noticed that the transition to turbulence occurring at around $20^\circ$ and $200^\circ$ characterised by a sharp increase of the bottom shear stress compared with the laminar solution is accurately reproduced by the numerical model.
Phase-averaged friction velocity normalised by the measured maximum friction velocity predicted by the two-phase flow model ( $60 \times 60 \times 55$) compared with numerical results with a finer mesh ( $120 \times 240 \times 110$), experimental results of the CW configuration from Jensen et al. (Reference Jensen, Sumer and Fredsøe1989) (Exp.) and analytical solution for the laminar flow.

Increasing the resolution provides similar results in terms of predicting the time evolution and maximum bed shear stress. The transition between laminar and turbulent flow is slightly improved using a finer mesh.
Velocity and shear stress profiles predicted by the two-phase flow model for the two resolutions compared with experimental data from Jensen et al. (Reference Jensen, Sumer and Fredsøe1989) and turbulent viscosity profiles compared with numerical data from Salon et al. (Reference Salon, Armenio and Crise2007) at different moments of the wave period are presented in figure 5. Overall, the agreement between the two-phase flow model and the experimental data is qualitatively good.
Phase-averaged velocity as a fraction of the maximum velocity (a–f), phase-averaged Reynolds stress as a fraction of the maximum velocity squared (g–l) predicted by the two-phase flow model ( $60 \times 60 \times 55$) compared with numerical results with a finer mesh ( $120 \times 240 \times 110$), experimental results of the CW configuration from Jensen et al. (Reference Jensen, Sumer and Fredsøe1989) (Exp.) and turbulent viscosity as a fraction of the fluid viscosity (m–r) compared with numerical results from Salon et al. (Reference Salon, Armenio and Crise2007).

There are some minor differences between predictions of the velocity profiles for the fine and coarse resolution but, most importantly, the shear stress and turbulent viscosity profiles, which control sediment transport and vertical mixing of particles, respectively, are very similar between fine and coarse resolution results and they are both very close to experimental data or the simulation data of Salon et al. (Reference Salon, Armenio and Crise2007).
3.3. Discussion
According to the earlier direct numerical simulation work of Adrian, Meinhart & Tomkins (Reference Adrian, Meinhart and Tomkins2000), small turbulent coherent structures (hairpin vortices) are generated very near the wall and migrate upward to form larger structures. However, this bottom-up model was later challenged by the direct numerical simulation work of Jiménez (Reference Jiménez2018) with a top-down model that most of the turbulent coherent structures are generated in the logarithmic layer and migrate downward. More recently, the fully resolved particle-laden studies reported by Scherer et al. (Reference Scherer, Uhlmann, Kidanemariam and Krayer2022) further confirm that for both smooth wall or rough/mobile sediment bed, most of the large turbulent coherent structures are generated in the logarithmic layer and hence provide strong evidence supporting the top-down model. Therefore, the fact that we obtain similar first- and second-order turbulence statistics in coarse ( $\Delta y^+_{wall}=25$) and fine ( $\Delta y^+_{wall}=1$) resolutions can be explained by the more recent understanding of the generation of turbulent coherent structure reported by Jiménez (Reference Jiménez2018) and Scherer et al. (Reference Scherer, Uhlmann, Kidanemariam and Krayer2022).
Mathieu et al. (Reference Mathieu, Chauchat, Bonamy, Balarac and Hsu2021) showed that the limitation on the grid size can be relaxed using a finite-sized treatment for dilute particle-laden flow. Accurate predictions of the vertical distribution of particles can be obtained with the two-fluid methodology having a grid size smaller than the particle diameter by filtering the fluid velocity field at the scale of the particle and differentiating the contributions of turbulent flow scales smaller or larger than the particle diameter in the momentum exchange term between the two phases. Without correction for the finite-size effect, the particle suspension was greatly underestimated and this discrepancy is more pronounced for increasing numerical resolution. However, this model has only been validated for dilute unidirectional boundary layer flow and future work is needed to extend the finite-size effect for high sediment concentration.
Determining the best resolution for oscillatory sheet flow configurations therefore becomes a choice between a more accurate representation of the turbulence (grid size smaller than the particle diameter) and a more accurate representation of fluid–particle interactions (grid size of the order of the particle diameter). Considering that an already good agreement between second-order turbulent statistics is obtained with a grid size that complies with the hypothesis made to derive the two-fluid methodology, the grid size is chosen to be of the order of the particle diameter.
Furthermore, for oscillatory flows, the dimensionless wall variables ( $\Delta x^+$, $\Delta y^+$ and $\Delta z^+$) are calculated based on the maximum friction velocity in a wave cycle. Therefore, values presented correspond to peak flow quantities and are, in fact, smaller in the remainder of the wave period. The already good prediction from the coarse mesh resolution should give us confidence in performing simulations of particle-laden configurations for which the constraint on the vertical resolution can be further relaxed. In fact, a main reason that in the present study a near-bed resolution of $y^+=25$ without any wall model is sufficient is due to the effective roughness introduced by the particle motions and hence the strict resolution requirement is not necessary for particle-laden configurations presented in the next section.
4. Oscillatory sheet flow
In this section, two-phase flow simulations of sand transport under symmetric waves are presented. The experimental configurations from O'Donoghue & Wright (Reference O'Donoghue and Wright2004) involving sinusoidal waves are reproduced numerically. Two types of sand are used: medium sand of diameter  $d_{50}=280\,\mathrm {\mu }{\rm m}$ (configuration M512) and fine sand of diameter $d_{50}=150\,\mathrm {\mu }{\rm m}$ (configuration F512) with density $\rho ^s=2650\,{\rm kg}\,{\rm m}^{-3}$. Particles are considered spherical and monodispersed with $d_p=d_{50}$. This assumption is valid considering that well-sorted sand is used in the experiments ( $d_{10}=170\,\mathrm {\mu }{\rm m}$ and $d_{90}=450\,\mathrm {\mu }{\rm m}$ for configuration M512 and $d_{10}=100\,\mathrm {\mu }{\rm m}$ and $d_{90}=230\,\mathrm {\mu }{\rm m}$ for configuration F512). For both configurations the flow conditions are the same with a wave period $T=5s$ and a maximum free-stream velocity $U_{m}^f=1.5\,{\rm m}\,{\rm s}^{-1}$. For this wave condition, the Stokes-layer thickness is $\delta =1.26\times 10^{-3}\,{\rm m}$ and the maximum excursion length is $a=1.19\,{\rm m}$, giving Reynolds number based on these quantities of $ {\textit {Re}}=1.8\times 10^{6}$ and $ {\textit {Re}}_\delta =1890$, respectively. Following the methodology used in O'Donoghue & Wright (Reference O'Donoghue and Wright2004), the friction velocity is calculated using the formula from Wilson, Andersen & Shaw (Reference Wilson, Andersen and Shaw1995), giving $u^m_\tau =0.112\,{\rm m}\,{\rm s}^{-1}$. This friction velocity corresponds to a maximum Shields number $\theta _m = 2.75$ for medium sand and $\theta _m = 5.16$ for fine sand. The maximum particle Reynolds number estimated from the methodology proposed by Finn & Li (Reference Finn and Li2016) is $ {\textit {Re}}_p=98$ for medium sand and $ {\textit {Re}}_p=36$ for fine sand. For both configurations, the Sleath parameter is $Sl=0.116$ and the occurrence of plug flow is unlikely. The flow and particle parameters are summarised in table 1.
4.1. Numerical configuration
For the sheet flow configuration, the numerical domain is a box of dimensions  $160\delta \times 100\delta \times 40\delta$. Compared with the CW configuration presented in § 3, the domain is two times larger in the $x$ direction to capture bed instabilities, which are susceptible to having length scales larger than 40 $\delta$. Mesh dimensions and boundary conditions are presented in figure 6. A symmetry boundary condition is applied at the top boundary, a wall boundary condition is applied at the bottom and cyclic boundary conditions are applied for the boundaries coincident with planes orthogonal to the $x$ axis and $z$ axis. The same numerical schemes as for the CW configuration are used.
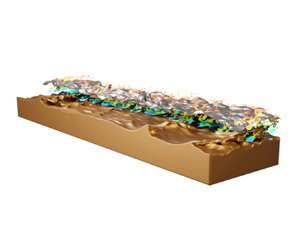
Sketch of the geometry and boundary conditions of the numerical domain for the simulation of the sheet flow configuration from O'Donoghue & Wright (Reference O'Donoghue and Wright2004).

The mesh is decomposed into  $200\times 260\times 92$ elements for a total of $4\,784\,000$ cells. The dimensionless grid spacing in the $x$ direction and $z$ direction is $\Delta x^+=110$ and $\Delta z^+=60$. The mesh is decomposed into three different regions in the vertical direction. Taking $h_s$ as the height of the deposited sediment bed initialised by a power law, from the bottom to $y=h_s-24\delta$, the region is decomposed into 20 cells using a non-uniform length distribution to have smaller cells with $\Delta y^+=25$ towards the top of the deposited sediment. The mesh region from $y=h_s-24\delta$ to $y=h_s-8\delta$ is decomposed into 132 cells of constant grid spacing $\Delta y^+=25$, and finally the mesh region from $y=h_s+8\delta$ to the top boundary is decomposed into 108 elements with a non-uniform grid spacing and smallest cells having a length of $\Delta y^+=25$. Compared with the smooth-wall CW configuration presented in § 3, velocity gradients in the bottom boundary layer are expected to be smaller in the oscillatory sheet flow configurations due to rough and mobile bed effects. The mesh resolution should therefore be sufficient to reproduce the boundary layer hydrodynamics considering that accurate prediction of the velocity and Reynolds stress profiles is obtained for similar grid resolution in the CW configuration from § 3. The mesh resolution in the near-bed region corresponds to grid sizes $\Delta x \approx 3.5d_p$, $\Delta z \approx 1.9d_p$ and $\Delta y\approx 0.8d_p$ for configuration M512 and $\Delta x \approx 6.5d_p$, $\Delta z \approx 3.5d_p$ and $\Delta y\approx 1.5d_p$ for configuration F512 ensuring the condition $\varDelta \sim O(d_p)$.
The pressure gradient driving the flow is given by (3.1) and the same averaging procedure is performed as in § 3.
4.2. Results
In this section, the results composed of intra-wave data for the sediment concentration and velocities are presented. The main objective is to shed light on the difference in physical behaviour between medium and fine sand for a given wave condition before exposing the underlying processes in the next section.
4.2.1. Time evolution of the solid-phase concentration
Phase-averaged concentration profiles are represented at different moments of the wave period in figures 7 for configurations M512 and F512. As for the results presented in § 3, profiles are shown only for the first half of the wave period because of the wave symmetry.
Phase-averaged concentration profiles from configurations M512 (a–f) and F512 (g–l) predicted by the two-phase flow model (LES) compared with experimental data from O'Donoghue & Wright (Reference O'Donoghue and Wright2004) (Exp.).

As a consequence of the experimental uncertainty in determining the zero bed level, experimental concentration profiles might need to be shifted to align measured and numerically modelled maximum erosion depths. For configuration M512, concentration profiles do not need to be shifted. For configuration F512, concentration profiles are shifted downward by a distance of  $1.5\delta$. Once the shift is determined, it is never changed for the rest of the comparison for that specific case.
For both configurations, the agreement with experimental data is very good throughout the wave period. The only discrepancy that can be observed for the simulation of configuration M512 is at  $150^\circ$ where the sediment concentration is overestimated in the lower part (pick-up layer) and underestimated in the upper part (suspension layer) of the concentration profile. This feature suggests that the sediments settle too quickly to the bed during flow deceleration compared with the experimental observations.
For the flow and particle parameters investigated, particles are expected to be of finite size around the flow peak. It has been shown in Mathieu et al. (Reference Mathieu, Chauchat, Bonamy, Balarac and Hsu2021) that finite-size effects affect the vertical distribution of sediment by increasing the particle response time and therefore decreasing the settling velocity of finite-size particles. Not including finite-size effects in the momentum coupling between the fluid and solid phase results in an underestimation of the suspension of particles. Considering that a good agreement in the prediction of the vertical mixing of particles is obtained for fine sand, finite-size effects appear to be negligible. For medium sand, particles are larger and finite-size effects are more important, thus explaining the observed discrepancies between numerical and experimental results. Unfortunately, the only finite-size correction model available for the two-fluid model of Mathieu et al. (Reference Mathieu, Chauchat, Bonamy, Balarac and Hsu2021) has only been validated for dilute unidirectional boundary layer flow and shows poor performance when it comes to oscillatory flows.
For configuration M512, the evolution of the concentration profile across the wave period follows the well-documented description reported by O'Donoghue & Wright (Reference O'Donoghue and Wright2004). A clockwise rotation of the concentration profile around an almost constant concentration ‘pivot’ is observed during flow acceleration resulting in a decrease in concentration in the pick-up layer and an increase in the suspension layer. During flow deceleration, an anticlockwise rotation results in an increase of the concentration of the pick-up layer and a decrease in the suspension layer as sediments settle back to the bed (see figure 1).
However, for configuration F512, the behaviour of the sediment concentration profile shape is very different. Around flow peak ( $60^\circ$, $90^\circ$ and $120^\circ$), the concentration profile shows a shape of two linear lines with a change of slope at around $\langle \bar \phi \rangle =0.3$ to $0.4$. During flow deceleration, the slope of the upper part of the concentration profile becomes steeper and the formation of a concentration plateau can start to be observed at late stage of deceleration ( $150^\circ$). At flow reversal ( $0^\circ$), the plateau of concentration is evident at $y/\delta =3$ with a nearly uniform depth concentration at $\langle \bar \phi \rangle =0.3$ between $y/\delta =-3$ and 3. The plateau is subsequently eroded during flow acceleration ( $30^\circ$ and $60^\circ$). Although both cases are driven by the same oscillatory flow, we can notice at least qualitatively a significantly larger transport layer thickness of a peak value of $15\delta$ for the fine-sand configuration (F512), which is approximately two times larger than that of the medium-sand configuration (M512). The significantly larger transport layer thickness and small settling velocity of fine sand both contribute to its unique features observed here and which we investigate in more detail in the remainder of this paper.
4.2.2. Velocity profiles
The profiles of Favre phase-averaged velocities  $\langle \tilde u^f_i\rangle _F=\langle (1-\bar \phi )\tilde u^f_i\rangle /(1-\langle \bar \phi \rangle )$ and $\langle \tilde u^s_i\rangle _F=\langle \bar \phi \tilde u^s_i\rangle /\langle \bar \phi \rangle$ from configurations M512 and F512 are presented in figure 8.
Favre-averaged fluid and solid velocity profiles predicted by the two-phase flow model as a fraction of the maximum velocity from configurations M512 (a–f) and F512 (g–l).

For both configurations, the fluid and solid velocity profiles are almost identical during flow deceleration and flow reversal. However, during flow acceleration, the solid velocity slightly lags the fluid velocity. At early stages of flow acceleration, this velocity lag is located near the bed and moves upward as the flow accelerates.
The velocity profiles for the medium-sand configuration (M512) show expected behaviour of the oscillatory boundary layer. However, for the fine-sand configuration (F512), the velocity profiles show distinct features. The velocity profiles are affected by the concentration plateau ( $0^\circ$, $30^\circ$ and $60^\circ$). At early stages of flow acceleration, the boundary layer is decomposed into two different layers of almost constant velocity. This behaviour appears to be similar to the plug flow described by Zala-Flores & Sleath (Reference Zala-Flores and Sleath1998) and Sleath (Reference Sleath1999) but the mechanism is different. The concentration at flow reversal in the plateau is too low for a yield strength to develop between the plateau and the immobile sediment bed.
The hydrodynamics is further investigated by comparing the different shear stress contributions from both phases.
4.2.3. Shear stress profiles
Profiles of Reynolds stresses for fluid and solid phases,
 \begin{equation} R_{xy}^f=\rho^f(1-\langle\bar\phi\rangle)\langle \tilde u^{f'} \tilde v^{f'}\rangle, \quad R_{xy}^s=\rho^s\langle\bar\phi\rangle\langle \tilde u^{s'} \tilde v^{s'}\rangle, \end{equation}
and profiles of shear stress resulting from particle friction and collisions,
 \begin{equation} \tau_{xy}^{fr}= \left\langle\rho^s\bar\phi\nu^{fr}\left(\frac{\partial \tilde u^s}{\partial y} + \frac{\partial \tilde v^s}{\partial x}\right)\right\rangle, \quad \tau_{xy}^{c}= \left\langle\rho^s\bar\phi\nu^{c}\left(\frac{\partial \tilde u^s}{\partial y} + \frac{\partial \tilde v^s}{\partial x}\right)\right\rangle, \end{equation}
are presented in figure 9.
Solid and fluid Reynolds shear stress profiles  $R_{xy}^s$ and $R_{xy}^f$, respectively, shear stress resulting from particle friction $\tau _{xy}^{fr}$ and shear stress resulting from particle collisions $\tau _{xy}^c$ from configurations M512 (a–f) and F512 (g–l).

For both configurations, shear stress is dominated by friction in the sediment bed, collisions at the bottom of the transport layer and Reynolds stresses in the upper section of the flow. The contribution of the shear stress resulting from collisions is almost zero at flow reversal, increases during the acceleration phase of the flow to reach its maximum before flow peak and decreases afterwards. As expected, due to the greater particle inertia for medium sand, the relative contribution of the collisional shear stress is greater compared with that of the fine-sand configuration.
The time evolution of the fluid-phase Reynolds stress profiles from configuration M512 shows the classical features of a rough oscillatory boundary layer. The relative contributions of the Reynolds stresses from fluid and solid phase are similar at the top of the transport layer near the peak flow ( $60^\circ$ and $90^\circ$). As the sediment concentration decreases, the solid-phase contribution decreases and the fluid Reynolds stress dominates. Furthermore, around flow reversal, particles are deposited and the solid-phase contribution to the Reynolds stress vanishes.
For configuration F512, the development of the fluid Reynolds stresses is inhibited by the formation of the plateau around flow reversal ( $150^\circ$, $0^\circ$ and $30^\circ$) suggesting a strong modulation of turbulence by the particles. Turbulence modulation and formation of a concentration plateau show similarities with the two-layer structure separated by a lutocline well known for fine-sediment transport (Ozdemir, Hsu & Balachandar Reference Ozdemir, Hsu and Balachandar2010; Salinas et al. Reference Salinas, Balachandar, Shringarpure, Fedele, Hoyal, Zuniga and Cantero2021). However, the mechanism at play is fundamentally different. As observed by Ozdemir et al. (Reference Ozdemir, Hsu and Balachandar2010), the two-layer structure with an almost homogeneous concentration profile in the lower region of the flow followed by a rapid decrease of the concentration is the result of turbulence attenuation in the upper layer and strong mixing in the lower layer. For fine-sand configuration F512, Reynolds stresses are nearly zero throughout the entire boundary layer meaning that the concentration plateau is not a consequence of strong vertical mixing of sediment in the lower layer. The formation of the concentration plateau is further discussed in § 4.3.2.
Compared with the medium-sand configuration, Reynolds stresses in fine-sand configuration F512 penetrate deeper into the bed, and the solid-phase contribution not only dominates in the lower part of the transport layer but is also present much higher in the flow. In phases  $60^\circ$, $90^\circ$ and $120^\circ$, it can be clearly seen that the solid-phase Reynolds stress plays a relatively more important role than fluid Reynolds stress for the fine-sand configuration. The great importance of solid-phase Reynolds stress, usually considered negligible, contributes to explain the limitations of turbulence-averaged models in term of predictive capabilities for fine sand. Due to a greater contribution of the solid-phase Reynolds stress relative to fluid-phase Reynolds stress to the horizontal momentum budget, what can be called ‘solid-phase turbulence’ plays a key role during the acceleration phase of the wave for configuration F512. As a consequence, mixing and boundary layer inertia are increased. The transport layer becomes thicker and it takes more time for the boundary layer to adapt to the evolving flow conditions resulting in the emergence of phase-lag effects.
4.2.4. Sheet flow layer thickness and streamwise sediment flux
An important feature of oscillatory sheet flows is the sheet flow layer thickness  $\delta _s$. The sheet flow layer thickness is defined as the distance between the erosion depth and the elevation where the phase-average concentration is equal to $\langle \bar \phi \rangle = 0.08$. It is rather straightforward to get the upper limit of the sheet flow layer thickness, but the definition of the erosion depth is subject to discussion. For Dohmen-Janssen et al. (Reference Dohmen-Janssen, Hassan and Ribberink2001), the erosion depth is defined as the still bed level for which the velocity returns back to zero, whereas for O'Donoghue & Wright (Reference O'Donoghue and Wright2004), the erosion depth is obtained by fitting the power law to the concentration profile. The latter definition can hardly be applied to the fine-sand configuration given that the concentration profile cannot be reproduced using a power law. Therefore, the method of Dohmen-Janssen et al. (Reference Dohmen-Janssen, Hassan and Ribberink2001) is used to define the erosion depth for both configurations. According to O'Donoghue & Wright (Reference O'Donoghue and Wright2004) for medium sand, the two definitions should give similar estimates of the erosion depth.
The time series of the sheet flow layer thickness made dimensionless by the Stokes-layer thickness from configurations M512 and F512 are compared with the free-stream velocity in figure 10. The sheet flow layer thickness predicted by the two-fluid model is perfectly in phase with the free-stream velocity for medium sand (configuration M512). The sheet flow layer thickness is maintained at a constant value to zero at flow reversal, starts to grow at around  $25^\circ$, reaches a maximum $\delta _s^{m}/\delta \approx 9$ at the maximum free-stream velocity and decreases at almost the same rate as it grew during flow acceleration to reach a constant value around $25^\circ$ before the next flow reversal. For fine sand (configuration F512), the time series of $\delta _s$ is not in phase with the free-stream velocity. The sheet flow layer thickness suddenly increases at around $55^\circ$, reaches a peak $\delta _s^{m}/\delta \approx 14$ at around $110^\circ$ and then decreases slowly to reach a value of $\delta _s/\delta \approx 8$ before growing again at around $55^\circ$ after the next flow reversal. Whereas the time series of the sheet flow layer thickness shows a symmetric behaviour in its growth and decay in the medium-sand configuration, the growth phase for fine sand is evidently shorter than the decaying phase.
Time series of the sheet flow layer thickness  $\delta _s$ made dimensionless by the Stokes-layer thickness $\delta$ from the sheet flow configurations M512 and F512 compared with the free-stream velocity.

Most importantly, for the same hydrodynamic forcing between the two configurations, the sheet flow layer thickness in configuration F512 is much greater than the sheet flow layer thickness in configuration M512 throughout the wave phase signifying the importance of unsteady effects in the fine-sand configuration (F512).
The maximum sheet flow layer thickness  $\delta _s^m$ made dimensionless by the particle diameter is plotted as a function of the maximum Shields number (figure 11). The dimensionless maximum sheet flow layer thickness for configuration M512 scales very well with measurements from Dohmen-Janssen et al. (Reference Dohmen-Janssen, Hassan and Ribberink2001) involving medium and coarse sand. In the absence of unsteady effects, dimensionless maximum sheet flow layer thickness increases linearly with the Shields number with $\delta _m^s/d_p=13\theta _m$ (Dohmen-Janssen et al. Reference Dohmen-Janssen, Hassan and Ribberink2001). Numerical and experimental maximum sheet flow layer thicknesses are almost superimposed. For configurations involving fine sand, the slope of the relation between $\delta _s^m/d_p$ and $\theta _m$ becomes steeper as a consequence of unsteady effects. Experimental measurements from Dohmen-Janssen et al. (Reference Dohmen-Janssen, Hassan and Ribberink2001) involving fine sand and configuration F512 are well represented by the relation $\delta ^m_s/d_p=25\theta _m$ used in the practical sand transport model proposed by van der A et al. (Reference van der A, Ribberink, van der Werf, O'Donoghue, Buijsrogge and Kranenburg2013) for fine sand. Whereas numerical and experimental maximum sheet flow layer thicknesses for medium sand are very close, a difference can be observed for fine sand in figure 11. Considering the accurate prediction of the concentration profile by the two-fluid model, this difference comes from the method used to identify the bed. Experimentally, O'Donoghue & Wright (Reference O'Donoghue and Wright2004) defined the erosion depth by fitting a power law to the concentration profile. However, as pointed out previously, this methodology can hardly be applied to configuration F512 involving fine sand considering that the concentration profile cannot be reproduced using a power law.
Maximum sheet flow layer thickness made dimensionless by the particle diameter  $\delta _s^m/d_p$ as a function of the maximum Shields number $\theta _m$ for configurations F512 and M512 compared with experimental measurements from O'Donoghue & Wright (Reference O'Donoghue and Wright2004) and other measurements involving coarse, medium and fine sand from Dohmen-Janssen et al. (Reference Dohmen-Janssen, Hassan and Ribberink2001) (DJ2001).

To supplement the study of the behaviour of the sheet flow layer thickness, a colour map representing the time evolution of the sediment concentration with the erosion depth  $\delta _e$ and the line of iso-concentration $\langle \bar \phi \rangle =0.08$ for both configurations are presented in figure 12. Compared with the time series presented in figure 10, this figure allows a description of the intra-wave sheet flow layer thickness evolution in time by differentiating its upper and lower boundaries. For medium-sand configuration (M512), there is a symmetry between the erosion depth and the line of iso-concentration $\langle \bar \phi \rangle =0.08$ with respect to the still bed level $y=0$. However, for fine sand (F512), the erosion depth is almost constant throughout the wave period. The successive shrinking and enlargement of the sheet flow layer thickness is mostly due to the variation of its upper limit. Compared with medium sand (M512), given that the erosion depth is almost constant for fine sand, there is a notable amount of sediment constantly suspended throughout the wave period and the amount of sediment in the transport layer is of lower variability.
Colour map representing the time evolution of the solid-phase concentration, time series of the erosion depth  $\delta _e$ and the top of the sheet flow layer corresponding to concentration $\langle \bar \phi \rangle =0.08$ for medium sand (M512) and fine sand (F512).

The time series of the streamwise depth-integrated sediment flux  $q_x$ calculated as
 \begin{equation} q_x = \int_{-\infty}^{\infty}\langle\bar\phi\tilde u^s\rangle \,{{\rm d} y} \end{equation}
are plotted in figure 13 for configurations F512 and M512. Similarly to the sheet flow layer thickness, the sediment flux is perfectly in phase with the free-stream velocity for medium sand. However, the temporal variability of sediment flux is more complex for fine sand (F512). There is a significant phase shift between the sediment flux and the free-stream velocity. Sediment flux leads the velocity at flow reversal while a lag is observed at flow peak. Furthermore, a sudden increase of the streamwise sediment flux can be observed corresponding to the sheet flow layer increase at around  $55^\circ$ and $235^\circ$. The two-fluid simulations reveal strong nonlinear interactions between turbulence and particle dynamics that lead to the increase of sediment transport.
Times series of the streamwise depth-integrated sediment fluxes  $q_x$ and the respective bed load contributions.

To better understand the difference in behaviour between the two configurations, snapshots of the simulations showing the fluid-phase coherent turbulent structures and surfaces of instantaneous concentration  $\bar \phi =0.5$ and $\bar \phi =0.08$ at flow reversal ( $0^\circ$), during flow acceleration ( $21^\circ$ and $58^\circ$) and at flow peak ( $90^\circ$) are presented in figure 14. At flow reversal, medium sand has completely settled to the bed and turbulent structures are visible above the bed whereas fine sand is still in suspension in the total absence of turbulence due to its low settling velocity and larger sheet flow layer thickness. At early stage of flow acceleration, small-amplitude two-dimensional shear instabilities start to develop at the bottom in the form of small ripple-like structures represented by the iso-surface of concentration $\bar \phi =0.5$ at $21^\circ$ in figure 14 for the medium-sand configuration (M512) which are rapidly transitioning to three-dimensional turbulent perturbation of the sediment bed. For fine-sand configuration (F512), turbulence starts to develop at much later instant of $58^\circ$ during flow acceleration and two-dimensional shear instabilities of larger amplitude in the form of breaking billows are visible on the surface of concentration $\bar \phi =0.5$ in figure 14. These instabilities are visible at the bottom, but the top of the sheet flow layer also exhibits three-dimensional turbulent flow structures. Strong instabilities have an effect of increasing vertical mixing of the sediment and significantly increase the sheet flow layer thickness. Eventually, the two-dimensional instabilities near the bottom transition to turbulence near the peak flow at $90^\circ$. For both configurations, boundary layers are fully turbulent at flow peak.
Snapshots of the medium-sand configuration M512 (a,c,e,g) and fine-sand configuration F512 (b,d,f,h) at  $0^\circ$, $21^\circ$, $58^\circ$ and $90^\circ$ with surfaces of concentration $\bar \phi =0.5$ (brown) and $\bar \phi =0.08$ (silver) and fluid turbulent coherent structures coloured by the fluid velocity.

To better understand turbulence modulation induced by the particles and enhanced mixing for configuration F512, the time evolution of resolved TKE in the oscillatory boundary layer is investigated in the next section.
4.3. Discussion
In this section, the physical mechanisms responsible for the differences in behaviour observed in § 4.2 are discussed. First, the modulation of turbulence due to the presence of the particles is presented and its effect on the mass balance between downward settling and upward turbulent fluxes is analysed.
4.3.1. Turbulence modulation induced by the particles
As suggested by Dohmen-Janssen et al. (Reference Dohmen-Janssen, Hassan and Ribberink2001), an important feature of the difference in behaviour can come from turbulence modulation by the particles. Compared with experiments, numerical simulation has the advantage of providing a better insight into turbulence statistics such as the time evolution of TKE in the oscillatory boundary layer. The spatio-temporal evolution of resolved TKE during the wave period is presented in figure 15 for both configurations. Turbulence generation during flow acceleration and decay during flow deceleration behave completely differently between medium-sand (M512) and fine-sand (F512) configurations.
Colour map of the TKE for configuration M512 (a) and configuration F512 (b) with white lines representing the moments where snapshots from figure 14 were taken.

For medium sand, the boundary layer remains turbulent throughout the wave period. Turbulence is generated due to strong shear close to the bed at the early stage of the wave period ( $0^\circ$ to $20^\circ$), and then a sudden increase of TKE is observed corresponding to the appearance of two-dimensional instabilities and the increase of the sheet flow layer thickness at around $20^\circ$. The TKE reaches its maximum just before flow peak and eventually decays during flow deceleration resulting in the deposition of particles without re-laminarisation of the flow (TKE remaining between $0.04$ and $0.08\,{\rm m}^2\,{\rm s}^{-2}$).
For configuration F512, the mechanisms of turbulence production and dissipation inside the sheet flow layer thickness are slightly more complicated. Similar to medium-sand configuration, TKE starts to increase at the top of the immobile bed at early stages of flow acceleration ( $20^\circ$ to $58^\circ$), but TKE is also produced at the top of the sheet flow layer. These production zones correspond to the high-velocity shear rate regions of the flow located at the top and bottom of the concentration plateau as can be seen in figure 8. Similarly to configuration M512, the appearance of the two-dimensional shear instabilities corresponds to a sudden spread of the TKE, but they occur at later time around $58^\circ$. The top and bottom shear layers eventually meet and the resulting shear layer thickness increases as the sheet flow layer thickness increases.
The maximum TKE is larger for configuration F512 compared with M512 leading to the enhanced vertical mixing of fine sand. However, turbulence is dissipated much more rapidly with an almost complete re-laminarisation of the boundary layer near flow reversal (TKE less than  $0.04 \, {\rm m}^2\,{\rm s}^{-2}$).
In the fine-sand case, stratification induced by the particles in suspension in the concentration plateau near flow reversal has a stabilising effect. Usually, this behaviour is observed for very fine sediment with very low fall velocity (Ozdemir et al. Reference Ozdemir, Hsu and Balachandar2010) but, under such energetic conditions, the same phenomenon occurs given the significant amount of sediment maintained in suspension during flow reversal. To quantify the stabilising effect of density stratification, the vertical profiles of the Richardson number, defined as
 \begin{equation} Ri=\dfrac{g}{\rho^m}\dfrac{\vert\partial \langle\rho^m\rangle/\partial y\vert}{\left(\partial \langle \tilde u^f\rangle_F/\partial y\right)^2}, \end{equation}
with  $\rho ^m = \phi \rho ^s + (1-\phi )\rho ^f$ being the mixture density, are plotted in figure 16. The Richardson number represents the ratio between turbulence attenuation induced by density stratification and turbulence production due to shear. From stability analysis, the stabilising effect due to density stratification dominates turbulent shear production when $Ri>0.25$.
Vertical profiles of Richardson number for medium sand (M512) and fine sand (F512).

For both configurations, the Richardson number is below the threshold value of 0.25 in the sheet flow layer during the latest stage of flow acceleration, flow peak and the early stage of flow reversal ( $60^\circ \unicode{x2013}120^\circ$). However, the Richardson number becomes greater than 0.25 for a significant portion of the sheet flow layer at the latest stage of flow deceleration ( $150^\circ$), at flow reversal ( $0^\circ$) and at the very early stage of flow acceleration for fine-sand configuration F512. When shear becomes weaker during flow deceleration, the density gradient generated by the presence of the particles in the water column strongly attenuates the turbulence. Stabilising forces induced by flow stratification predominate over turbulence production and the flow becomes laminar at flow reversal. For medium sand, it is clear that the effect of density stratification is much weaker and flow remains turbulent in the boundary layer.
Density stratification may not be the only mechanism responsible for turbulence attenuation. For sand particles, drag-induced turbulence dissipation can also contribute to the reduction of the surrounding turbulence (Cheng et al. Reference Cheng, Hsu and Chauchat2018). An analysis of detailed TKE budget in the future would allow one to better identify and quantify the relative contributions of the mechanisms at the origin of turbulence modulation by the particles in the oscillatory boundary layer. Nevertheless, density stratification is expected to be dominant considering that drag-induced dissipation should be relatively small for fine sand compared with medium sand because of lower Stokes number for smaller particles.
The modulation of turbulence has an effect not only on the hydrodynamics but also on vertical mixing of the particles. Mechanisms of erosion and deposition are affected by the differences in the behaviour of the turbulent boundary layer between the two configurations.
4.3.2. Vertical fluxes
Taking the phase average of the sediment mass conservation equation (2.3) gives the following expression:
 \begin{equation} \dfrac{\partial\langle\bar\phi\rangle}{\partial t} + \dfrac{\partial \langle\bar\phi \tilde v^s\rangle}{\partial y}=0. \end{equation}
The time evolution of the concentration profile is controlled by the divergence of the vertical sand flux. This net sand flux can be decomposed into two components:
 \begin{equation} \langle\bar\phi \tilde v^s\rangle = \langle\bar\phi\rangle\langle\tilde v^s\rangle + \langle\phi'\tilde v^{s'}\rangle, \end{equation}
with the former being the averaged settling flux defined as the product of the average concentration and vertical velocity and the latter being the correlation between concentration and vertical velocity fluctuations, which is called the Reynolds flux. The Reynolds flux represents the upward sediment flux generated by turbulence and hence it is also referred to as the turbulent suspension flux. The net flux can be dominated by either the settling or the Reynolds flux but both of them coexist at the same time throughout the wave period.
The net, settling and Reynolds fluxes for both configurations are presented at different moments of the wave period in figure 17. For medium-sand configuration, sand is completely deposited at flow reversal resulting in a zero vertical flux. During flow acceleration, the net sand flux is dominated by the upward Reynolds flux. Particles are picked up from the bed by the fluid-phase turbulent flow structures. At flow peak, a similar behaviour compared with steady particle-laden boundary layer flows is observed. There is an equilibrium between upward Reynolds and downward settling fluxes.
Vertical fluxes at different moments of the wave period from medium-sand configuration M512 (a–f) and fine-sand configuration F512 (g–l).

For fine-sand configuration F512, the time evolution of the net vertical sand flux is more complex. Under the effect of instabilities during flow acceleration, solid-phase Reynolds stress becomes large (see figure 9) and vertical mixing is enhanced. As a result, the net sediment flux is still dominated by Reynolds flux close to flow peak at  $60^\circ$ and $90^\circ$. Compared with medium-sand configuration M512, there is no equilibrium between settling and Reynolds fluxes at the flow peak ( $90^\circ$). Settling and Reynolds fluxes are balanced at a later time ( $120^\circ$) and the net sediment flux becomes settling-dominated during the final stage of flow deceleration. As a result of turbulence attenuation due to stable stratification, Reynolds flux is almost zero around flow reversal. During this phase, the net sediment flux is almost exclusively controlled by the free fall of the particles. This analysis represents the first observation of a phase-lag effect on the vertical mass budget of sediments. From the simulations results, we can also estimate that there is an approximately $30^\circ$ phase lag in the fine-sand configuration relative to the medium-sand configuration.
For medium sand, the position of the maximum net vertical sand flux corresponds approximately to the position of the inflection point of the concentration profile. In that case, the divergence of the flux is zero at the location of the inflection point. During flow acceleration, particles are picked up from the bed and suspended from the bottom to higher section of the flow with a maximum flux at the inflection point and vice versa during flow deceleration. This behaviour results in a concentration profile pivoting around the inflection point during successive acceleration and deceleration phases following the classical description provided by O'Donoghue & Wright (Reference O'Donoghue and Wright2004). However, for configuration F512, the maximum net vertical sediment flux is located much higher in the flow when the flux is settling-dominated around flow reversal. Particles settle faster in upper sections of the flow, the sediment concentration saturates as the particle fall velocity decreases due to hindered settling induced by neighbouring particles towards the bed and the concentration plateau forms. Eventually, as the concentration becomes constant in the plateau, so does the net vertical flux and the divergence of the flux inside the plateau becomes zero. As a consequence, particles settling at a higher rate from the upper section of the flow descend at a constant rate through the plateau of constant concentration before settling back to the bed. The formation of the concentration is therefore the direct consequence of the coupling between the shape of the concentration profile and hindered settling, not the consequence of a turbulent mechanism as observed by Ozdemir et al. (Reference Ozdemir, Hsu and Balachandar2010) for fine sediment.
Indeed, the formation of concentration plateaus in sedimentation theory has already been observed and extensively investigated both analytically and numerically (Bustos & Concha Reference Bustos and Concha1988, Reference Bustos and Concha1999; Bürger & Tory Reference Bürger and Tory2000). Finding solutions for the vertical sediment mass balance in sedimentation theory amounts to solving a Riemann problem where shocks and expansion waves can form. The formation of the concentration plateau at flow reversal in configuration F512 can directly be related to a sedimentation shock forming at the top of the transport layer and an expansion wave eventually leading to a constant concentration inside the plateau.
The Reynolds flux contribution for configuration M512 during flow deceleration has an effect of decreasing the net sediment flux in the upper section of the flow and shifting the maximum net flux towards the concentration profile inflection point. If the Reynolds flux contribution was zero (i.e. if the net flux was exclusively dominated by settling), the maximum net flux would be located higher in the flow and the formation of a concentration plateau would be expected.
In addition to the vertical sediment fluxes, quantities of interest in terms of modelling oscillatory sheet flow are the vertical velocities. Taking the decomposition of the net sediment flux (4.6) and dividing it by the average sediment concentration  $\langle \bar \phi \rangle$ allows one to recover the vertical Favre-averaged solid velocity:
 \begin{equation} \langle \tilde v^s \rangle_F = \langle \tilde v^s \rangle + \tilde v^s_d , \end{equation}
decomposed into the sum of an average settling velocity  $\langle \tilde v^s \rangle$ and a vertical drift velocity $\tilde v^s_d=\langle \phi '\tilde v^{s'}\rangle /\langle \bar \phi \rangle$.
As for the fluxes in figure 17, the different contributions of the vertical particle velocities are plotted in figure 18. For fine-sand configuration F512, the mean particle settling velocity is well represented by the empirical expression of the hindered settling velocity proposed by Richardson & Zaki (Reference Richardson and Zaki1997),  $\langle v^s\rangle =v_s(1-\langle \bar \phi \rangle )^{4.65}$, throughout the wave period. However, for medium sand, a significant reduction of the effective particle settling velocity can be observed except during flow reversal. The location where this settling velocity reduction occurs migrates upward as flow accelerates. The settling velocity reduction corresponds to the location where Reynolds stress changes sign (figure 9). In this flow region, complex interactions between the particles and turbulent structures generated at flow reversal such as loitering (Nielsen Reference Nielsen1993), nonlinear drag effects (Mei Reference Mei1994) or vortex trapping (Nielsen Reference Nielsen1984) may cause settling retardation. However, this settling velocity reduction occurs at a location where the concentration and the net vertical flux are very low and do not significantly impact the time evolution of the concentration profile.
Favre-averaged vertical velocity, averaged settling velocity and drift velocity profiles normalised by the settling velocity  $v_s$ at different moments of the wave period for medium-sand configuration M512 (a–f) and fine-sand configuration F512 (g–l) compared with the empirical expression of the hindered settling velocity from Richardson & Zaki (Reference Richardson and Zaki1997).

Overall, the average settling velocity is well reproduced by the hindrance function. The dependence of the settling velocity on the sediment concentration is already easily implemented in traditional drag formulations. The modelling effort should therefore be directed towards reproducing the turbulence–particle interactions represented by the drift velocity to accurately predict the vertical balance between settling and Reynolds fluxes for these flow conditions.
5. Summary and conclusion
The turbulence-resolving Eulerian two-fluid model has been successfully applied to oscillatory sheet flow configurations involving fine and medium sand under a symmetric flow forcing (configurations F512 and M512 from O'Donoghue & Wright (Reference O'Donoghue and Wright2004), respectively). Quantitative predictions of concentration profiles are obtained demonstrating the predictive capabilities of the two-fluid LES model. However, small discrepancies can be observed for the configuration involving medium sand. Sediments settle too quickly to the bed during flow deceleration leading to a sharper concentration profile in the near-bed region compared with the experimental observations.
Nevertheless, the good quality of the model results allows us to validate the use of the two-fluid model. It is remarkable that the turbulence-resolving two-phase flow model reproduces the differences in behaviour observed between medium and fine sand whereas earlier work using turbulence-averaged models requires an almost systematic tuning of empirical model coefficients for turbulence–particle interactions. These important results demonstrate that the two-fluid model explicitly resolves these interactions and can be used to study in detail the mass balance and turbulent statistics to explain the differences observed in the experiments.
For oscillatory sheet flow involving medium sand, the evolution of the concentration profile across the wave period follows the well-documented description proposed by O'Donoghue & Wright (Reference O'Donoghue and Wright2004) with a clockwise (anticlockwise) rotation of the concentration profile during flow acceleration (deceleration) around a ‘pivot’ of constant concentration. From the analysis of the two-fluid model results, this can be explained by a competition between downward settling flux and upward Reynolds flux. This behaviour is the result of a maximum vertical net flux coinciding with the inflection point of the concentration profile during most of the wave period. The sheet flow layer thickness, the erosion depth and the horizontal sediment flux are perfectly in phase with the free-stream velocity suggesting that the sediment bed response to changes of the near-bed velocity is very quick. This observation confirms that the evolution of the sheet flow layer is quasi-steady. In the streamwise direction, velocity and Reynolds stress profiles show the well-known behaviour of the turbulent oscillatory boundary layer.
For fine sand, the behaviour of the flow is significantly different. During the flow acceleration phase, strong flow instabilities are observed leading to an increased solid-phase Reynolds shear stress and Reynolds fluxes associated with a thicker sheet flow layer throughout the wave period. During the deceleration phase, the increased near-bed sediment load introduces an important density stratification that leads to a strong fluid turbulence damping. Associated with this laminarisation of the flow, the sediment dynamics in the vertical direction is increasingly dominated by gravitational settling. The nonlinearity of the settling flux, due to hindered settling, generates the formation of a concentration plateau that slides almost freely above the immobile sediment bed. In turn, the concentration plateau, associated with a strong concentration and density gradients at the upper interface, strengthens the development of flow instabilities during the following acceleration phase. Another consequence of the increased near-bed sediment load during the entire wave cycle is the increase of the boundary layer inertia which probably explains the origin of the phase lag observed between the sediment load and the free-stream velocity. Indeed, the increased inertia of the boundary layer delays its temporal development as can be seen in the stress profiles.
Compared with medium sand, the solid-phase turbulence plays a greater role in oscillatory sheet flow. Usually not taken into account in turbulence-averaged models, it contributes to explain their limited predictive capabilities for configurations involving fine sand. Unsteady effects are the results of a chain of causes and consequences including shear instabilities that increase vertical mixing of sediment, strong solid-phase Reynolds stress, increased boundary layer inertia, stable density stratification, turbulence damping and hindered settling. An equilibrium between all these mechanisms is established during the wave period controlling the vertical mass balance of sediment and phase-lag effects.
Eventually, accurate prediction of the time evolution of the concentration profile depends on a reliable modelling of the competition between the downward settling and the upward Reynolds fluxes. Simulation results using the two-fluid model show that the mean settling velocity can be well reproduced using empirical formulation taking into account hindered settling. Future research should therefore be focused on an accurate modelling of the drift velocity induced by turbulence–particle interactions.
After this first validation of oscillatory sheet flow under symmetric waves, the two-fluid model should be applied to study wave shape effects. Indeed, unsteady effects for fine sand can have a significant impact on the wave-averaged net flux generated under asymmetric or skewed waves. Providing detailed information on the effect of the wave shape using the two-fluid model can be extremely valuable considering that the wave-averaged net flux controls the cross-shore morphological evolution of sandy beaches.
Furthermore, for configurations involving medium sand, the size of the particles relative to the turbulent flow scales can become important. As pointed out by Mathieu et al. (Reference Mathieu, Chauchat, Bonamy, Balarac and Hsu2021), finite-size effects can lead to enhanced turbulent diffusion of particles. Integrating this mechanism should improve the prediction of the concentration profile around flow reversal. However, further development of the finite-size correction model should be undertaken to be able to apply it to unsteady flow conditions.
Finally, up to now, the two-fluid methodology is mostly limited to configurations involving monodispersed particles. Compared with Lagrangian approaches such as the point-particle methodology, it will suffer from limitations when a broad-band mixture of particle sizes is considered. However, recent advances in polydispersed two-fluid modelling such as investigation of size segregation in bed-load transport (Rousseau et al. Reference Rousseau, Chassagne, Chauchat, Maurin and Frey2021) should help overcome these limitations in the future.
Funding
The authors would like to acknowledge the financial support from Agence de l'Innovation de Défense (AID), SHOM through project MEPELS and Agence Nationale de la Recherche (ANR) through project SheetFlow (ANR-18-CE01-0003). T.-J.H. and J.C. also acknowledge support from the Munitions Response Program of the Strategic Environmental Research and Development Program under Project MR20-S1-1478. Most of the computations presented in this paper were performed using the GRICAD infrastructure and the GENCI infrastructure under allocations A0080107567 and A0100107567. The Python package FluidFoam was used for post-processing of OpenFoam data (https://github.com/fluiddyn/fluidfoam).
Declaration of interests
The authors report no conflict of interest.


 Open access