

Introduction
Big cats of the genus Panthera are widely distributed globally but their numbers are declining as a result of habitat loss, climate change and conflicts with people (Holland et al., Reference Holland, Larson and Powell2018). As the human population increases (Gu et al., Reference Gu, Andreev and Dupre2021), landscapes become more fragmented, forcing wildlife to share space with human communities and putting them at an increasing risk of persecution (Viollaz et al., Reference Viollaz, Thompson and Petrossian2021). This is of particular concern for apex predators, which are frequently involved in human–wildlife conflict, yet are crucial for a healthy ecosystem. Loss of predators can cause instability within food chains, leading to reduction in biodiversity, increased disease transmission and changes to vegetation composition and structure (Williams et al., Reference Williams, Williams, Lewis and Hill2017).
The leopard Panthera pardus is a widespread felid, distributed throughout Africa, Asia and parts of the Middle East (Hunter et al., Reference Hunter, Henschel, Ray, Kingdon and Hoffmann2013). Leopards are solitary, carnivorous, nocturnal animals and often inhabit areas where other big cats are absent, creating the misleading impression that they are less threatened (Jacobson et al., Reference Jacobson, Gerngross, Lemeris, Schoonover, Anco and Breitenmoser-Würsten2016). However, the leopard is categorized as Vulnerable on the IUCN Red List, with the primary threats being anthropogenic (Stein et al., Reference Stein, Gerngross, Al Hikmani, Balme, Bertola and Drouilly2024). It is estimated that leopards currently occupy only half of their historical global range, but with few monitoring systems in place, it is difficult to accurately determine leopard population numbers (Jacobson et al., Reference Jacobson, Gerngross, Lemeris, Schoonover, Anco and Breitenmoser-Würsten2016).
The habitat of the African subspecies Panthera pardus pardus is highly fragmented as a result of anthropogenic land-use changes, and leopards are hunted illegally throughout their range (Gebretensae & Messele, Reference Gebretensae and Messele2022). In South Africa, leopards frequently attack livestock (Constant et al., Reference Constant, Bell and Hill2015) leading to retaliatory killings (Viollaz et al., Reference Viollaz, Thompson and Petrossian2021). Leopard survival is markedly lower outside protected areas (Swanepoel et al., Reference Swanepoel, Somers, Van Hoven, Schiess-Meier, Owen and Snyman2015) but only one-third of the habitat considered suitable for leopards in South Africa is currently protected (Swanepoel et al., Reference Swanepoel, Lindsey, Somers, van Hoven and Dalerum2013).
Leopard density and movement are also affected by intra- (Swanepoel et al., Reference Swanepoel, Somers, Van Hoven, Schiess-Meier, Owen and Snyman2015) and interspecific competition (Rafiq et al., Reference Rafiq, Jordan, Wilson, McNutt, Hayward and Meloro2020), and prey availability (Rosenblatt et al., Reference Rosenblatt, Creel, Becker, Merkle, Mwape, Schuette and Simpamba2016). Where prey densities are low or competition high, predation of livestock by leopards may result in increased conflict with people (Wolf & Ripple, Reference Wolf and Ripple2016). Leopards are territorial, with male home ranges covering up to 200 km2 (Parker et al., Reference Parker, Nams, Balme, Begg, Begg and Bidner2023), four times the average size of female territories (Bailey, Reference Bailey and Bailey1993). However, some studies have found much larger male home ranges, with Snider et al. (Reference Snider, Athreya, Balme, Bidner, Farhadinia and Fattebert2021) reporting an area of 885.6 km2. Female leopards often stay near their mother’s territory, whereas males disperse over large distances, resulting in greater genetic diversity in the population (Fattebert et al., Reference Fattebert, Dickerson, Balme, Slotow and Hunter2013). Movements of individuals within an area can cause shifts in territories and dispersal to new areas (Balme et al., Reference Balme, Slotow and Hunter2009).
Estimates of leopard density and an understanding of how long individuals remain in an area are needed to underpin effective conservation and management strategies. These metrics help to identify population trends and areas where leopards may be at risk because of human–wildlife conflict or habitat loss. Reliable data also support evidence-based policy decisions and resource prioritization, thereby helping to ensure the long-term survival of leopard populations, which in turn benefits other species and the ecosystem as a whole.
Camera trapping is a cost-effective way to monitor leopard numbers and can also be used to collect demographic information through coat pattern recognition. Spatially explicit capture–recapture models (Efford, Reference Efford2004) can be used to estimate population density and landscape use for species with large home ranges and low densities (Sollmann et al., Reference Sollmann, Gardner and Belant2012), but large amounts of camera-trap data are needed for model accuracy (Royle & Converse, Reference Royle and Converse2014). Spatially explicit capture–recapture models use the number of repeat encounters with identified individuals at specific locations to pinpoint activity centres and determine home range size, without being susceptible to edge effects (Rovero & Zimmerman, Reference Rovero and Zimmerman2016). Such models can also make predictions about space use by individuals, even in non-sampled areas. They have previously been used to analyse the effect of different land-use types on leopard populations (Devens et al., Reference Devens, Hayward, Tshabalala, Dickman, McManus, Smuts and Somers2021), understand the importance of protected areas (Morris et al., Reference Morris, Boardman, Swanepoel, Simpson, Coetzee, Camacho and McWhorter2022), determine drivers of population changes (Noack et al., Reference Noack, Heyns, Rodenwoldt and Edwards2019) and assess conservation needs (Rogan, Reference Rogan2021).
Using a 10-year camera-trap dataset, we applied a spatially explicit capture–recapture model framework to a leopard population in a South African protected area. Our objectives were to monitor individual leopards within the reserve to determine annual turnover, trends in density and sex ratio, and the best predictors of changes in leopard density and the duration of individual residency within the reserve.
Study area
We conducted our study in the 960 km2 Hluhluwe-iMfolozi Park, northern KwaZulu-Natal, South Africa (Fig. 1). It was established in 1897 as a state protected area (Howison et al., Reference Howison, Olff, Owen-Smith, Cromsigt, Archibald, Smith, Pimm and O’Brien2017) managed by Ezemvelo KZN Wildlife, the governmental organization responsible for maintaining wildlife conservation areas and biodiversity in KwaZulu-Natal Province. The Park is divided into two main sections: Hluhluwe (the northern section) and iMfolozi (the southern section), which were joined through a wildlife corridor in 1989. The two sections are separated by a tarred public road that animals are free to cross. There is an area of wilderness in the southern part of iMfolozi, which accounts for one-third of Hluhluwe-iMfolozi Park and is inaccessible by road.
Hluhluwe-iMfolozi Park in KwaZulu-Natal in the eastern region of South Africa, showing camera-trap locations used by the KwaZulu-Natal Leopard Monitoring Programme (2014–2022), and the road separating the northern (Hluhluwe) and southern (iMfolozi) parts of the Park.

Hluhluwe-iMfolozi Park has a diverse vegetation ranging from grasslands to fine-leaved woodlands, riverine forests and dense thickets (Howison et al., Reference Howison, Olff, Owen-Smith, Cromsigt, Archibald, Smith, Pimm and O’Brien2017). Megafauna in the Park include the African savannah elephant Loxodonta africana, white rhinoceros Ceratotherium simum, black rhinoceros Diceros bicornis, lion Panthera leo, cheetah Acinonyx jubatus, spotted hyaena Crocuta crocuta and African wild dog Lycaon pictus. Rainfall varies with elevation, which ranges from 45–750 m (Balfour & Howison, Reference Balfour and Howison2002). Hluhluwe-iMfolozi Park has wet summers (November–March) and dry winters (May–September) and was severely affected by drought during 2014–2017.
Methods
Camera-trap surveys
Annual camera-trap surveys have been carried out in Hluhluwe-iMfolozi Park since 2013 as part of the KwaZulu-Natal Leopard Monitoring Project, a collaboration between Wildlife ACT, Ezemvelo KZN Wildlife, iSimangaliso Wetland Park Authority and Panthera (Mann et al., Reference Mann, Whittington-Jones, Kelly, Gilroy, Knutson and Mitchell2017). Surveys were limited to 45 days on average to fit the model assumptions of a closed population (Efford, Reference Efford2025a). As a result of logistical issues, the surveys could not always be completed in the same season each year (2013: February–April; 2014–2018: April– May; 2019 onwards: September–November). Forty-six camera-trap sites were placed c. 2 km apart in approximately the same locations every year (Fig. 1). Trap spacing of 2 km is standard for leopard camera-trap surveys because it covers the smallest female home range size and thus increases the chance that all leopards within the area will be caught on at least one camera trap (Fattebert et al., Reference Fattebert, Balme, Robinson, Dickerson, Slotow and Hunter2016). The protocol varied in 2013, when there were only 30 camera-trap sites, c. 3 km apart. In 2018, four sites were changed, and from 2020 onwards one site was removed. The camera-trap survey covered c. 40% of Hluhluwe-iMfolozi Park (340 km2) but the results are assumed to be representative of the whole reserve (Garbett et al., Reference Garbett, Theron, Kelly and Foden2021).
Each trapping site consisted of paired cameras to allow for image capture of both flanks of a passing animal (Garbett et al., Reference Garbett, Theron, Kelly and Foden2021). All stations used Pantheracam V3, V4, V5 or V6 Xenonflash cameras with infrared motion sensors (Panthera, USA). Cameras were unbaited and securely attached to trees or to metal poles that had been dug into the ground on the edge of a road or path. We defined one sampling occasion as a 24 h period from midday to midday, which avoids the problem of nocturnal animals being counted twice, before and after midnight, in the same location (Du Preez et al., Reference Du Preez, Loveridge and Macdonald2014).
Data analysis
We used Panthera’s integrated data software Hotspotter (original release; Panthera, USA) to identify individual leopards and the presence of other species (Crall et al., Reference Crall, Stewart, Berger-Wolf, Rubenstein and Sundaresan2013). For leopards, Hotspotter compares the unique rosette pattern on the fur of an individual against all other records (including leopards from other reserves; Verschueren et al., Reference Verschueren, Fabiano, Kakove, Cristescu and Marker2023; Plate 1). We also checked images manually to confirm identification and removed any images of individuals that could not be identified before further analysis. Sex and age group of individual leopards were manually assigned. Males were identifiable by their larger and wider necks or visible genitalia; females by their comparatively smaller head and neck (Balme et al., Reference Balme, Hunter and Braczkowski2012; Swanepoel et al., Reference Swanepoel, Somers, Van Hoven, Schiess-Meier, Owen and Snyman2015). Where sex could not be confirmed, the images were retained in the dataset with the sex marked as unknown. We determined the age of leopards from inspection of the first images of each individual (assumed to be on entry into Hluhluwe-iMfolozi Park), categorized into one of three age groups: juvenile (1 year), subadult/young adult (2–5 years) and adult (6+ years). Adult leopards are noticeably larger, with girthier necks and more dewlap, whereas very young individuals have less sleek fur and a slimmer physique (Balme et al., Reference Balme, Hunter and Braczkowski2012). Individuals that were only recorded in one of the annual camera-trap surveys were classed as transient; all others were classified as non-transient.
Two camera-trap images of the same leopard Panthera pardus recorded as part of the KwaZulu-Natal Leopard Monitoring Survey (2013–2022) in Hluhluwe-iMfolozi Park, KwaZulu-Natal, South Africa, showing identification using rosette coat patterns.

We used records of other mammals to create relative species abundance indices (proportion of camera-trap days with species presence). We focused on lions, spotted hyaenas and African wild dogs, all of which compete with leopards for space and resources (Rafiq et al., Reference Rafiq, Jordan, Wilson, McNutt, Hayward and Meloro2020), and on medium-sized ungulates known to comprise a large part of the leopard’s diet in South Africa: the warthog Phacochoerus africanus, nyala Tragelaphus angasii, reedbuck Redunca arundinum, bushbuck Tragelaphus sylvaticus, bushpig Potamochoerus larvatus, grey duiker Sylvicapra grimmia, red duiker Cephalophus natalensis and impala Aepyceros melampus (Hayward et al., Reference Hayward, Henschel, O’Brien, Hofmeyr, Balme and Kerley2006).
Ezemvelo KZN Wildlife record any conflicts between local communities and wildlife from Hluhluwe-iMfolozi Park. The quality of the data was not consistent over time because of staff turnover and changing attitudes of local people towards Ezemvelo KZN Wildlife. Nevertheless, these limitations were consistent for all species, so relative comparisons can still be made. We calculated the scale of human–leopard conflict on an annual basis as the proportion of conflicts involving leopards out of all human–wildlife conflicts. The conflicts included leopards killing livestock, farmers killing leopards, and leopards being sighted near human communities or on farmland.
Spatially explicit capture–recapture models
We estimated the density and sex ratio of leopards per year using spatially explicit capture–recapture models and the software package secr 4.6.6 (Efford, Reference Efford2024) in R 4.3.3 (R Core Team, 2024) with a maximum likelihood framework (Borchers & Efford, Reference Borchers and Efford2008). We determined the activity centre of individual leopards from their spatial locations with reference to the trap grid (Efford, Reference Efford2004; Royle et al., Reference Royle, Nichols, Karanth and Gopalaswamy2009). We used the default half normal function (Gaussian model), which assumes encounter probability is highest when the camera-trap location coincides exactly with the individual’s activity centre and declines as the distance between the camera trap and activity centre increases (Rovero & Zimmerman, Reference Rovero and Zimmerman2016). We defined the detector type for the spatially explicit capture–recapture model as a proximity detector, meaning detection occurs when the animal is near a camera trap (i.e. the animal is not physically captured), and each detector operates independently (Efford, Reference Efford2024).
We assumed all habitat within the reserve and in a surrounding buffer area to be suitable for leopards. To determine the appropriate buffer width for each year (Rovero & Zimmerman, Reference Rovero and Zimmerman2016), we generated spatial masks representing the reserve plus buffers of 14 different widths (1–25 km). For each buffer width, we ran null models assuming constant values for animal density (D), baseline encounter probability (g0) and a measure of the individual’s home range size (σ). The baseline encounter probability is the likelihood of an individual being recorded within its predicted home range. We then plotted estimated density against buffer width and identified the point at which the curve flattened, meaning further increases in buffer width no longer markedly changed the density estimate. This point was chosen as the buffer width for that year (9–11 km). The points represent the maximum distance from each camera-trap location at which a leopard activity centre could occur. Buffer zones were chosen to be wide enough to ensure that the probability of detecting an individual outside the buffer was negligible (Efford & Schofield, Reference Efford and Schofield2022).
We employed a two-step model selection process in our spatially explicit capture–recapture models. We first selected an appropriate function affecting the probability of capture (g0), then ran a second step exploring the impact of sex on predictions of density, because male and female leopards have different movement patterns and territory sizes (Bailey, Reference Bailey and Bailey1993; Mizutani & Jewell, Reference Mizutani and Jewell1998). Candidate models for the probability of capture included two-class mixture (the data are factored into different homogenous classes) and the null model with no covariates (Efford, Reference Efford2025b). We were unable to fit alternative models because of convergence issues. In estimating density, we used hybrid mixture models to incorporate the male, female and unknown sex classes into the analysis (Efford, Reference Efford2024). We ran four sets of models: (1) a null model where sex did not affect either parameter; (2) a constant g0 and σ incorporating sex; (3) sex incorporated into both g0 and σ; and (4) g0 incorporating sex and a constant σ. These models assumed all males and females were equally likely to be sexed from the camera-trap images. In both steps, models were compared using the Akaike information criterion (AIC; Akaike, Reference Akaike1974), adjusted for small sample sizes (AICc; Burnham & Anderson, Reference Burnham and Anderson2002). The lowest AICc score indicated the best available model (Royle & Converse, Reference Royle and Converse2014). Models with ΔAICc < 2 were considered to have equivalent evidence, so model averaging was used in these cases to determine the density and sex ratio estimate (Rovero & Zimmerman, Reference Rovero and Zimmerman2016).
Leopard density and residency models
We used linear models to examine drivers of annual leopard density, including relative abundance of competing predators, relative prey abundance and rainfall, as predictors (2013–2022). The availability of environmental data for the study area was limited and so we were only able to use rainfall in our models. Human–wildlife conflict data were only available for 2014–2020, so we fitted additional models for this period adding the yearly proportion of conflict involving leopards to the candidate variables. Habitat data (e.g. on vegetation cover and plant species) were unavailable for the study period. To determine the factors influencing the duration of residency of individual leopards in Hluhluwe-iMfolozi Park (i.e. the number of years individuals were present up until the last year in which they were detected), we used generalized linear models with Poisson errors and included sex, age, relative abundance of competing predators, relative prey abundance, distance to the reserve boundary and number of territories crossing the individual’s territory boundary (i.e. intraspecific competition) as predictors. We excluded individuals detected only in 2013 or 2022 from the residency model. In both cases we performed stepwise model selection using the MASS package in R 4.3.3 (Venables & Ripley, Reference Venables and Ripley2002; R Core Team, 2024), trying both forward and backward stepwise additions of the different predictors (Yamashita et al., Reference Yamashita, Yamashita and Kamimura2007). The model with the lowest AICc value was considered the best available model in each case (Burnham & Anderson, Reference Burnham and Anderson2002). Where models had equivalent evidence (ΔAICc < 2), we chose the simplest model.
Results
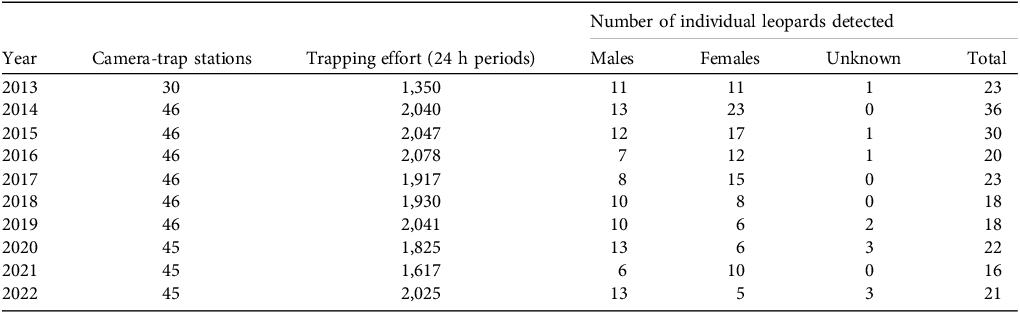
Over the 10 camera-trap surveys during 2013–2022, the total sampling effort was 18,870 camera-trap nights, resulting in 1,212 images of leopards and 690 unique captures (after discarding repeat detections of the same leopard within the same 24 h sampling period; Table 1). Overall, we individually identified 108 leopards: 47 males, 50 females and 11 of unknown sex. A mean of 61.5% of camera-trap stations captured leopard images but this proportion declined over the duration of the study. The highest annual number of leopard images was captured in 2014 (n = 152) and the lowest in 2021 (n = 44), with a mean of 73 leopard captures per year (disregarding 2013 because there were fewer camera traps deployed than in other years). The number of identified individuals was highest in 2014 (n = 36) and lowest in 2021 (n = 16), with a mean of 23 individual leopards captured annually. Most leopards were captured in Hluhluwe, but the highest total number of captures at a single site was next to a river in southern iMfolozi (Supplementary Fig. 1).
Camera-trap effort and number of independent leopard Panthera pardus detections in surveys in Hluhluwe-iMfolozi Park, KwaZulu-Natal, South Africa, during 2013–2022.

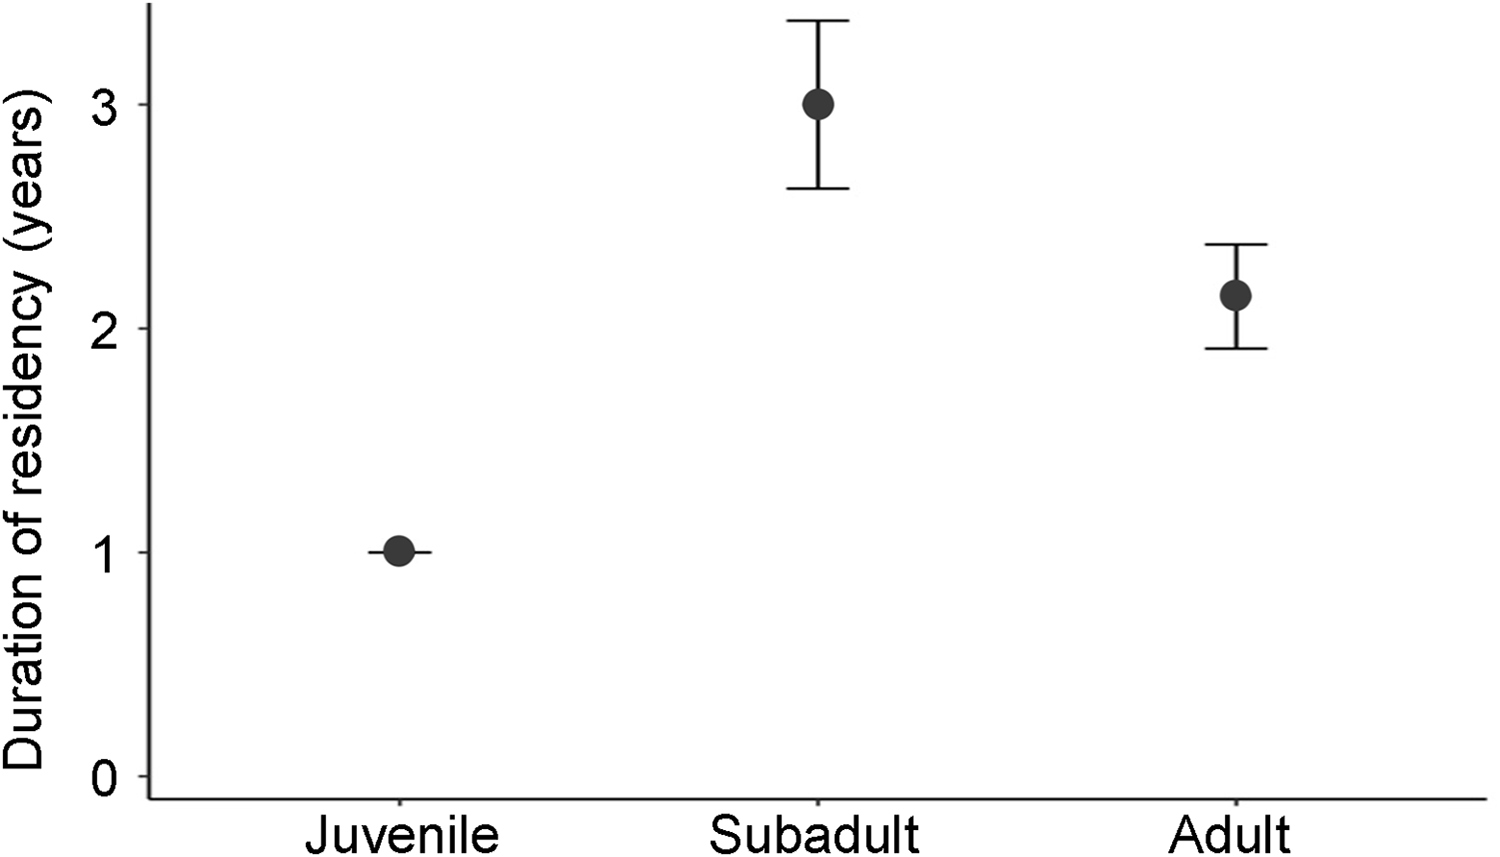
The annual turnover of leopards was high, with the percentage of new individuals (i.e. those not detected in the previous year) generally increasing over the study period. The mean duration of residency within Hluhluwe-iMfolozi Park was 2.45 ± SE 0.21 years across all individuals, and 3.58 ± SE 0.28 years for non-transient individuals. The mean duration of residency was 2.59 ± SE 0.33 years for males and 2.35 ± SE 0.28 years for females (Supplementary Fig. 2). Thirteen individuals (six males, seven females) remained within Hluhluwe-iMfolozi Park for ≥ 5 years, with one male and one female persisting for 10 years. Both were identified as subadults in 2013, and by 2022 the male’s centre of activity was largely outside the reserve. Subadults persisted longer than adults and juveniles (both sexes) and adult males persisted longer than adult females.
The best-fitted model to explain the probability of capture in most years was the null model (Supplementary Table 1). When incorporating sex into either baseline encounter probability (g0), home range size (σ) or both, there was often more than one best-fitted model. The model average of all models was used where ΔAICc < 2, which determined the density and sex ratio estimates (Supplementary Table 2). The activity centres of the two leopards present throughout the 10-year study were relatively consistent over this period (Supplementary Fig. 3). The activity centres for the 13 most persistent individuals were well distributed throughout the camera-trap survey area in the Park (Supplementary Fig. 4).
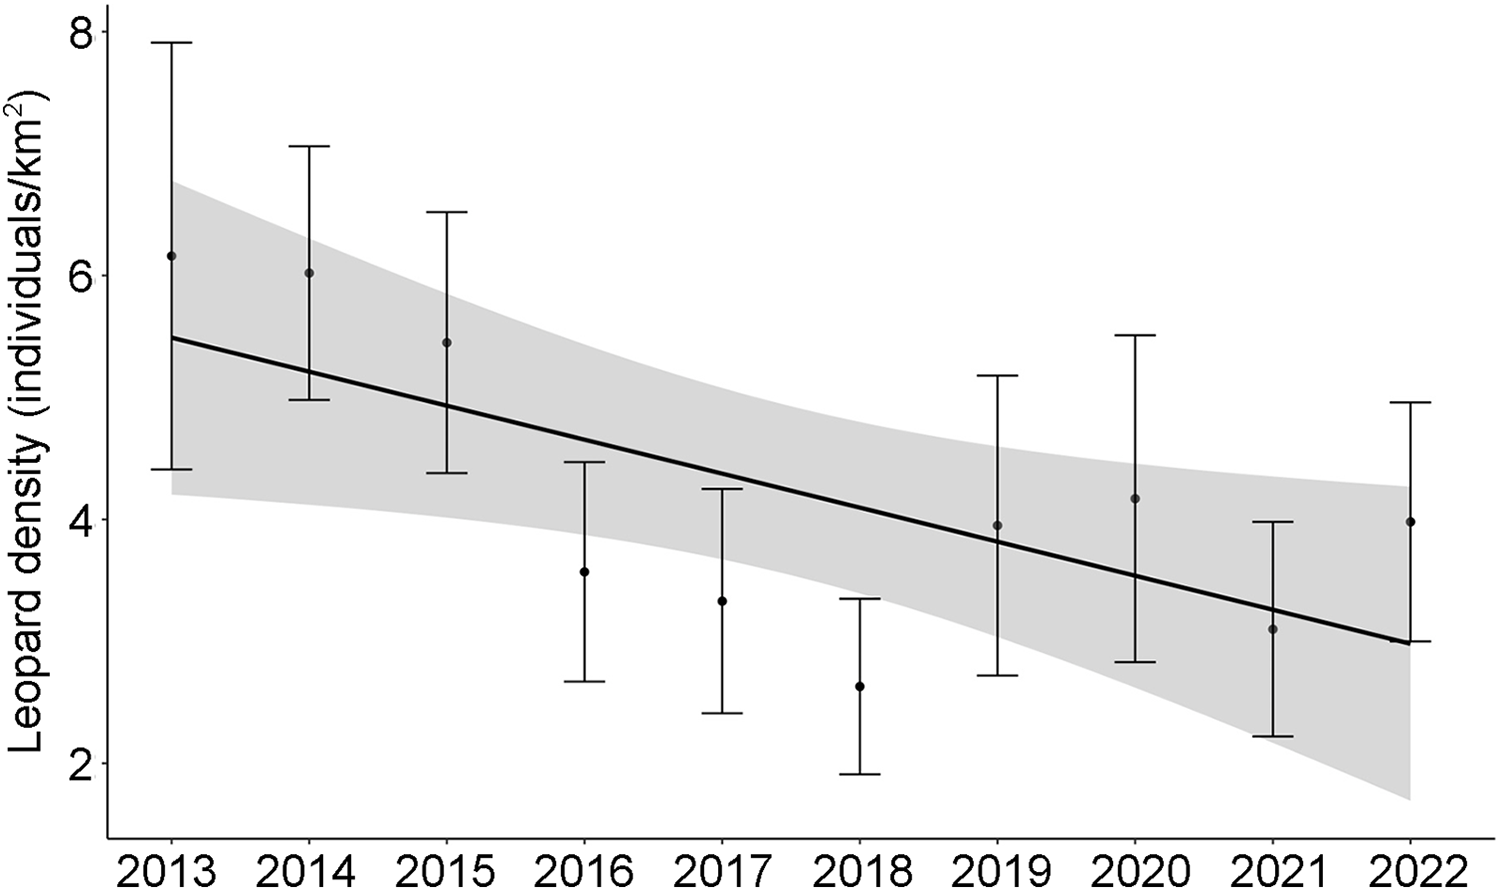
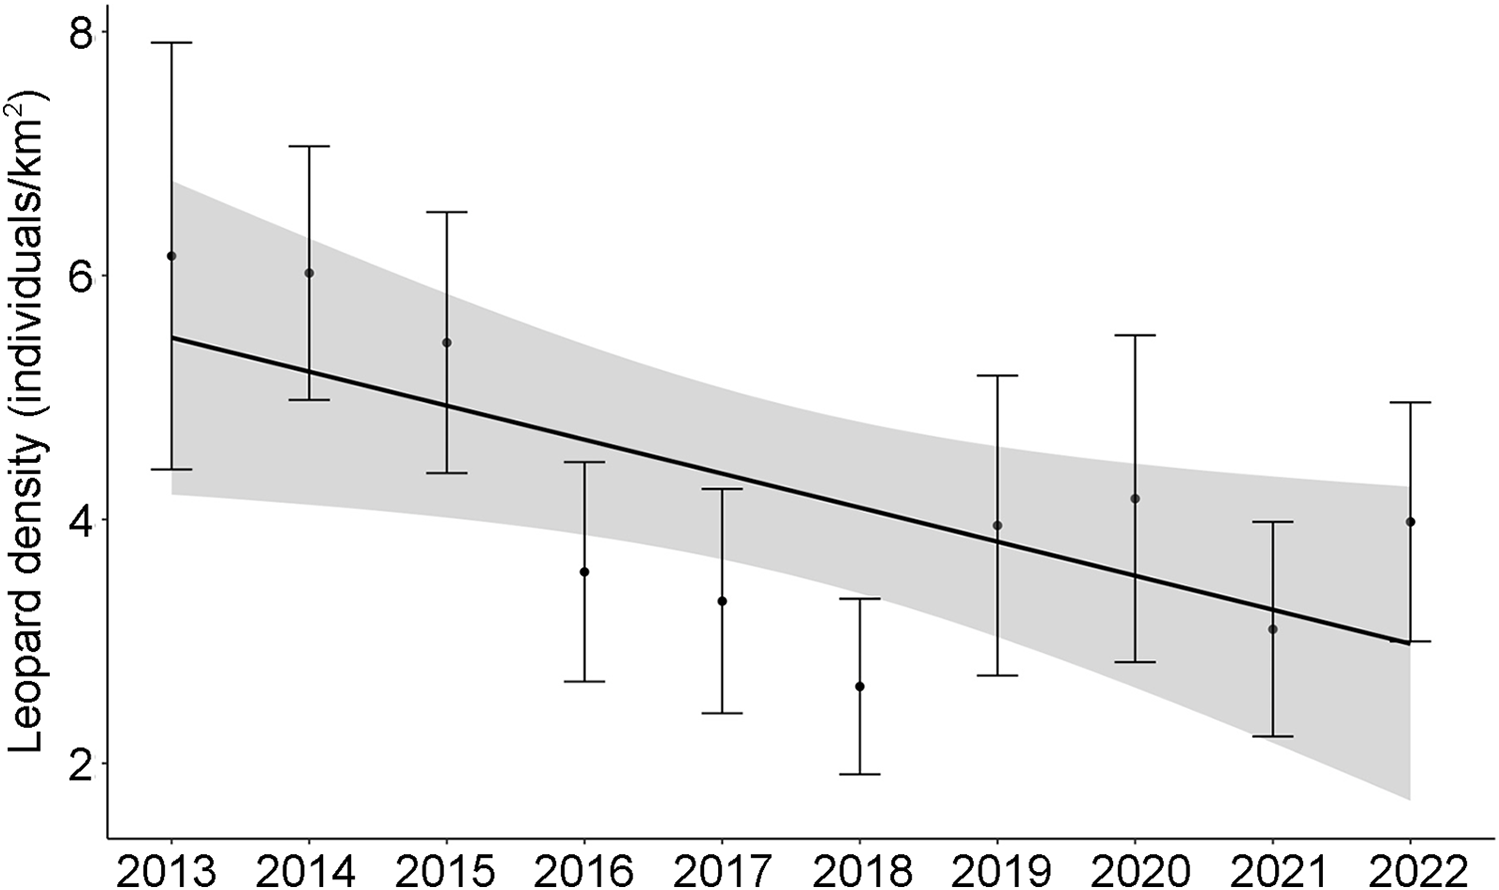
Leopard density declined over the decade from an estimated 6.16 individuals/100 km2 in 2013 to 3.98 individuals/100 km2 in 2022. A linear regression indicated an average annual decrease of 0.28 individuals/100 km2 (β = −0.28 ± SE 0.21), and the model explained 40% of the variation in density (R2 = 0.40; Fig. 2; Supplementary Table 3). There was a female-biased sex ratio in most years but this changed over time from a male : female ratio of 0.42 : 0.58 in 2013 to a male-biased 0.64 : 0.36 in 2022 (β = 0.02 ± 0.03, R2 = 0.11; Fig. 3).
Leopard Panthera pardus population density estimates for 2013–2022 in Hluhluwe-iMfolozi Park. A habitat mask (buffer width 9–11 km) was used to limit the area of the centre of leopard activity. Each density estimate is shown with its corresponding standard error. Grey shading indicates the 95% confidence interval for the regression line.
Leopard sex ratio estimates (shown as proportion of females and males in the population) for 2013–2022 in Hluhluwe-iMfolozi Park. Each value is shown with its corresponding standard error. Grey shading represents 95% confidence intervals for the regression lines.

Drivers of population density change
Our exploratory analyses revealed a negative correlation between prey abundance and leopard density (β = −7.29 ± SE 4.04, R 2 = 0.56). As this is unlikely to reflect a causal effect, prey abundance was not used as a potential predictor. The most parsimonious model explaining leopard density used only rainfall as a predictor (β = −0.05 ± SE 0.03; Fig. 4b).
The influence of (a) relative spotted hyaena Crocuta crocuta abundance, (b) rainfall (mm), (c) relative African wild dog Lycaon pictus abundance and (d) human–leopard conflict (as a proportion of incidents involving leopards out of all human–wildlife conflict reports) on leopard density in Hluhluwe-iMfolozi Park from 2014–2020. Grey shading represents 95% confidence intervals. The relative abundance index (RAI) of hyaena and wild dog was calculated as the proportion of camera-trap days with the species’ presence.

There were 226 incidences of human–leopard conflict recorded during 2014−2020 (Ezemvelo KZN Wildlife, unpubl. data). This accounts for 42.3% of all human–wildlife conflict reported around Hluhluwe-iMfolozi Park. The proportion of human–wildlife conflict (β = −4.00 ± SE 0.27), rainfall (β = −0.09 ± SE 0.03), hyaena abundance (β = 21.70 ± SE 0.95) and wild dog abundance (β = −56.33 ± SE 2.42) were all included in the best model explaining leopard density from 2014–2020 (Fig. 4; Supplementary Table 4).
Drivers of leopard residency
We recorded 37 transient leopards during 2014–2021 (43% of the population). Adult and subadult females were the most common transient groups (10 individuals each, 54% of the transient population) and subadult females were the most common non-transient group (15 individuals, 21% of non-transient population). All juvenile leopards were only seen in one survey year; i.e. these individuals were not recorded again after their first year.
From the stepwise model comparisons, the best-fitted model for duration of residency incorporated age (McFadden’s R 2 = 0.036; Supplementary Table 5). An interaction between sex and age resulted in a model with a larger AICc value compared to a model using age and sex separately. Subadults remained in the Park significantly longer (3.00 ± SE 0.38 years; P < 0.05) than adults (2.14 ± SE 0.23 years; P < 0.05) and juveniles (1.00 ± SE 0.00 years; P < 0.05). There was no significant difference in residency duration between juveniles and adults (P > 0.1; Fig. 5).
The effect of age group on individual leopards’ duration of residency (mean ± SE) in Hluhluwe-iMfolozi Park during 2013–2021.

Discussion
Our study used a large dataset from annual camera-trap surveys to determine the changes in the leopard density and duration of individual residency over time in Hluhluwe-iMfolozi Park. Leopard density in the Park declined during 2013–2022 and sex ratio shifted towards a male bias. Our results are qualitatively similar to previous analyses of leopard population trends in the same area (Rogan et al., Reference Rogan, Balme, Distiller, Pitman, Broadfield and Mann2019; Garbett et al., Reference Garbett, Theron, Kelly and Foden2021). Residency of individual leopards in the protected Park was short, with a mean of 2.45 ± SE 0.21 years. Previous research suggests leopards would not leave an area unless there was insufficient prey or lack of suitable habitat, or high intra-specific competition (Parker et al., Reference Parker, Nams, Balme, Begg, Begg and Bidner2023). Therefore, it could be expected that leopards would reside in a protected area for 3 years or more if conditions were suitable. A large proportion of the leopard population in Hluhluwe-iMfolozi Park was recorded in one year only. The high loss of individuals and decline in female abundance indicates a demographical shift in the population, which may limit reproductive growth. Duration of residency was not strongly predicted by any of the covariates we tested, other than age; the decline in density was best predicted by increasing rainfall.
Age class significantly affected leopard residency in Hluhluwe-iMfolozi Park, with subadults remaining in the Park significantly longer than adults and juveniles. Subadults persisted the longest on average, but as the age of adults was unknown this may have been a result of natural territory turnover. High population turnover and immigration have the potential to increase intraspecific strife, which affects population growth (Balme et al., Reference Balme, Pitman, Robinson, Miller, Funston and Hunter2017). Here, new leopards regularly entered the study area (n = 13 in 2020, n = 14 in 2022); the reasons for this influx and the source locations of these individuals are unknown, and further studies in other areas would be needed to confirm these details. These individuals persisted for an average of 3.58 ± SE 0.28 years, which would allow females to produce one or two litters of cubs, but productivity in the Park may be limited by the low overall female densities. Female leopard density can be three times higher than that of males (Morris et al., Reference Morris, Boardman, Swanepoel, Simpson, Coetzee, Camacho and McWhorter2022), which would allow for greater reproductive output, enhancing population growth. We detected only four cubs in camera-trap images over 10 years, which could be a result of low cub detection, high cub dispersal out of the protected area or high cub mortality. Contrary to expectations based on previous research, females were the most transient group. Females generally move the minimum distance needed to rear young and obtain prey (Le Roex et al., Reference Le Roex, Mann, Hunter and Balme2022). A possible explanation for this unexpected result is that increased mortality or emigration may create a vacuum effect in the Park, which results in an increased rate of adult male immigration (Balme et al., Reference Balme, Slotow and Hunter2009); increased male turnover may subsequently disrupt resident spatial dynamics, leading to reduced female residency or increased female emigration.
The age and sex of new leopards entering the Park is expected to have impacts on the resident population (Naude et al., Reference Naude, Balme, O’Riain, Hunter, Fattebert, Dickerson and Bishop2020). Described as the ‘dear enemy’ effect by Ydenberg et al. (Reference Ydenberg, Giraldeau and Falls1988), leopards often attack unknown individuals, and immigrant males pose an infanticide threat to cubs. Moreover, high adult mortality from intraspecific competition causes a vacuum effect, resulting in an increased rate of adult male immigration (Balme et al., Reference Balme, Slotow and Hunter2009). This may have been the case in Hluhluwe-iMfolozi Park in 2022, when adult male immigration was high and male density increased slightly. When male turnover is high, the success of female mating significantly decreases, and population growth is limited (Balme et al., Reference Balme, Slotow and Hunter2009).
Three male leopards (two adults and one subadult) were recorded at other sites before being detected in Hluhluwe-iMfolozi Park in later years. They were observed at Manyoni Private Game Reserve, 50 km away, and Ithala Nature Reserve, c. 110 km from the centre of the Park (D. Theron, unpubl. data). The long-distance dispersal of these individuals suggests good gene flow in KwaZulu-Natal. However, we cannot infer causes of population change without more detailed information from in-depth studies on natal dispersal and population genetics (Fattebert et al., Reference Fattebert, Dickerson, Balme, Slotow and Hunter2013; Tensen et al., Reference Tensen, Roelofs and Swanepoel2014). The camera-trap survey area in northern KwaZulu-Natal is limited and surveys were only carried out for 40 days annually. Mapping the movements and migration of leopards in detail is challenging and requires consistent, collaborative surveys to examine population movements across large areas (Rogan et al., Reference Rogan, Distiller, Balme, Pitman, Mann and Dubay2022).
Rainfall was the best predictor of leopard density in our models, with higher precipitation linked to a decline in leopard numbers. Rainfall was lowest in the Park during the drought period of 2014–2017, suggesting leopard density was highest in these years. Rainfall affects vegetation and water availability, which in turn affect habitat quality and abundance of prey (East, Reference East1984; Staver et al., Reference Staver, Archibald and Levin2011). During a drought, although prey abundance may be lower, the remaining prey animals could be weaker from a lack of food and thus less able to evade predators (Ferreira & Viljoen, Reference Ferreira and Viljoen2022), benefiting predator populations. This could explain why prey abundance had an unexpected negative relationship with leopard density in this study. It is important to note the surveys did not always take place in the same seasons each year because of logistical issues. During 2014–2019 the surveys took place at the start of the dry season, but in 2013 and in 2020–2022 the surveys were at the start of the wet season. There were fewer image captures each year during 2020–2022 compared to 2014–2018. Even though leopard density does not change significantly between the wet and dry seasons (Dickman, 2004; Allen et al., Reference Allen, Wang, Lucas, Olson, Li and Krofel2020), seasonality could affect other variables such as prey abundance or intra- and interspecific competition (Allen et al., Reference Allen, Wang, Lucas, Olson, Li and Krofel2020), which in turn could affect leopard movement and dispersal. Most prey species produce offspring in the wet season (Ogutu et al., Reference Ogutu, Piepho and Dublin2014), causing an increase in abundance and easier hunts. We recommend that future camera-trap surveys take place in the same season each year to ensure consistency of covariates. We did not collect information about habitat attributes over the study period but vegetation cover usually increases with rainfall, with denser vegetation providing more cover for prey animals (Kraaij & Milton, Reference Kraaij and Milton2006) and thus potentially lowering hunting success for predators.
We included data on human–wildlife conflict during 2014–2020 in the best model. An increased proportion of cases involving leopards amongst reports of human–wildlife conflict correlated with reduced leopard density, but the cause of this correlation is not fully understood. Conflict may have resulted in a reduction in leopard density, and population instability may have increased the potential for human–wildlife conflict as a result of leopards ranging widely across the study area. However, the detailed effects of such conflicts on the leopard population in Hluhluwe-iMfolozi Park are difficult to determine; our analysis was limited because the identities of the leopards involved in conflict incidents were not recorded and animals were often killed illegally.
Conclusion and future recommendations
The camera-trap surveys run by the KwaZulu-Natal Leopard Monitoring Project are important for understanding annual trends of leopard populations across different protected areas. Our study demonstrates an overall decline in leopard density in Hluhluwe-iMfolozi Park and a short duration of residency of individuals. The shift to a male-biased population and the high male turnover, coupled with short individual residency (especially of juveniles), may limit future reproductive success. The abundance of competing predator species, amount of rainfall and level of human–wildlife conflict were linked to changes in leopard density and residency. Instability within leopard populations can affect population growth through infanticide by incoming males and intraspecific competition. However, male immigration into the population can also increase genetic diversity and strengthen population resilience. We recommend a greater focus on monitoring female leopards, whose number declined over the course of the study, to assess the long-term impacts on the population in Hluhluwe-iMfolozi Park. A more detailed assessment of the impacts of human–wildlife conflict is also needed to understand the full extent of this problem and its effect on the leopard population.
We recommend that future studies use the same methodology and routinely share data between protected areas (Wilkinson et al., Reference Wilkinson, Fabricius, Brink, Garbett, Hahndiek and Williams2024), to improve our understanding of the movements and fate of individual leopards. Long-term surveys and technological advances in identification and monitoring of individuals will facilitate more detailed analyses across large areas. Effective conservation management of wide-ranging species such as leopards cannot be achieved locally but must cover areas exceeding 100 km2 (Fattebert et al., Reference Fattebert, Dickerson, Balme, Slotow and Hunter2013). The future of leopard populations in KwaZulu-Natal and throughout the species’ global range is under threat from habitat loss and conflict with people. However, with effective management informed by robust monitoring this can be mitigated. More broadly, our findings indicate that high emigration from protected areas increases demographic instability and elevates exposure to anthropogenic mortality. Future leopard conservation management should focus on data sharing amongst protected areas, the maintenance of functional wildlife corridors to reduce movements into farmland, and the avoidance of translocations that may disrupt stable populations with balanced sex ratios.
Author contributions
Study design: EB, PJR, DT, ZW; fieldwork: DT; data analysis: EB, MG; writing: all authors.
Acknowledgements
We thank Wildlife ACT and University of Chester for logistical support; and Ezemvelo KZN Wildlife and Panthera for permission to use data collected by these organizations, and for facilitating this research. This work formed part of an Ezemvelo KZN Wildlife registered research project (registration number: E/5195/02). This research was funded by Panthera, the Royal Commission for AlUla, the Peace Parks Foundation and the South African National Biodiversity Institute.
Competing interests
None.
Ethical standards
This research abided by the Oryx guidelines on ethical standards. It was conducted in accordance with all applicable laws and regulations of the Republic of South Africa. It did not involve the capture and/or handling of animals and was approved by the appropriate permitting authority (Ezemvelo KZN Wildlife; registration number: E/5195/02) and the Faculty of Science, Business and Enterprise Research Ethics Committee at the University of Chester.
Data availability
The data that support the findings of this study are available from Ezemvelo KZN Wildlife and Panthera on request to the corresponding author. Some restrictions apply.
Supplementary material
The supplementary material for this article is available at doi.org/10.1017/S0030605325102019






 Open access

