

Necrotising enterocolitis (NEC) is one of the most common and severe intestinal diseases in human preterm infants with an incidence of 7 % in very-low-birth-weight infants ( < 1500 g) and a mortality rate of 20–30 %( Reference Neu and Walker 1 ). The causes of NEC are still poorly understood, but some major predisposing factors are prematurity, aggressive enteral feeding and improper microbial colonisation in the intestine( Reference Neu and Walker 1 ). Human milk is considered as the optimal diet for both term and preterm infants( Reference Kelley 2 ), but a large proportion (e.g. 20–40 %) of preterm and term infants are not breast-fed( Reference Merewood, Brooks and Bauchner 3 ). In such cases, breast milk is replaced by human donor milk, bovine milk-derived human milk fortifiers or infant formulas, but these may increase the risk of NEC development. Several clinical studies have indicated that exclusively feeding human milk to preterm infants decreases NEC incidence and lowers mortality significantly( Reference Lucas and Cole 4 – Reference Boyd, Quigley and Brocklehurst 6 ), compared with adding a bovine milk-based human milk fortifier (1·7–3·2 v. 15·3 %) or feeding an infant formula( Reference McGuire and Anthony 7 , Reference Sullivan, Schanler and Kim 8 ). The reason for this may be that specific bioactive components in human milk can contribute to the protection against NEC. Studies focusing on the bioactivity of these individual components can provide knowledge for the development of a new generation of improved formulas containing proteins supplemented at doses similar to those in human milk.
Lactoferrin is an important 80 kDa Fe-binding protein present in mammalian milk and in several secreted fluids such as saliva and mucosal secretions( Reference Marshall 9 – Reference Baker and Baker 11 ). It is a major human milk protein having a concentration of up to 7 g/l in the human colostrum and 2 g/l in mature milk( Reference Marshall 9 ). In contrast, it is present in bovine milk as a minor protein (1·5 and 0·2 g/l in the colostrum and mature milk, respectively)( Reference Marshall 9 ). The structure of lactoferrin comprises an N-terminal and a C-terminal domain linked by a hinge region, which causes protein flexibility( Reference Baker and Baker 11 , Reference González-Chávez, Arévalo-Gallegos and Rascón-Cruz 12 ). Human lactoferrin and bovine lactoferrin (bLF) are partially stable after gastrointestinal digestion in infants, and thereby bind to lactoferrin receptors in the gut with high affinity and exert bioactivity( Reference Kawakami and Lönnerdal 13 , Reference Lönnerdal, Jiang and Du 14 ). In humans, lactoferrin receptors are located on the apical side of the intestinal epithelium and expressed in large amounts during the fetal and neonatal periods( Reference Lopez, Suzuki and Lönnerdal 15 ). The bioactive effects associated with lactoferrin in vitro include mediation of immune responses and anti-microbial activities against bacteria, viruses and parasites( Reference Adamkin 16 ). Intact lactoferrin itself or its fragments released during digestion, such as its C-lobe and lactoferricin, bind to pathogenic bacteria, thereby preventing epithelial attachment and infection( Reference Adamkin 16 ). Furthermore, lactoferrin stimulates in vitro cell proliferation( Reference Buccigrossi, De Marco and Bruzzese 17 , Reference Jiang, Lopez and Kelleher 18 ), which may benefit the immature intestine in preterm infants. Several studies have indicated that bLF attenuates lipopolysaccharide (LPS)-induced inflammatory cytokines such as IL-8, IL-6, IL-1β and TNF-α in monocytic cells( Reference Håversen, Ohlsson and Hahn-Zoric 19 ) and IL-8 in Caco-2 cells( Reference Berlutti, Schippa and Morea 20 ) via NF-κB modulation, thus offering a potential for the prophylaxis of inflammation. Another important characteristic of this protein is its high Fe-binding affinity (approximately K= 1022 m)( Reference Baker and Baker 21 ), which is associated with a recent finding of lactoferrin as a mimetic of hypoxia due to this Fe-binding ability. This results in the stabilisation of hypoxia-inducible factor-1α (HIF-1α), which is also linked with NF-κB during inflammation( Reference Jung, Isaacs and Lee 22 , Reference Zakharova, Kostevich and Sokolov 23 ).
Importantly, bLF and human lactoferrin share 77 % amino acid homology and have similar structures( Reference Manzoni, Rinaldi and Cattani 24 ). As a consequence, their biological activities are similar; for instance, they have comparable in vitro anti-microbial activities( Reference Adamkin 16 ). Therefore, bLF could be a key component in protecting newborn infants from diseases in early life. For instance, oral administration of bLF at a dose of 240–400 mg/kg per d demonstrated positive effects in vivo against intestinal diseases such as reducing the incidence of dextran sulphate sodium-induced colitis in rats and attenuating inflammatory cytokines (IL-6, TNF-α and IL-1β)( Reference Togawa, Nagase and Tanaka 25 ). In addition, administration of bLF at a dose of 100 mg/d to preterm neonates for the first 30 d of life conferred protection against sepsis, but not NEC( Reference Manzoni, Rinaldi and Cattani 24 ). Currently, bLF is used as a supplement in infant formulas, although the range of optimal doses is not known.
We hypothesised that the bioactive effects associated with bLF in milk or formulas may potentially prevent excessive inflammatory responses and the risk of NEC development in immature preterm neonates. We used an established preterm pig model of NEC( Reference Sangild, Siggers and Schmidt 26 ) to study the effects of bLF supplementation of infant formulas (10 g/l of bLF, equivalent to 1·2 g/kg per d during the period of administration of total enteral nutrition (TEN), which is close to that present in the human colostrum) against NEC development. The bLF dose used was greater than what has been tested in previous in vivo studies( Reference Manzoni, Rinaldi and Cattani 24 , Reference Togawa, Nagase and Tanaka 25 ), and this was hypothesised to exert stronger effects against NEC. Moreover, a wide range of bLF doses (0·1–10 g/l) were investigated using porcine intestinal epithelial cells (PsIc1) in vitro to determine the effects of bLF on cell proliferation, pro-inflammatory cytokine release as well as the mediation of ERK, NF-κB and HIF-1α intracellular signalling pathways. These will elucidate a potentially appropriate range of bLF doses that can be selected for further animal and clinical studies in the future.
Materials and methods
Animal experiments
A total of twenty-eight preterm pigs from four sows were delivered by caesarean section (Large White × Danish Landrace × Duroc, Askelygaard Farm, Roskilde, Denmark) at 92 % of gestational age (105 d, term 116 (sem 2) d). After delivery, pigs were immediately transferred to individual incubators maintained at 37°C, 80–100 % humidity and a suitable oxygen administration before placing vascular catheters (4F, Portex) in the umbilical artery and orogastric feeding tubes (6F, Portex; Smiths Medical). Pigs were then provided with maternal serum of 4 ml/kg after catheterisation, and subsequently 5 ml/kg after 12 h and 7 ml/kg after 20 h to provide passive immunological protection. Pigs were stratified into two groups according to sex and weight with two types of enteral nutrition: control formula (CON, n 15) and 10 g/l of bLF-enriched formula (LF, n 13). The two formulas were made by mixing various commercial ingredients to meet the optimal macronutrient and energy requirements for preterm pigs( Reference Sangild, Siggers and Schmidt 26 , Reference Cilieborg, Boye and Thymann 27 ): Lacprodan DI-9224 (Arla Foods Ingredients); Ross Polycose (Abbott Nutrition); SHS Seravit, Liquigen Medium-chain TAG and Calogen Long-chain TAG (Nutricia); with or without bLF (Morinaga Milk Industry). The lactoferrin used was bLF with 15 % Fe saturation and a low endotoxin content (1·6 endotoxin units/mg protein) detected by the Limulus Amebocyte Lysate Chromogenic Endotoxin Quantitation Kit (Fisher Scientific). The two formulas had similar composition except for the presence (LF) or absence (CON) of bLF, and they were adjusted to an equal intake of energy and macronutrients (Table 1). During the first 2 d, pigs were administered parenteral nutrition through their umbilical catheters at rates of 4 and 6 ml/kg per h for days 1 and 2, respectively, supplemented with either the CON or LF formula as minimal enteral nutrition with doses of 3 ml/kg per 3 h at day 1 and 5 ml/kg per 3 h at day 2. Parenteral nutrition was based on Kabiven (Fresenius Kabi) and adjusted nutrient composition to meet the requirements of pigs with an energy of 3210 kJ/l and a macronutrient energy composition of 36 % fat, 24 % protein and 40 % carbohydrates. From day 3, parenteral nutrition was stopped, and the pigs were fed either the CON or LF formula as TEN administered at a dose of 15 ml/kg per 3 h for another 2 d until euthanasia and tissue collection on day 5. The animal protocol was approved by the Danish National Committee on Animal Experimentation, and it has been described in detail previously( Reference Sangild, Siggers and Schmidt 26 , Reference Cilieborg, Boye and Thymann 27 ).
Macronutrient composition of the formulas used for enteral feeding in the control group (CON) and the lactoferrin-enriched formula group (LF)*

bLF, bovine lactoferrin.
* These were calculated based on macronutrient analysis from suppliers.
Clinical evaluation and sample collection
Every 3 h from birth to euthanasia, pigs were evaluated for NEC symptoms including bloody diarrhoea, abdominal distension, lethargy and cyanosis. Pigs with severe symptoms were euthanised immediately for tissue collection. Following euthanasia, the stomach, three regions of the small intestine (proximal, middle and distal) and the colon were macroscopically evaluated for NEC severity according to our standard scoring system: 1 = no or minimal abnormality; 2 = mild focal gastroenterocolitis; 3 = moderate locally extensive gastroenterocolitis; 4 = severe focal gastroenterocolitis; 5 = severe locally extensive haemorrhage and NEC; 6 = severe extensive haemorrhage and NEC. Scores above 2 in any of the five gastrointestinal regions were considered as positive for NEC. After euthanasia, individual organs including the heart, lungs, liver, kidneys, spleen, stomach, small intestine and colon were weighed. The length of the small intestine was measured at a relaxed stage. From the middle of each intestinal region, five pieces of whole-wall intestinal tissue samples were taken and immediately snap-frozen in liquid N2 and stored at − 80°C for further analyses of enzymatic activities and cytokines. Another two samples of intestinal tissue from each region were stored in paraformaldehyde solution for histology. In addition, 10 cm segments of each intestinal region were sampled and slit longitudinally for the measurement of circumference and mucosal proportion. The mucosa was gently scraped to determine the proportion both wet weight and dry weight as described previously( Reference Sangild, Siggers and Schmidt 26 , Reference Cilieborg, Boye and Thymann 27 ).
In vivo sugar absorption and intestinal permeability tests
In vivo sugar absorption and intestinal permeability tests were conducted as described previously( Reference Thymann, Burrin and Tappenden 28 ) with modifications. Plasma levels of galactose in response to oral boluses of galactose and lactose solutions on days 3 and 4, respectively, were analysed to measure the digestive and absorptive function of the gut. Blood samples were collected before and 20 min after an oral bolus (15 ml/kg) of 5 % galactose for the galactose test on day 3 before conversion to TEN, and before and 20 and 40 min after an oral bolus (15 ml/kg) of 10 % lactose for the lactose test 30 h after conversion to TEN. For the assessment of intestinal permeability, 3 h before euthanasia, an oral bolus (15 ml/kg) of 5 % lactulose and 5 % mannitol solutions was given to pigs and post-mortem urine samples were collected at euthanasia. Permeability was quantified by the ratio of lactulose:mannitol concentrations in the urine as reported elsewhere( Reference Bjornvad, Thymann and Deutz 29 ).
Intestinal morphology, functions and tissue cytokine analyses
Formaldehyde-fixed tissues from the proximal and distal small intestine and the colon were embedded in paraffin, transversely sectioned (5 μm) and stained with haematoxylin and eosin for measurements of villus height and crypt depth( Reference Sangild, Siggers and Schmidt 26 ). Gut morphology including villus height and crypt depth was quantified from scanned photos using ImageJ software (National Institute of Health). For each pig, three representative cross-sections in each region were sampled and ten representative measurements of villus height and crypt depth were made. Intestinal brush-border enzymes, including sucrase, lactase, maltase, aminopeptidase A, aminopeptidase N and dipeptidyl-peptidase IV, were analysed according to previous protocols( Reference Sangild, Siggers and Schmidt 26 ) and are expressed as U/g wet tissue. The cytokine levels of IL-8 and IL-1β in the proximal and distal small intestine and the colon were quantified using ELISA following tissue homogenisation as described previously( Reference Bjornvad, Schmidt and Petersen 30 ). The levels of cytokines are expressed as pg/mg wet tissue.
Cell culture, cell proliferation and cytokine analysis
PsIc1 intestinal epithelial cells from 6-month-old weaning pigs (Bionutritech) were cultured in advanced Dulbecco's modified Eagle's medium with supplementation of 2 % heat-inactivated fetal bovine serum, 40 U penicillin/ml, 40 μg streptomycin/ml and 2 mm-glutamine (Life Technologies) at 37 °C and 5 % CO2. Cells were used at passage 5–25. bLF was prepared by dissolving in serum-free DMEM medium and sterile filtered (0·2 μm) (Millipore).
For the cell proliferation assay, cells were seeded in ninety-six-well plates (5 × 10³ cells/well) and allowed to adhere for 24 h before treatments with bLF (0–20 g/l) for another 48 h. For assessment of the effects of ERK, cells were pre-incubated with the mitogen-activated/extracellular signal-regulated kinase (MEK) 1/2 inhibitor PD98059 (70 μm; Sigma-Aldrich) for 1 h before the treatments with bLF (0–10 g/l) for 48 h. Cell proliferation was quantified by the Celltiter 96 Aqueous One Solution Cell Proliferation Assay (Promega), according to the manufacturer's instructions.
For cytokine analysis, cells were cultured until reaching 90 % confluency in twenty-four-well plates and then serum-starved for 24 h. The cells were then incubated with bLF (0–10 g/l) and/or LPS (0·1 μg/ml) (from Escherichia coli O26:B6; Sigma-Aldrich) for 24 h. Thereafter, supernatants were collected for the analysis of IL-8 and IL-6 by ELISA, following the manufacturer's instructions (R&D Systems). Cytokine concentrations were normalised to the total intracellular protein content (ng/mg protein). After the treatments and supernatant collection, cell lysates were taken and analysed using the BCA Protein Assay Kit (Fisher Scientific) for the total protein content.
Intracellular signalling by Western blot
Western immunoblotting was conducted as indicated previously( Reference Chatterton, Rasmussen and Heegaard 10 ) with minor modifications. Cells at 90 % confluency were serum-starved for 24 h before stimulation with bLF at a dose of 0·1, 1 or 10 g/l for different time periods (5–90 min). Following the treatments, cells were lysed in radio-immunoprecipitation assay lysate buffer containing 1 × protease and phosphatase inhibitors (Fisher Scientific). Proteins in lysates (10 μg) were separated by SDS–PAGE using 12·5 % Tris–Glycine gels in non-reducing conditions before electro-transfer onto polyvinylidene difluoride membranes (Life Technologies)( Reference Chatterton, Rasmussen and Heegaard 10 ). Membranes were then probed with anti-IκB-α, anti-phospho-ERK, anti-HIF-1α and anti-poly (ADP-ribose) polymerase 1 (PARP-1) antibodies (Santa Cruz) to detect the levels of intracellular inhibitor κB-α (IκB-α), phosphorylated ERK 1/2, HIF-1α and PARP-1 cleavage following the bLF treatment. In order to confirm the equal protein loading in each lane, membranes were stripped and re-probed to detect the total ERK or β-actin as the loading control. For the detection of NF-κB/p65, cells were treated with bLF as described above. Following the treatment, nuclear proteins were extracted using Nuclear and Cytoplasmic Extraction Reagents (Fisher Scientific), according to the manufacturer's instructions, before performing Western blot using rabbit anti-NF-κB/p65 antibody. Membranes were then stripped and re-probed to detect lamin B1 as the loading control. All primary antibodies were from Santa Cruz.
Statistical analysis
All data are reported as means with their standard errors. Differences in NEC incidence between the two groups were tested using a χ2 test (JMP 9; SAS Institute). Continuous data in the animal study were analysed by a linear mixed model using diet and region (when applicable) as fixed factors and sow and pig as random factors. All cell studies were performed in triplicate or quadruplicate. Comparisons between groups were performed using one-way ANOVA and Tukey's test in GraphPad Prism 5.0 (GraphPad Software, Inc.). Significance was considered at P< 0·05. P values in the range of 0·05–0·1 were considered as non-significant trends.
Results
Clinical assessments
The incidence of NEC was 60 % (n 9/15 pigs) in the CON group compared with 62 % (n 8/13 pigs) in the LF group, with no difference in either NEC incidence or NEC severity (Fig. 1(a)). Within the subgroup of pigs that developed NEC, the degree of NEC severity in the colon was greater in the LF pigs than in the CON pigs (Fig. 1(b)). Average NEC severity scores for both the whole gastrointestinal tract and the small intestine of NEC pigs tended to be greater in the LF pigs than in the CON pigs (P= 0·07 and 0·08, respectively). The two groups did not differ in body weight at birth (965·2 (sem 8·9) g), body-weight gain ( − 3·4 (sem 2·0) g/d) and the relative weights (g/kg body weight, pooled values) of lungs (24·3 (sem 0·4)), liver (30·1 (sem 1·1)), kidneys (10·6 (sem 0·3)), stomach (9·2 (sem 0·7)) and large intestine (16·2 (sem 0·7)) (Table 2). Only the relative heart weight was greater in the LF pigs.
Necrotising enterocolitis (NEC) severity in (a) all pigs and (b) NEC pigs in the small intestine (SI), total gastrointestinal tract (GI) and five gastrointestinal regions (stomach, proximal, middle and distal small intestine, and colon) based on the evaluation of macroscopic tissues. □, Control pigs; ![]() , lactoferrin-enriched formula pigs. Values are means, with their standard errors represented by vertical bars. * Mean value was significantly different that of the control group (P< 0·05). Mean value tended to be greater than that of the control group: † P= 0·08, †† P= 0·07.
, lactoferrin-enriched formula pigs. Values are means, with their standard errors represented by vertical bars. * Mean value was significantly different that of the control group (P< 0·05). Mean value tended to be greater than that of the control group: † P= 0·08, †† P= 0·07.

Necrotising enterocolitis (NEC) incidence and relative organ dimensions in preterm pigs fed with the control formula (CON) and the lactoferrin-enriched formula (LF) (Mean values with their standard errors)
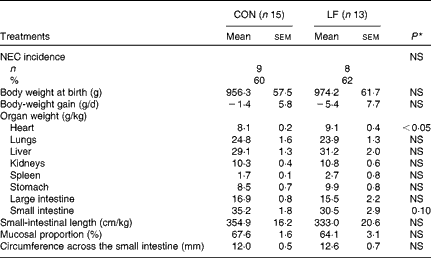
* Mean value was significantly different from that of the control group (P< 0·05).
Mucosal structure, digestive functions and cytokine levels
The dry mucosal proportion (Table 2), villus height and crypt depth (data not shown) were similar in the CON and LF pigs. When considering healthy pigs, the crypt depth of the proximal regions was greater in the LF pigs (88·6 (sem 6·4) μm) than in the CON pigs (80·9 (sem 3·6) μm, P< 0·05) (Fig. 2). All the analysed activities of the brush-border membrane enzymes across the three small-intestinal regions did not differ between the two groups (Supplementary Fig. S1, available online). Sugar absorption measured by a galactose and a lactose test did not differ either. In NEC pigs only, intestinal permeability was greater in the LF pigs than in the CON pigs (P< 0·05; Fig. 3). In contrast, higher levels of IL-1β were observed in the proximal small intestine of the CON pigs than that of the LF pigs (P< 0·05; Fig. 4(a)). In addition, pooled IL-1β contents of the two groups were greater in the colon than in the distal small intestine (P< 0·05; Fig. 4(a)). Conversely, there were no differences in the levels of IL-8 between the two groups in both the proximal and distal small intestine as well as in the colon (Fig. 4(b)).
(a) Villus height, (b) crypt depth and (c) villus:crypt ratio in the proximal and distal small intestine of pigs. Only healthy proximal and distal sections (necrotising enterocolitis (NEC) score 1 or 2) were considered. □, Control pigs;![]() , lactoferrin-enriched formula pigs. Values are means, with their standard errors represented by vertical bars. * Mean value was significantly different from that of the control group (P< 0·05).
, lactoferrin-enriched formula pigs. Values are means, with their standard errors represented by vertical bars. * Mean value was significantly different from that of the control group (P< 0·05).

Nutrient absorption and intestinal permeability in pigs: arterial plasma levels of galactose following (a) a given oral bolus of 5 % galactose (15 ml/kg) for 20 min or (b) an oral bolus of 10 % lactose (15 ml/kg). (c) Ratio of 5 % lactulose:5 % mannitol (15 ml/kg) in urine samples after 3–5 h of an oral bolus of lactulose and mannitol before euthanasia.□, Control pigs;![]() , lactoferrin-enriched formula pigs. Values are means, with their standard errors represented by vertical bars. * Mean value was significantly different from that of the control group (P< 0·05). NEC, necrotising enterocolitis.
, lactoferrin-enriched formula pigs. Values are means, with their standard errors represented by vertical bars. * Mean value was significantly different from that of the control group (P< 0·05). NEC, necrotising enterocolitis.

IL-1β and IL-8 levels in the proximal and distal small-intestinal tissues and the colon tissues. □, Control pigs;![]() , lactoferrin-enriched formula pigs. Values are means, with their standard errors represented by vertical bars. * Mean value was significantly different from that of the control group (P< 0·05). † Pooled mean of the two pig groups was significantly different from that for the distal region (P< 0·05).
, lactoferrin-enriched formula pigs. Values are means, with their standard errors represented by vertical bars. * Mean value was significantly different from that of the control group (P< 0·05). † Pooled mean of the two pig groups was significantly different from that for the distal region (P< 0·05).

Cell proliferation
bLF exerted dose-dependent effects on cell proliferation in vitro (Fig. 5). At low doses (0·01 and 0·1 g/l), bLF stimulated cell proliferation, while at excessive doses (10–20 g/l), it decreased cell proliferation, when compared with the control (no treatment, P< 0·01) (Fig. 5(a)). The addition of the MEK 1/2 inhibitor PD98059 before the treatments, which also inhibits the phosphorylation of ERK 1/2, prevented the proliferative effects induced by bLF at the 0·1 g/l dose (P< 0·05; Fig. 5(b)).
Dose-dependent effects of bovine lactoferrin (bLF) in vitro on cell proliferation regulated by extracellular signal-regulated kinase (ERK). (a) Cells were stimulated with bLF (0·01–20 g/l) in serum-free medium for 48 h. (b) Cells were treated with the ERK inhibitor PD98059 (75 μM) or vehicle (dimethylsulphoxide) for 1 h before stimulation with bLF (0–10 g/l) in either serum-free medium or serum medium for 48 h. Values are absorbance at 490 nm normalised to percentage compared with those from cells treated with (a) serum medium or (b) serum medium plus vehicle. (b) □, Vehicle; ![]() , PD98059. Values are means (n 4), with their standard errors represented by vertical bars. (a) Mean value was significantly different from that of the control group (bLF 0 g/l): *
P< 0·05, ** P< 0·01. (b) * Mean value was significantly different from that of the control (bLF 0 g/l) (P< 0·05). † Mean value was significantly different from that of the vehicle (P< 0·05).
, PD98059. Values are means (n 4), with their standard errors represented by vertical bars. (a) Mean value was significantly different from that of the control group (bLF 0 g/l): *
P< 0·05, ** P< 0·01. (b) * Mean value was significantly different from that of the control (bLF 0 g/l) (P< 0·05). † Mean value was significantly different from that of the vehicle (P< 0·05).

Cytokine secretion modulated by bovine lactoferrin and lipopolysaccharide
PsIc1 cells did not respond to LPS for the secretion of IL-8 (Fig. 6(a)), whereas at doses of 1–10 g/l, bLF stimulation induced IL-8 release. In addition, co-stimulation of bLF and LPS did not differ from the bLF treatments alone. IL-6 release was increased by LPS alone or by bLF at low concentrations (0·01–0·1 g/l; P< 0·05). No differences in IL-6 secretion between LPS and LPS+bLF (0·01–1 g/l)-treated cells were observed (Fig. 6(b)). In contrast, at a dose of 10 g/l, bLF attenuated LPS-induced IL-6 release (P< 0·05).
Dose-dependent effects of bovine lactoferrin (bLF) (0–10 g/l) on lipopolysaccharide (LPS) (0·1 μg/ml)-induced pro-inflammatory cytokine secretion: (a) IL-8 and (b) IL-6. Cells were stimulated with LPS and/or bLF for 24 h. □, Without LPS addition;![]() , with LPS addition (0·1 μg/ml). Values are means (n 3), with their standard errors represented by vertical bars. * Mean value was significantly different from that of the control (no treatment) (P< 0·05). † Mean value was significantly different from that of the LPS-alone treatment (P< 0·05).
, with LPS addition (0·1 μg/ml). Values are means (n 3), with their standard errors represented by vertical bars. * Mean value was significantly different from that of the control (no treatment) (P< 0·05). † Mean value was significantly different from that of the LPS-alone treatment (P< 0·05).

Intracellular signalling regulated by bovine lactoferrin
bLF treatments affected the activation of the ERK pathway in a dose-dependent manner. bLF treatments at doses of 0·1–1 g/l increased ERK activation observed by the phosphorylation of ERK 1/2 (15 min for bLF at 0·1 g/l and 30 min for bLF at 1 g/l compared with the control before gradually decreasing to the control levels after 60–90 min, P< 0·05; Fig. 7(a), (b) and (d)). However, no changes in phosphorylated ERK 1/2 occurred after the treatment with bLF at the dose of 10 g/l (Fig. 7(c) and (d)). At higher doses (10 g/l), bLF did not activate ERK and did not stimulate cell proliferation compared with the control. bLF stimulation at doses of 1 and 10 g/l, but not at 0·1 g/l, caused the cleavage of PARP-1 (P< 0·05) to form a 50 kDa fragment (a marker of necrosis( Reference Whitacre, Zborowska and Willson 31 , Reference Gobeil, Boucher and Nadeau 32 ); Fig. 7(e) and (f)). No fragment of 89 kDa (a marker of apoptosis( Reference Whitacre, Zborowska and Willson 31 , Reference Gobeil, Boucher and Nadeau 32 )) from PARP-1 was formed following bLF stimulation at all the doses tested.
Dose-dependent effects of bovine lactoferrin (bLF) on the phosphorylation of extracellular signal-regulated kinase (ERK) 1/2 and the cleavage of poly(ADP-ribose) polymerase 1 (PARP-1). Cells were stimulated with bLF at a dose of 0·1, 1 or 10 g/l for the time periods indicated. Cell lysates were blotted using the phosphorylated ERK (p-ERK) 1/2 antibody ((a)–(c)) or the PARP-1 antibody (e). Quantitative analysis by the densitometry of representative p-ERK 1/2 bands (d) and 50 kDa PARP-1 fragment (f) normalised relative to the control (no treatment). □, Control (Ctrl); ![]() , bLF 0·1 g/l;
, bLF 0·1 g/l; ![]() , bLF 1 g/l;
, bLF 1 g/l; ![]() , bLF 10 g/l. Values are means (n 3), with their standard errors represented by vertical bars. * Mean value was significantly different from that of the control (P< 0·05). MW, molecular weight.
, bLF 10 g/l. Values are means (n 3), with their standard errors represented by vertical bars. * Mean value was significantly different from that of the control (P< 0·05). MW, molecular weight.

We also studied the role of bLF in the regulation of NF-κB signalling. IκB-α is a protein bound to NF-κB, which prevents the translocation of NF-κB from the cytoplasm into the nucleus( Reference Rautava, Lu and Nanthakumar 33 , Reference Karin and Greten 34 ). Once IκB-α is degraded, NF-κB is released and subsequently translocated into the nucleus to act as a transcription factor to induce cytokine expression. Fig. 8 illustrates a dose-dependent effect of bLF on NF-κB activation. IκB-α was stable at the bLF dose of 0·1 g/l, slightly decreased after 60–90 min at the bLF dose of 1 g/l and was degraded within 30 min after the bLF treatment at the dose of 10 g/l (Fig. 8 (a)–(c) and (e)). These results suggest that only at bLF doses of 1 and 10 g/l, IκB-α degradation will occur and may cause NF-κB translocation, and that the bLF dose of 10 g/l may activate NF-κB more rapidly than that of 1 g/l. Therefore, these doses were chosen to confirm the levels of NF-κB/p65 (p65) in the cell nucleus following stimulation (Fig. 8(d) and (f)). Fig. 8(d) shows that p65 was translocated into the nucleus within 15–30 min and then decreased gradually. Nuclear p65 levels were up-regulated faster and more intensely with the bLF dose at 10 g/l than that at 1 g/l (P< 0·05; Fig. 8(d) and (f)).
Dose-dependent effects of bovine lactoferrin (bLF) on the activation of NF-κB and hypoxia-inducible factor-1α (HIF-1α). Cells were stimulated with bLF at a dose of (a) 0·1, (b) 1 or (c) 10 g/l for the time periods indicated, and cell lysates were blotted using the inhibitor κB-α (IκB-α) antibody or (g) the HIF-1α antibody. (d) Cells were treated with bLF at a dose of 1 or 10 g/l for 15–90 min, and then nuclear extracts were blotted with the NF-κB/p65 antibody. Quantitative analysis by the densitometry of representative (e) IκB-α, (f) NF-κB/p65 and (h) HIF-1α bands normalised relative to the control (no treatment), which is assigned an arbitrary unit of 1. □, Control; ![]() , bLF 0·1 g/l;
, bLF 0·1 g/l; ![]() , bLF 1 g/l;
, bLF 1 g/l; ![]() , bLF 10 g/l. Values are means (n 3), with their standard errors represented by vertical bars. * Mean value was significantly different from that of the control group (P< 0·05). (e, h) † Mean value was significantly different from that of bLF 0·1 g/l for the respective time period (P< 0·05). (f) † Mean value was significantly different from that of bLF 1 g/l for the respective time period (P< 0·05).
, bLF 10 g/l. Values are means (n 3), with their standard errors represented by vertical bars. * Mean value was significantly different from that of the control group (P< 0·05). (e, h) † Mean value was significantly different from that of bLF 0·1 g/l for the respective time period (P< 0·05). (f) † Mean value was significantly different from that of bLF 1 g/l for the respective time period (P< 0·05).

Regarding the HIF-1α signalling pathway, only the bLF dose at 10 g/l led to the up-regulation of HIF-1α levels, compared with the control (no treatment) and lower bLF doses (Fig. 8(g) and (h)).
Discussion
Various bioactive milk components, which are deficient in mature milk and infant formulas, may contribute to the protective effects of human and bovine colostrum against NEC( Reference McGuire and Anthony 7 , Reference Sullivan, Schanler and Kim 8 , Reference Møller, Thymann and Fink 35 ). Supplementation of bioactive proteins at doses similar to those in human or bovine colostrum might exert prophylaxis against inflammation, and may be important for the development of more effective infant formulas for preterm infants. We hypothesised that a high lactoferrin content in human colostrum is one of several important factors necessary to provide protection against NEC development in preterm infants. Moreover, based on the high degree of amino acid homology between human lactoferrin and bLF, a bLF-enriched formula may exert effects similar to those of human lactoferrin. We investigated this in our preterm pig model by administering 10 g/l of bLF-enriched formula, close to the lactoferrin concentration in human colostrum and equivalent to 1·2 g/kg per d in the period of TEN. This dose was greater than those used in previous studies which showed negligible effects against NEC( Reference Manzoni, Rinaldi and Cattani 24 , Reference Togawa, Nagase and Tanaka 25 ) and, consequently, was hypothesised to exert stronger protective effects against NEC. Enteral feeding of a 10 g/l of bLF-enriched formula did not, however, decrease the sensitivity of the pigs to develop NEC. At this dose, bLF appeared to exacerbate disease severity in those pigs that developed NEC compared with CON pigs, as greater NEC severity and intestinal permeability were induced in the LF pigs. In addition, the LF pigs showed a tendency of a less mature gut with a lower small-intestinal weight than the CON pigs. In contrast, an important effect of bLF was the lower levels of IL-1β observed in the proximal small intestine of LF pigs. This may be explained by the ability of bLF to bind LPS derived from intestinal bacteria and thereby restrict LPS in inducing IL-1β release from enterocytes and immune cells( Reference Håversen, Ohlsson and Hahn-Zoric 19 ). bLF may act in a similar manner to limit IL-8 release; however, bLF itself can also activate the NF-κB pathway and stimulate the release of IL-8 from enterocytes, as shown in the present in vitro data. Therefore, two contrary effects of bLF on IL-8 release may cause similar levels of IL-8 in the intestinal tissues of CON and LF pigs. Lower doses of bLF administration could be beneficial to the immature intestine exerting bLF–LPS binding and also limiting excessive amounts of unbound bLF from stimulating unnecessary immune responses leading to a high release of IL-8.
To our knowledge, the present animal study is the first study to investigate the effects of bLF against NEC in preterm pigs at a dose close to that present in human colostrum. In germ-free newborn pigs, a high dose of bLF (20 g/l of bLF in formula-fed pigs every 4 h) evoked protective effects against lethal shock induced by endotoxin( Reference Lee, Farmer and Hilty 36 ). The opposing effects of bLF demonstrated in the present study may be explained by both gut prematurity and colonisation. The morphology of the immature gut and the immune system of preterm pigs may lead to different immune responses and inflammatory cascades under the presence of bLF at high doses (10–20 g/l), compared with that in term pigs. Therefore, the amounts of bioactive protein supplemented to infant formulas may be very crucial depending on whether it is administered to term or preterm infants. An oral administration of bLF decreased dextran sulphate sodium-induced colitis, inflammatory lesions, degree of colon shortening, as well as attenuated pro-inflammatory cytokines such as IL-6, IL-1β and TNF-α in 7-week-old rats when administered at lower doses of bLF (0·24–0·4 g bLF/kg per d)( Reference Togawa, Nagase and Tanaka 25 ) than that used in the present study. A direct comparison of the results is, however, difficult due to the differences in species and the degree of prematurity. Although the dextran sulphate sodium model of colitis correlates in several parameters with human inflammatory bowel disease, it does not reflect the intestinal inflammatory state that we observe in preterm pigs that developed NEC spontaneously in response to enteral feeding( Reference Adamkin 16 , Reference Fischer, Debbabi and Blais 37 ). In another study, bLF (0·1 g bLF/d) given to low-birth-weight infants prevented late-onset sepsis, but not NEC( Reference Manzoni, Rinaldi and Cattani 24 ). However, when a bLF dose of 100 mg/d was administered together with Lactobacillus rhamnosus GG, an attenuation of NEC incidence was observed( Reference Manzoni, Rinaldi and Cattani 24 ). This suggests that bLF may influence the gastrointestinal tract in synergistic ways with other bioactive components, such as probiotics.
The earlier studies showing the prophylaxis of bLF against dextran sulphate sodium-induced colitis and sepsis but not NEC (0·24–0·4 g bLF/kg per d( Reference Togawa, Nagase and Tanaka 25 ) and 0·1 g bLF/d( Reference Manzoni, Rinaldi and Cattani 24 )) together with our observations of the detrimental effects of bLF at a higher dose (1·2 g/kg per d) against NEC, but a positive effect on the IL-1β reduction led to the hypothesis that the protective effects of bLF against NEC and inflammation may be dose-dependent. For this purpose, different doses of bLF were tested in vitro. The present results illustrate that bLF interacts with intestinal epithelial cells in a dose-dependent manner between bLF concentrations of 0·1, 1 and 10 g/l. These amounts of bLF are similar to those found in bovine term milk, bovine colostrum/human term milk and human colostrum, respectively( Reference Marshall 9 – Reference Baker and Baker 11 ). Lactoferrin has been reported to be stable during gastrointestinal digestion in infants( Reference Chatterton, Rasmussen and Heegaard 10 , Reference Eriksen, Holm and Jensen 38 ), and therefore its major proportion from enteral feeding will be present in the gut lumen to interact with enterocytes. Levels of bLF administered during enteral feeding will, however, not be equivalent to the concentrations finally interacting with the epithelium due to dilution of the administered dose by gastric and pancreatic secretions. However, in some locations of the small intestine, a large amount of water and solutes are absorbed by passive or active transport( Reference Hinsberger and Sandhu 39 ), which will result in higher concentrations of bLF. Therefore, the range of 0·1–10 g/l of bLF doses tested in vitro was reasonable for mechanistic investigation. In the present study, low doses of bLF (0·1–1 g/l) stimulated cell proliferation through the activation of the ERK pathway, prevented IL-8 secretion and inhibited the activation of both NF-κB and HIF-1α. In contrast, at higher concentrations (1–10 g/l), bLF exerted a suppression of cell growth and inhibited ERK activation, leading to IL-8 secretion and NF-κB and HIF-1α activation.
Similar results from low doses of bLF (0·4 g/l) on intestinal cell proliferation have been observed previously, which were also mediated through ERK activation( Reference Jiang, Lopez and Kelleher 18 ). A dose-dependent effect has also been reported for concentrations of bLF at the lower range of 0·1–1000 μg/ml( Reference Buccigrossi, De Marco and Bruzzese 17 ). Additionally, a greater stimulatory effect has been observed for apo-bLF on proliferation( Reference Jiang, Lopez and Kelleher 18 ). Moreover, the increase in cell proliferation following stimulation with bLF at doses of 0·1–1 g/l and the suppressive effect of the inhibitor PD98059 on cell proliferation at the bLF dose of 0·1 g/l suggest that ERK 1/2 activation is involved in cell proliferation induced at low doses of bLF. This effect implies that at appropriate levels, bLF is likely to stimulate the maturation of the small intestine in newborn infants through ERK 1/2. The activation of ERK 1/2, a member of mitogen-activated protein kinase pathway family, has been extensively correlated with cell proliferation in various studies( Reference Jiang, Lopez and Kelleher 18 , Reference Pearson, Robinson and Beers Gibson 40 , Reference Boutros, Chevet and Metrakos 41 ), and these results also support this involvement. In contrast, at a higher dose (10 g/l), bLF did not activate ERK 1/2, and a lower rate of cell proliferation than in control cells was observed, indicating that cell death may occur. The generation of the 50 kDa fragment from PARP-1 observed in the present study suggests that bLF concentrations between 1 and 10 g/l stimulate cell necrosis, but not apoptosis, and these results agree with the observation of poor cell proliferation at the bLF dose of 10 g/l.
Data from both the in vivo pig study and also from the in vitro cell proliferation studies raised questions whether high bLF doses led to a negative impact and excessive inflammation in preterm neonates. Several studies have indicated that inflammation and NEC are related to high levels of inflammatory cytokines such as IL-8 and IL-6 in the gut( Reference Ando, Hasegawa and Shindo 42 – Reference Markel, Crisostomo and Wairiuko 44 ). Therefore, we tested the release of IL-8 and IL-6 following stimulation with both LPS and bLF in vitro. LPS stimulation of PsIc1 cells induced IL-6 but not IL-8 secretion. bLF treatments caused changes in the levels of IL-6, but at the dose of 10 g/l, it attenuated LPS-induced IL-6 release. bLF may in this way bind to LPS and thereby limit the inductive effect of LPS on IL-6( Reference Håversen, Ohlsson and Hahn-Zoric 19 ). This may also explain the greater levels of IL-1β observed in the proximal small intestine of the group CON group compared with the LF group in the pig study. The lack of changes in the levels of IL-8 between the LPS and LPS+bLF treatments illustrates that bLF itself may be the main factor for IL-8 release in the range of 1–10 g bLF/l. On the other hand, some bioactive proteins decreased LPS-induced IL-8 release in the more LPS-sensitive cell line (H4)( Reference Rautava, Nanthakumar and Dubert-Ferrandon 45 , Reference Claud, Savidge and Walker 46 ), which indicate that in those cells, particularly low doses of bLF may also attenuate LPS-induced IL-8 secretion evoked by bLF–LPS binding. Cytokine data in the present in vivo and in vitro studies suggest that bLF can bind to LPS of the intestinal bacteria and prevent excessive immune responses, and that high bLF doses itself can initiate IL-8 release.
We observed an effect of bLF on NF-κB activation only by stimulation at the dose of 10 g/l but not at lower doses (Fig. 8). As an indicator of inflammation, NF-κB leads to the release of IL-8( Reference Rautava, Lu and Nanthakumar 33 , Reference Karin and Greten 34 ). Our data showed that bLF at a concentration of 10 g/l stimulates the release of IL-8 and activates the NF-κB pathway by p65 nuclear translocation. This may be related to the negative effect of bLF concentration at 10 g/l observed in the pig study, indicating the activation of NF-κB in the intestine of the LF pigs in an excessive manner, thereby causing more severe inflammation rather than protecting them against NEC. Our findings regarding the activation of NF-κB following stimulation with bLF are in accordance with several studies performed in neutrophils( Reference Ando, Hasegawa and Shindo 42 , Reference Oh, Pyo and Kim 47 , Reference Oh, Lee and Lee 48 ). In contrast, some studies have shown that bLF may exert anti-inflammatory effects by attenuating LPS-induced IL-8 or TNF-α( Reference Berlutti, Schippa and Morea 20 , Reference Kruzel, Harari and Mailman 49 ), or inhibit NF-κB, TNF receptor-associated factor 6 (TRAF-6) and p38 pathways induced by LPS( Reference Inubushi, Kawazoe and Miyauchi 50 ). These studies were conducted at bLF concentrations below 1 g/l, which may be the reasons for no observed negative effects such as NF-κB activation by bLF itself.
The up-regulation of HIF-1α is normally observed under hypoxic conditions and during Fe deficiency, which limit the automatic degradation of HIF-1α. Up-regulated HIF-1α stimulates the transcription of a multitude of genes involved in cell survival under stress conditions( Reference Colgan and Taylor 51 ). The apo-form of bLF has been found to bind intracellular free Fe in rats, thereby subsequently stabilising HIF-1α( Reference Jung, Isaacs and Lee 22 , Reference Zakharova, Kostevich and Sokolov 23 , Reference Colgan and Taylor 51 ). Stabilisation or up-regulation of HIF-1α was indicated as a possible therapy for intestinal bowel disease due to the promotion of barrier functions( Reference Colgan and Taylor 51 ). However, this protein has been correlated with hypoxic inflammation, and it is up-regulated as a consequence of NF-κB and cyclo-oxygenase-2 activation induced by IL-1β( Reference Jung, Isaacs and Lee 22 ). HIF-1α is also activated by cell stimulation with TNF-α or NO, and it participates in several inflammatory responses( Reference Jung, Isaacs and Lee 22 ). Therefore, an up-regulation of HIF-1α and NF-κB after the bLF treatment at a dose of 10 g/l, as shown in the present study, can be detrimental to the cells, for instance causing cell necrosis, inhibiting cell proliferation and releasing high levels of IL-8. To our knowledge, this is the first time bLF has been shown to exert a dose-dependent effect on HIF-1α up-regulation in intestinal cells. In the future, the crosstalk and synergistic effects of HIF-1α and NF-κB could be interesting to pursue to clarify the roles of these pathways mediated by bLF.
Overall, this preterm pig study indicates that a bLF dose of 10 g/l lowers IL-1β levels in the proximal small intestine, but does not protect preterm pigs against NEC. bLF at this dose tends to exacerbate NEC severity and decrease intestinal functions by lowering small-intestinal weight and increasing intestinal permeability in pigs that develop NEC. In combination with the in vitro experiments exploring a range of bLF doses, the present study suggests that only lower doses of lactoferrin may potentially be beneficial for preterm neonates to dampen the inflammatory mediators. Consequently, the supplementation of infant formulas with appropriate levels of bLF should be more carefully studied before its usage for preterm infants. Further pig studies are necessary to investigate the effects of various bLF doses before concluding any protective effects of this protein in vivo.
Supplementary material
To view supplementary material for this article, please visit http://dx.doi.org/10.1017/S0007114513002456
Acknowledgements
We would like to thank Mette Schmidt, Bente Winther Synnestvedt and Mandy Joanne Greig for help with animal procedures and Elin Skytte for laboratory assistance. We also thank Mette Viberg Østergaard for setting up cell culture protocols for PsIc1 cells.
The present study was supported by the Danish Dairy Research Foundation. The Danish Dairy Research Foundation had no role in the design, analysis or writing of this article.
Y. L. is employed by Arla Foods Ingredients. Although Y. L. participated in the design of the study and interpretation of the results, the responsibility for the final manuscript was taken with the remaining authors who have no potential conflicts of interest.
D. E. W. C., P. T. S., S. B. B. and D. N. N. contributed to the concept and design of the study. D. N. N. was responsible for the in vitro studies. D. N. N. and Y. L. conducted the animal study and performed the data analysis. All authors contributed to the data interpretation and manuscript writing. D. N. N. had primary responsibility for the final content. All authors accepted the final manuscript.


