


Introduction
Past states in the composition of marine ecosystems can be reconstructed on the basis of sediment cores (Yasuhara and Yamazaki Reference Yasuhara and Yamazaki2005; Pandolfi and Jackson Reference Pandolfi and Jackson2006; Gooday et al. Reference Gooday, Jorissen, Levin, Middelburg, Naqvi, Rabalais, Scranton, M. and Zhang2009; Cramer et al. Reference Cramer, Jackson, Angioletti, Leonard-Pingel and Guilderson2012; Kowalewski et al. Reference Kowalewski, Wittmer, Dexter, Amorosi and Scarponi2015; Price et al. Reference Price, Baustian, Turner, Rabalais and Chmura2018). However, the interpretation of ecosystem baselines on the basis of Holocene stratigraphic archives faces challenges due to (1) stratigraphic mixing (Walbran et al. Reference Walbran, Henderson, Faithful, Polach, Sparks, Wallace and Lowe1989; Loubere and Gary Reference Loubere and Gary1990; Bentley and Sheremet Reference Bentley and Sheremet2003; Kosnik et al. Reference Kosnik, Hua, Jacobsen, Kaufman and Wüst2007) and (2) differences in the type of sedimentary records preserved in transient mixed layers and permanent subsurface layers (Wheatcroft and Drake Reference Wheatcroft and Drake2003; Bentley et al. Reference Bentley, Sheremet and Jaeger2006; Löwemark et al. Reference Löwemark, Konstantinou and Steinke2008; Tomašových et al. Reference Tomašových, Kidwell, Foygel Barber and Kaufman2014). In contrast to archives formed by laminated sediments under anoxic conditions, bioturbated increments do not map to discrete sediment age but rather summarize the central tendency of age-frequency distributions of sedimentary particles (Kowalewski et al. Reference Kowalewski, Goodfriend and Flessa1998; Tomašových and Kidwell Reference Tomašových and Kidwell2010; Johannessen and Macdonald Reference Johannessen and Macdonald2012). Understanding the effects of mixing is particularly important in assessments of ecosystems subjected to perturbations occurring at temporal scales shorter than scales of sediment aggradation (Lotze et al. Reference Lotze, Lenihan, Bourque, Bradbury, Cooke, Kay, Kidwell, Kirby, Peterson and Jackson2006; Willis et al. Reference Willis, Araújo, Bennett, Figueroa-Rangel, Froyd and Myers2007; Kidwell Reference Kidwell2015) and in evaluation of preservation of stratigraphic markers that can define the onset of major anthropogenic signals in the sedimentary record (Wolfe et al. Reference Wolfe, Hobbs, Birks, Briner, Holmgren, Ingólfsson, Kaushal, Miller, Pagani, Sarosi and Vinebrooke2013). Such assessments frequently require annual, decadal, or subcentennial resolution.
Assuming relatively high sedimentation rates close to 1 cm/yr, that is, values close to the upper estimates of sedimentation rates on continental shelves (Sommerfield Reference Sommerfield2006), the twentieth-century sedimentary record will be captured in ~100-cm-long sediment cores. Such thickness is frequently affected by bioturbation reaching several decimeters or even a few meters below the sediment–water interface (Bentley and Nittrouer Reference Bentley and Nittrouer2012; Parsons-Hubbard et al. Reference Parsons-Hubbard, Hubbard, Tems and Burkett2014). Stratigraphic patterns can be deconvolved to pre-bioturbation signals (Hull et al. Reference Hull, Franks and Norris2011; Steiner et al. Reference Steiner, Lazar, Levi, Tsroya, Pelled, Bookman and Erez.2016) but such approaches require information on depth-dependent changes in bioturbation and can be limited under very slow sedimentation rate and high mixing (Schiffelbein Reference Schiffelbein1985). However, dating a large number of shells, for example, by amino acid racemization calibrated by radiocarbon (Allen et al. Reference Allen, Kosnik and Kaufman2013; Kosnik et al. Reference Kosnik, Hua, Kaufman and Zawadzki2015), allows us to determine the age-frequency distribution (AFD) in any stratigraphic increment. The AFD is a function of shell loss (driven by shell disintegration and/or by shell movement to underlying or overlying increments) and production (Tomašových et al. Reference Tomašových, Kidwell and Foygel Barber2016), and it can be used not only to determine temporal resolution of assemblages in stratigraphic increments (Flessa and Kowalewski Reference Flessa and Kowalewski1994; Kidwell et al. Reference Kidwell, Best and Kaufman2005; Scarponi et al. Reference Scarponi, Kaufman, Amorosi and Kowalewski2013) but also to detect changes in production occurring at a temporal resolution finer than the resolution of stratigraphic increments (Tomašových and Kidwell Reference Tomašových and Kidwell2017; Tomašových et al. Reference Tomašových, Gallmetzer, Haselmair, Kaufman, Vidović and Zuschin2017).
Eutrophication is one of the major anthropogenic impacts affecting marine benthic communities (Rabalais et al. Reference Rabalais, Turner, Diaz and Justić2009). More abundant food supply driven by eutrophication can promote growth of benthic fauna in open ocean-facing ecosystems with sufficient circulation (Beukema and Cadée Reference Beukema and Cadée1991), but can also enhance or trigger hypoxia or anoxia in ecosystems susceptible to stratification (Breitburg et al. Reference Breitburg, Levin, Oschlies, Grégoire, Chavez, Conley, Garçon, Gilbert, Gutiérrez, Isensee, Jacinto, Limburg, Montes, Naqvi, Pitcher, Rabalais, Roman, Rose, Seibel, Telszewski, Yasuhara and Zhang2018). Here, we assess the effects of eutrophication on the composition and functioning of macrobenthic communities in the northern Adriatic Sea (Fig. 1), which is prone to seasonal water-column stratification. We evaluate the timing of shifts in abundance of the opportunistic bivalve Corbula gibba in sediment cores, test whether these shifts correlate with concentrations of dissolved oxygen, and assess whether temporal changes in bioturbation can be detected by down-core trends in time averaging and stratigraphic disorder. We follow Gofas (Reference Gofas2008) in using the genus name Corbula, although Anderson and Roopnarine (Reference Anderson and Roopnarine2003) suggested that the valid genus name of this species is Varicorbula. This species presently dominates in molluscan communities in the NE and NW Adriatic Sea (Aleffi and Bettoso Reference Aleffi and Bettoso2000; N’Siala et al. Reference N’Siala, Grandi, Iotti, Montanari, Prevedelli and Simonini2008; Mavric et al. 2010; Nerlović et al. Reference Nerlović, Doğan and Hrs-Brenko2011, Reference Nerlović, Hrs-Brenko and Dogan2012; Franzo et al. Reference Franzo, Cibic, Del Negro and De Vittor2015). It tolerates sediment pollution and is able to survive seasonal hypoxic crises (Diaz and Rosenberg Reference Diaz and Rosenberg1995; Riedel et al. Reference Riedel, Zuschin and Stachowitsch2012). Therefore, assemblages with high abundances of C. gibba can represent tracers of natural or anthropogenic disturbance over the past 500 years (Tomašových et al. Reference Tomašových, Gallmetzer, Haselmair, Kaufman, Vidović and Zuschin2017) or over longer timescales (Dominici Reference Dominici2001; Zuschin et al. Reference Zuschin, Harzhauser and Mandic2007, Reference Zuschin, Harzhauser, Hengst, Mandic and Roetzel2014; Scarponi and Kowalewski Reference Scarponi and Kowalewski2004). In this study, we focus on the twentieth century, when a major increase in eutrophication and the frequency of hypoxic and mucilage events is documented by historical data from the northern Adriatic Sea (Fig. 2; Marchetti et al. Reference Marchetti, Provini and Crosa1989; Harding et al. Reference Harding, Degobbis and Precali1999; Justić Reference Justić1991) and worldwide (Carstensen et al. Reference Carstensen, Andersen, Gustafsson and Conley2014; Breitburg et al. Reference Breitburg, Levin, Oschlies, Grégoire, Chavez, Conley, Garçon, Gilbert, Gutiérrez, Isensee, Jacinto, Limburg, Montes, Naqvi, Pitcher, Rabalais, Roman, Rose, Seibel, Telszewski, Yasuhara and Zhang2018). Although the twentieth-century increase in eutrophication in the northern Adriatic Sea (Barmawidjaja et al. Reference Barmawidjaja, Van der Zwaan, Jorissen and Puskaric1995; Notar et al. Reference Notar, Leskovšek and Faganeli2001; Sangiorgi and Donders Reference Sangiorgi and Donders2004; Zonneveld et al. Reference Zonneveld, Chen, Elshanawany, Fischer, Hoins, Ibrahim, Pittauerova and Versteegh2012) was followed by an oligotrophization trend since the 1990s (Cozzi et al. Reference Cozzi, Falconi, Comici, Čermelj, Kovac, Turk and Giani2012; Giani et al. Reference Giani, Djakovac, Degobbis, Cozzi, Solidoro and Umani2012; Djakovac et al. Reference Djakovac, Supić, Aubry, Degobbis and Giani2015), hypoxic and mucilage events also affected the northern Adriatic Sea in the earliest twenty-first century (Alvisi and Cozzi Reference Alvisi and Cozzi2016; Cibic et al. Reference Cibic, Comici, Bussani and Del Negro2012).
(A), Location of two stations at 21 m depth at the Po prodelta (Po 3 and Po 4) and one station at 12 m depth in the Bay of Panzano at the Isonzo prodelta (Panzano). External and internal surfaces of a right valve (B, C, UAL11620) and left valve (D, E, UAL11616) of Corbula gibba collected at 4–6 cm sediment depth at Po 4. Scale bar: 5 mm.

The history of eutrophication in the northern Adriatic Sea, with total fertilizer use in Italy (A), northern Italy use of nitrogen and phosphorus (B), minimum monthly dissolved oxygen concentrations (C), maximum daily discharge of the Po and Isonzo Rivers (D), and sea-surface temperature (E). The gray horizontal lines in D refer to years with major flood events of the Po River when daily discharge exceeded 8000 m3/s. The total fertilizer use in Italy between 1961 and 2006 is from an online data set of agriculture statistics (NationMaster 2018), the fertilizer use per hectare (kg of nutrients) is from Federico and Malanima (Reference Federico and Malanima2004), and the fertilizer use in northern Italy is from Justić (Reference Justić1991). The sources of other data are explained in “Methods.”

Long-term records of nutrient concentrations, phytoplankton biomass, and primary productivity in the northern Adriatic Sea are available mainly for the second half of the twentieth century (Degobbis et al. Reference Degobbis, Precali, Ivancic, Smodlaka, Fuks and Kveder2000; Giani et al. Reference Giani, Djakovac, Degobbis, Cozzi, Solidoro and Umani2012). Therefore, it is unclear what oceanographic and trophic conditions characterized this region in the early twentieth century. Crema et al. (Reference Crema, Castelli and Prevedelli1991) and Chiantore et al. (Reference Chiantore, Bedulli, Cattaneo-Vietti, Schiaparelli and Albertelli2001) suggested that soft-bottom macrobenthic communities shifted toward the dominance of opportunistic species during the twentieth century. However, the early twentieth-century survey data of macrobenthic communities are limited before the 1960s (Vatova Reference Vatova1935, Reference Vatova1949), and analyses of the early and late twentieth-century surveys are compromised by differences in sampling protocol and mesh size (Scardi et al. Reference Scardi, Crema, Di Dato, Fresi and Orel2000). Here, we specifically test whether this temporal shift in the composition of macrobenthic communities based on monitoring of living assemblages can be validated on the basis of sediment cores and whether it can be attributed to eutrophication. Tomašových et al. (Reference Tomašových, Gallmetzer, Haselmair, Kaufman, Vidović and Zuschin2017) and Gallmetzer et al. (Reference Gallmetzer, Haselmair, Tomašových, Stachowitsch and Zuschin, M.2017) analyzed changes in the composition of molluscan communities in 1.5-m-long sediment cores over the past ~500 years in the Gulf of Trieste (see also Vidović et al. [Reference Vidović, Nawrot, Gallmetzer, Haselmair, Tomašových, Stachowitsch, Ćosović and Zuschin2016] for changes in foraminiferal assemblages). Here, we focus solely on the twentieth-century portion of these sediment cores from the Isonzo prodelta (NE Adriatic), and expand our spatial coverage to the Po prodelta (NW Adriatic) by adding sediment cores from two other sampling stations that cover the twentieth-century period, and thus assess temporal changes both in the NE and NW Adriatic Sea.
First, we estimate sedimentation rates and mixing with (1) sediment 210Pb and (2) radiocarbon-calibrated amino acid racemization (AAR) of shells and test whether disorder and temporal resolution differ between sediments deposited before (early twentieth century) and after the onset of major eutrophication (late twentieth century). Second, we evaluate stratigraphic trends in the composition of molluscan assemblages. Third, we compare raw stratigraphic trends in the absolute and proportional abundance of C. gibba with abundance trends of unmixed age cohorts, reconstructed on the basis of down-core changes in the shape of postmortem AFDs. Fourth, we compare the abundance records with historical trends in the concentration of dissolved oxygen (Justić et al. Reference Justić, Legović and Rottini-Sandrini1987; Djakovac et al. Reference Djakovac, Supić, Aubry, Degobbis and Giani2015). We also evaluate other mechanisms that can promote outbreaks of C. gibba, including (1) fluctuations of river discharge, because sediment deposited during major river floods can increase sediment instability; and (2) sea-surface temperature as an index of regional climate. Warming can prolong water-column stratification (Malej and Malacic Reference Malej and Malacic1995) and increase the probability of mucilage events, and thus can increase the probability of benthic mass-mortality events (Stachowitsch Reference Stachowitsch1984; Coma et al. Reference Coma, Ribes, Serrano, Jiménez, Salat and Pascuals2009).
Methods
Setting and Sampling
We analyze sediment cores collected at three stations in 2013, with two stations located in the Po prodelta in the NW Adriatic, and one station in the Isonzo prodelta in the Gulf of Trieste in the NE Adriatic. These two deltaic systems are characterized by the highest sediment accumulation rates in the northern Adriatic Sea (Frignani et al. Reference Frignani, Langone, Ravaioli, Sorgente, Alvisi and Albertazzi2005; Covelli et al. Reference Covelli, Fontolan, Faganeli and Ogrinc2006) and thus can represent high-resolution stratigraphic archives (Scarponi and Kowalewski Reference Scarponi and Kowalewski2007; Wittmer et al. Reference Wittmer, Dexter, Scarponi, Amorosi and Kowalewski2014). All stations represent soft-bottom, nonvegetated, oligophotic to aphotic habitats affected by high turbidity. Station Po 3 (44.842183°N, 12.538833°E) is located at 21 m depth, west of the Po di Tolle lobe of the Po River delta. South of Po 3, Station Po 4 (44.730533°N, 12.440217°E) is located at 21 m depth, southeast of the Goro-Gnocca lobe. Station Panzano is located in the Isonzo prodelta in the northern Gulf of Trieste at 12 m water depth (45.735400°N, 13.600467°E) (Fig. 1). The seafloor at the Po prodelta is affected by decadal-scale deposition of few laminated, centimeter-thick flood layers (Tesi et al. Reference Tesi, Miserocchi, Goñi, Turchetto, Langone, De Lazzari, Albertazzi and Correggiari2011, Reference Tesi, Langone, Goni, Wheatcroft, Miserocchi and Bertotti2012). At our two stations, the seafloor is formed by muds with high abundance of mounds generated by the thalassinid shrimp Jaxea nocturna and by worm tubes of the polychaete Sabella pavonina (Fig. 3A–C). The seafloor at Panzano in the northern Gulf of Trieste is characterized by muds with abundant epifaunal clumps formed by sponges, ascidians, ophiurids, polychaetes, and bivalves (Fig. 3D; Zuschin and Stachowitsch Reference Zuschin and Stachowitsch2009).
Bottom conditions typical of the two areas. The muddy seafloor at the Po prodelta is formed by frequent mounds of the shrimp Jaxtea nocturna at Po 3 (~1 m2 of seafloor is covered in A and the close-up of the burrow is ~25 cm2 in B) and by tube-dwelling polychaete worms Sabella pavonina sticking up 10–12 cm above the sediment at Po 4 (C). D, The muddy seafloor in the Bay of Panzano with shelly debris and epifaunal clumps with polychaetes, anemones, and ophiuroids an area of about 15 × 25 cm. A–C, Photographs by Ivo Gallmetzer and Alexandra Haselmair; D, photograph by Michael Stachowitsch.

Four closely positioned cores, 150–155 cm long, were sampled at each station in 2013 with an UWITEC® piston corer (Gallmetzer et al. Reference Gallmetzer, Haselmair, Stachowitsch and Zuschin2016). Changes in abundance of C. gibba were measured in two 16-cm-diameter cores at each station (M13 and M14 cores at Po 3, M20 and M21 cores at Po 4, and M28 and M29 cores at Panzano). The other two cores with 9 cm diameter were used for measurements of 210Pb activities in bulk sediment and for measurements of concentrations of total organic content (TOC) and total nitrogen (TN). Ages of C. gibba were assessed in cores M13 and M21 (this study) and in M28 (Tomašových et al. Reference Tomašových, Gallmetzer, Haselmair, Kaufman, Vidović and Zuschin2017). Molluscan shells were sieved with a 1 mm mesh size. All bivalves and gastropod specimens with hinge line or apex preserved were counted and identified to the species level. In bivalves, abundance was calculated by adding the number of double-valved specimens to whichever number of single valves (right or left) was higher. In chitons, abundance was estimated by adding the higher number of terminal plates to the number of dorsal plates divided by six. For scaphopods, the number of entire individuals was added to the higher number of apex or base fragments (Gallmetzer et al. Reference Gallmetzer, Haselmair, Tomašových, Stachowitsch and Zuschin, M.2017). We assess the relation between absolute and proportional abundances of C. gibba and concentrations of TOC and TN with partial Spearman rank correlation and with generalized least-square models, modeling the temporal structure of residuals with the autoregressive process of order 1 (Beguería and Pueyo Reference Beguería and Pueyo2009). We evaluate stratigraphic changes in the composition of communities on the basis of square-root-transformed proportional abundances of molluscan species (other than Corbula gibba) and Bray-Curtis dissimilarities with nonmetric multidimensional scaling (NMDS). We exclude the bivalve Anadara transversa, which immigrated to the northern Adriatic Sea in the 1970s (Albano et al. Reference Albano, Gallmetzer, Haselmair, Tomašových, Stachowitsch and Zuschin2018), and test differences in species composition between the early and late twentieth-century communities with nonparametric permutational multivariate analysis of variance (PERMANOVA; Anderson Reference Anderson2001).
210Pb, Amino Acid Racemization, and Radiocarbon Calibration
Activities of 210Pb and 226Ra were analyzed in 2-cm-thick increments in the upper 20 cm and in 5-cm-thick increments between 20 and 40 cm by gamma spectrometry with a high-purity germanium detector system (Supplementary Table 1). AAR analysis was carried out at Northern Arizona University using reverse-phase high-pressure liquid chromatography (Kaufman and Manley Reference Kaufman and Manley1998). Tomašových et al. (Reference Tomašových, Gallmetzer, Haselmair, Kaufman, Vidović and Zuschin2017) presented calibration of AAR in C. gibba shells by 14C on the basis of 11 dead shells and 3 live-collected shells from the Gulf of Trieste, with the time-dependent reaction kinetic model (TDK; Allen et al. Reference Allen, Kosnik and Kaufman2013) for aspartic acid (Asp) D/L (ratio of dextrorotatory and levorotatory enantiomers), being the best model (Fig. 4A), with the initial D/L value estimated from data (TDK1). The calibration equation is:
 $$a{\asterisk}{\rm arctanh}\left( {\left[ {{\rm DL}{\minus}{\mathop{\rm DL}\nolimits} _{0} } \right]\,/\,\left[ {1{\minus}{\rm DL}{\asterisk}{\rm DL}_{0} } \right]} \right)^{b} $$
where DL is Asp D/L, DL0 is Asp D/L at 0 years (here, 0.028), a=87855.52, and b=2.531196. The uncertainty is defined by the log-normal distribution, with the mean equal to the age estimate and the variance equal to 0.056. Using the uncertainty defined by the gamma distribution, the simple power-law kinetic model for Asp D/L, with the initial D/L value fixed at 0, was the best model (Fig. 4B). Although shells from the Po prodelta were not used in the calibration, (1) the bottom-water temperatures at Po and Isonzo prodeltas are very similar, with mean monthly temperatures ranging between 8°C and 28°C in both regions (Gacic et al. Reference Gacic, Civitarese and Ursella1999), and (2) our calibration equation closely correlates with the results from Scarponi et al. (Reference Scarponi, Kaufman, Amorosi and Kowalewski2013), who calibrated AAR of C. gibba independently on the basis of five shells from the Po delta (Fig. 4C). Thirty specimens were selected at random from 12 to 14, approximately equally spaced increments of M13, M21, and M28 cores, or all specimens were selected if the total number of specimens was smaller. Thirteen specimens at M13, 14 specimens at M21, and 18 specimens at M28 were flagged as outliers according to screening criteria of Kosnik and Kaufman (Reference Kosnik and Kaufman2008) and were removed from analyses. In total, 252 shells of C. gibba from 14 increments in M13 and 243 shells from 14 increments in M21 were used in analyses. AAR data of shells from the two Po cores are presented here for the first time. AAR data of 311 shells from 12 increments in M28 were presented by Tomašových et al. (Reference Tomašových, Gallmetzer, Haselmair, Kaufman, Vidović and Zuschin2017). All amino acid data and shell ages are listed in Supplementary Table 2.
A and B, Relation between postmortem age (determined by 14C) and D/L values of aspartic acid (Asp) for Corbula gibba, best fit by TDK1 (time-dependent reaction kinetics) and SPK0 (simple power-law kinetics with the initial D/L value fixed at zero) models, respectively, on the basis of Bayesian information criterion, and assuming that uncertainty follows the log-normal (A) and the gamma distributions (B). Black points refer to 11 dead shells and 3 live-collected shells from the Gulf of Trieste that were used in our calibration. White points refer to five individuals from the Po delta dated by Scarponi et al. (Reference Scarponi, Kaufman, Amorosi and Kowalewski2013). Light-gray shading corresponds to 95% prediction intervals for the age of a given specimen; dark-gray shading corresponds to 95% confidence intervals for median age. Five shells with the oldest ages were collected in a sediment core sampled in the Bay of Piran. In C, calibration of Scarponi et al. (Reference Scarponi, Kaufman, Amorosi and Kowalewski2013) based on Asp D/L of C. gibba shells from the Po delta correlates closely with calibration used in this study. Error bars correspond to 95% prediction intervals.

Sedimentation Rate
The fully mixed layer (FML) refers here to a stratigraphic interval where 2- or 4-cm-thick core increments do not differ in median age of shells (surface-mixed layer; Wheatcroft et al. Reference Wheatcroft, Wiberg, Alexander, Bentley, Drake, Harris and Ogston2007). The maximum depth of bioturbation is typically below the FML. The FML is age homogenized and thus cannot be used for estimation of sedimentation rates. We assess net sedimentation rates by (1) estimating the slope of the decay in excess 210Pb between 20 and 90 cm at Po and between 6 and 30 cm at Panzano (i.e., down to the appearance of background levels) according to the constant flux–constant sedimentation model (Sanchez-Cabeza and Ruiz-Fernández Reference Sanchez-Cabeza and Ruiz-Fernández2012) and (2) dividing the sediment thickness by the median age of C. gibba at the sediment depth comparable to 210Pb dating (at 85 cm at Po and at 35 cm at Panzano).
Time Averaging and Disorder
We estimate time averaging with the interquartile range (IQR) of C. gibba ages in (1) three 20- to 70-cm-thick stratigraphic units defined according to sedimentologic and geochronological criteria (units 1–3) and (2) 4- or 5-cm-thick increments. The three units correspond to (1) the early twentieth century (lower unit 1), (2) the late twentieth century (middle unit 2), and (3) the earliest twenty-first century (upper unit 3). Age uncertainty associated with calibrating the rate of AAR increases with age (Yanes et al. Reference Yanes, Kowalewski, Ortiz, Castillo, de Torres and de la Nuez2007). Therefore, we compute the component of time averaging expected purely due to the calibration error by estimating an IQR for each shell under a repeated sampling of shell ages from log-normal distribution, with the mean determined by the calibrated shell age and the standard deviation determined by the fit of age data to the TDK1 model. Dominguez et al. (Reference Dominguez, Kosnik, Allen, Hua, Jacob, Kaufman and Whitacre2016) and Ritter et al. (Reference Ritter, Erthal, Kosnik, Coimbra and Kaufman2017) sampled shell ages from a posterior distribution generated from the product of a likelihood function of the log-normal distribution (or gamma distribution, depending on the calibration) and a noninformative prior distribution; the results of these two approaches are very similar. The mean IQR of all shells in a given increment represents the component of time averaging expected purely under calibration error. The time averaging corrected for this error refers to the difference between the raw IQR on one hand and the error component on the other hand (Dominguez et al. Reference Dominguez, Kosnik, Allen, Hua, Jacob, Kaufman and Whitacre2016). We estimate stratigraphic disorder (Cutler and Flessa Reference Cutler and Flessa1990) by correlating shell ages with sediment depth of corresponding shells, using Spearman correlation. We compute correlations within three stratigraphic units at Po 3 and Po 4 (corresponding to the early twentieth century, late twentieth century, and the earliest twenty-first century, respectively), and within two units at Panzano (the earliest twenty-first century is represented in one increment only).
To infer differences in bioturbational mixing before and after the major eutrophication phase, we test whether time averaging and disorder differ in sediments deposited during the early (unit 1) and late twentieth century (unit 2). In this case, we filter out the effect of postdepositional mixing. For example, individuals that died after a.d. 2000 can be reworked to unit 2, initially deposited during the late twentieth century. Therefore, when computing time averaging and disorder of shells induced by syndepositional mixing in sediments of unit 1 (deposited during the early twentieth century), we exclude shells that are younger than the oldest median age of the overlying unit 2. When computing time averaging and disorder of shells in sediments of unit 2 deposited during the late twentieth century, we exclude shells that are younger than the oldest median age of unit 3. Although this procedure still does not exclude the effect of postdepositional reworking of shells from unit 1 to unit 2, such estimates provide first-order estimates of syndepositional mixing during the early and late twentieth century. In this case, we do not apply the calibration error correction, because this procedure excludes the youngest subset of shell ages.
Reconstructing Abundances of Age Cohorts
The shape of the AFD in the whole core is a function of the number of shells produced during deposition, shell disintegration rate, and shell burial rate (Olszewski Reference Olszewski2004; Tomašových et al. Reference Tomašových, Kidwell and Foygel Barber2016, Reference Tomašových, Gallmetzer, Haselmair, Kaufman, Vidović and Zuschin2017), with the latter two processes representing loss rates because they remove shells from the core. To distinguish the contribution of loss to the shape of the AFD from the contribution of shell production, frequencies of age cohorts in the core are subdivided by a so-called survival function that accounts for the magnitude of loss and for the dependence of loss on shell age and/or shell depth in sediment (Tomašových et al. Reference Tomašových, Kidwell and Foygel Barber2016). Estimates of burial and disintegration are needed to approximate this function. Here, first, we estimate top-core burial rates on the basis of 210Pb profiles and down-core changes in median shell ages. Second, we approximate disintegration rates by subtracting these estimates of core-top burial rates from overall rates of shell loss from the taphonomic active zone (TAZ). Shell loss rates are based on fitting of AFDs from the uppermost few centimenters of the cores to three likelihood models with survival functions that assume steady-state production during the deposition of the FML (Tomašových et al. Reference Tomašových, Kidwell, Foygel Barber and Kaufman2014). We assume the thickness of TAZ is equivalent to the FML thickness (Berkeley et al. Reference Berkeley, Perry, Smithers, Horton and Taylor2007; Tomašových et al. Reference Tomašových, Kidwell, Foygel Barber and Kaufman2014).
To unmix the stratigraphic record of C. gibba, we account for mixing in the two steps and for shell loss by burial in the third step as implemented in Tomašových et al. (Reference Tomašových, Gallmetzer, Haselmair, Kaufman, Vidović and Zuschin2017). First, we approximate the shape of AFDs of undated increments within the three stratigraphic units by pooling AFDs of dated increments below and above the undated increment into a single AFD. The temporal separation of median ages between directly dated increments is smaller than time averaging of these increments. AFDs in individual increments below the FML are normal shaped, allowing us to fit the shape of the pooled AFD to a normal distribution truncated on the lower interval equal to zero (Jackson Reference Jackson2011) and estimate its mean and standard deviation. Second, we resample specimens to the total number of C. gibba in each increment (Supplementary Table 3), either from increment-specific empirical AFDs or from interpolated normal distributions, and count the number of resampled specimens in 10-year cohorts. The number of resampled C. gibba specimens in each increment is based on the sum of the C. gibba specimens in both cores sampled at each station. The resulting distribution of shell specimens in all increments represents the absolute abundances of all specimens in both cores at each station.
Third, when estimating the shell loss rate from the FML, a one-phase exponential model, assuming that the loss rate of shells does not change with shell age and/or with the depth of burial within the FML, performs best relative to more complex models (on the basis the Akaike information criterion). The model fit shows that the loss rate of shells from the FML is similar to the burial rate estimated on the basis of 210Pb dating and down-core changes in shell median age. Therefore, disintegration rate is probably much smaller than the burial rate at all three stations. We thus assume that disintegration rate can be neglected and that temporal changes in production can be assessed primarily by accounting for burial of shells to depths below 155 cm (i.e., core length). We thus divide the whole-core AFD (as reconstructed in the first two steps described earlier) by the survival function of the exponential model (i.e., the probability that the shell will survive beyond a given postmortem age, Tomašových et al. Reference Tomašových, Kidwell and Foygel Barber2016), where the parameter λ corresponds to the inverse of mean age of shells in the oldest increment (λ=0.0094 at Po 3, λ=0.0089 at Po 4, λ=0.0028 at Panzano). Repeating these three steps 1000 times and pooling ages into 10-year cohorts generate an estimate of mean abundance of C. gibba per 10-year cohort per 0.04 m2 (i.e., surface area of two cores at each station). We compare these unmixed reconstructions with stratigraphic trends in abundance of C. gibba directly observed in sediment cores but obscured by mixing. Finally, to translate abundances in 10-year cohorts to yearly standing density, an estimate of per-individual life span is necessary. Corbula gibba lives for ~5 years (Jones Reference Jones1956), and Tomašových et al. (Reference Tomašových, Gallmetzer, Haselmair, Kaufman, Vidović and Zuschin2017) used this value to estimate the standing density per square meter. Here, we use this estimate of 5 years and a smaller estimate of 2 years (Hrs-Brenko Reference Hrs-Brenko2006), which can account for high juvenile mortality, and compare both estimates with densities observed in surveys of living assemblages. The unmixing procedure is described in the Supplementary Material in R language source code.
Historical Environmental and Ecological Data
We compiled information on standing density of C. gibba sampled mainly by Van Veen grabs and processed with 1 mm mesh size from published sources, covering the NW Adriatic shelf between Po and Pesaro (Aleffi and Bettoso Reference Aleffi and Bettoso2000; Occhipinti-Ambrogi et al. Reference Occhipinti-Ambrogi, Favruzzo and Savini2002, Reference Occhipinti-Ambrogi, Savini and Forni2005; Simonini et al. Reference Simonini, Ansaloni, Pagliai and Prevedelli2004) and the northern and central Gulf of Trieste (Orel and Mennea Reference Orel and Mennea1969; Solis-Weiss et al. Reference Solis-Weiss, Rossin, Aleffi, Bettoso and Fonda Umani2004). The early twentieth-century surveys are represented by the data of Vatova (Reference Vatova1949). Although there are methodological differences with later surveys, they can provide order-of-magnitude information on C. gibba abundance in the early twentieth century. Minimum monthly concentrations of bottom-water dissolved oxygen for the NW Adriatic for the years 1911–1984 were extracted from the western sector of Justić et al. (Reference Justić, Legović and Rottini-Sandrini1987) and for the years 1972–2012 from stations SJ101 and SJ108 of Djakovac et al. (Reference Djakovac, Supić, Aubry, Degobbis and Giani2015) (Fig. 2C). For the Gulf of Trieste, concentrations of bottom-water dissolved oxygen for the years 1911–1984 were extracted from Fedra et al. (Reference Fedra, Ölscher, Scherübel, Stachowitsch and Wurzian1976), Faganeli et al. (Reference Faganeli, Avčin, Fanuko, Malej, Turk, Tušnik, Vrišer and Vukovič1985), from the northern sector of Justić et al. (Reference Justić, Legović and Rottini-Sandrini1987), and from four stations (A, AA1, C3, C323) located at 22, 20, 19, and 18 m depth in the Gulf of Trieste, respectively (Fig. 2C). Po and Isonzo maximum daily discharge data are based on Zanchettin et al. (Reference Zanchettin, Traverso and Tomasino2008) and Siché and Arnaud-Fassetta (2014), respectively (Fig. 2D). Annual mean sea-surface temperature data since 1860 (Fig. 2E) were extracted from the Hadley Centre Sea Ice and Sea Surface Temperature data set (Rayner et al. Reference Rayner, Parker, Horton, Folland, Alexander, Rowell, Kent and Kaplan2003). We assess the effects of these environmental variables averaged to 10 years (dissolved oxygen concentrations, daily discharge, and sea-surface temperature) on unmixed abundances of C. gibba in 10-year cohorts with partial Spearman rank correlations and generalized least-squares (modeling autocorrelation structure according to autoregressive process of order 1).
Results
Down-Core Changes in Stratification
Sediments at all stations are composed of clay and silt, and their proportions remain constant up core (mean proportion of silt is 61% at Po 3, 55% at Po 4, and 52% at Panzano). Both Po cores can be subdivided into three major units that differ in sediment density in X-ray radiographs, in the degree of stratification, and in the intensity of bioturbation (Fig. 5): (1) Unit 1 is 70 cm thick with indistinct, poorly delineated, mottled ichnofabric in the lower part. Distinct layers with sharp boundaries are not preserved. A dense, fuzzy, and irregular lensoid layer occurs at 125–130 cm in both cores and separates this unit into subunits 1 and 2. Large, ~5-cm-thick horizontally oriented, poorly delineated burrows produced by echinoderms are preserved in this unit at Po 3. (2) Unit 2 is 60–65 cm thick and contains dispersed but distinct burrows and 1- to 2-cm-thick, discontinuous, dense, locally laminated layers. These relictual layers are located at 75–85 cm (bottom of unit 2), at ~50 cm at both Po stations and at 30–35 cm at Po 3 and Po 4. The layer at 50 cm separates this unit into subunits 3 and 4. Several trails of vertically and obliquely oriented echinoderm burrows (2–3 cm in diameter), similar to Bichordites with distinct transversal ribs and a central channel, are visible in X-ray radiographs in subunit 3 at both Po stations (Fig. 5). They penetrate through the relictual layer at 50 cm and thus postdate its deposition. They are also preserved in subunit 4 at Po 4. (3) The top 16–20 cm at Po 3 and Po 4 (unit 3) are structureless, without distinct burrows, and bounded on the base by a relictual layer (bright in X-ray radiographs) at Po 3. X-ray radiographs from Panzano do not show relicts of episodic sedimentation, and the upper 6 cm are structureless in radiographs (Fig. 5). The upper 35 cm of sediment at Panzano are shelly, with frequent shells of Aporrhais, Turritella, and scallops (Aequipecten and Flexopecten). On the basis of age data, 14–35 cm corresponds to unit 1 (early twentieth century), 6–14 cm to unit 2 (late twentieth century), and 0–6 cm to unit 3 (FML).
Sedimentary fabric of two cores at the Po prodelta and a core at the Isonzo prodelta in radiographs, with subdivision into units, and further subdivision of Po cores into subunits. In X-ray images, light-gray shading represents high sediment bulk density and dark-gray shading represents low sediment bulk density. In the figure, the shading is inverted so that dark shading represents high sediment bulk density: the darkest layers correspond to flood layers; dark-gray shading corresponds to dense, pervasively bioturbated lower parts of the cores (unit 1); and light-gray shading corresponds to weakly bioturbated sediments of unit 2. The uppermost unshaded parts correspond to the fully mixed layer (FML). The topmost white layers represent the 16- and 6-cm-thick surface FMLs based on 210Pb profiles.

Down-Core Changes in Shell Age
Median ages of increments at both Po stations decline monotonically from the top (unit 3) down to the upper part of unit 1, to 100 cm at Po 3 and to 90 cm at Po 4, spanning from a.d. 2000 to a.d.1924 at Po 3 and a.d.1934 at Po 4 (Fig. 6). Within this interval at both Po stations, median ages of AFDs remain within the bounds of the upper and lower age quartiles of overlying and underlying increments within the three subunits. In contrast, median ages tend to be outside age quartiles of AFDs belonging to different subunits. A major break in median shell age that occurs at 85 cm coincides with the boundary between units 1 and 2 in both cores. This boundary abruptly separates highly dense sediments with pervasive bioturbation (unit 1) from weakly dense sediments with discrete traces and relicts of stratification (unit 2). The upper and lower age quartiles of assemblages in increments above and below this boundary (upper quartile at 82.5 cm is a.d. 1955 and lower quartile at 97.5 is a.d. 1964 at Po 3; and upper quartile at 77.5 cm is a.d. 1948 and lower quartile at 92.5 is a.d. 1951 at Po 4; Fig. 6) indicate that this depositional change occurred in ca. a.d. 1950. The upper 20 cm at Po 3 and Po 4 are characterized by uniform median shell ages (unit 3), with shells mostly younger than a.d. 2000 (FML). However, several shells older than a.d. 1950 occur in the uppermost 4 cm increment at Po 3, indicating that they were reworked upward by >85 cm.
Down-core changes in median age of increments and temporal resolution at Po and Panzano. The scale along the y-axis on the right side refers to date (a.d.) of increments on the basis of shell age. The cores at Po 3 and Po 4 are subdivided into three units (post-2000, late twentieth century, and early twentieth century). The lowermost unit shows signs of stratigraphic disorder. These three units (from light to dark gray) are thinner at Panzano. Even when median date at Panzano is a.d.1864 at 30–35 cm sediment depth, interquartile range of Corbula gibba ages extends into the twentieth century, i.e., a large portion of shells preserved up to 35 cm lived in the twentieth century.

Median shell ages between 100 and 150 cm in both cores show disorder in terms of nonmonotonic changes in median age of C. gibba, with oldest dates reaching to ca. a.d. 1910 at Po 3 and ca. a.d. 1890 at Po 4. Stratigraphic disorder is further documented by the presence of shells of organisms that died after a.d. 2000 at 127.5 and 152.5 cm at Po 4 (Fig. 6). Median age of these lowermost increments at Po 4 is younger than a.d. 1970, demonstrating downward reworking from unit 3 to unit 1 by more than 100 cm, strongly exceeding the depth of the FML. These increments in unit 1 are characterized by low abundance of C. gibba (fewer than 10 individuals per increment).
At Panzano, median shell age declines monotonically from a.d. 1998 at 2–4 cm to a.d. 1959 at 10 cm, to a.d. 1949 at 18–20 cm, and to a.d. 1864 at 30–35 cm (Fig. 6). Although the median age of the 30–35 cm increment falls in the nineteenth century, its upper age quartile reaches to a.d. 1966. Therefore, many shells of organisms that lived in the twentieth century are still preserved in this increment. The upper and lower age quartiles of AFDs within the middle (between 25 and 75 cm) and lower parts of the core (between 90 and 150 cm) overlap and indicate some degree of mixing across ~50 cm. Although down-core changes in median ages do not show stratigraphic disorder, five shells older than 150 years occur in the upper 10 cm. These shells were probably reworked upward to the FML from sediment depths exceeding 30 cm.
Down-Core Changes in 210Pb
Down-core profiles in the 210Pb excess show very irregular profiles at both Po stations (Fig. 7). They can be separated into three phases that coincide with the three units detected by radiographs. First, background values appear below 90 cm, that is, in unit 1. Second, an overall decline in the 210Pb excess occurs between 16 cm and 80–90 cm. Sedimentation rate based on this portion is 2.6 cm/yr (95% confidence interval [CI]=1.2–11.3 cm/yr) at Po 3 and 2.2 cm/yr (95% CI=1.2–5.6 cm/yr) at Po 4. Third, the uppermost ~16 cm shows inverted or uniform down-core profiles in the 210Pb excess (FML), with the lowest values at 16 cm at both stations. At Panzano, background values occur at 30–40 cm, a relatively regular monotonic decline occurs between 6–30 cm, and excess 210Pb is uniform in the upper 6 cm (FML) (Fig. 7). Sedimentation rate based on 0–30 cm at Panzano is 10 times lower than at Po (0.24 cm/yr, 95% CI=0.2–0.29 cm/yr).
Top row: Excess 210Pb profiles show irregularly uniform values (Po 3) or inverted trends (Po 4) in the upper 16 cm. At Panzano, the upper 6 cm shows uniform excess 210Pb values. The upper shaded intervals correspond to the fully mixed layers (FMLs). Sediment dates on the right sides of profiles are based on the constant flux–constant sedimentation model (gray line). The three phases on the right of each core correspond to units distinguished on the basis of X-radiographs and down-core changes in Corbula gibba shell age. Bottom row: Relationship between 210Pb and AAR median age at Po 3, Po 4, and Panzano, with Pearson correlations. White circles represent the FML, and black circles represent increments below it.

Net Sedimentation Rate
The FML corresponds to the top 16–20 cm at the two Po stations according to radiographs, homogeneous C. gibba median ages, and irregular excess 210Pb values. In contrast, the FML at Panzano is just 6 cm thick based on uniform 210Pb values and on the basis of the increase of C. gibba median ages just below 6 cm. The estimates of sedimentation rates based on down-core changes in median shell ages over the comparable core portions (unit 2) are similar to the estimates based on 210Pb (2.1 cm/yr at Po 3 under median age=38 yr at 80–85 cm, 2 cm/yr at Po 4 under median age=37 yr at 75–80 cm, and 0.2 cm/yr under median age=149 yr at 30–35 cm at Panzano). Although the estimates based on 210Pb can be biased upward by bioturbation (Meysman et al. Reference Meysman, Boudreau and Middelburg2010),210Pb sediment ages thus correlate positively with C. gibba median ages at all stations (r>0.8, p<0.001, at all stations). However, deeper increments show a considerable scatter around the expected one-to-one relationship (Fig. 7). Estimating whether the same sedimentation rate applies to unit 1 at Po 4 is prohibited by stratigraphic disorder. At Po 3, the difference in median age between the upper- and lowermost increments of unit 1 (at 97.5 and 137.5 cm, respectively) is 17 years. The early twentieth-century sedimentation rate is thus ~2.4 cm/yr, comparable to that of the late twentieth century.
Fitting the AFD from the FML at Po 3 and Po 4 to a one-phase exponential model results in loss rates λ= 0.07 and 0.14, corresponding to a mean time of shell loss from the 16- to 20-cm-thick surface FML equal to 14 and 7 years, and a shell burial rate equal to 1.5 and 2.9 cm/yr, respectively. These values are comparable to sedimentation rates based on 210Pb profiles and profiles in shell median age. At Panzano, fitting the AFD from the FML to a one-phase exponential model results in a loss rate of λ= 0.035, that is, the mean time to shell loss from the 6-cm-thick FML is 29 years. Therefore, a shell burial rate equal to 0.21 cm/yr is similar to sedimentation rates based on 210Pb and median shell age. To conclude, the steepness of AFDs in the FML is primarily determined by burial rather than by disintegration at all stations.
Down-Core Changes in Time Averaging and Disorder
At the scale of three stratigraphic units in each core, the AFDs show a down-core shift from right-skewed distributions in unit 3 (coinciding with the FML) to unimodal, more symmetric distributions in units 1 and 2, with decreasing temporal resolution (Fig. 8). IQR (corrected for calibration age error) of stratigraphic increments increases from 2–3 years in unit 3, to ~14–23 years in unit 2, and to 27–29 years in unit 1 at the Po stations, and from 9–20 years in units 2 and 3 to 75 years in unit 1 at Panzano (Fig. 8).
Down-core changes in age-frequency distributions (AFDs) in three stratigraphic units containing shells of Corbula gibba that lived mainly in the twentieth century; median age and resolution decrease down core and skewness becomes smaller. The upper row shows AFDs from the uppermost sediment increments corresponding to the fully mixed layer (FML), with the lines fitted by the simple exponential model and corresponding estimates of shell loss rate from this layer and estimates of shell burial (assuming that disintegration in the FML is minor relative to loss caused by burial). AFDs of subunits 1 and 2 have similar shapes within unit 1 and AFDs of subunits 3 and 4 have similar shapes within unit 2. Subsurface assemblages are characterized by unimodal, symmetric AFDs. Vertical line represents median age.

At Po, annual to decadal time averaging of 4- to 5-cm-thick increments in unit 3 (earliest twenty-first century, median IQR=1–3 yr) and in unit 2 (late twentieth century, median IQR=14–15 yr) is smaller by a factor of two relative to multidecadal to centennial time averaging in unit 1 (early twentieth century, median IQR=25–28 yr; Fig. 9A). The difference in time averaging between units 2 and 3 on one hand and unit 1 on the other holds when postdepositional cohorts are removed (Fig. 9B). Similarly, as at Po, time averaging of 4- to 5-cm-thick increments at Panzano deposited during the late twentieth century (median IQR=12 yr) is lower than in sediments during the early twentieth century (median IQR=67 yr).
Down-core decline in temporal resolution and stratigraphic order (per 5-cm-thick increments) characterize all stations: A, Changes in interquartile age range corrected for calibration error; B, changes in interquartile age range, excluding postdepositional age cohorts; C, changes in stratigraphic order (Spearman’s rank correlation). Stratigraphic disorder and temporal resolution is not shown for unit 3 at Panzano, because it is represented by one increment only.

Stratigraphic disorder at the scale of 4- to 5-cm-thick increments increases down core at all stations (Fig. 9C). The correlation between individual ages and their sediment depth shows a significant stratigraphic order in the late twentieth century (Spearman r=0.24, p=0.03 at Po 3, and r=0.34, p<0.001 at Po 4) and a lack of order in the early twentieth century at both stations (Spearman r=0.1, p=0.43 at Po 3, and r=−0.04, p=0.79 at Po 4). Unit 3 (earliest twenty-first century) shows a significant order at Po 4 (r=0.27, p=0.04) but not at Po 3 (r=−0.1, p=0.37). However, this unit is much thinner than unit 2, being effectively equivalent to the FML. Stratigraphic order is preserved in both units at Panzano (r=0.41, p=0.007 in the early twentieth century, and r=0.53, p<0.0001 in the late twentieth century).
Stratigraphic Patterns in Abundance of Corbula gibba and in the Composition of Communities
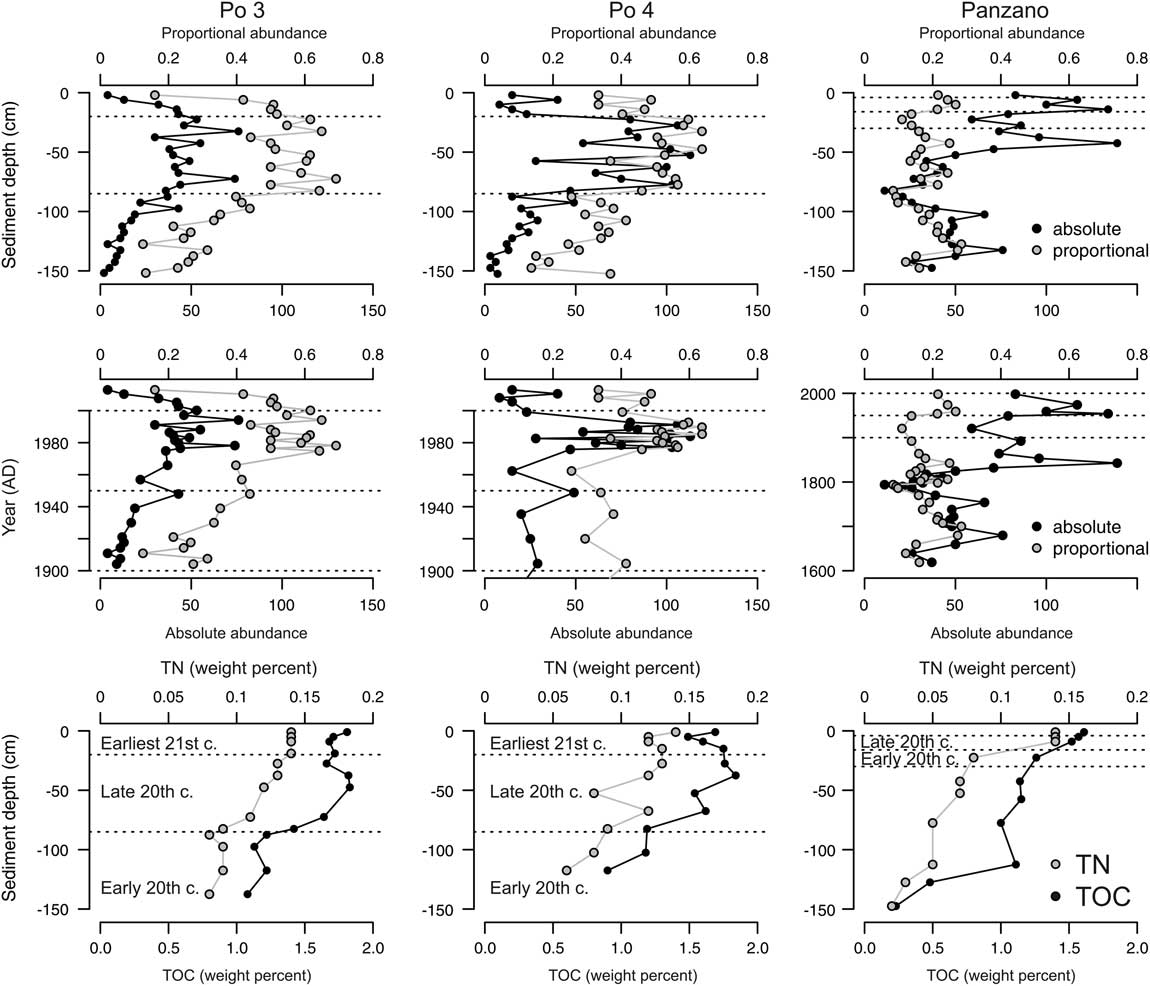
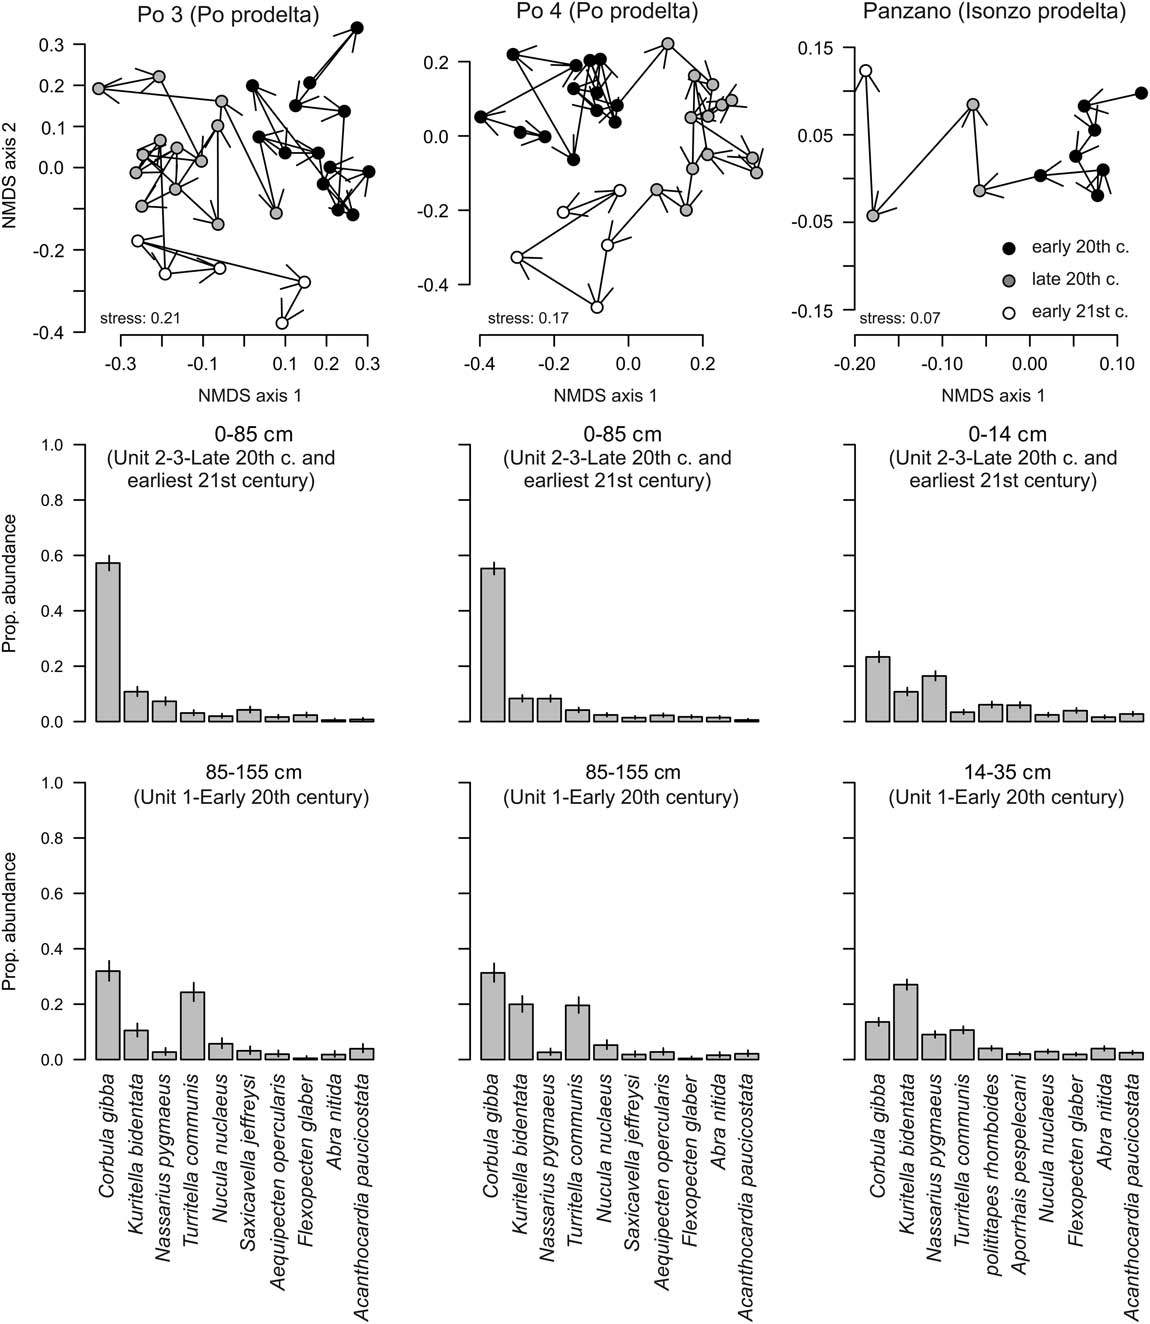
Absolute and proportional abundances show similar trajectories at both Po stations. Absolute abundances are low in the lowest unit, increase sharply to 50–75 individuals at 85 cm at Po 3 and to ~100 individuals at 80 cm at Po 4, remain high in unit 2, and decline to low values in unit 3 (Fig. 10). Proportional abundances at Po 3 and Po 4 show similar trends, achieving 20–30% in unit 1, 50–60% in unit 2, and 20–40% in unit 3. At Panzano, C. gibba increases from 50 individuals at 25 cm to 100 individuals at 16–20 cm, and from 25 cm (10%) upward to ~20% at 12 cm. Changing the vertical sediment-depth scale to a temporal axis represented by median ages, the maxima in absolute and proportional abundances occur in the latest part of the twentieth century in both regions. These trends in C. gibba dominance are associated with significant changes in the composition of molluscan communities in both regions between the early and late twentieth century at Po 3 (PERMANOVA, F=7.3, p<0.001), Po 4 (F=6.9, p<0.001), and Panzano (F=4.6, p<0.001), mainly marked by the decline in evenness and by the decline in abundance of the formerly frequent gastropods (Turritella communis) and bivalves (Kurtiella bidentata) (Fig. 11).
Top and middle rows: Absolute and proportional abundances (relative to all mollusks) of Corbula gibba scaled against sediment depth (top row) and against time (middle row) show that both sharply increased at 85 cm, i.e., at median time equal to 1970s, at Po3 and Po 4, and at 16 cm, i.e., at median time equal to 1950s, at Panzano. Bottom row: A general down-core decrease in concentrations of total organic carbon (TOC) and total nitrogen (TN) at all stations. However, TOC tends to show the highest values in unit 2 at both Po stations, coinciding with the reduced bioturbation and high abundance of C. gibba.
Changes in the molluscan community composition at Po and at Panzano during the twentieth century. Top row: Nonmetric multidimensional scaling shows that assemblages from the early and late twentieth century differ in square-root-transformed proportional species abundances. Corbula gibba was excluded from these analyses. Arrows are drawn from older to younger assemblages. Middle and bottom rows: Bar plots based on pooled abundances in unit 1 and units 2–3 showing the increase in proportional abundance of C. gibba and the decrease of Turritella communis and Kurtiella bidentata at all stations.
Sediment grain size does not show any fining-upward trend, but concentrations of TOC (from ~1% to 1.5–1.7%) and TN (from ~0.05% to 0.15%) increase up-section in sediments of the twentieth century at all stations. They rise abruptly at 80–90 cm at both Po stations and at 20 cm at Panzano, that is, between units 1 and 2 in both regions (Fig. 10). TOC concentrations peak in unit 2 rather than in unit 3 at the Po stations. TOC concentrations correlate positively with absolute abundances of C. gibba at Po and Panzano and have significantly positive effects in generalized least-square models at the Po stations (Table 1). At Panzano, proportional abundances also correlate positively with concentrations of TOC, but less strongly (Table 1).
Rank correlations, partial rank correlations, and generalized least-square (GLS) slope estimates of the effects of total organic carbon (TOC) and dissolved oxygen concentrations on raw and unmixed abundance of Corbula gibba in sediments that were largely deposited during the twentieth century.

Unmixed Patterns in Abundance of Corbula gibba
Unmixing cohort abundance shows that standing density of C. gibba monotonically increased during the twentieth century at both Po stations (Fig. 12). The increase is less abrupt than observed on the basis of stratigraphic patterns. Absolute abundances increased steadily up to a.d. 2000 at Po 3, up to the 1980s at Po 4, and up to the mid-1970s at Panzano (Fig. 12). These trajectories are comparable to historical survey data that show an increase in standing density of C. gibba between the early and late twentieth century, a peak in standing density in the 1970s to 1990s in the NW Adriatic and in the 1990s in the Gulf of Trieste (white box plots in Fig. 12). The survey data indicate that median density declined after the 2000s. However, densities reaching up to 4000 individuals/m2 in the NW Adriatic and up to 700 individuals/m2 in the Gulf of Trieste were observed in the 2010s (Fig. 12). Depending on average per-individual life span, the core-based estimates of standing density attained in the late twentieth century varied between 1000 individuals/m2 (life span=2 yr) to 2000–3000 individuals/m2 (5 yr) at the Po stations, and between 500 individuals/m2 (2 yr) to 1500 individuals/m2 (5 yr) at Panzano. The estimates of standing density in historical surveys are comparable to core-based estimates that assume an average life span of about 2 years.
Top row: White box plots show temporal changes in standing density of Corbula gibba (individuals/m2) based on published historical surveys (5–30 m water depth) during the twentieth century in the NW and NE Adriatic at 5-year resolution. The 1934–1935 data are from Vatova (Reference Vatova1949). Gray and black lines show changes in density predicted by cohort abundance (accounting for abundances in all increments and interpolating shape of age-frequency distributions), assuming life span of 2 and 5 years, respectively. The reversal in density at the top, observed both in living communities and in core assemblages, likely reflects the most recent oligotrophization. Bottom row: Reconstructed changes in standing density of C. gibba at Po and Panzano are significantly negatively related to the bottom-water concentrations of dissolved oxygen (DO), computed as median of minimum monthly concentrations in 10-year bins.

At 10-year resolution, unmixed abundances of C. gibba correlate negatively with the median of minimum monthly concentrations of dissolved oxygen at Po and at Panzano (Fig. 12, Table 1). The effect of dissolved oxygen on unmixed abundances is also significantly negative (Table 1). The rank correlation with temperature is moderately positive at Po (Spearman r [Po 3]=0.6, p=0.056; r [Po 4]=0.59, p=0.06) and negligible at Panzano, where the decline in abundance between 1980 and 2000 is not in phase with increasing temperature (r [Panzano]=−0.14, p=0.67). Although the frequency of floods of the Po and Isonzo Rivers slightly increased during the twentieth century (Zanchettin et al. Reference Zanchettin, Traverso and Tomasino2008; Siche and Arnaud-Fassetta Reference Siché and Arnaud-Fassetta2014), per-decadal maximum daily discharge of the Po and Isonzo Rivers does not correlate with unmixed abundances of C. gibba (Spearman r [Po 3]=−0.34, p=0.28; r [Po 4]=−0.1, p=0.777; r [Panzano]=−0.4, p=0.33).
Discussion
Preservation of Flood Stratification at the Po Prodelta
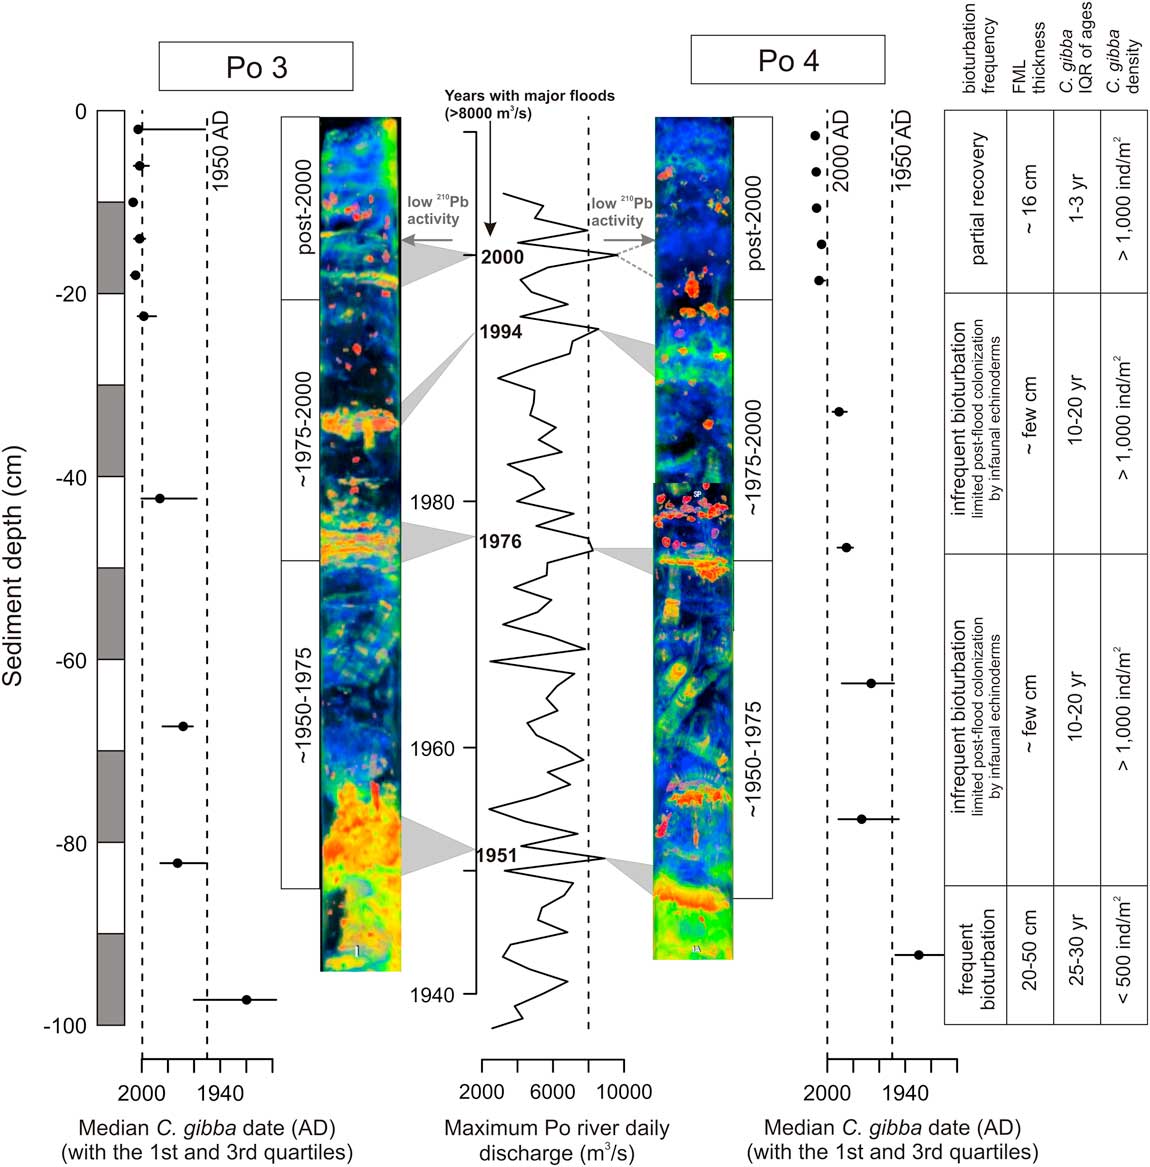
The delta front and prodelta of the Po River are flood dominated, with sedimentation driven by flocculation from hypopycnal river plumes and gravity-driven sediment transport (Traykovski et al. Reference Traykovski, Wiberg and Geyer2007), especially under very high river discharge. Seven major floods with daily peak discharges above 8000 m3/s occurred in the twentieth century (Zanchettin et al. Reference Zanchettin, Traverso and Tomasino2008), in 1917, 1926, 1928, 1951, 1976, 1994, and 2000, with the absolute maximum discharge observed on 20 May 1926. These flood events at the Po prodelta tend to be recognized by dense (bright) and laminated layers in radiographs (Wheatcroft et al. Reference Wheatcroft, Stevens, Hunt and Milligan2006; Tesi et al. Reference Tesi, Langone, Goni, Wheatcroft, Miserocchi and Bertotti2012), comparable to relictual layers at the Po stations observed here (Fig. 13). Another flood occurred in 2009 but did not leave distinct layers of laminated deposits at the deeper prodelta (Tesi et al. Reference Tesi, Miserocchi, Goñi, Turchetto, Langone, De Lazzari, Albertazzi and Correggiari2011). The low excess 210Pb activity at 16 cm, coinciding with the upper bright layer in radiographs at 16–20 cm at Po 3, also suggests that the layers at the two Po stations reflect flood events, because flood deposits of the Po prodelta have low 210Pb concentrations due to a short time for absorption (Palinkas and Nittrouer Reference Palinkas and Nittrouer2007). IQRs of shells in 4-cm-thick increments in unit 3 at both stations are mostly less than 13 years, and the median date of C. gibba immediately underlying unit 3 at 20 cm is a.d. 2000. Therefore, unit 3 formed after a.d. 2000, and the dark layer at 16–20 cm at Po 3 corresponds to a 100-year flood in the autumn of 2000 (Wheatcroft et al. Reference Wheatcroft, Stevens, Hunt and Milligan2006; Miserocchi et al. Reference Miserocchi, Langone and Tesi2007; Tesi et al. Reference Tesi, Langone, Goni, Wheatcroft, Miserocchi and Bertotti2012). The ages of shell in layers at 80, 50, and 35 cm at Po 3 and 85, 50, and 30 cm at Po 4 coincide with major floods in 1951, 1974, and 1994, respectively (Fig. 13). Therefore, bright relictual layers in cores at Po probably represent flood events. No flood layers can be detected at Panzano. In the section on Temporal Changes in Bioturbation, we argue that the preservation of flood layers in sediments deposited in the late twentieth century at Po is related to a major midcentury decline in the depth and frequency of bioturbation.
The replacement of pervasively bioturbated sediments with high bulk density, decadal time averaging (IQR), and low abundance of Corbula gibba (early twentieth century) by organic-rich sediments with low bulk density, discrete echinoderm traces, relictual flood layers, yearly time averaging, and high abundance of C. gibba (late twentieth century) documents a major regime shift in ecosystem functioning driven by higher frequency of hypoxia in the late twentieth century. Flood layers at the Po prodelta are preserved in the late twentieth-century portion of sediment cores when the depth and rate of bioturbational mixing were reduced. The stratigraphic positions of bright (orange-colored in X-rays) relictual layers correspond to the timing of major flood events recorded at the Po prodelta during the twentieth century (according to Zanchettin et al. Reference Zanchettin, Traverso and Tomasino2008). FML, fully mixed layer; IQR, interquartile range.
Spatial Changes in Time Averaging
On one hand, estimates of the late twentieth-century sedimentation rates at Po (~2 cm/yr) are 10-fold higher than at Panzano (~0.2 cm/yr). On the other hand, the effects of bioturbation are stronger at Po than at Panzano: (1) FML is thicker by factor of ~2.5 at the Po prodelta and (2) substantial downward and upward reworking of very young and very old shells indicates that incomplete mixing reaches 100 cm below the FML at the Po prodelta. Shrimps also burrow to 90 cm in sediments of the Isonzo prodelta (Pervesler and Hohenegger Reference Pervesler and Hohenegger2006), but the abundance of such burrows is probably less than in the Po prodelta. The 10-fold difference in sedimentation rates is thus partly compensated by higher mixing at Po, generating a transit time of shells below the FML (Wheatcroft Reference Wheatcroft1990) that is four times shorter at Po than at Panzano. One of the major correlates of the bioturbation intensity in other marine environments is the availability of labile organic matter (Boudreau Reference Boudreau1994; Smith and Rabouille Reference Smith and Rabouille2002) that tends to positively correlate with sedimentation rate. Therefore, higher primary productivity at the Po prodelta compared with the Isonzo prodelta can explain the positive covariation between the depth of bioturbation and sedimentation rate (and concentrations of TOC in sediment) observed here.
Down-Core Changes in Time Averaging
Time averaging observed in a given stratigraphic increment can be compared against time averaging that would be expected under constant rate of burial of shells below the FML. In this case, burial times are exponentially distributed, and the IQR of shell ages in the FML is expected to be equal to log(3) divided by inverse of time to burial of shells to the underlying layer. Therefore, using the present-day estimates of FML thickness and sedimentation rate, IQRs of C. gibba assemblages should be ~9 years at the Po prodelta (i.e., time to burial below the 16-cm-thick FML at 2 cm/yr is 8 yr, and log(3)/(1/8) is 9 yr) and ~33 years at the Isonzo prodelta. IQRs of C. gibba assemblages are comparable to these predictions in units 2 and 3 (i.e., deposited during the late twentieth century and the earliest twenty-first century). However, IQRs in unit 1 are higher by a factor of two or three in both regions (Fig. 9). This difference in time averaging is thus partly generated by incomplete, nonlocal mixing below the FML by burrowers in the twenty-first century that moved some shells younger than 10 years from unit 3 to the lowermost increments in unit 1 (and from unit 1 to unit 3) at both Po stations (Fig. 6).
However, we suggest that this difference is also generated by stronger bioturbation in the early twentieth century, because time averaging of increments in unit 1 remains high even when postdepositional cohorts are excluded (Fig. 9B). The down-core changes in time averaging and stratigraphic disorder are driven by reduced bioturbation rather than by increased sedimentation, because the distribution of shell ages does not indicate any increase in net sedimentation rate toward the top of the cores in both regions. Annual sediment load from the Po delta was higher in the early twentieth century than in the late twentieth century (sandy sediment input to the coastal environments has stopped over the past 50 yr due to dam construction, soil protection, and massive riverbed excavation; Correggiari et al. Reference Correggiari, Cattaneo and Trincardi2005), late-highstand sedimentation rates at Po (~0.5–2 cm/yr; Scarponi et al. Reference Scarponi, Kaufman, Amorosi and Kowalewski2013) are comparable to late twentieth-century sedimentation rates at Po (Palinkas and Nittrouer Reference Palinkas and Nittrouer2007), and the time required to destroy flood layers a few centimeters thick is just a few years at the Po prodelta (Tesi et al. Reference Tesi, Langone, Goni, Wheatcroft, Miserocchi and Bertotti2012). At 20 m water depth in front of southern distributary channels that are close to the stations sampled in our study, the original thickness of the 2000 flood layer is less than 5 cm (Wheatcroft et al. Reference Wheatcroft, Stevens, Hunt and Milligan2006). Only at the northern prodelta off the most active channel (Po di Pilla; Correggiari et al. Reference Correggiari, Cattaneo and Trincardi2005) are flood layers 20–25 cm thick (Orange et al. Reference Orange, García-García, Lorenson, Nittrouer, Milligan, Miserocchi, Langone, Correggiari and Trincardi2005). Although bases of such layers can remain intact, more than 50% of a 24-cm-thick flood layer deposited in a.d. 2000 at 13 m water depth was completely reworked in the course of several years (Tesi et al. Reference Tesi, Langone, Goni, Wheatcroft, Miserocchi and Bertotti2012).
Due to higher sedimentation/mixing ratio at Po compared with Panzano, the mismatch between raw (mixed) and umixed temporal patterns in abundance of C. gibba, as observed at the scale of the whole core at Panzano (Tomašových et al. Reference Tomašových, Gallmetzer, Haselmair, Kaufman, Vidović and Zuschin2017), does not strongly affect the cores at Po. In the top interval at Panzano that corresponds to the twentieth century, the trajectory of increasing C. gibba abundance is still preserved in the twentieth-century sediments, in contrast to the middle and lower part of the cores. Therefore, the decline in bioturbation induced by anthropogenic impacts increased the preservation potential of stratigraphic trends in both regions.
Temporal Changes in Bioturbation and in Abundance of Opportunists between the Early and Late Twentieth Century
In spite of geographic differences in sedimentation and mixing, qualitatively similar stratigraphic trends in abundance of C. gibba and in temporal resolution occur in circalittoral habitats at the Po and Isonzo prodeltas. Therefore, the depositional changes that affected preservation of flood layers and ichnofabric, compositional changes, and changes in the abundance of a major opportunistic species occurred over broad spatial scales in the northern Adriatic Sea between the early and late twentieth century. Pervasive bioturbation, as observed in the early twentieth-century sediments in our cores, is typical of natural highstand deposits of the Po prodelta (Amorosi et al. Reference Amorosi, Dinelli, Rossi, Vaiani and Sacchetto2008, Reference Amorosi, Maselli and Trincardi2016). In the absence of environmental stressors, bioturbation in the northern Adriatic Sea is produced by the shrimps Squilla mantis (Fig. 3A,B), Jaxea nocturna (Pervesler and Dworschak Reference Pervesler and Dworschak1985), or Upogebia pusilla (Pervesler and Hohenegger Reference Pervesler and Hohenegger2006), fishes, polychaetes (Fig. 3C), echinoderms (Schinner Reference Schinner1993), and mollusks (Atkinson and Froglia Reference Atkinson and Froglia2000), and their activities are expected to quickly erase centimeter-scale stratification produced by flood events. Therefore, stratigraphic changes in temporal resolution, in preservation of flood layers, and in preservation of echinoderm traces between units 1 and 2 in both regions, and higher TOC concentrations in unit 2 at the Po stations indicate a major change in ecosystem functioning during the late twentieth century. We suggest that this change reflects a regime shift that was marked by the relatively abrupt midcentury decline in bioturbation rate and depth (Fig. 13). Distinct echinoderm burrows penetrating flood layers in unit 2 at Po show that the sediment was intermittently mixed by subsurface deposit feeders in the late twentieth century. However, the preservation of flood layers and the distinctiveness of traces suggest that these mixing events were limited in frequency (e.g., Savrda and Bottjer Reference Savrda and Bottjer1991; Virtasalo et al. Reference Virtasalo, Leipe, Moros and Kotilainen2011) and were insufficient to fully mix surface sediments. Irregular echinoids, most likely Ova canalifera, took advantage of organic-matter enrichment in the wake of flood events, but the colonization window was probably limited by the next hypoxia event. The thickness of the FML probably attained 20–50 cm in the early twentieth century, in contrast to a few centimeters in the late twentieth century (Fig. 13).
The present-day FML thickness of at least 16 cm and the signs of deeper incomplete mixing at the Po prodelta (with high density of shrimp mounds on the seafloor) can reflect a renewal in bioturbation in the earliest twenty-first century. This renewal is suggested by the decline in TOC in sediment cores, probably reflecting the lower frequency of hypoxia directly observed since the 1990s in the northern Adriatic Sea (Djakovac et al. Reference Djakovac, Supić, Aubry, Degobbis and Giani2015). At Panzano, stratigraphic changes in stratification cannot be detected due to slower sedimentation rate and because flood events do not reach such magnitude as at the Po prodelta.
The decline in bioturbation depth and frequency associated with outbreaks of shallow-burrowing opportunistic species can occur under multiple stressors that impede infaunal colonization, including oxygen deficiency (Diaz and Rosenberg Reference Diaz and Rosenberg1995; Villnäs et al. Reference Villnäs, Norkko, Lukkari, Hewitt and Norkko2012; Gogina et al. Reference Gogina, A. Darr and Zettler2014; Briggs et al. Reference Briggs, Hartmann, Yeager, Shivarudrappa, Díaz, Osterman and Reed2015), high sedimentation rates in deltaic environments (MacEachern et al. Reference MacEachern, Bann, Bhattacharya and Howell2005), or sediment disturbance by trawling and dredging (Thrush and Dayton Reference Thrush and Dayton2002). Absolute abundances of C. gibba were repeatedly high over the past centuries in the northern Adriatic Sea (Tomašových et al. Reference Tomašových, Gallmetzer, Haselmair, Kaufman, Vidović and Zuschin2017). However, a combination of very limited bioturbation (persisting over years to few decades) with outbreaks of C. gibba and reduced abundance of formerly abundant species (leading also to high proportional abundance of C. gibba) might represent the unique signature of anthropogenic stress that developed in the late twentieth century. The increase in C. gibba abundance is associated with a major decline in abundance of the suspension-feeding gastropod T. communis. This species was significantly more abundant in unit 3 at both Po stations and at Panzano, that is, in the early twentieth century (Fig. 11). Therefore, this twentieth-century change affected the whole molluscan community composition.
Association between Outbreaks, Limited Bioturbation, and Hypoxia
Historical data on the concentrations of dissolved oxygen show a major increase in the frequency of hypoxic events in the late twentieth century (Fig. 2C), with regional hypoxic events (<1 ml/L) occurring in the Gulf of Trieste in 1974, 1983, 1988, 1990, 1994, and 2001 (Faganeli et al. Reference Faganeli, Avčin, Fanuko, Malej, Turk, Tušnik, Vrišer and Vukovič1985; Stachowitsch Reference Stachowitsch1991; Cibic et al. Reference Cibic, Blasutto and Bettoso2009), and in the NW Adriatic off the Po River delta in 1977, 1982, 1983, 1989–1991, 1994, 1997, and 2004 (Degobbis et al. Reference Degobbis, Smodlaka, Pojed, Škrivanić and Precali1979; Vidakovic and Zavodnik Reference Vidakovic and Zavodnik1984; Rinaldi et al. Reference Rinaldi, Montanari, Ghetti and Ferrari1992; Djakovac et al. Reference Djakovac, Supić, Aubry, Degobbis and Giani2015). The twentieth-century increase in C. gibba abundance based on unmixing and the decline in the depth and frequency of bioturbation strongly coincide with this increase in frequency of hypoxic events in the late twentieth century (Fig. 12, Table 1). The reconstructed trajectory at 10-year resolution probably reflects a higher frequency of outbreaks occurring over few years, separated by years with low abundance (Hrs-Brenko et al. Reference Hrs-Brenko, Medaković, Labura and Zahtila1994), rather than a simple continuous increase in standing density.
The increase in the frequency of hypoxia, hypothesized to be at least partly driven by a major increase in fertilizer use (Fig. 2), is in phase with the up-core increase in TOC and TN occurring relatively abruptly just at the transition between the early and late twentieth century observed in our cores (Fig. 10), as is also observed in other cores in the Gulf of Trieste (Ogrinc and Faganeli Reference Ogrinc and Faganeli2006). The down-core increase in TOC within the mixed layer is expected due to organic-matter remineralization in the sediment and stratigraphic changes in TOC and thus may not simply reflect temporal changes in organic-matter production and preservation (Burdige Reference Burdige2007). However, non-monotonic down-core changes in TOC at Po stations, with the highest values in unit 2, indicate that they do reflect temporal changes in organic-matter preservation. Therefore, we suggest that depth and frequency of bioturbation was limited by an increase in the frequency of bottom-water hypoxia (as observed also in other studies: Solan et al. Reference Solan, Batty, Bulling and Godbold2008; Virtasalo et al. Reference Virtasalo, Leipe, Moros and Kotilainen2011; Wetzel et al. Reference Wetzel, Tjallingii and Wiesner2011). Such an increase would (1) directly and indirectly (via suppression of infaunal bioirrigation) limit concentrations of dissolved oxygen in the sediment and thus reduce the remineralization of refractory organic matter (Aller Reference Aller1994; Kristensen Reference Kristensen2000; Burdige Reference Burdige2007), (2) lead to local extirpation and delayed recovery of hypoxia-sensitive species such as T. communis, and (3) enable outbreaks of C. gibba in the wake of hypoxic events. This species is tolerant to seasonal oxygen crises, is able to feed on both phytoplankton and organic particles from the sediment surface (Yonge Reference Yonge1946), and probably benefits from the reduction in competition and predation pressure that occurs after mass mortalities of less tolerant species (Hrs-Brenko Reference Hrs-Brenko2006). The temporal increase in the frequency of hypoxia was also associated with higher sediment pollution by metals, and this probably delayed the immigration of the otherwise hypoxia-tolerant invasive species Anadara transversa (Albano et al. Reference Albano, Gallmetzer, Haselmair, Tomašových, Stachowitsch and Zuschin2018).
Warming plays a significant role in promoting water-column stratification (Degobbis et al. Reference Degobbis, Precali, Ivancic, Smodlaka, Fuks and Kveder2000) and in the formation of mucilages in the northern Adriatic Sea (Danovaro et al. Reference Danovaro, Umani and Pusceddu2009), and its effects on the frequency of hypoxia and abundances of C. gibba were detected over longer, centennial timescales (Tomašových et al. Reference Tomašových, Gallmetzer, Haselmair, Kaufman, Vidović and Zuschin2017). However, the link between temperature increase that took place during the twentieth century and the outbreaks of C. gibba is weaker, probably because eutrophication increased the probability of oxygen depletion even under colder conditions and multiple other factors contribute to the onset of major hypoxic crises in the northern Adriatic Sea (Alvisi and Cozzi Reference Alvisi and Cozzi2016). For example, the 1977 hypoxic event correlated with low barometric pressure and an exceptionally high freshwater input (Degobbis et al. Reference Degobbis, Smodlaka, Pojed, Škrivanić and Precali1979; Stefanon and Boldrin Reference Stefanon and Boldrin1982). In contrast, the 1989 hypoxic event correlated with lower Po discharge but with high barometric pressure and prolonged duration of stratification (Supić et al. Reference Supić, Orlić and Degobbis2000). Therefore, the role of nutrient enrichment probably added to the effects of climate in generating some hypoxic events in the late twentieth century.
The lack of relation to the river discharge, in contrast to the frequency of hypoxia, indicates that the effects of floods, potentially increasing sediment instability, were not important in determining the temporal increase in abundance of C. gibba. The role of other anthropogenic stressors that can account for the increase in abundance of C. gibba, such as an increase in dredging and trawling that slows recovery of communities in the Gulf of Trieste and contributes to sediment instability (Stachowitsch Reference Stachowitsch1991; Lotze et al. Reference Lotze, Coll and Dunne2011; Mautner et al. Reference Mautner, Gallmetzer, Haselmair, Schnedl, Tomašových and Zuschin, M.2018), is probably less important, because trawling and dredging activity would increase time averaging and destroy flood-event stratification in the sediment via higher frequency of sediment reworking.
The associations between higher abundance of C. gibba on one hand and higher TOC and reduced bioturbation in sedimentary sequences on the other hand (leading to reduced stratigraphic disorder and time averaging) thus indicate that the outbreaks by C. gibba reflect a community-level response to eutrophication and increased frequency of hypoxia in the twentieth century. During this shift, the balance between preservation and postdepositional modification, originally in favor of bioturbational destruction under normoxic conditions, shifted toward the preservation of flood layers and reduced bioturbation under more frequent hypoxic conditions. This change probably led to less efficient bioirrigation and smaller sediment heterogeneity (e.g., Mermillod-Blondin Reference Mermillod-Blondin2011), reduced biogeochemical cycling (e.g., Lohrer et al. Reference Lohrer, Thrush and Gibbs2004; Braeckman et al. Reference Braeckman, Provoost, Gribsholt, Van Gansbeke, Middelburg, Soetaert, Vincx and Vanaverbeke2010), and less efficient bentho-pelagic coupling (e.g., Gray et al. Reference Gray, Wu and Or2002). This change in bioturbational mixing also allowed preservation of ecological changes in sediment cores.
Conclusions
Temporal resolution and disorder distinguished on the basis of age-frequency distributions show that down-core changes in resolution are driven by changes in bioturbation rather than by changes in sedimentation rates. The late twentieth-century interval in sediment cores of the northern Adriatic Sea is associated with decreasing abundance of formerly abundant mollusks and with outbreaks of the opportunistic bivalve Corbula gibba. We thus validate previous inferences of significant changes in the composition of soft-bottom macrobenthic communities in circalittoral, oligophotic, or aphotic habitats based on heterogeneous and irregular sampling of living assemblages that were collected during the twentieth century. However, we show for the first time that these compositional changes were associated with declining thickness of the surface mixed layer and increasing preservation of organic matter, that these changes in bioturbation can be detected by changes in time averaging and disorder, and that the shift occurred relatively abruptly at around a.d. 1950. The relations between unmixed abundance of C. gibba and minimum dissolved oxygen concentrations at Po and Panzano imply that this major depositional and ecosystem regime shift was driven by higher frequency of hypoxic events in the late twentieth century, probably triggered by anthropogenic nutrient enrichment, over a broad spatial extent in the NW and NE Adriatic Sea. This shift effectively separates the sediments of the late twentieth-century eutrophication period from sediments of the early twentieth century that are similar to highstand deposits of the Po prodelta, which are typically pervasively bioturbated. The association of C. gibba outbreaks with reduced bioturbation indicates that the hypoxic events modified not only the composition of bivalve communities over broad spatial scales but also altered biogeochemical fluxes at the sediment–water interface by reducing the depth of the mixed layer.
Acknowledgments
We thank M. Aberhan, L. C. Anderson, and one anonymous reviewer for comments. This study was funded by the Austrian Science Fund (FWF project P24901), the Slovak Research and Development Agency (APVV 17-0555), and the Slovak Grant Agency (VEGA 0136–15). We thank J. Sedmak and F. Perco for help with sampling, D. A. Garcia Ramos for help with determination of trace fossils, and K. Whitacre for amino acid analyses. The authors would like to thank to M. Celio of ARPAFVG for onboard activities and hydrological data.
Supplementary Material
Data available from the Dryad Digital Repository: https://doi.org/10.5061/dryad.84g36m4


 Open access