

The global epidemic increase in obesity and associated co-morbidities( Reference Haslam and James 1 ) has stimulated the need to understand the factors that regulate appetite control. Although a wide range of weight-loss (WL) strategies are used by millions of people, most are based on empirical observations and an incomplete knowledge of why such approaches work. One such theme involves the use of high protein intakes, which has been shown in a number of studies to be effective in reducing both intake and hunger scores( Reference Skov, Toubro and Ronn 2 – Reference Johnstone, Horgan and Murison 5 ), and acute studies have reported protein as the most satiating of the macronutrients in both normal-weight and obese subjects( Reference Batterham, Heffron and Kapoor 6 ). Nonetheless, the actual mechanism for the satiating action of protein remains unresolved, and a range of hypotheses have been proposed including elevated postprandial thermogenesis( Reference Westerterp-Plantenga, Rolland and Wilson 4 ), reduced gastric emptying rate( Reference Blom, Lluch and Stafleu 7 ), slower rates of digestion and absorption( Reference Hall, Millward and Long 8 ), supply of specific amino acids (AA) that act as a precursor for brain metabolites( Reference Markus, Olivier and Panhuysen 9 , Reference Fernstrom, Langham and Marcelino 10 ), and release of gut peptides involved in appetite regulation( Reference Kojima and Kangawa 11 – Reference Veldhorst, Nieuwenhuizen and Hochstenbach-Waelen 20 ). However, these various associations with appetite control have not been consistent in the literature( Reference Foster-Schubert, Overduin and Prudom 19 , Reference Erdmann, Lippl and Schusdziarra 21 – Reference Gibbons, Caudwell and Finlayson 23 ). In practice, a number of these mechanisms may combine to produce the overall impact on hunger and food intake, and such interactions will influence how studies are designed and interpreted.
In trying to identify specific mechanisms, two important points need to be considered. First, the generic term ‘protein’ masks the many and varied types of protein (and relevant amino acid composition) available within habitual diets, and these may not produce identical responses for appetite. This may create difficulty in identifying mechanisms, for example are the appetite-suppressing effects of whey proteins due to the rapidity of absorption( Reference Hall, Millward and Long 8 ) or the higher content of tryptophan compared with other AA in α-lactalbumin( Reference Fernstrom, Langham and Marcelino 10 )? Second, many studies( Reference Batterham, Heffron and Kapoor 6 – Reference Hall, Millward and Long 8 , Reference Foster-Schubert, Overduin and Prudom 19 , Reference Gibbons, Caudwell and Finlayson 23 – Reference van der Klaauw, Keogh and Henning 31 ) have examined acute responses and do not consider that metabolism of dietary protein and AA takes several days to adjust to altered supply( Reference Rand, Young and Scrimshaw 32 ). Furthermore, in a number of acute studies, test meals involve either single macronutrients( Reference Batterham, Heffron and Kapoor 6 ) or an unbalanced mixture( Reference Blom, Lluch and Stafleu 7 , Reference Foster-Schubert, Overduin and Prudom 19 , Reference van der Klaauw, Keogh and Henning 31 ) that would be difficult to sustain as part of a habitual diet. Although these studies provide important information, the relevance to the complexity of the free-living situation may be limited.
Therefore, the present study had two major aims. The first aim was to examine whether differences in composite hunger scores between normal- and high-protein diets (15 and 30 % of energy intake) were related to the postprandial concentrations of AA or gut-related hormones in plasma. The second aim was to test whether either hunger or hormone responses differed between diets containing high protein (30 %) and a mixture of protein and free AA (each 15 % of energy intake), the latter scenario approximating to the presence of a substantial proportion of rapidly digested and absorbed protein, but with similar AA composition to the intact protein. These comparisons were within a design based on fully controlled, iso-energetic WL diets, each provided for 10 d in a randomised cross-over design. Associated measurements included whole-body protein turnover in the fasted and postprandial states. The study also encompassed two meals (breakfast and lunch) within the experimental day at the end of each dietary period.
Subjects and methods
Volunteers and dietary interventions
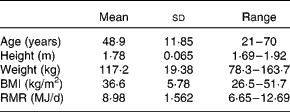
The present study was conducted according to the guidelines laid down in the Declaration of Helsinki, and all procedures were approved by the North of Scotland Research Ethics Service. Overweight or obese male volunteers (n 18) were recruited by newspaper and website advertisement. Written informed consent was obtained from all participants. The baseline characteristics are presented in Table 1. At the start of the study, the RMR (measured in the overnight-fasted state) was determined for each volunteer, as described previously( Reference Johnstone, Horgan and Murison 5 ), and which was used as the reference measurement throughout the study (Table 1).
Baseline characteristics of the study subjects (Mean values and standard deviations or ranges, n 18)
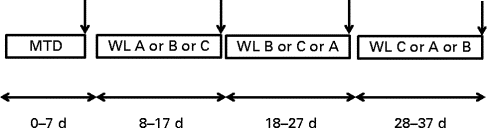
There were four periods of dietary intervention (Fig. 1), with all food supplied in cooked (breakfast) or ready-to-eat (lunch and dinner) form that could be heated if necessary. The volunteers were first provided for 7 d with a maintenance diet (MTD) at breakfast, lunch and dinner, all based on a 3 d rotating menu. The estimated metabolisable energy intake for this diet was based on 1·5 × RMR, adjusted to the nearest 0·5 MJ, and provided protein:carbohydrate:fat as 15, 55 and 30 % of metabolisable energy (Table 2). The next three diets were supplied to induce WL, with energy intake fixed at 1·0 × RMR at enrolment (to the nearest 0·5 MJ) and were provided each for 10 d in a randomised cross-over design with no washout periods between interventions. These various WL diets were each provided as 5 d menus supplied in strict rotation. These diets were as follows: normal protein (NP), similar in macronutrient composition to the MTD but at lower intake; high protein (HP) with energy intake from protein being raised to 30 % at the expense of carbohydrate; normal protein plus amino acids (NPAA) with protein and a free l-AA mixture each contributing 15 % of energy. The individual AA were of current good manufacturing practice quality (Ajinomoto Foods Europe S.A.S.). NSP were provided at a minimum of 18 g/d for all diets. Specific protein sources have been reported to differ in hunger responses or hormone release( Reference Hall, Millward and Long 8 ), although this is not always the case( Reference Bowen, Noakes and Clifton 28 , Reference Martens, Lemmens and Westerterp-Plantenga 33 ), so it was necessary to ensure that the WL diets on the metabolic measurement day were similar. These were all based on chicken, eggs and turkey as the main protein sources, while the added free AA were of similar pattern to that found in beef and chicken breast. Although on other days the meals differed in ingredients, to allow variety for the volunteers, they were of similar macronutrient composition for each of the WL diets. Metabolic measurements were made on the last day of each dietary period (day 7 for the MTD and day 10 for the WL diets). All stable isotopes were obtained from Cambridge Isotope Laboratories.
Experimental design. For period 1, the first 7 d of the study, all volunteers were supplied with a maintenance diet (MTD). This was followed by three successive 10 d periods (without washout) during which they were supplied, in a randomised order, each of either a normal-protein diet (NP, WL A), a high-protein diet (HP, WL B) or a normal-protein diet supplemented with amino acids to raise protein levels equivalent to HP levels (NPAA, WL C). Psychometric measures of hunger were made daily throughout the study (except on the last day of each experimental period), while metabolic measurements were made on the last day of each experimental period ( ↓ ).
Average daily intakes and macronutrient composition of the four diets* provided to the eighteen volunteers (Mean values with their standard errors of the difference)
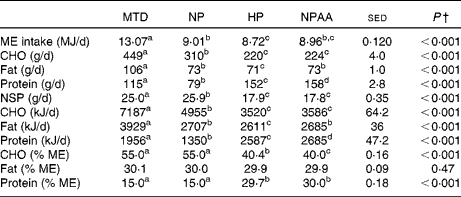
MTD, maintenance diet; NP, normal-protein diet; HP, high-protein diet; NPAA, mixture of normal protein plus free amino acids; ME, metabolisable energy; CHO, total carbohydrate.
a,b,c,dMean values within a row with unlike superscript letters were significantly different (P< 0·05; post hoc t test).
* The 7d MTD (supplied at energy intake equivalent to 1.5 x RMR), or 10 d weight-loss diets, each supplied at energy intake equivalent to 1·0 × RMR, with protein (NP and HP) and protein+free AA (NPAA) contributing 15 %, 30 % and 15 % protein+15 % of energy, respectively.
† Based on the average daily intake (either 7 d for the MTD or 10 d for the three weight-loss diets) for each volunteer and analysed by ANOVA, with volunteer, plus period within volunteer, set as random effects and with order, diet and their interaction as fixed effects. There were no significant diet × order interactions.
Body composition
Volunteers were weighed daily and were measured for body composition by air displacement plethysmography and RMR under fasting conditions at the end of each dietary period, as described previously( Reference Johnstone, Horgan and Murison 5 ). Blood samples for clinical parameters were taken at the same time.
Psychometric scores
During waking hours, volunteers were asked to record at hourly intervals their feelings related to hunger and appetite on a handheld electronic computer (Visor Handspring; Palm, Inc.) and based on a 100 mm scale, as described previously( Reference Johnstone, Faber and Gibney 34 ). From this questionnaire, answers to four of the questions that related to hunger, fullness, desire to eat and prospective consumption were combined into a composite appetite score( Reference Belza, Ritz and Sorensen 14 , Reference Chaput, Gilbert and Gregersen 35 ) based on the following formula: (hunger+desire to eat+(100 − fullness)+quantity able to eat)/4.
These psychometric measurements were recorded on all days except when the metabolic measurements were made when the close proximity of the study scientists was considered to create possible interference.
Metabolic measurements
On the last day of each dietary period and after an overnight fast, an 18 g Venflon catheter was inserted into an antecubital vein. Blood samples were taken at the various times stated below. Most samples were taken in heparinised tubes (Monovette; Sarstedt Limited), but for the measurement of plasma hormones, an additional 1 ml was taken into EDTA tubes containing 10 μl dipetidyl peptidase-4 inhibitor (Millipore catalogue no. DPP4-010), 1 mg Pefabloc SC (4-(2-aminoethyl)-benzenesulfonyl fluoride hydrochloride, Roche catalogue no. 11 429 868 001) and 10 μl Protease Inhibitor Cocktail (for general use, Sigma catalogue no. P2714) prepared in 100 ml of water. A fasted blood sample was withdrawn and then the volunteers were injected intravenously with a mixture of 150 mg [1-13C]leucine and 75 mg [1-13C]phenylalanine dissolved in 10 g sterile saline (9 g NaCl/l). Blood samples (3 ml) were taken into heparinised tubes at accurate known times of 2, 3, 4, 5, 6, 8, 10, 12, 16, 20, 25, 30 and 45 min. Volunteers were then given breakfast and were instructed to eat within 15 min. Blood samples were taken at 30 min intervals after the start of ingestion for a 5 h period. At 2·5 h, the volunteers were injected intravenously again with a mixture of 150 mg l-[1-13C]leucine and 75 mg l-[1-13C]phenylalanine dissolved in 10 g sterile saline, and samples were collected at similar intervals to those for the pre-breakfast bolus dose. At 5 h after breakfast, volunteers were given lunch, again consumed within 15 min and the 30 min collections continued for another 5 h. Blood collection, therefore, spanned the 5 h period after breakfast and the 5 h period after lunch. For the breakfast on day 10 of NPAA treatment, 33 % of the natural-abundance free l-leucine and l-phenylalanine addition was replaced with l-[2H3]leucine and l-[ring 2H5]phenylalanine.
Analyses
Enrichments of 13C and 2H forms of leucine and phenylalanine, as appropriate, were determined as t-butyldimethylsilyl derivatives( Reference Calder and Smith 36 ) by electron impact GC MS on a Voyager mass spectrometer (Thermo Scientific) coupled to a GC8000 Top gas chromatograph, with a 30 m × 0·25 mm × 0·25 μm EC1 capillary column (Sigma-Aldrich). The fragment ions monitored were as follows: m/z 302, 303 ([1-13C]leucine); m/z 302, 305 ([2H3]leucine); m/z 336, 337 ([1-13C]phenylalanine); m/z 336, 341 ([ring 2H5]phenylalanine). AA concentrations were monitored by isotope dilution by various gravimetric procedures described previously( Reference Calder, Garden and Anderson 37 – Reference Lobley, Holtrop and Bremner 39 ) and expressed as molality (mol/kg). Large neutral amino acids (LNAA) represent the sum of isoleucine, leucine, valine, phenylalanine and tyrosine.
Insulin, peptide YY (PYY, total), ghrelin (active), glucose-dependent insulinotropic peptide (GIP) (total) and glucagon-like peptide 1 (active) were analysed simultaneously with a Human Gut Hormone Panel (Merck Millipore). For each volunteer, twenty-one samples were obtained for 10 h on each diet, and all the four diets were analysed singly on the same plate. Standards were adjusted to accommodate the physiological range. In practice, the sensitivity of glucagon-like peptide 1 was found inadequate for the first six volunteers and, therefore, omitted from the remaining analyses. Glucose concentration was determined with a clinical analyser (Kone Limited) based on the hexokinase reaction (Thermo Fisher Limited). Each sample was measured in quadruplicate, and care was taken to prevent evaporation while the tubes were contained within the thermostatically controlled well.
Calculations and statistical analyses
AUC, both total (AUCt) and incremental (AUCi), were calculated by a trapezoid approach. The AUCi only considers values that exceed the baseline value( Reference Wolever 40 ), so all data are positive, but this is not appropriate when the response to a meal involves a decrease, as was the case with ghrelin and certain non-essential AA, including glycine and serine. Furthermore, when data after the second meal (lunch) were analysed, any elevated values just before consumption resulted in many later values that were below the baseline value and not included within the AUCi. For this reason, data are presented in net incremental form (net AUCi), calculated as total AUC minus baseline value × time( Reference Wolever 40 ). This provided overall data in either negative or positive forms.
Data from the bolus injections of l-[1-13C]leucine and l-[1-13C]phenylalanine were fitted to a two-exponential function, with parameters A 1, A 2, λ1 and λ2 being derived from curve fitting( Reference Wolfe 41 ). The irreversible loss rate (ILR, μmol/min) was then calculated based on the dose injected (μmol) from the following formula:
 $$\begin{eqnarray} ILR = \frac {dose}{(( A _{1}/ \lambda _{1}) + ( A _{2}/ \lambda _{2}))}. \end{eqnarray}$$
Statistical procedures were analysed by Genstat 13th Edition, Release 13.2 (VSN International) and R version 2.12 (R Foundation for Statistical Computing). For period effects, the MTD was always given in period 1, with the three different WL diets (NP, NPAA and HP) being randomised over the subsequent three periods. For this reason, order was used to describe the actual randomisation, for which based on the design (Fig. 1), there were six possible combinations of order that were repeated three times across the eighteen volunteers. So each order involved three volunteers. Time covers periods within the 10 h of each experimental day. For comparison of the time courses of concentration data for gut hormones or AA in plasma or between periods of the day (e.g. post-breakfast v. post-lunch) a mixed-design ANOVA was used, with volunteer, with period and time plus their interaction nested within volunteer, set as random factors and with order, time and diet, plus their interactions as fixed factors. When comparing one time point only (e.g. after overnight fast or AUCi), volunteer, with period nested within volunteer, were set as random factors, while order and diet, plus their interaction set as fixed factors. Similar error structures were adopted when only the three WL diets were compared. For the composite hunger score, a mixed model was fitted using residual maximum likelihood due to a number of missing values. The time of maximum plasma concentration for either AA or hormones following either the breakfast or lunch meals was analysed, with volunteer, plus meal, period and their interaction within volunteer, set as random effects and with order, meal and diet, plus their interactions as fixed effects. To test for length of time under WL conditions (10, 20 or 30 d), the three WL diets were analysed with the appropriate MTD value set as a covariate and with volunteer, plus period, time and their interaction nested within volunteer, as random factors, while period, time and diet, plus their interactions as fixed factors. For all analyses, significance was assessed at P< 0·05, with a marginal indication at P< 0·10. For all analyses, when the effect of diet or a diet × time interaction was significant (P< 0·05), means were compared by calculating a post hoc t statistic based on the sed and df from the ANOVA output.
Relationships between composite hunger and both AUCt and net AUCi for gut hormones, glucose, leucine and phenylalanine were investigated by linear regression analysis. The emphasis was on whether associations existed in addition to those induced by volunteer effects, and so regression analysis was applied to residuals when volunteer was fitted to linear models of the data, but diet and other effects were not fitted as the interest was in associations that may partly have been driven by diet effects.
Results
Body weight and clinical parameters
Data are presented in Table 3. Mean body weight decreased ( − 4·1 kg, P< 0·001) between the MTD and after three successive 10 d periods on the combination of WL diets, with the majority of the loss associated with fat ( − 2·74 kg, P< 0·001). There were no differences between the WL diets in terms of either weight or fat loss. The interaction of order × diet (P< 0·001) for both weight and body fat was a consequence of linear decreases over the three successive, but randomised, periods of WL. WL, or lowered energy intake, also caused a reduction in the plasma concentrations of cholesterol ( − 8·4 %, P< 0·001), LDL-cholesterol ( − 10·4 %, P< 0·001), HDL-cholesterol ( − 9·3 %, P= 0·03), glucose ( − 3·8 %, P= 0·027) and TAG ( − 22·9 %, P= 0·025). WL also increased plasma 3-hydroxybutyrate (4–9-fold, P< 0·001), especially for the HP and NPAA diets, which also showed increased plasma concentration of urea (+0·92 mmol/l, P< 0·001). The was an order × diet effect (P= 0·036) for HDL-cholesterol due to low values for the three volunteers randomised to one order.
Impact of the four dietary interventions† on body composition and clinical parameters at the end of each dietary intervention for the eighteen volunteers (Mean values with their standard errors of the difference)

MTD, maintenance diet; NP, normal-protein diet; HP, high-protein diet; NPAA, mixture of normal protein plus free amino acids; LDL-C, LDL-cholesterol; HDL-C, HDL-cholesterol; BP, blood pressure; bpm, beats/min.
a,b,cMean values within a row with unlike superscript letters were significantly different (P< 0·05; post hoc t test).
* Order × diet interaction (P< 0·05), see text for details.
† The 7d MTD (supplied at energy intake equivalent to 1.5 × RMR), or 10 d weight-loss diets, each supplied at energy intake equivalent to 1·0 × RMR, with protein (NP and HP) and protein+free AA (NPAA) contributing 15 %, 30 % and 15 % protein+15 % of energy, respectively.
‡ Analysed by ANOVA, with volunteer, plus period within volunteer, set as random effects and with order, diet and their interaction as fixed effects.
Composite hunger scores
Of the individual components for the composite hunger score, there were significant main effects of diet on hunger (P= 0·024), desire to eat (P< 0·001) and quantity able to eat (P= 0·011) but not fullness, with diet × time interactions for desire to eat (P= 0·045) and a marginal indication for fullness (P= 0·057). For all diets, there was a strong effect (P< 0·001) for composite hunger to vary with time of day (Fig. 2). In addition, there were effects of diet on composite hunger scores across all the diets (P= 0·012) for the combined values during the post-breakfast and post-lunch periods (mean composite hunger values: MTD 29·1, NP 31·0, HP 25·2, NPAA 28·0, sed 1·64), primarily driven by the greater value for the NP compared with the HP diets (P= 0·003) based on the post hoc t test. Although composite hunger scores across all the diets were lower for breakfast than for lunch (26·5 v. 30·2, sed 0·79, P< 0·001), the same pattern between the diets was maintained, with HP values being lower than the NP values (post-breakfast P= 0·005; post-lunch P< 0·001). There were no significant diet × time interactions for any composite hunger analyses. In addition, there were no differences in composite hunger scores after the overnight fast between either all (P= 0·92) or the three WL (P= 0·56) diets.
Hourly responses in composite hunger score to the four diets in the 5 h periods following both breakfast and lunch: MTD (○), maintenance diet; NP (●), normal-protein diet; NPAA (Δ), mixture of normal protein plus free amino acids; HP (▲), high-protein diet. Meals were provided immediately after measures made at 0 min (breakfast) and 300 min (lunch). Values are means of either 6 d (MTD) or 9 d (NP, HP and NPAA), with their standard errors represented by vertical bars. Data were analysed using residual maximum likelihood, with volunteer, plus period, time and their interaction all nested within volunteer, set as random factors and with order, time, diet and their interactions as fixed factors. For this analysis, time represents the psychometric parameters recorded hourly each day. Data were analysed for either all diets or just the three weight-loss diets. There were no time × diet interactions.

Amino acid responses
Overnight-fasted and pre-lunch values
After overnight fasting, plasma concentrations of most essential AA were lower (P< 0·001) for the NP diet than for the MTD (Table 4), except for the unchanged values of methionine, threonine and isoleucine. Within the WL diets, values for leucine, valine, isoleucine and lysine as well as urea were greater (P< 0·01) for the HP and NPAA diets than for the NP diet. The values for phenylalanine and histidine were higher for the NPAA diet, while those for methionine and threonine were lower for the HP diet. For all the three WL diets, the values for fasting tryptophan were similar, but lower than that for the MTD (P< 0·001). For the non-essential AA, plasma concentrations were greater (P< 0·001) for the MTD than for the WL diets for alanine, proline and tyrosine, but lower (P< 0·001) for serine. There were order × diet interactions for leucine (P= 0·004), glycine (P= 0·039), cysteine (P= 0·039) and tyrosine (P= 0·036); however, there was no consistent pattern between responses for these AA.
Effect of the four dietary interventions‡ on overnight-fasted plasma amino acid (AA) concentrations (μmol/kg) and leucine irreversible loss rate (ILR, μmol/min) at the end of each dietary intervention period for the eighteen volunteers (Mean values with their standard errors of the difference)

MTD, maintenance diet; NP, normal-protein diet; HP, high-protein diet; NPAA, mixture of normal protein plus free amino acids; Cys, cysteine+cystine; LNAA, large neutral amino acids.
a,b,cMean values within a row with unlike superscript letters were significantly different (P< 0·05; post hoc t test).
Mean value was significantly different from that pre-lunch for the same diet (pre-lunch data not shown): * P< 0·05, ** P< 0·01, *** P< 0·001 (post hoc t test).
† Order × diet interaction (P< 0·05), see text for details.
‡ The 7d MTD (supplied at energy intake equivalent to 1.5 × RMR), or 10 d weight-loss diets, each supplied at energy intake equivalent to 1·0 × RMR, with protein (NP and HP) and protein+free AA (NPAA) contributing 15 %, 30 % and 15 % protein+15 % of energy, respectively.
§ Standard error of the difference based on all four diets.
∥ P value for the overnight-fasted values based on all the four diets obtained from ANOVA, with volunteer, plus period within volunteer, set as random effects and with order, diet and their interaction as fixed effects. Plasma concentrations were also compared across time between pre-breakfast (overnight fasted, 0 min) and pre-lunch (300 min after breakfast) for all four diets. For this reason, ANOVA involved volunteer, plus period, time (pre-breakfast and pre-lunch) and their interaction all nested within volunteer, as random effects and with order, diet and time and their interactions as fixed effects.
¶ Fischer's ratio is the concentration ratio of (Phe+Tyr)/(Ile+Leu+Val).
†† Trp:LNAA represents Trp/(Ile+Leu+Val+Phe+Tyr).
‡‡ Whole-body ILR, based on the injection of [1-13C] leucine and using the plasma enrichment of leucine as the precursor pool. The ILR were measured in both the overnight-fasted and fed states (150–195 min after breakfast). The patterns for phenylalanine kinetics were similar to those observed for leucine (data not shown).
For the MTD, most AA returned to overnight-fasted concentrations before lunch (data not shown), except for tryptophan among the EAA. For the HP diet, values for all AA except serine, glutamate and glutamine were greater (P< 0·05) pre-lunch than pre-breakfast (Table 4 and Fig. 3).
Temporal changes in the peripheral plasma concentrations of (A) leucine, (B) phenylalanine, (C) tryptophan and (D) plasma tryptophan:LNAA (large neutral amino acid) ratio. MTD (○), maintenance diet; NP (●), normal-protein diet; NPAA (Δ), mixture of normal protein plus free amino acids; HP (▲), high-protein diet. Meals were offered at 0 min (breakfast) and 300 min (lunch). Values are means, with their standard errors represented by vertical bars. Data were analysed by ANOVA, with volunteer, plus period, time and their interaction all nested within volunteer, set as random factors and with order, time, diet and their interactions as fixed factors. For this analysis, time represents the values taken every 30 min during the 10 h of blood sampling taken on the last day of each experimental period. P 3WL is the comparison between the three weight-loss diets (HP, NP and NPAA), while P all4 also includes the MTD in the analysis. T × D represents the time × diet interaction. A colour version of this figure can be found online at http://www.journals.cambridge.org/bjn

Postprandial responses
The post-meal responses in the plasma concentrations of leucine, phenylalanine and tryptophan are shown in Fig. 3 (data for the other AA are available on request). In terms of general responses, within each diet, the time to maximum concentration was similar after breakfast and after lunch for leucine and phenylalanine except for an earlier peak concentration post-lunch for leucine on the HP diet (mean 178 v. 230 min, P= 0·002) and later peak concentration post-lunch for phenylalanine on the MTD (mean 185 v. 61 min, P< 0·001). However, for tryptophan, the peak concentration after lunch occurred at least 50 min later than after breakfast (P< 0·01), except for the HP diet where the situation was reversed (P= 0·01). Despite the overall temporal similarities, the peak concentrations differed consistently between the diets in the order NP < MTD < HP < NPAA (P< 0·01), except for tryptophan where the values were similar for the HP and NPAA diets.
In terms of specific diets, the concentrations of the three AA for the MTD peaked at 60 min post-breakfast, but by lunch, they returned to overnight-fasted values. The time to maximum plasma concentration took longer (180 min, P< 0·001) after ingestion of lunch and remained elevated (P< 0·01) by the time of dinner. Ingestion of the NP diet did not lead to marked changes in plasma concentrations, and within 300 min of consuming either breakfast or lunch had returned to fasting values for leucine and phenylalanine but not for tryptophan. For the HP diet, the maximum concentrations for all the three AA occurred later than for any other diet post-breakfast (mean 205 min, P< 0·001), and remained greater than the overnight-fasted values by lunchtime (P< 0·001). For the NPAA diet, following breakfast, the maximum concentrations for the three AA were greater (P< 0·001) than for the other diets, and these changes occurred at approximately 60 min after the meal. Although these values declined steadily thereafter, and to less than that observed for the HP diet (P< 0·01) at lunch, for leucine and phenylalanine these still remained above the overnight-fasted concentrations (P< 0·001). All these differences in the postprandial responses contributed to the time × diet interaction (P< 0·001) observed for each of the three AA (Fig. 3(A)–(C)). Indeed, for the majority of the time points over the 10 h period, plasma leucine concentrations differed between all the diets (P< 0·001; see Fig. 3(A)). This was also the situation for phenylalanine (Fig. 3(B)), except for similar values in the first 60 min after breakfast for the NP diet in comparison with the MTD and HP diet, while following 3 h post-lunch, the values for the MTD, NP and NPAA diets were also not different.
The pattern of tryptophan responses was similar to that of leucine, except that the similarity between the NP diet and the MTD and HP diet persisted for 120 min after breakfast. In terms of the tryptophan:LNAA ratio, fasting values differed (P< 0·001) between diets (Table 4) as did the mean post-breakfast ratios (P< 0.001; Table 5). These differences were maintained at all times except for 30–150 min for the HP diet v. MTD and for 210–300 min for the HP v. NPAA diet. Although the overall postprandial responses were significant (P< 0·001), there was a time × diet interaction (P< 0·001) that reflected the different responses between the diets, e.g. the near constant ratio for the NP diet and the rapid decline for the NPAA diet just after the meal (Fig. 3(D)).
Effect of the four dietary interventions‡ on the net incremental AUC (net AUCi, μmol/kg×min) for plasma amino acid (AA) concentrations for the 5 h period between breakfast and lunch during the last day of each dietary intervention period for the eighteen volunteers (Mean values with their standard errors of the difference)

MTD, maintenance diet; NP, normal-protein diet; HP, high-protein diet; NPAA, mixture of normal protein plus free amino acids; Cys, cysteine+cystine; AUCt, total AUC; LNAA, large neutral amino acids.
a,b,c,dMean values within a row with unlike superscript letters were significantly different (P< 0·05; post hoc t test).
Mean value was significantly different from that for the 5 h post-lunch period for the same diet (post-lunch data not shown): * P< 0·05, ** P< 0·01, *** P< 0·001 (post hoc t test).
† Order × diet interaction (P< 0·05), see text for details.
‡ The 7d MTD (supplied at energy intake equivalent to 1.5 × RMR), or 10 d weight-loss diets, each supplied at energy intake equivalent to 1·0 × RMR, with protein (NP and HP) and protein+free AA (NPAA) contributing 15 %, 30 % and 15 % protein+15 % of energy, respectively.
§ Standard error of the difference based on all four diets.
∥ P value for all the diets at 5 h after breakfast was obtained from ANOVA, with volunteer, plus period within volunteer, set as random effects and order × diet and their interaction as fixed effects. The net AUCi were also compared for time between the 5 h post-breakfast and the 5 h post-lunch (see Table 6) for all the four diets. Data were analysed based on ANOVA, with volunteer, plus period, time and their interaction all nested within volunteer, set as random effects and with order, diet and time and their interactions as fixed effects.
¶ AUCt values for Fischer's ratio, based on (Phe+Tyr)/(Ile+Leu+Val), while the Trp:LNAA ratio represents Trp/(Ile+Leu+Val+Phe+Tyr). For these two comparisons, AUCt rather than net AUCi were used. As for several of the diets, the AA concentrations decreased below the fasting value within the 5 h period after breakfast, yielding negative ratios.
The patterns shown in Fig. 3 were reflected in net AUCi for the 5 h period following both breakfast (Table 5) and lunch (Table 6). For the 5 h post-breakfast, the lowest net AUCi for leucine was for the NP diet ( < 0·001) and averaged just 5 μmol/kg per min above the fasted value. This compares with 77 μmol/kg per min for the NPAA diet, with the MTD and HP diet being intermediate at 23 and 39 μmol/kg per min, respectively, but all the three WL diets differed from each other (P< 0·001). This pattern was repeated for leucine during the post-lunch period, with the absolute increases similar to post-breakfast, albeit against a greater pre-meal concentration. For phenylalanine post-breakfast, the net AUCi for the MTD and NP diet were similar and both differed from the HP and NPAA diets (P< 0·001), with, again, the greatest values for the latter (P< 0·001). This pattern (and with similar incremental values) was repeated for the 5 h post-lunch period.
Effect of the four dietary interventions‡ on the net incremental AUC (net AUCi, μmol/kg×min) for plasma amino acid (AA) concentrations during the 5 h period between lunch and dinner on the last day of each dietary intervention period for the eighteen volunteers* (Mean values with their standard errors of the difference)

MTD, maintenance diet; NP, normal-protein diet; HP, high-protein diet; NPAA, mixture of normal protein plus free amino acids; Cys, cysteine+cystine.
a,b,c,dMean values within a row with unlike superscript letters were significantly different (P< 0·05; post hoc t test).
* For comparison of net AUCi for the 5 h periods post-breakfast and post-lunch, see Table 5.
† Order × diet interaction (P< 0·01); see text for details.
‡ The 7d MTD (supplied at 1.5 × RMR), or 10 d weight-loss diets, each supplied at energy intake equivalent to 1·0 × RMR, with protein (NP and HP) and protein+free AA (NPAA) contributing 15 %, 30 % and 15 % protein+15 % of energy, respectively.
§ Standard error of the difference based on all the four diets.
∥ P value for all the diets was obtained from ANOVA, with volunteer, plus period nested within volunteer, set as random effects and with order × diet and their interaction as fixed effects.
Leucine and phenylalanine kinetics
Treatment effects were similar for leucine ILR (Table 4) and phenylalanine ILR (data not shown). In the overnight-fasted condition, ILR equates to whole-body protein breakdown, and was lower for the reduced protein intake of the NP diet compared with the MTD (P< 0·001). The additional protein or AA supplied as HP or NPAA resulted in ILR that were similar to the MTD, but greater than the NP diet (P< 0·01). These differences between the NP diet and the other three diets were maintained 2·5 h after ingestion of breakfast, except that all values were greater (P< 0·001). The greater ILR post-breakfast is probably due to a combination of AA absorption and stimulation of protein turnover in response to food intake.
Hormone responses
Overnight fasted and pre-lunch
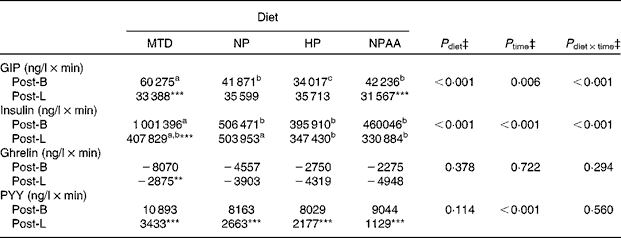
In the overnight-fasted state, both total GIP and active ghrelin were not different between the diets, while insulin and glucose were greater for the MTD than for the three WL diets (+56 %, P< 0·001 and +7 %, P< 0·001, respectively; Table 7). Fasting total PYY concentration was also greater for the MTD than for the HP (+11 %, P= 0·039) and NPAA (+14 %, P= 0·013) diets; however, no differences were found between the three WL diets. A similar between-diet pattern was observed at 5 h after breakfast, i.e. just before lunch, except that total GIP concentration was greater for the MTD (P< 0·05) than for the NP (+40 %) and HP (+53 %) diets, while total PYY concentration was similar for the MTD and HP diet (Table 7). Despite these pattern similarities, there were considerable differences between the absolute values pre-breakfast and pre-lunch. For example, the pre-lunch values for total GIP and total PYY concentrations exceeded fasted values (>300 and >26 %, respectively, both P< 0·001) for all the diets, whereas active ghrelin concentration returned to fasting values within 5 h after breakfast. Furthermore, although insulin values just before lunch for the MTD were approximately double those before breakfast (P< 0·001), the pre-lunch concentrations for the three WL diets were not different from the fasted condition. In contrast, plasma glucose concentrations were lower pre-lunch than pre-breakfast across all the four diets (P< 0.05). At 5 h after lunch, the between-diet pattern was again similar (Figs. 4(A)–(C) and 5(A) and (B)), but absolute values for active ghrelin were greater than pre-lunch (range 44–79%; P< 0.01) as was glucose for the HP and NPAA diets (+6%; P< 0.01). The other hormones had similar concentrations just before lunch and dinner.
Effect of the maintenance diet (MTD) and three weight-loss (WL) diets (NP (normal protein), HP (high protein) and NPAA (normal protein plus free amino acids))† on fasting (0 min) and pre-lunch (300 min) plasma values for insulin, glucose, total glucose-dependent insulinotropic peptide (GIP), active ghrelin and total peptide YY (PYY) on the last day of each dietary intervention period for the eighteen volunteers (Mean values with their standard errors of the difference)

a,bMean values within a row with unlike superscript letters were significantly different (P< 0·05; post hoc t test).
Mean value was significantly different from that for the fasted period for the same diet: *P< 0·05, ***P< 0·001; (post hoc t test).
† The 7d MTD (supplied at energy intake equivalent to 1.5 × RMR), or 10 d weight-loss diets, each supplied at energy intake equivalent to 1·0 × RMR, with protein (NP and HP) and protein+free AA (NPAA) contributing 15 %, 30 % and 15 % protein+15 % as free AA, respectively.
‡ Analysed by ANOVA and with time as the comparison between the fasted and immediate pre-lunch values within each hormone. Volunteer, plus period, time and their interaction all nested within volunteer, were set as random effects, while order, diet, time plus their interactions as fixed effects. P diet × time shows the significance of diet × time interactions. There were no significant effects of order or order interactions. When there was a significant effect of diet (P< 0·05), then effects within time (i.e. either fasted or pre-lunch) were compared by post hoc t tests based on appropriate sed. When there was a significant (P< 0·05) effect of time and/or time × diet, for each hormone, the differences within the diet between the fasted and pre-lunch values were compared with post hoc t tests based on appropriate sed.
Temporal changes in the peripheral plasma concentrations of (A) insulin, (B) glucose and (C) glucose-dependent insulinotropic peptide (GIP) (total). MTD (○), maintenance diet; NP (●), normal-protein diet; NPAA (Δ), mixture of normal protein plus free amino acids; HP (▲), high-protein diet. Meals were offered at 0 min (breakfast) and 300 min (lunch). Values are means, with their standard errors represented by vertical bars. Data were analysed by ANOVA, with volunteer, plus period, time and their interaction all nested within volunteer, set as random factors and with order, time, diet and their interactions as fixed factors. For this analysis, time represents the values taken every 30 min during the 10 h period of blood sampling taken on the last day of each experimental period. For the three weight-loss (3WL) diets, there was a diet effect for insulin (P= 0·003) and a tendency (P= 0·071) for GIP. Significant diet × time (T × D; P< 0·01) effects were observed for insulin, glucose and GIP for the 3WL diets. For all the four diets (all4), there were significant diet effects and significant T × D effects for insulin, glucose and GIP. * Mean values for the HP and NP diets were significantly different (P< 0·01) at specific time points. † Mean values for the HP and NPAA diets were significantly different (P< 0·01) at specific time points. ‡ Mean values for the NP and NPAA diets were significantly different (P< 0·01) at specific time points. A colour version of this figure can be found online at http://www.journals.cambridge.org/bjn

The effect of period, i.e. length of time (10, 20 or 30 d) on diets that promoted WL, was also assessed, with the fasting value at maintenance set as the covariate. Fasting total GIP, active ghrelin and total PYY concentrations did not alter over the three WL periods, although insulin showed a marginal indication to decrease (by 15 %, P= 0·062) between 10 and 30 d of WL.
Postprandial responses
The postprandial responses to breakfast and lunch (Figs. 4 (C) and 5 and (B)) were compared as net AUCi (Table 8). Between breakfast and lunch, the AUCi for total GIP was substantially greater (+50 %, P< 0·001) for the MTD than for the three WL diets. The response for the HP diet was only 80 % (P= 0·012) that of either the NP or NPAA diet post-breakfast. The insulin net AUCi for the MTD was approximately double (P< 0·001) that of the three WL diets post-breakfast, with the NP diet greater than the HP diet (+33 %, P< 0·001). This was not unexpected because the MTD contained more total carbohydrate content than the different WL diets post-breakfast, while both the HP and NPAA diets had the lowest sugar content due to the iso-energetic substitution of carbohydrate with protein (Table 2). Active ghrelin concentration declined in response to the meals (Fig. 5(A); Table 8) but the net AUCi was not different between the three WL diets, although with a marginal indication (P= 0·080) to decrease more for the MTD than for either the HP or NPAA diet post-breakfast. The increase in net AUCi for total PYY concentration in response to breakfast was similar between all the four diets (Table 8).
Temporal changes in the peripheral plasma concentrations of (A) ghrelin (active) and (B) peptide YY (PYY, total). MTD (○), maintenance diet; NP (●), normal-protein diet; NPAA (Δ), mixture of normal protein plus free amino acids; HP (▲), high-protein diet. Meals were offered at 0 min (breakfast) and 300 min (lunch). Values are means, with their standard errors represented by vertical bars. Data were analysed by ANOVA, with volunteer, plus period, time and their interaction all nested within volunteer, set as random factors and with order, time, diet and their interactions as fixed factors. For this analysis, time represents the values taken every 30 min during the 10 h period of blood sampling taken on the last day of each experimental period. For the three weight-loss (3WL) diets, there was a diet effect for ghrelin (P= 0·003). For the 3WL diets, a significant diet × time (D × T) effect (P= 0·004) was observed for PYY. For all the four diets (all4), there were significant diet effects and significant T × D effects for ghrelin and PYY. * Mean values for the HP and NP diets were significantly different (P< 0·01) at specific time points. † Mean values for the HP and NPAA diets were significantly different (P< 0·01) at the specific time point. A colour version of this figure can be found online at http://www.journals.cambridge.org/bjn

Effect of the maintenance diet (MTD) and three weight-loss (WL) diets (NP (normal protein), HP (high protein) and NPAA (normal protein plus free amino acids))† on the net incremental AUC (net AUCi) for the 5 h period between breakfast and lunch (Post-B) and the 5 h period following lunch (Post-L) for plasma concentrations of insulin, total glucose-dependent insulinotropic peptide (GIP), active ghrelin and total peptide YY (PYY) for the eighteen volunteers
a,b Mean values within a row with unlike superscript letters were significantly different (P< 0·05; post hoc t test).
Mean value was significantly different from that for Post-B for the same diet: *P< 0·05, **P< 0·01, ***P< 0·001; (post hoc t test).
† The 7d MTD (supplied at energy intake equivalent to 1.5 × RMR), or 10 d weight-loss diets, each supplied at energy intake equivalent to 1·0 × RMR, with protein (NP and HP) and protein+free AA (NPAA) contributing 15 %, 30 % and 15 % protein+15 % of energy, respectively.
‡ Analysed by ANOVA, with time as the comparison between Post-B and Post-L within each hormone. Volunteer, plus period, time and their interaction all nested within volunteer, were set as random effects, while order, diet, time plus their interactions as fixed effects. P diet × time shows the significance of diet × time interactions. There were no significant effects of order or order interactions. When there was a significant effect of diet (P< 0·05), the effects within time (i.e. either Post-B or Post-L) were compared by post hoc t tests based on appropriate sed. When there was a significant (P< 0·05) effect of time and/or time × diet, for each hormone, the differences within the diet between the net AUCi for Post-B and Post-L were compared with post hoc t tests based on appropriate sed.
For some hormones, the net AUCi response after the two meals was not identical, partly due to the greater ‘baseline’ value pre-lunch compared with pre-breakfast (Figs. 4 and 5; Table 8). This was the case for total PYY (P< 0·001) across all the diets (Table 8), even though the peak concentrations were greater post-lunch than following breakfast (Fig. 5(B)). Furthermore, all hormones, except ghrelin, showed lower net AUCi after lunch than following breakfast when the volunteers were on the MTD (P< 0·01). In contrast, the net AUCi for total GIP, active ghrelin and insulin were similar after the two meals for all the three WL diets, except for total GIP which was lower (P= 0·022) post-lunch than post-breakfast for the NPAA diet.
The difference in net AUCi between the MTD and the three WL diets was due to persistent differences at most time points. (Figs. 4(A)–(C) and 5(A) and (B)). For example, insulin for the MTD exceeded (P< 0·01) all the WL diets from 30 min after breakfast through to lunch, with a similar pattern for total GIP and glucose. Total PYY concentrations were also greater (P< 0·01) following the MTD than the other diets for intervals between 30 and 180 min after breakfast and for most of the period following lunch. Conversely, temporal responses of ghrelin were less clear, although values for the MTD were lower (P< 0·01) than those for the HP diet at 150–210 min after breakfast and for the last hour after lunch for the NP and NPAA diets.
Although the net AUCi following either breakfast or lunch were similar between the three WL diets, there were temporal differences in plasma concentrations. For example, total GIP was less (P< 0·01) for the HP diet than for the NPAA diet at 120 and 180 min after breakfast and at 180 and 240 min after lunch. For active ghrelin, the concentrations were lower for the NPAA diet than for the HP diet (P< 0·01) at 150 and 210 min post-breakfast, and the NPAA diet was lower than the NP diet at 4 and 5 h after lunch. Concentrations of total PYY were similar across all the three WL diets throughout the 10 h period. In contrast, insulin was greater (P< 0·01) for the NP diet than for the HP diet during the 60–180 min period after lunch, which matched the higher glucose concentrations (P< 0·01) at these time points. When the mean concentrations over the whole 10 h period were analysed, there were effects (P< 0·001) of diet on the hormones. For total GIP, total PPY, insulin and glucose, this was due to higher mean concentrations for the MTD than for the three WL diets. For active ghrelin, however, both the MTD and NPAA diet were lower (P< 0·001) than either the NP or HP diet (42·8, 41·0 v. 52·9 and 53·7 ng/l respectively, sed 3·2).
Relationships between hormones, amino acids and appetite responses
There were no strong relationships between any of the parameters tested (composite hunger, individual gut hormones and AA) based on the volunteer-adjusted residuals except for the following AUCt comparisons: leucine and phenylalanine (R 2 0·47, P< 0·001); ghrelin and phenylalanine (R 2 0·14, P= 0·001); PYY and phenylalanine (R 2 0·16, P< 0·001); insulin and ghrelin (R 2 0·18, P< 0·001); PYY and ghrelin (R 2 0·10, P= 0·006); glucose and insulin (R 2 0·26, P< 0·001). In terms of net AUCi comparisons, there were relationships between leucine and phenylalanine (R 2 0·69, P< 0·001), glucose and insulin (R 2 0·15, P< 0·001), insulin and PYY (R 2 0·27, P< 0·001). There were no significant relationships observed between composite hunger and any of the gut hormones or AA.
Discussion
A range of studies have suggested that higher protein intakes result in a reduced appetite( Reference Skov, Toubro and Ronn 2 – Reference Johnstone, Horgan and Murison 5 ) and greater interval between meals( Reference Porrini, Santangelo and Crovetti 42 – Reference Anderson and Moore 45 ). In practice, the ratio of protein to other macronutrients may be important because under WL conditions, absolute intakes of protein may not differ greatly between the weight-stable or weight-loss situation( Reference Westerterp-Plantenga, Luscombe-Marsh and Lejeune 46 ). To date, the actual mechanisms by which protein (in either absolute or relative amounts) has an impact on either satiety or satiation are unclear, but aspects of two present hypotheses relating, first, to the rate of protein digestion and absorption of AA( Reference Hall, Millward and Long 8 ) and, second, to the release of specific hormones by the gut( Reference Kojima and Kangawa 11 , Reference Batterham and Bloom 12 , Reference Belza, Ritz and Sorensen 14 ) were tested within the design of the present study. This involved comparison of three iso-energetic diets supplied under chronic WL conditions.
Many studies that relate to appetite and responses of peptide hormones are performed under acute conditions, i.e. in response to single meals or types of nutrient( Reference Batterham, Heffron and Kapoor 6 , Reference Blom, Lluch and Stafleu 7 , Reference Foster-Schubert, Overduin and Prudom 19 , Reference Gibbons, Caudwell and Finlayson 23 – Reference van der Klaauw, Keogh and Henning 31 ). For changes in protein intake, this is not optimal because 4–8 d can be needed for full adaptation of AA metabolism to occur( Reference Rand, Young and Scrimshaw 32 ). For this reason, where consequences of changes in the habitual intake of protein are the primary goal, chronic studies are needed( Reference Martens, Lemmens and Westerterp-Plantenga 33 , Reference Soenen, Martens and Hochstenbach-Waelen 47 ) and hence 10 d on each WL diet was selected for the present study.
Protein and amino acid dynamics
The involvement of specific AA in the regulation of appetite through a wide range of mechanisms, from taste to direct actions in the brain, has been examined over many years, with glutamate, leucine and tryptophan among the proposed main candidates( Reference Fromentin, Darcel and Chaumontet 48 ). In the present study, the 30 % higher protein intake for the HP and NPAA diets v. the NP diet resulted in changes in the fasted plasma concentrations of a number of AA, although such responses have not been consistent between studies( Reference Lobley, Holtrop and Bremner 39 , Reference Forslund, Hambraeus and van Beurden 49 ), suggesting that other factors, including age and energy intake, may be important. While peripheral plasma concentrations of both valine and isoleucine increased at fasting on the HP diet, compatible with the elevated rates of protein breakdown observed, leucine remained unaffected. Indeed, as there were no diet effects on composite hunger scores in the overnight-fasted state, none of the observed changes in baseline plasma AA appear sufficient to trigger the regulation of appetite.
In terms of postprandial responses for the various AA, although the net AUCi tended to match absolute protein intake (NP < MTD < HP), the temporal patterns were markedly different between the HP and NPAA diets, even though total AA supply was similar (assuming high values of protein digestibility). The rapid absorption of the free AA supplied with the NPAA diet resulted in the earliest and greatest change in plasma concentrations and also a larger net AUCi than for the HP diet. Links between plasma AA and appetite have been suggested( Reference Mellinkoff, Frankland and Boyle 50 ), possibly related to the stimulation of nerves within the splanchnic system( Reference Niijima 51 ) or the transport of AA into the brain( Reference Choi, Fletcher and Anderson 52 ). Indeed, direct actions of AA on satiety have been reported( Reference Davidenko, Darcel and Fromentin 53 ), with particular emphasis on leucine and mechanisms linked to increased mammalian target of rapamycin observed in the hypothalamus of rodents( Reference Ropelle, Pauli and Fernandes 54 ). Such a mechanism should have resulted in a reduced hunger score in the first hour after meal ingestion with the NPAA diet, but this was not observed. This supports recent data from mice where, although there was acute hypothalamic stimulation of mammalian target of rapamycin by leucine, there was no impact on food intake during a 10 d ingestion of leucine supplied in the drinking-water( Reference Zampieri, Pedroso and Furigo 55 ). Therefore, under the present experimental conditions (overweight men in chronic energy deficit), direct action of leucine on central mechanisms is probably not important in the regulation of hunger.
Tryptophan
Another potential central effect of AA involves tryptophan, a precursor of serotonin that exerts anorexigenic effects in the hypothalamus( Reference Simansky 56 – Reference Halford, Boyland and Lawton 58 ). Cerebral uptake of tryptophan involves competition with LNAA( Reference Fernstrom, Langham and Marcelino 10 , Reference Pardridge and Oldendorf 59 ), and changes in the tryptophan:LNAA ratio in plasma have been linked to appetite regulation( Reference Wolever, Jenkins and Josse 60 ), and this ratio decreases as BMI increases( Reference Roca, Proenza and Palou 61 ). Nonetheless, in acute studies, although provision of a protein source (α-lactalbumin) rich in tryptophan increased both plasma tryptophan concentration and the tryptophan:LNAA ratio in the postprandial state( Reference Markus, Olivier and Panhuysen 9 , Reference Fernstrom, Langham and Marcelino 10 , Reference Beulens, Bindels and de Graaf 62 ), this was not accompanied by altered sensations of appetite or subsequent food intake( Reference Beulens, Bindels and de Graaf 62 ). Furthermore, chronic ingestion of diets with normal or high protein intakes (15 or 30 % of energy intake) supplied to weight maintenance for 2 weeks did not show any difference in the 24 h profiles of either tryptophan or the tryptophan:LNAA ratio, although the higher-protein diet induced WL over a subsequent 12-week period when offered ad libitum ( Reference Koren, Purnell and Breen 22 ). In the present study, although both the HP and NPAA diets doubled the normal protein (AA) intake, this elevated the average tryptophan concentration by only 12–16 % at 5 h after breakfast, while the mean tryptophan:LCAA ratio decreased by 20–27 % compared with fasted values. These overall similarities mask temporal differences, however, because plasma tryptophan was elevated for the NPAA diet for the first 120 min after breakfast, but this was not associated with differences in hunger scores compared with the other diets. In contrast, the largest increases in plasma tryptophan occurred between 180 and 300 min for the HP diet, coincident with the strongest response in reduced composite hunger score. Over this latter period, however, the tryptophan:LCAA ratio was similar between the NPAA and HP diets. Therefore, although the present observations may support a role for tryptophan in hunger regulation, the tryptophan:LCAA ratio was not a good index. Nonetheless, the ratio of tryptophan:LNAA in both the HP and NPAA diets was only 0·05. This compares with 0·085 in α-lactalbumin, and therefore this, or other proteins of similar AA composition, may produce stronger effects than the meat-based sources used in the present study.
Gut hormone responses
To have an impact on intake, signals need to be conveyed from nutrients to centres of appetite control. One such mediation may involve the release of hormones and peptides by the gut. A number of these hormones were examined in the present study and, for convenience, a multiplex system was used for analysis, but this resulted in some restrictions. For example, the observed values for active glucagon-like peptide 1 were near the origin of the standard curve, and so were considered unreliable and not measured after the first six volunteers. Furthermore, total GIP and PYY concentrations were measured, rather than the truncated active forms as monitored for ghrelin. In practice, values for active PYY comprise approximately half of total( Reference Grandt, Schimiczek and Beglinger 63 , Reference Deacon, Nauck and Meier 64 ), and show similar responses to injection of the different forms of the hormone( Reference Sloth, Holst and Flint 65 ). Nonetheless, the possibility of a different response between the total and truncated forms of both hormones in the present study cannot be excluded( Reference Foster-Schubert, Overduin and Prudom 19 ). Although many studies have shown reduced hunger or appetite following injection of various peptides, in most cases, these are given at doses in excess of those observed in nutritional studies( Reference Mars, Stafleu and de Graaf 66 ), and therefore only nutrient-driven responses will be considered.
Ghrelin
Ghrelin, sometimes termed the ‘hunger’ hormone, is an orexigenic peptide with its plasma concentrations elevated during hunger( Reference Kojima and Kangawa 11 ). Most ghrelin (66 %) is released by gastric oxyntic cells, but the small intestine can also contribute with the amounts decreasing from the duodenum to the ileum( Reference Peeters 67 ). Ghrelin release is suppressed by macronutrient ingestion, but the extent and duration appears inconsistent. For example, while similar responses to meals of various macronutrient compositions have been observed( Reference Gibbons, Caudwell and Finlayson 23 , Reference van der Klaauw, Keogh and Henning 31 ), others have reported a greater decrease in either total( Reference Blom, Lluch and Stafleu 7 ), active( Reference Al Awar, Obeid and Hwalla 27 ) or total and acylated( Reference Foster-Schubert, Overduin and Prudom 19 ) ghrelin for protein compared with other macronutrients. Furthermore, although a recent meta-analysis has suggested that high-protein meals lead to reduced plasma concentrations for longer periods than high carbohydrate intakes( Reference Yang, Liu and Yang 68 ), some studies have even observed an increase in ghrelin concentration following a high-protein meal( Reference Erdmann, Lippl and Schusdziarra 21 ).
These variable responses may relate to study differences, including BMI, measurement time, acute v. chronic designs and the macronutrient composition of test meals. Furthermore, obese adults have lower fasting values for both the total and active ghrelin and respond less to a meal( Reference English, Ghatei and Malik 24 , Reference Zwirska-Korczala, Konturek and Sodowski 29 , Reference Carroll, Kaiser and Franks 69 ). Time to nadir for ghrelin differs between macronutrients, with carbohydrate the quickest( Reference Foster-Schubert, Overduin and Prudom 19 ), while protein produces a more persistent response( Reference Tannous dit, Obeid and Azar 26 ), independent of protein source( Reference Bowen, Noakes and Clifton 28 ). Furthermore, most studies involved a single meal intervention, and this would not allow for any adaptation to protein supply. Finally, often meals with extreme macronutrient compositions have been used to test for differences( Reference Foster-Schubert, Overduin and Prudom 19 , Reference Gibbons, Caudwell and Finlayson 23 , Reference van der Klaauw, Keogh and Henning 31 ).
In contrast, the present study involved short periods of adaptation (7 d for the MTD and 10 d for the WL diets), with fat ingestion fixed (30 % of energy) and then carbohydrate and protein varied proportionally (either 55 and 15 % for the MTD and NP diets or 40 and 30 % for the HP and NPAA diets). In addition, daily energy intakes were maintained constant under the WL conditions. In these circumstances, the net AUCi for active ghrelin was similar between all the four diets, after either breakfast or lunch, despite the difference in the amount of food eaten and energy intake (MTD v. the three WL diets) or the amount and form of protein (comparison between the three WL diets). Food volume would not be expected to exert an effect because stomach distension does not cause ghrelin release( Reference Erdmann, Lippl and Schusdziarra 21 ). While these data do not support earlier findings that ghrelin release is sensitive to the amount of protein ingested( Reference Blom, Lluch and Stafleu 7 , Reference Foster-Schubert, Overduin and Prudom 19 , Reference Al Awar, Obeid and Hwalla 27 ), they do concur with other reports that have shown no differences in ghrelin between meals of varied macronutrient compositions( Reference Gibbons, Caudwell and Finlayson 23 , Reference van der Klaauw, Keogh and Henning 31 ). Furthermore, similar responses in ghrelin were observed after 5 weeks on either a control diet or a high-protein and low-carbohydrate diet (both 30 % of energy intake) given to subjects with type 2 diabetes( Reference Gannon and Nuttall 70 ). This similarity in the postprandial response of active ghrelin to the various diets (both the MTD and the three WL diets) was complemented by the lack of difference for fasting values between the treatments. Therefore, active ghrelin does not appear to play a key role in the observed composite hunger scores, at least under the conditions of the present study.
Glucose-dependent insulinotropic peptide
GIP, released from K cells, especially those in the duodenum and the upper jejunum, is present in the circulation as the intact (1–42) and cleaved (3–42) states. GIP3–42 is the predominant form, and there is a good relationship (R 0·93) between total and intact GIP in the fed state but less strong (R 0·43) during fasting( Reference Troutt, Siegel and Chen 71 ). GIP stimulates pancreatic secretion of insulin( Reference Nauck, Bartels and Orskov 72 ), with GIP release being more sensitive to carbohydrate and fat than to protein( Reference Elliott, Morgan and Tredger 73 ) and with similar AUC for different protein amounts and sources, provided that fat and carbohydrate are also provided( Reference Gunnerud, Heinzle and Holst 74 ). Nonetheless, increased plasma GIP concentration was observed in response to acute ingestion of whey rather than casein( Reference Hall, Millward and Long 8 ). These fall into the categories of ‘fast’- and ‘slow’-digested proteins, respectively( Reference Boirie, Dangin and Gachon 75 ), while similar increases were observed with duodenal infusions of certain AA( Reference Thomas, Sinar and Mazzaferri 76 ). In the present study, the free AA supplied with the NPAA diet showed the expected rapid absorption via the duodenum and were of similar amounts to those provided by a previous infusion study( Reference Thomas, Sinar and Mazzaferri 76 ), and yet the response in GIP was similar to the other WL diets. This may be explained by either the adaptation period used in the present study or the possibility that other macronutrients dominated the release of GIP. Whatever the reason, the present data suggest that any response in GIP to protein within a normal balanced meal supplied to obese subjects is met at, or below, a protein supply of less than 15 % of energy intake and would not account for the observed differences in composite hunger score. This supports recent findings showing that postprandial GIP response to single meals of various macronutrient contents did not influence the sensation of satiety and hunger in either obese or normal-weight women( Reference Wikarek, Chudek and Owczarek 77 ).
Peptide YY
PYY, sometimes termed the ‘satiety’ hormone, is released from L-cells (as is glucagon-like peptide 1), especially those in the ileum. There are two forms that occur in plasma, PYY1–38 and PYY3–38, with the latter being more active( Reference Batterham and Bloom 12 ), which predominates in the fed state( Reference Grandt, Schimiczek and Beglinger 63 ). The greatest release of PYY in response to iso-energetic ingestion of macronutrients occurs with protein, followed by carbohydrate and then fat according to some reports( Reference Batterham, Heffron and Kapoor 6 , Reference van der Klaauw, Keogh and Henning 31 ), while another has claimed a greater response to fat( Reference Gibbons, Caudwell and Finlayson 23 ). The release of PYY can continue for many hours( Reference van der Klaauw, Keogh and Henning 31 , Reference Adrian, Ferri and Bacarese-Hamilton 78 ), and this would fit with the slower rate of digestion of protein and absorption along the digestive tract. Nonetheless, responses in PYY are detected within 15 min of food ingestion( Reference Batterham, Heffron and Kapoor 6 , Reference Adrian, Ferri and Bacarese-Hamilton 78 ). The present data support both these general findings. After an initial plasma peak in PYY at the first postprandial time point (30 min), there was a small decrease until 120 min when another more persistent rise occurred followed by a decrease 5 h after the meal, but with values still considerably greater than in the overnight-fasted state. One possible explanation is that the initial increase may relate to rapidly absorbed macronutrients, such as digestible carbohydrate, while the second peak may involve more slowly absorbed nutrients, including protein. It is unclear whether AA per se can signal PYY release because although the initial post-breakfast increase in PYY was greater for the NPAA diet than for the HP diet, this was not replicated in the early post-lunch period when PYY was similar between all the three WL diets. Interpretation is complicated by the continued absorption of breakfast protein at lunchtime with the HP diet and with still increased PYY values for all the diets.
Further complications exist for comparison with other literature data due to the choice of subjects (obese) and the design (WL). For example, although fasting PYY concentrations are similar between obese and normal adults, the plasma response in PYY to test meals is less for those with high BMI( Reference Zwirska-Korczala, Konturek and Sodowski 29 ). Furthermore, while WL induced by either diet restriction( Reference Soenen, Martens and Hochstenbach-Waelen 47 ) or Roux-en-Y bariatric surgery( Reference Jacobsen, Olesen and Dirksen 79 ) resulted in lowered fasting PYY concentration, such decreases were not observed in the present study, where the total period of WL was shorter (30 v. 42 d) than that in other studies( Reference Soenen, Martens and Hochstenbach-Waelen 47 ) and involved three different WL diets. Finally, relationships between appetite and PYY concentrations have been inconsistent( Reference Batterham, Heffron and Kapoor 6 , Reference Gibbons, Caudwell and Finlayson 23 , Reference van der Klaauw, Keogh and Henning 31 ), and the present study also failed to provide clear evidence for a link between composite hunger scores and plasma PYY.
Conclusions
Although the present study design has several important advantages, including strict control of both quantity and macronutrient composition of the diets coupled with intakes continued over periods of 7 or 10 d, these may be offset by some limitations. For example, no washout intervals were included and so there may be impacts of continuous WL, although this was not detected by the various statistical approaches used. Furthermore, as energy consumption was fixed for each volunteer, psychometric hunger scores were needed, rather than the use of direct measure of ad libitum intake. Such hunger scores may be less robust. Nonetheless, overall the present data do not provide clear evidence for the relationships between composite hunger and any single factor within those measured. This may not be too surprising because appetite regulation is undoubtedly a complex process, and many factors may combine to produce the overall response. Under the conditions employed in the present study, the data indicate that free AA concentrations in plasma do not play an important role, and this probably excludes a direct central action. In addition, with meals of mixed macronutrient composition, albeit under sub-maintenance energy intake, responses in several gut hormones do not appear to differ, even when protein intake is doubled. In future, models that integrate multiple features will probably be required in order to understand those interactions that have an impact on appetite control in subjects who consume mixed meals that suppress hunger and aid WL.
Acknowledgements
The authors gratefully acknowledge Jean Bryce, Nina Lamza and Karen Taylor at the Human Nutrition Unit at RINH for their support for meal preparation. The authors also acknowledge Vivien Buchan (multiplex hormone assays), A. Graham Calder and Susan Anderson (both stable isotope analyses) for vital analytical inputs.
The present study was funded as part of the core grant from the Rural and Environment Science and Analytical Services Division (RESAS) of the Scottish Government to the Rowett Institute of Nutrition and Health, University of Aberdeen.
The authors' contributions are as follows: G. E. L., A. M. J. and G. H. were responsible for the study concept and design; A. M. J., G. E. L., D. M. B. and C. F. were responsible for the data collection and collation; G. E. L., G. W. H. and G. H. were responsible for the data analysis and statistical matters; G. E. L., A. M. J., G.W. H. and G. H. were responsible for the first draft and critical revision of the manuscript for important intellectual content.
The authors declare that there are no conflicts of interest.


