

1. Introduction
The primary purpose of the Ice, Cloud and land Elevation Satellite (ICESat) mission is to detect ice elevation changes that are indicative of changes in ice volume over time in the Greenland and Antarctic ice sheets (Reference ZwallyZwally and others, 2002). Other scientific objectives include: measurements of sea-ice, ocean and land-surface elevations and surface roughness; multiple near-surface canopy heights over land; and cloud and aerosol studies. The main instrument on ICESat is the Geoscience Laser Altimeter System (GLAS). GLAS determines the range to the surface by measuring the time between the transmission of the laser pulse and the detection of the echo waveform from the surface. The two GLAS laser wavelengths are 1064 nm for measuring surface elevation and dense clouds heights, and 532 nm for measuring backscatter profiles of clouds and aerosols. The full width at half-maximum of the transmitted pulse is 6 ns. The ICESat orbit has an altitude of 600 km and an inclination of 94˚. The laser pulse rate is 40 shots per second.
Ice-sheet surface slope and roughness are mainly affected by bedrock topography, ice flow, ice thickness, wind and mass balance. Accurate surface slope and roughness information can be used to improve the accuracy of both laser altimeter and radar altimeter elevation measurements (Reference Brenner, Bindschadler, Thomas and ZwallyBrenner and others, 1983; Reference Zwally, Bindschadler, Brenner, Martin and ThomasZwally and others, 1983; Reference Bamber, Ekholm and KrabillBamber and others, 1998; Reference Zwally, Brenner, Fu and CazanaveZwally and Brenner, 2001). Reference Bentley and SheehanBentley and Sheehan (1992) used Geosat Exact Repeat Mission repeat ground-track data to calculate surface slope and then compared the elevations between Seasat and Geosat. Mean surface slope calculated at 1 km scale will be very useful for similar mass-balance studies. Reference Brenner, Koblinsky and BeckleyBrenner and others (1990) developed an algorithm to correct geoid-induced variations in repeat orbits over oceans. In this study, data from ICESat 8 day repeat tracks were used to determine the three-dimensional surface slope and surface roughness. The ICESat 1064 nm laser footprint diameter is about 70 m, and footprint separation is 172 m. Surface slope and surface roughness with wavelength <70 m can be studied by analysis of the spread of individual laser echo waveforms (Reference Yi and BentleyYi and Bentley, 1999). Surface slope and surface roughness with wavelength >172 m can be derived from ICESat repeat track elevation profiles.
In this paper, three-dimensional surface slope at 1km scale and along-track surface slope and roughness at 10 km scale are studied. Knowledge of the 1 km scale surface slope is essential for using satellite altimetry repeat ground tracks to do mass-balance studies. The along-track surface slope and roughness at the 10 km scale will help to better understand and improve surface elevations from radar altimetry.
ICESat/GLAS has three lasers. The first laser operated from 20 February to 29 March 2003. During this period, ICESat was in its 8day repeat orbit, which has 119 equally spaced ground tracks to cover the Earth. ICESat also has a 91 day repeat orbit with coverage about 11 times denser than the 8 day orbit. The 91 day orbit is used in later operations.
2. Algorithm
Satellite laser altimetry involves three basic measurements: (1) the range between the satellite and the laser footprint on the surface; (2) the shape of the echo pulse, which is related to the distribution of surface heights within the footprint; and (3) the echo pulse energy, which is linearly related to surface reflectivity.
ICESat 8 day repeat-orbit ground tracks repeat every 8 days and the repeat ground tracks are within 1 km of each other in the cross-track direction; the offset occurs because accurate cross-track pointing was not applied in this period. During the first 36 days of operation, four to five repeat orbits occurred within 1 km in the cross-track direction. This provided an opportunity for ICESat to measure surface slope in the cross-track direction at 1 km scale. In the later ICESat operating periods, accurate pointing was applied and the separation of repeat ground tracks was constrained to within 400 m. Since the ICESat laser sample interval is 172 m along-track, the along-track surface slope on 1 km scale can be derived from ICESat elevation profiles. An algorithm that uses data from repeat ground tracks to derive the three-dimensional surface slope is described below.
There are four major steps in the repeat ground-track elevation analysis: (1) select a reference ground track to align all repeat tracks; (2) align observed data in the along-track direction to points on the reference ground track; (3) calculate surface slopes in the cross-track and along-track directions; and (4) combine cross-track and along-track surface slopes and calculate surface roughness along the reference track. ICESat has a reference ground track for the 8 day repeat orbit that is surrounded by the 8 day repeat ground tracks. In mass-balance studies, elevations from repeat ground tracks can be projected to the reference ground track and compared with each other.
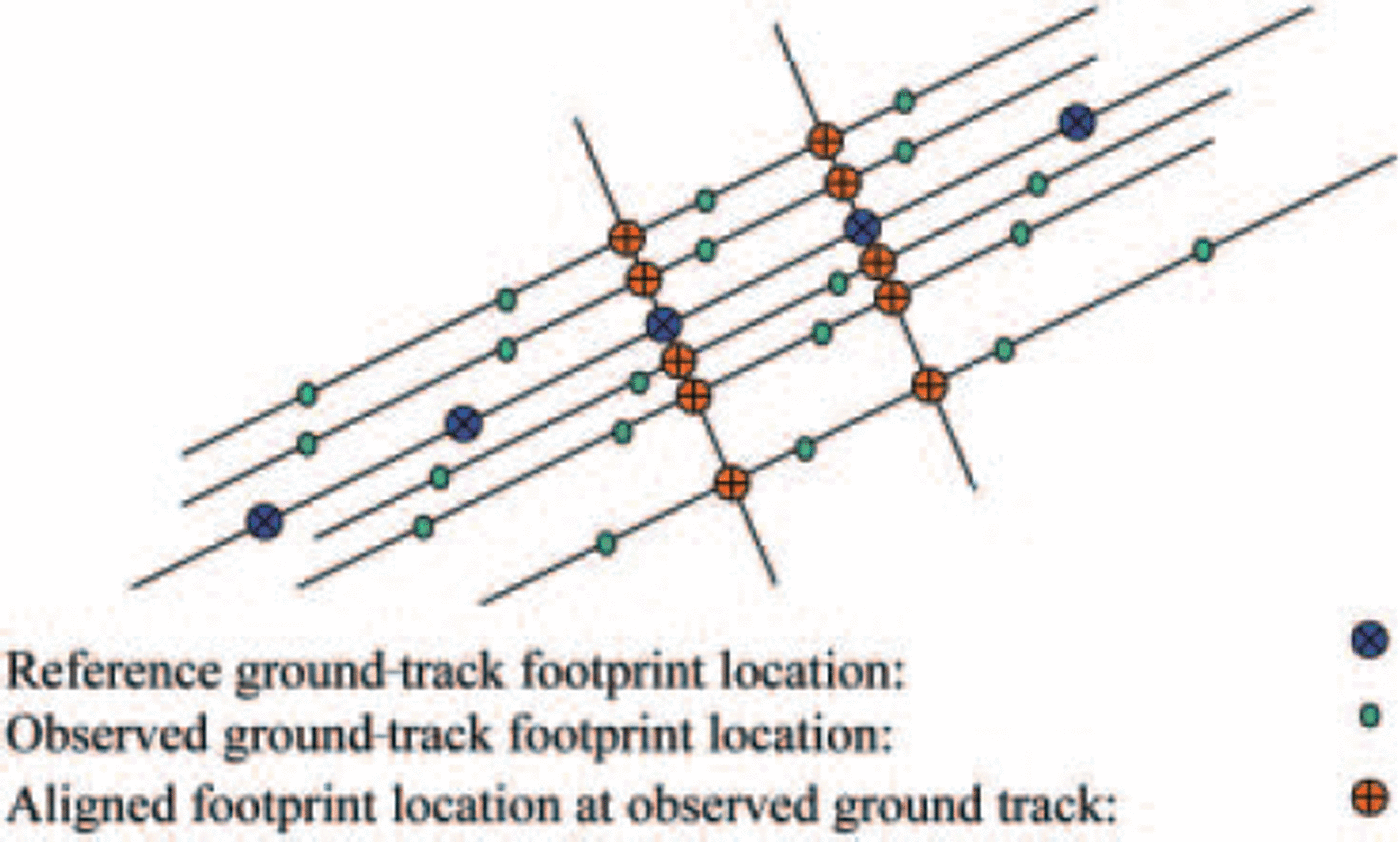
Figure 1 shows how to align observed data in the along-track direction to points on the reference ground track:
1. select a point on a reference ground track (blue circles);
2. draw a line perpendicular to the reference ground track at this point;
3. find the intersection between this line and an observation track;
4. find the two observed data points adjacent to the intersection (green circles);
5. calculate the elevation on the observed track at this intersection by linearly interpolating from the two adjacent elevations (red circles).
Reference ground track, observed ground track and aligned footprints.
The cross-track slope (S c) is derived by fitting a straight line to the along-track-aligned elevations of available repeat cycles as a function of distance to the reference track. The along-track slope (S a) is calculated by fitting a line to seven consecutive measured elevations. The three-dimensional slope can be calculated by combining the slopes in the two perpendicular directions. The amplitude of the three-dimensional surface slope S can be derived by tan2 S = tan2 S a + tan2 S c.
The surface slope at a point discussed in this paper is the mean surface slope at that point. For example, 1 km along-track surface slope at a point is the mean surface slope calculated using data within 500 m of that point. It is assumed that the surface slope is constant on a 1 km scale, so linear interpolation can be applied to two points separated by 172 m (2.5 times the laser footprint size) to align elevations to reference ground tracks. This assumption also makes it possible to calculate cross-track slopes at the 1 km scale. This is very important for future mass-balance studies, since it will enable the elevation comparison of repeat tracks.
Surface roughness at a point is defined as the standard deviation of the differences between surface elevations and a fitted straight line of the elevations over a distance surrounding the point. Based on this definition, surface roughness will be sensitive to the distance interval selected to do the calculation. Over large distance, such as the 10 km scale used in this study, surface topography will affect the surface roughness value.
3. Data and Results
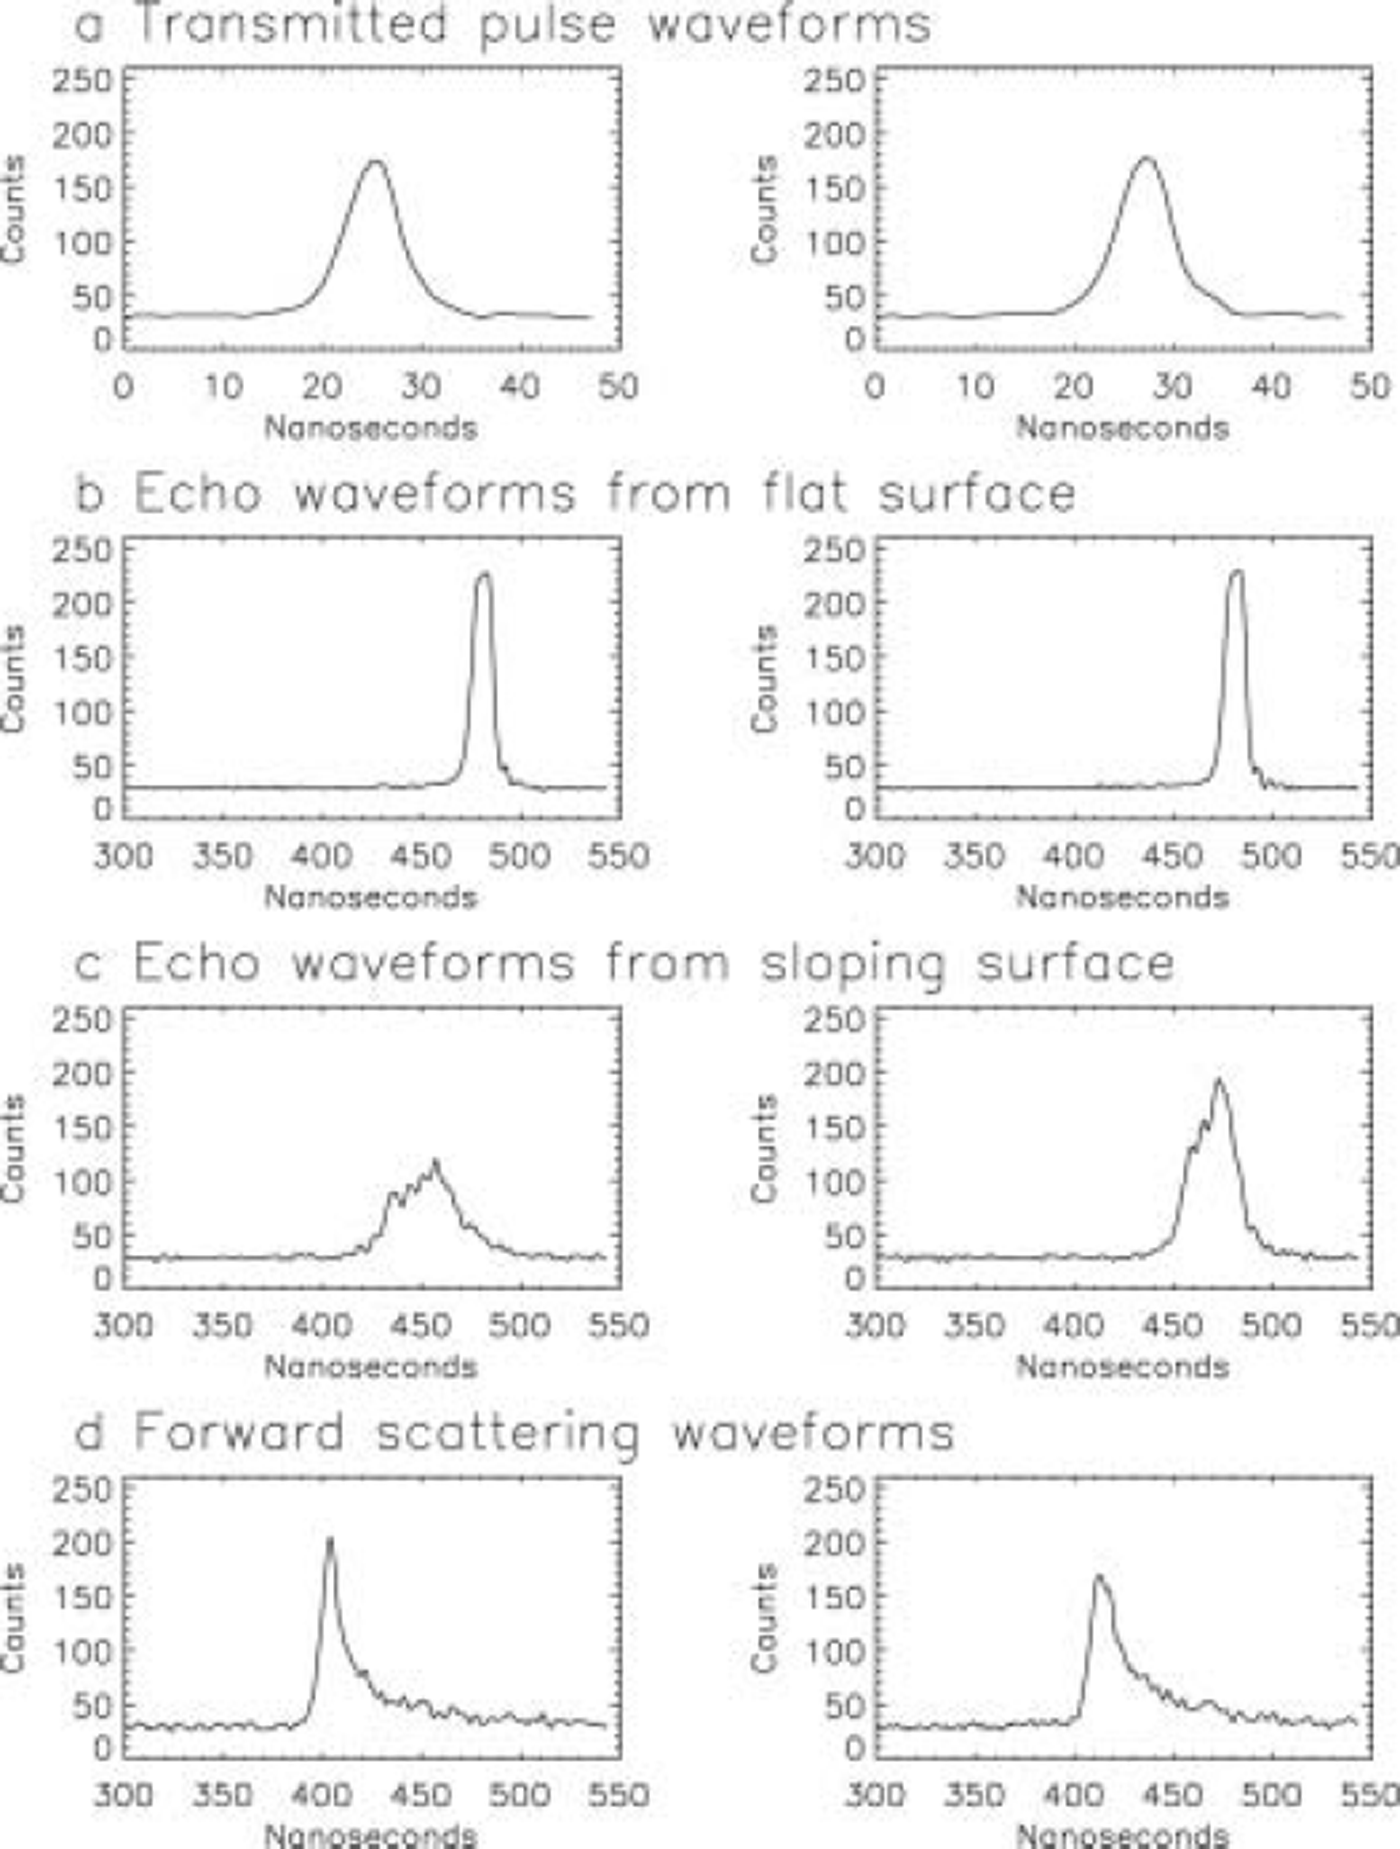
The detected pulse corresponding to the reflections from the surface is digitized in 1ns (15 cm) range bins. The echo waveforms have 544 range bins over ice sheets and land, and 200 range bins over ocean and sea-ice regions. The wider waveform window was chosen for ice sheets and land because they have more surface relief due to their complex surface features such as large surface slope and tall trees. The quality of the waveform is important in determining surface elevation. The ICESat transmitted waveforms (Fig. 2a) are very stable and introduce little error in elevation calculations. The echo waveforms are affected by the transmitted pulse energy, atmospheric (including cloud) attenuation, surface reflectivity and surface slope and roughness within the laser footprint, all of which affect the accuracy of surface elevation measurement. Figure 2b shows waveforms over central Greenland, which is very flat. Since the transmitted energy is strong, the echo waveforms are slightly saturated. The range error for this kind of saturation can be corrected by post-processing which is discussed later. Figure 2c shows waveforms from the edge of Greenland where the slopes are large. The pulse is broadened by topography and is not saturated. Figure 2d shows the effect of forward scattering on waveforms. Clouds attenuated the signal and also scattered laser photons, causing additional path delays and introducing a bias (Reference BrennerBrenner and others, 2003). The scattered laser pulse is seen in the trailing edge of the waveforms. This type of waveform, if not corrected, can produce an error larger than 1 m (Reference Mahesh, Spinhirne, Duda and ElorantaMahesh and others, 2002).
ICESat sample waveforms.
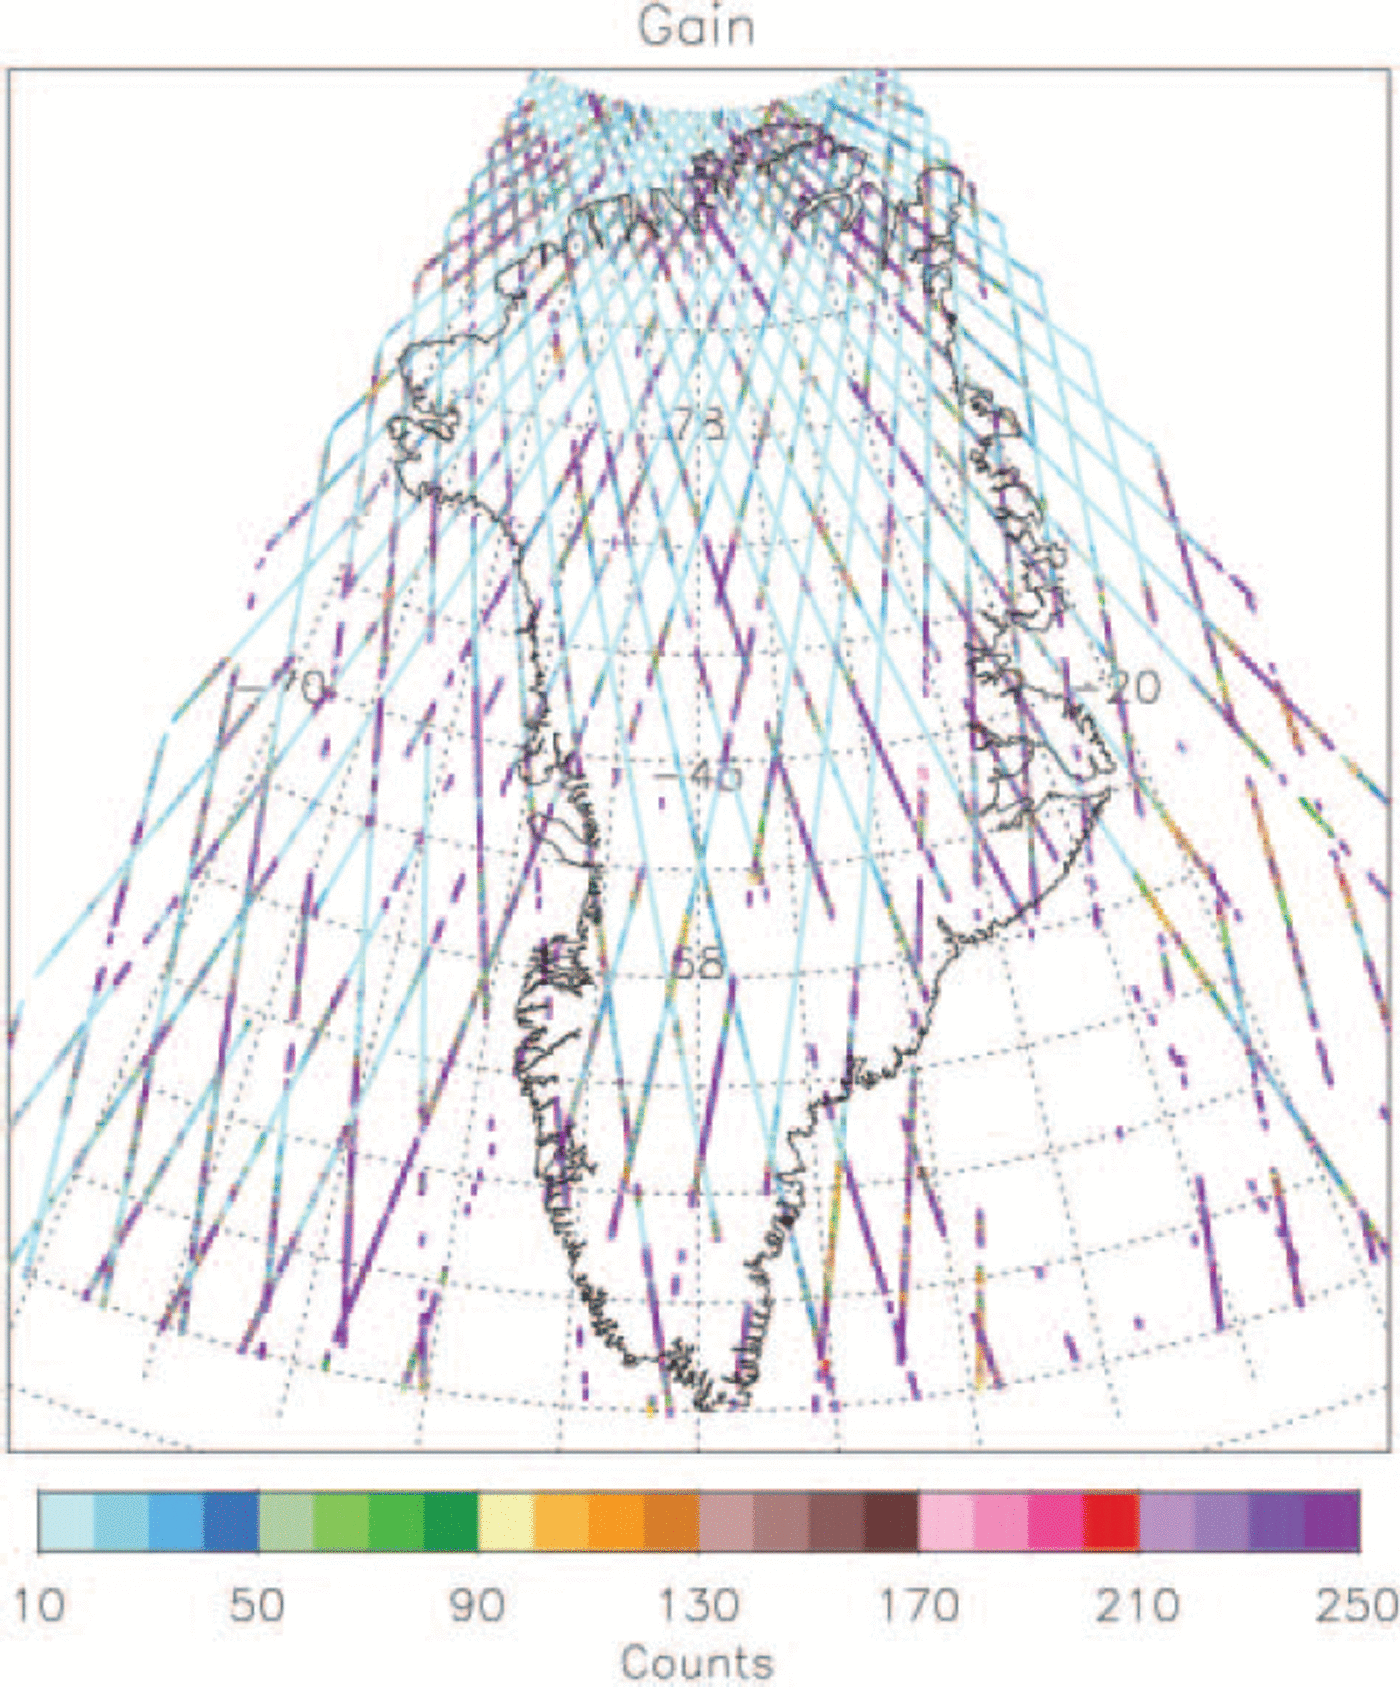
In this study, a limit is applied to the detector gain to filter out heavily saturated waveforms and heavily atmospherically attenuated waveforms. The detector gain for a laser shot is automatically adjusted according to the pulse amplitudes of the previous laser shots. The gain is lower when the echo waveform amplitude becomes higher. Figure 3 shows the detector gain over Greenland for an 8 day cycle. The detector gain is normally below 20 for this operating period under clear-sky conditions, and gain higher than 50 normally means clouded sky. Data with gain above 30 are not used because they are most often associated with clouds. During this period, there are also data that are saturated with high gain due to the limited response time of the gain control loop; this problem is largely eliminated in later operations by an improved onboard gain control algorithm.
Detector gain of ICESat 8 day repeat-orbit cycle 4 data.
Saturation correction has been applied to low-gain saturations. Reference Sun, Abshire and YiSun and others (2003) show that the time of flight bias is approximately linearly related to echo pulse energy after it surpasses a certain level. The method in this paper is the same as in Reference Sun, Abshire and YiSun and others (2003), but with the coefficients updated after more data have been analyzed. The elevation difference due to saturation (DH) is calculated by
where a 1 = 0.22 ns fJ–1, a 2 = 12fJ is a limit over which the echo waveform is saturated, ER is the echo pulse energy and c is the speed of light. Using this equation, if the echo pulse energy is 20 fJ, an elevation adjustment of 0.26 m is needed.
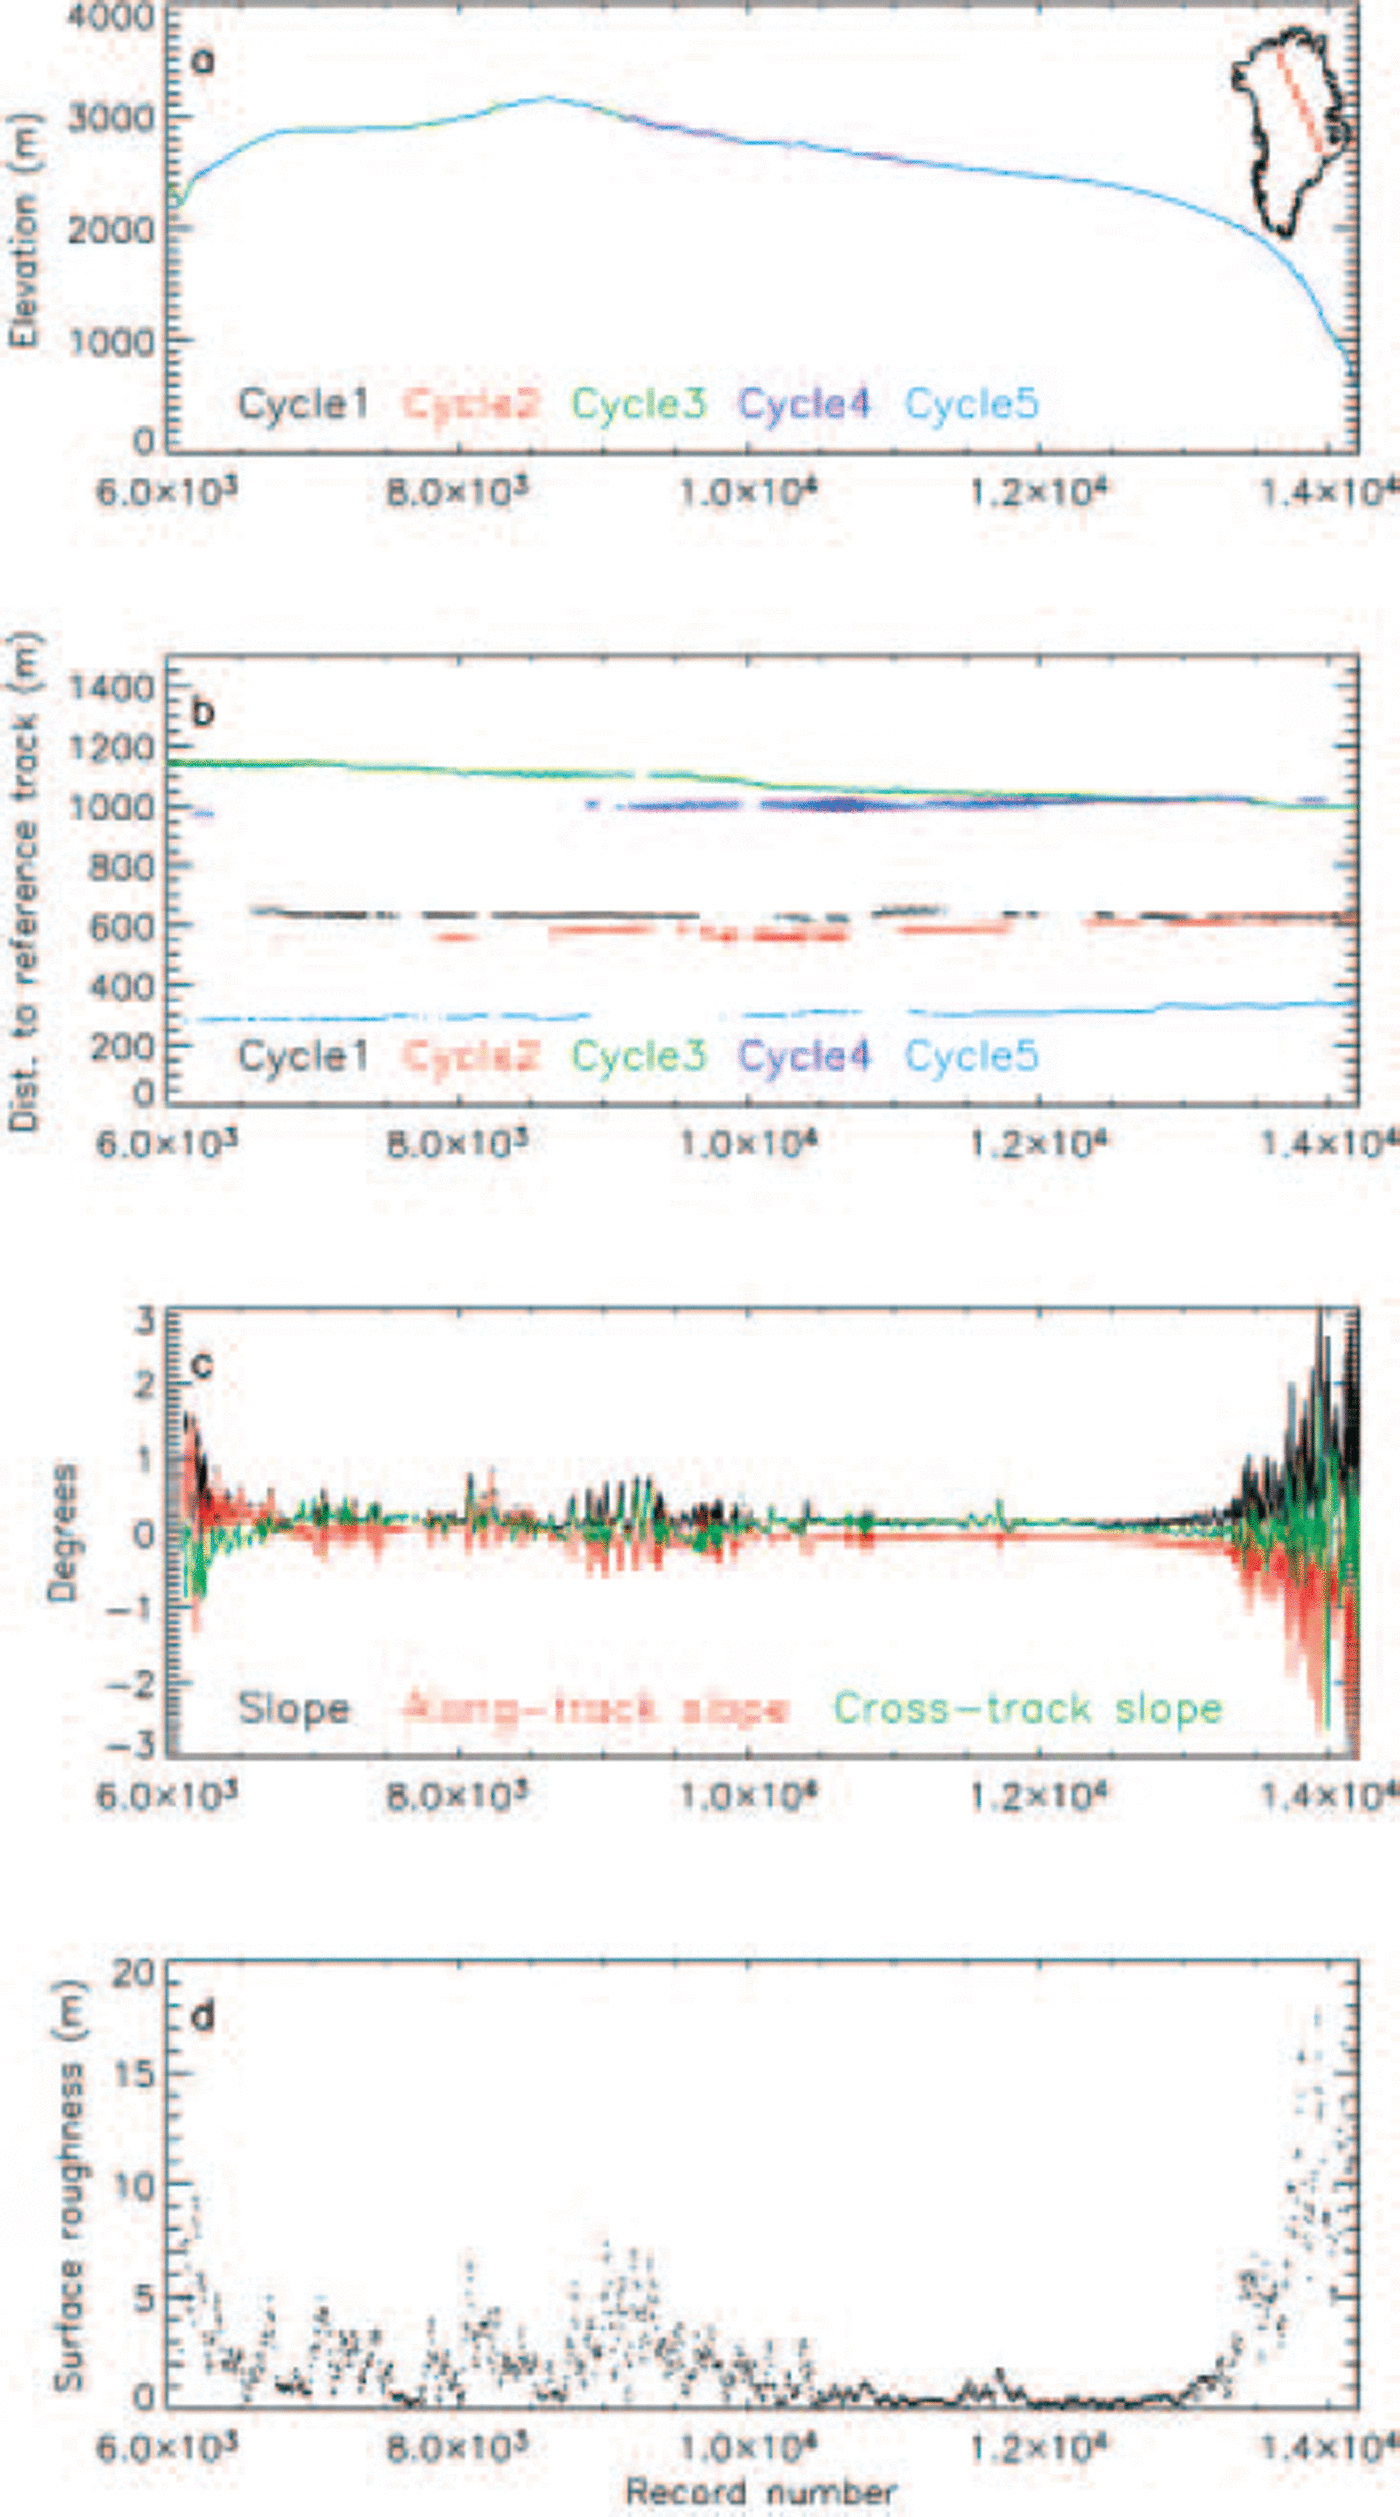
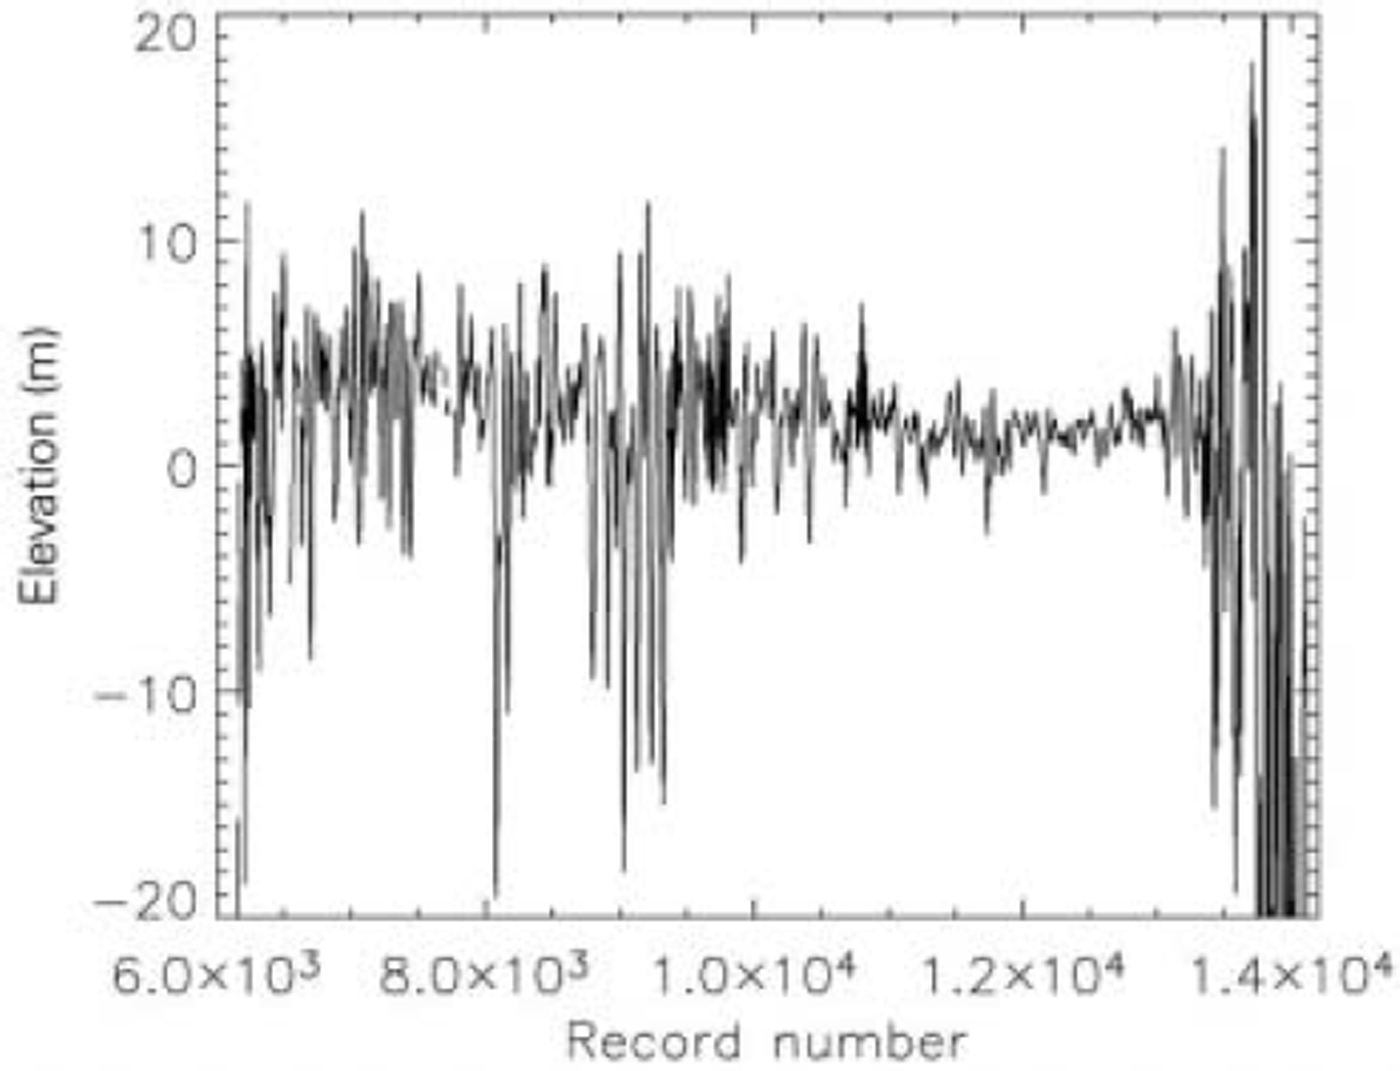
As an example, data from 8 day ground track No. 76 are shown in Figure 4. Figure 4a shows the surface elevation of five cycles along the same ground track. The differences in elevation between cycle 1 and other cycles vary from <1 m in flat areas to >10 m at the edge of Greenland. It is difficult to see the elevation differences on this scale. Figure 4b shows the distances of five ground-track cycles to the reference track. The data gaps and the ground-track variations are clearly shown. Due to jitter and the rotation of ICESat’s solar panels, the ground track oscillates along the profile. The sinusoidal cross-track amplitude is not uniform and the vibration has a frequency of about 1 Hz. This ground-track oscillation is not occurring all the time. The data gaps are mostly due to clouds attenuating the signal and thereby preventing the detector from finding an echo. Figure 4c shows the calculated surface slopes in cross-track and along-track directions and their combination. Looking in the ICESat direction of motion, the cross-track slope is positive if the left side is higher; the along-track slope is positive if the elevation is increasing in the direction of movement. At the edge of Greenland, the surface slope reaches >3˚ and is much more variable than in the central part, where it is around 0.1˚. Figure 4d shows the surface roughness along the profile. There is a roughness value calculated for every six shots (about 1 km). Surface roughness here is defined as the standard deviation of the differences between measured elevation and the fitted line of elevations over a 10km span. It varies from 0.1–0.2m in the central part of Greenland to >10 m at the northern edge.
Eight-day repeat-orbit ground track 76. (a) The elevation profiles (the direction of the profiles is from southeast to northwest on the Greenland map); (b) the distances of five ground track cycles to the reference track; (c) the along-track slope, cross-track slope and the amplitude of the three-dimensional slope; (d) along-track surface roughness.
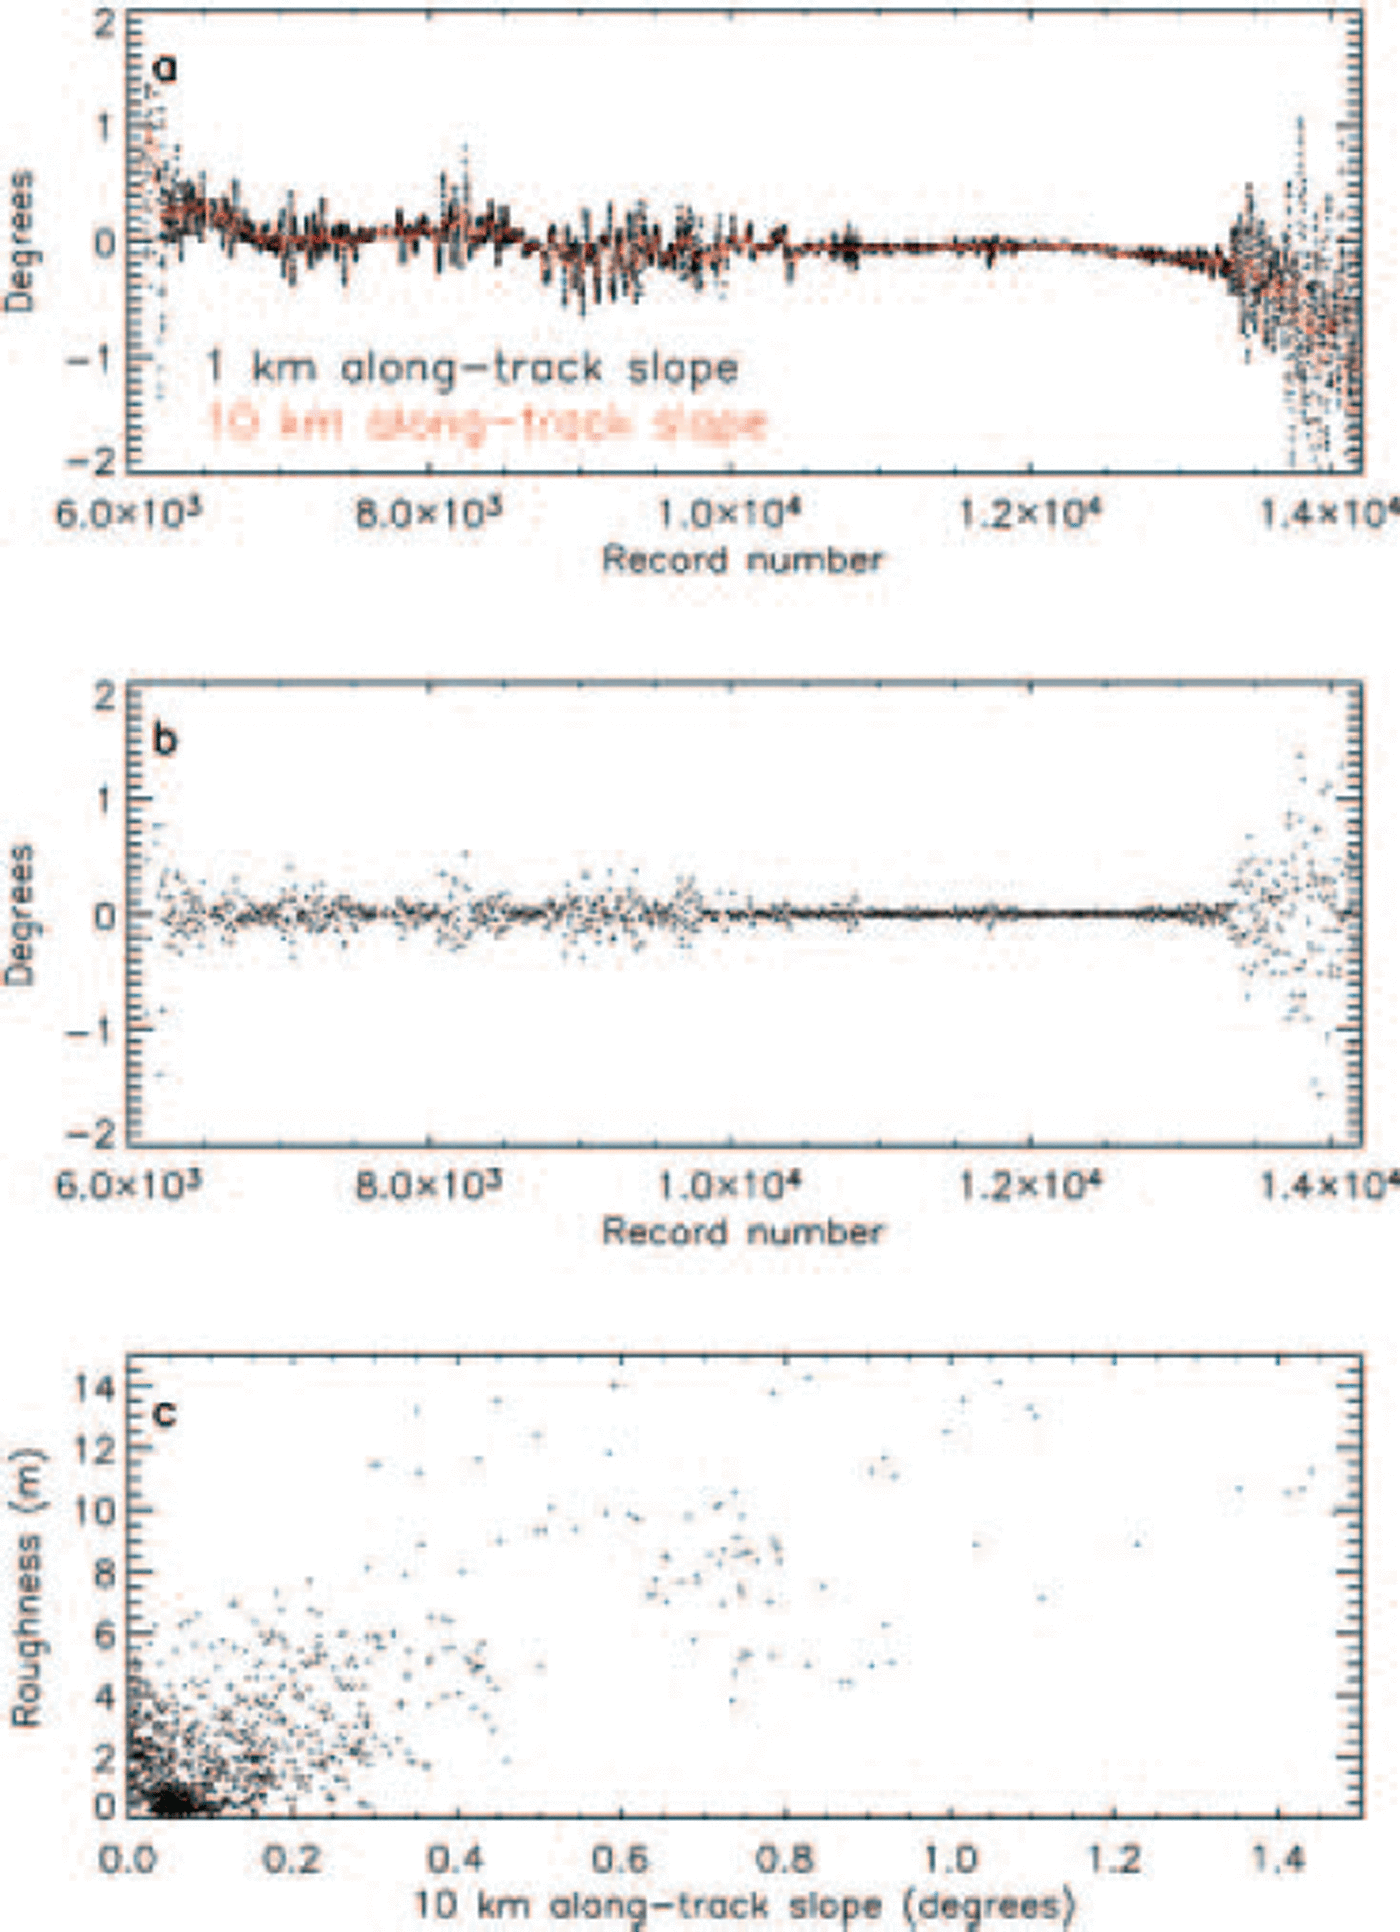
Track 76 along-track surface slopes, calculated every 1 km over distances of 1 and 10km, are compared in Figure 5a. As expected, the 1 km along-track slope varies more than the 10 km along-track slope. The difference between the two varies from <0.1˚ in the flat part of the ice sheet to >1˚ at the northern end of the profile (Fig. 5b). Surface roughness and 10 km along-track slope show no obvious correlation (Fig. 5c). When the 10 km along-track slope is >0.5˚, surface roughness is 4 m or higher.
(a) 1 and 10 km along-track surface slopes; (b) the difference between 1 and 10 km along-track surface slopes; (c) surface roughness vs 10 km along-track surface slope.
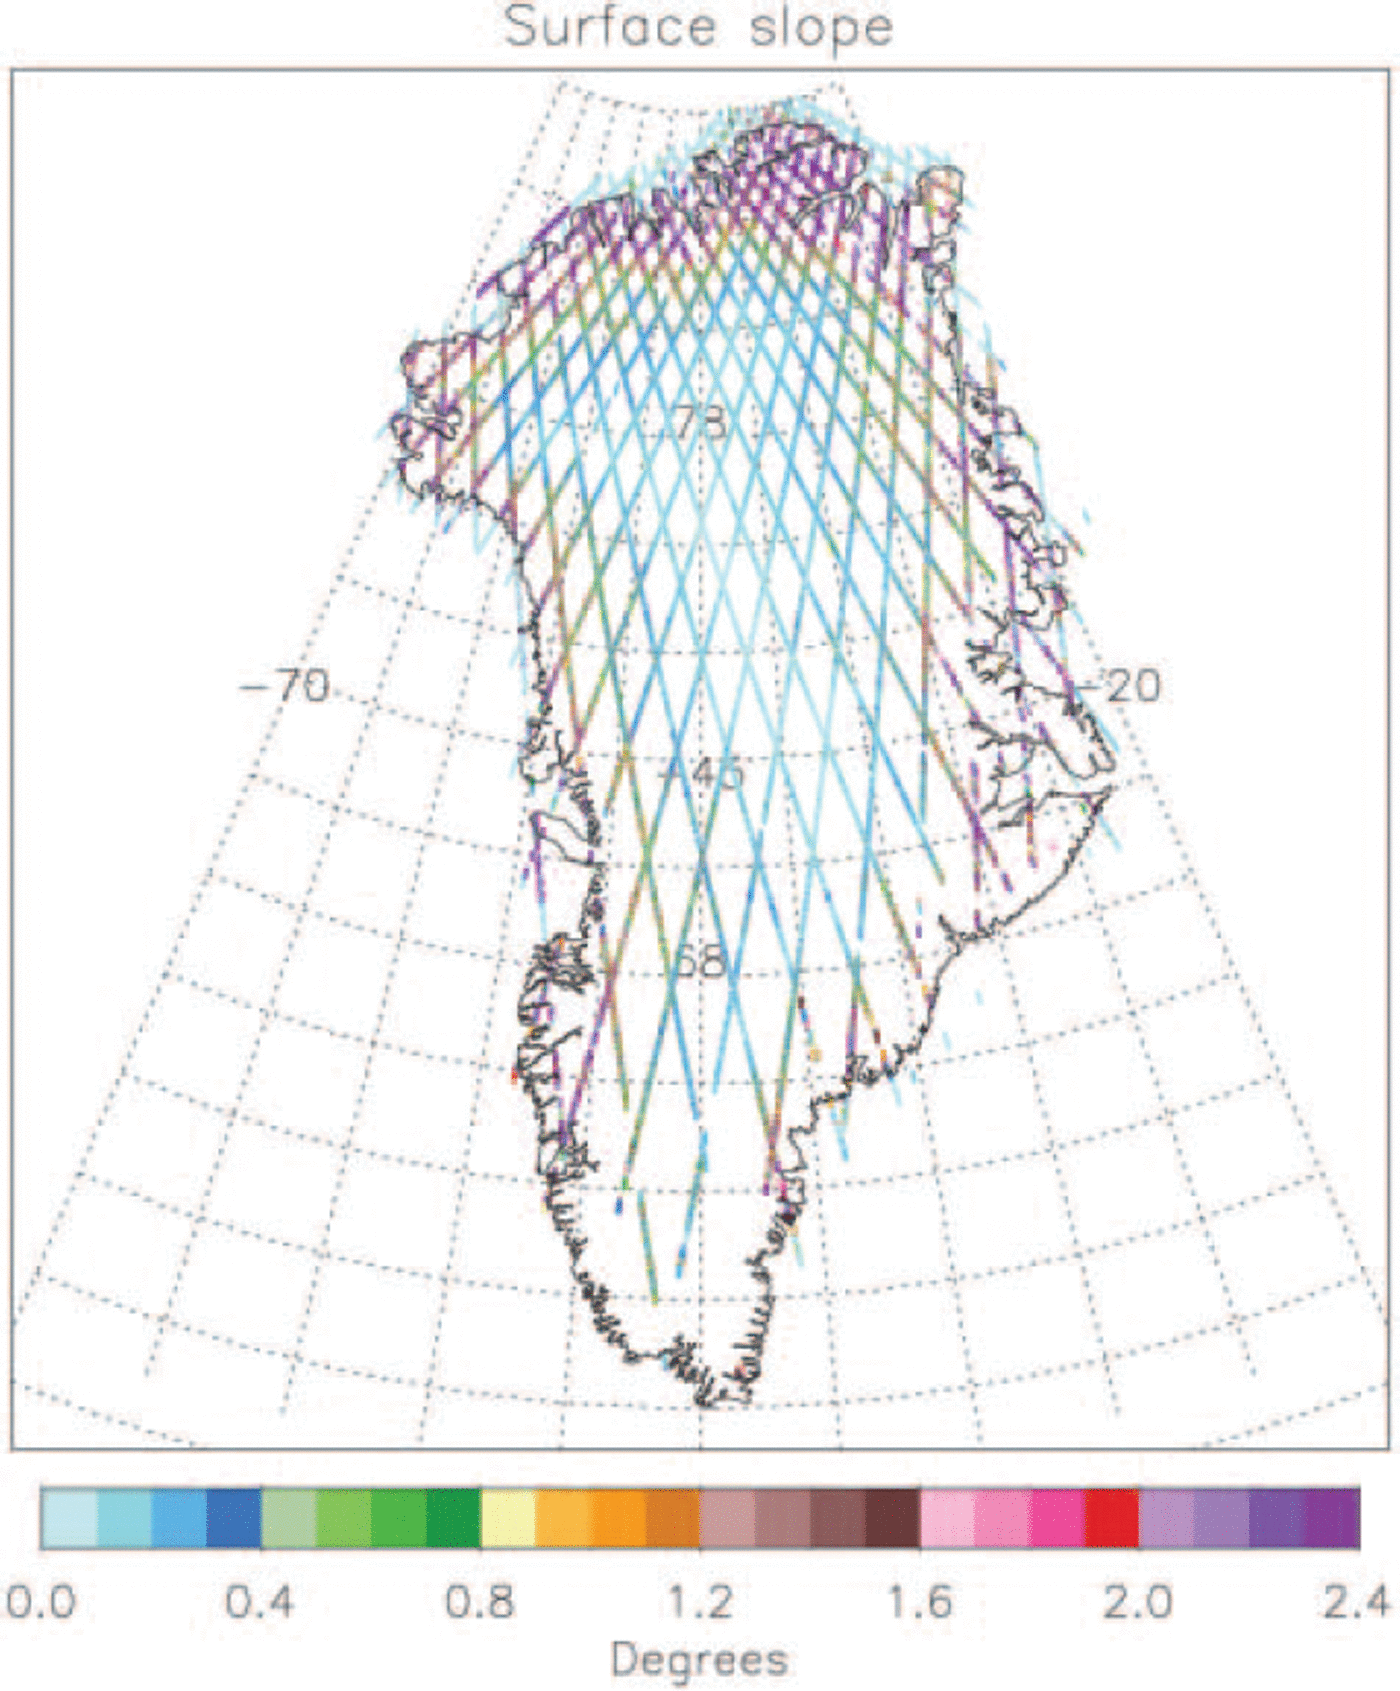
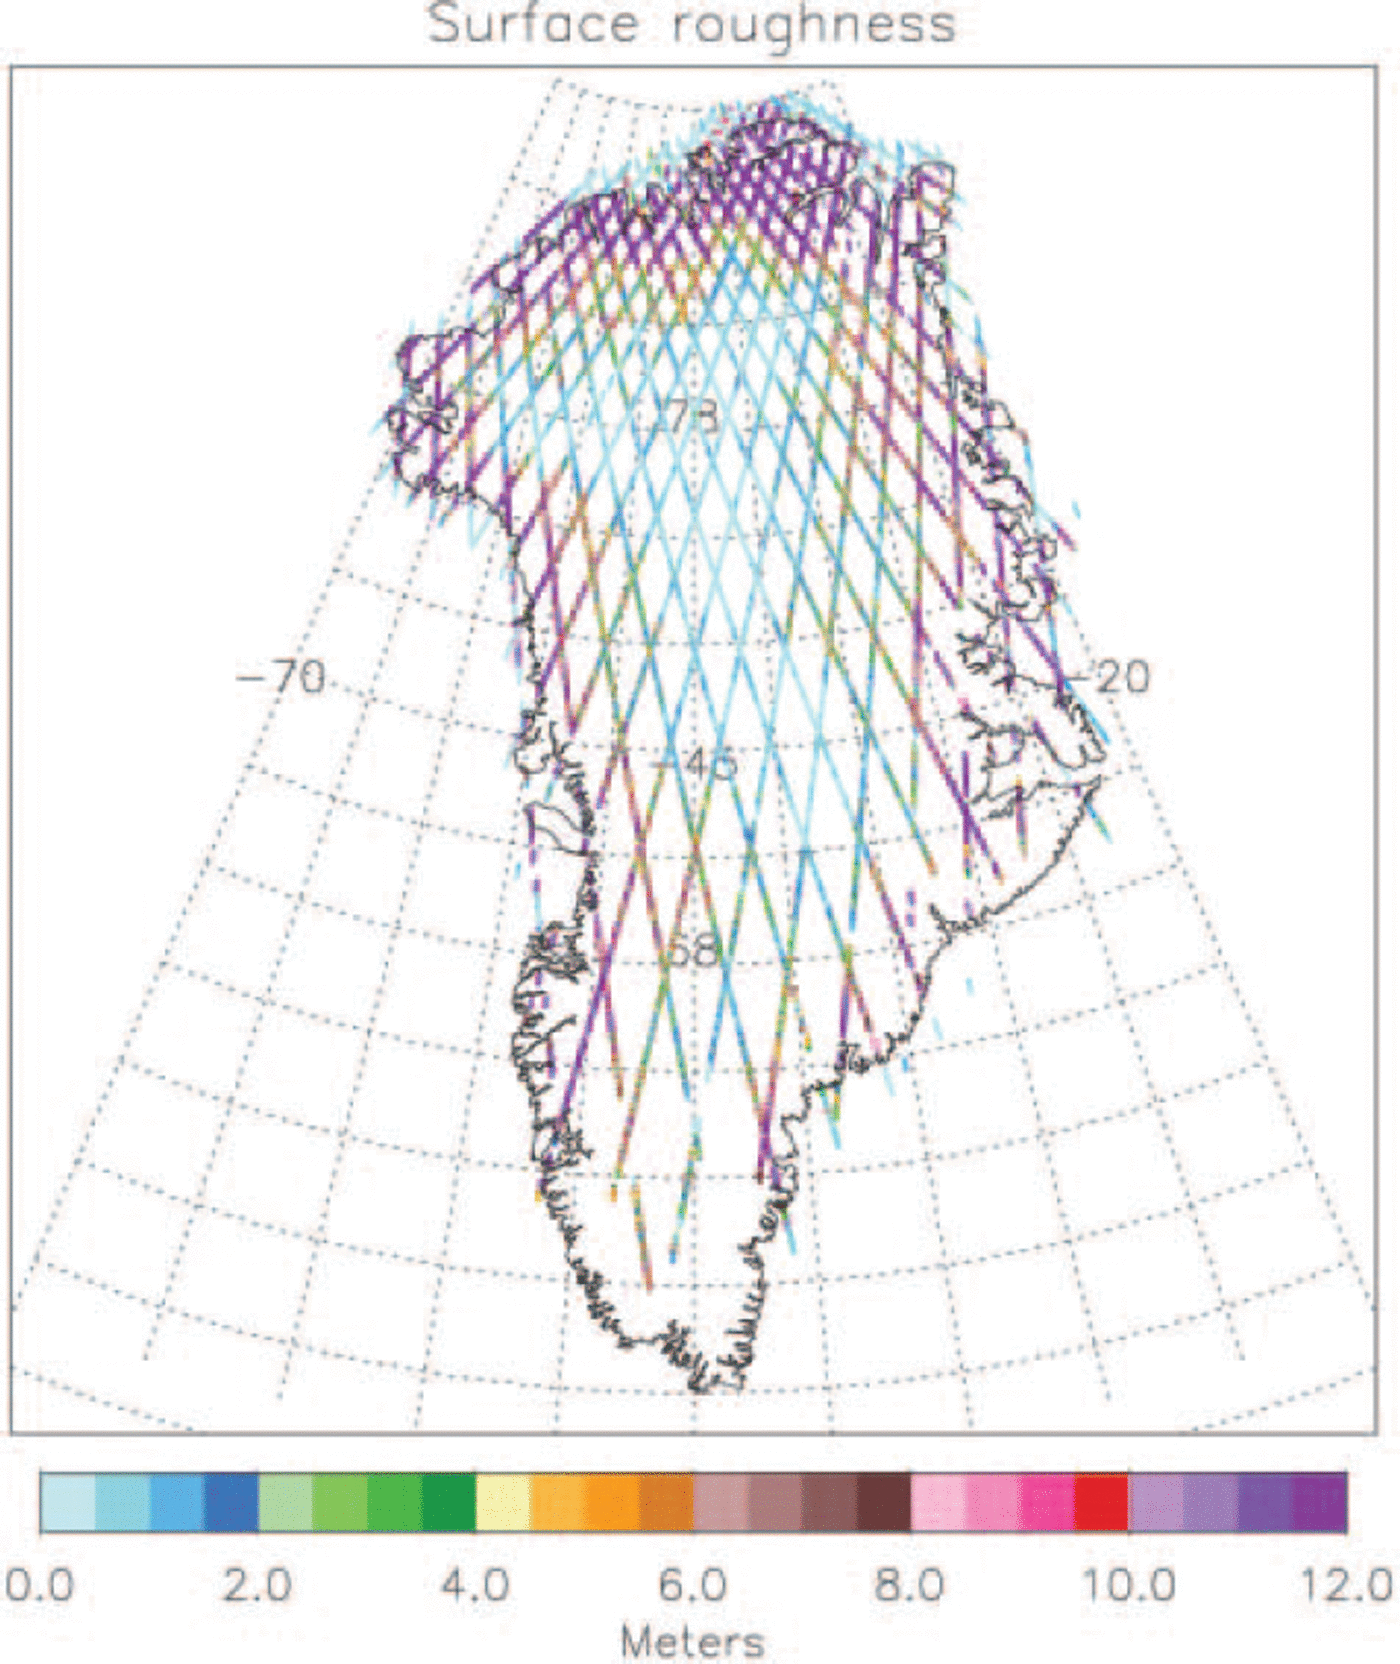
A Greenland 1 km surface slope map from ICESat 8day repeat orbit data is shown in Figure 6. The surface slopes range from <0.1˚ in the central part to >2.4˚ at the edge. Most of the areas that have surface slopes >0.4˚ are within 200 km of the coast. The data gaps in the map reflect the cloud coverage of Greenland over the period. The southern part, especially near the coast, has more clouds than the rest of Greenland. A Greenland surface roughness map from ICESat 8 day repeat orbit data is shown in Figure 7. The pattern for Greenland surface roughness distribution is similar to its surface slope distribution. More than 40% of the calculated roughness values are <2 m. The roughness gradually increases from 0.1 m at the center to >12 m in coastal areas.
Greenland 1 km surface slope amplitude from ICESat 8day repeat-orbit data.
Greenland surface roughness from ICESat 8 day repeat-orbit data.
The elevation profile of track 76 is compared with the European Remote-sensing Satellite-1 (ERS-1) 5 km grid digital elevation model (DEM) (Reference DiMarzio, Brenner, Saba and ZwallyDiMarzio and others, 1998) by bilinearly interpolating the elevations of four adjacent gridpoints to an ICESat footprint (Fig. 8). ICESat elevations are 1–2m higher than ERS-1 DEM 5 km grid elevations in central Greenland, and the differences are >20m at the edges. The ERS-1 5 km grid DEM data had been compared to the NASA Wallops Flight Facility Aircraft On-board LIDAR (light detection and ranging) (AOL), and the differences are sub-meter in flat areas (Reference DiMarzio, Brenner, Saba and ZwallyDiMarzio and others, 1998). The 1– 2 m differences shown here in central Greenland are likely from factors such as radar altimeter signal penetration of the snow surface and laser-pointing angle uncertainties in ICESat Release 14 data. Real surface elevation changes and the seasonal cycle may also contribute to the differences: ICESat data used here are from March, which is the elevation maximum of the annual cycle (Reference Yi, Bentley and StenoienYi and others, 1997; Reference Zwally and LiZwally and Li, 2002), and the DEM elevation was averaged over an 18month period. Future ICESat data releases with improved accuracy will give more accurate comparisons. Large differences in Figure 8 over high-slope areas suggest radar altimeters may not have sufficiently accurate surface slope measurements for slope correction. Reference DiMarzio, Brenner, Saba and ZwallyDiMarzio and others (1998) obtained similar results while comparing ERS-1 5km DEM with AOL data in large-slope regions. Accurate surface slope data from ICESat will help to correct the slope-induced error for radar altimeter missions such as Geosat, ERS-1 and ERS-2.
The difference between ICESat elevation and ERS-1 5 km grid DEM. Positive number means ICESat elevation is higher.
4. Discussion
ICESat data calibration/validation is an ongoing process. Data used in this study are preliminary and do not represent the best capability of ICESat; they will be improved when new releases of ICESat data become available. The quality of the results of this paper will be improved after the data are improved. For ICESat Release 14, the pointing uncertainty is the largest known error source in the data. The designed accuracy of the ICESat laser-pointing angle is 1 arcsec, which will produce a 5 cm uncertainty over a surface with a 1˚ surface slope. Currently, the pointing accuracy is 10 arcsec for the studied period, which gives a 50cm uncertainty over a surface with a 1˚ surface slope.
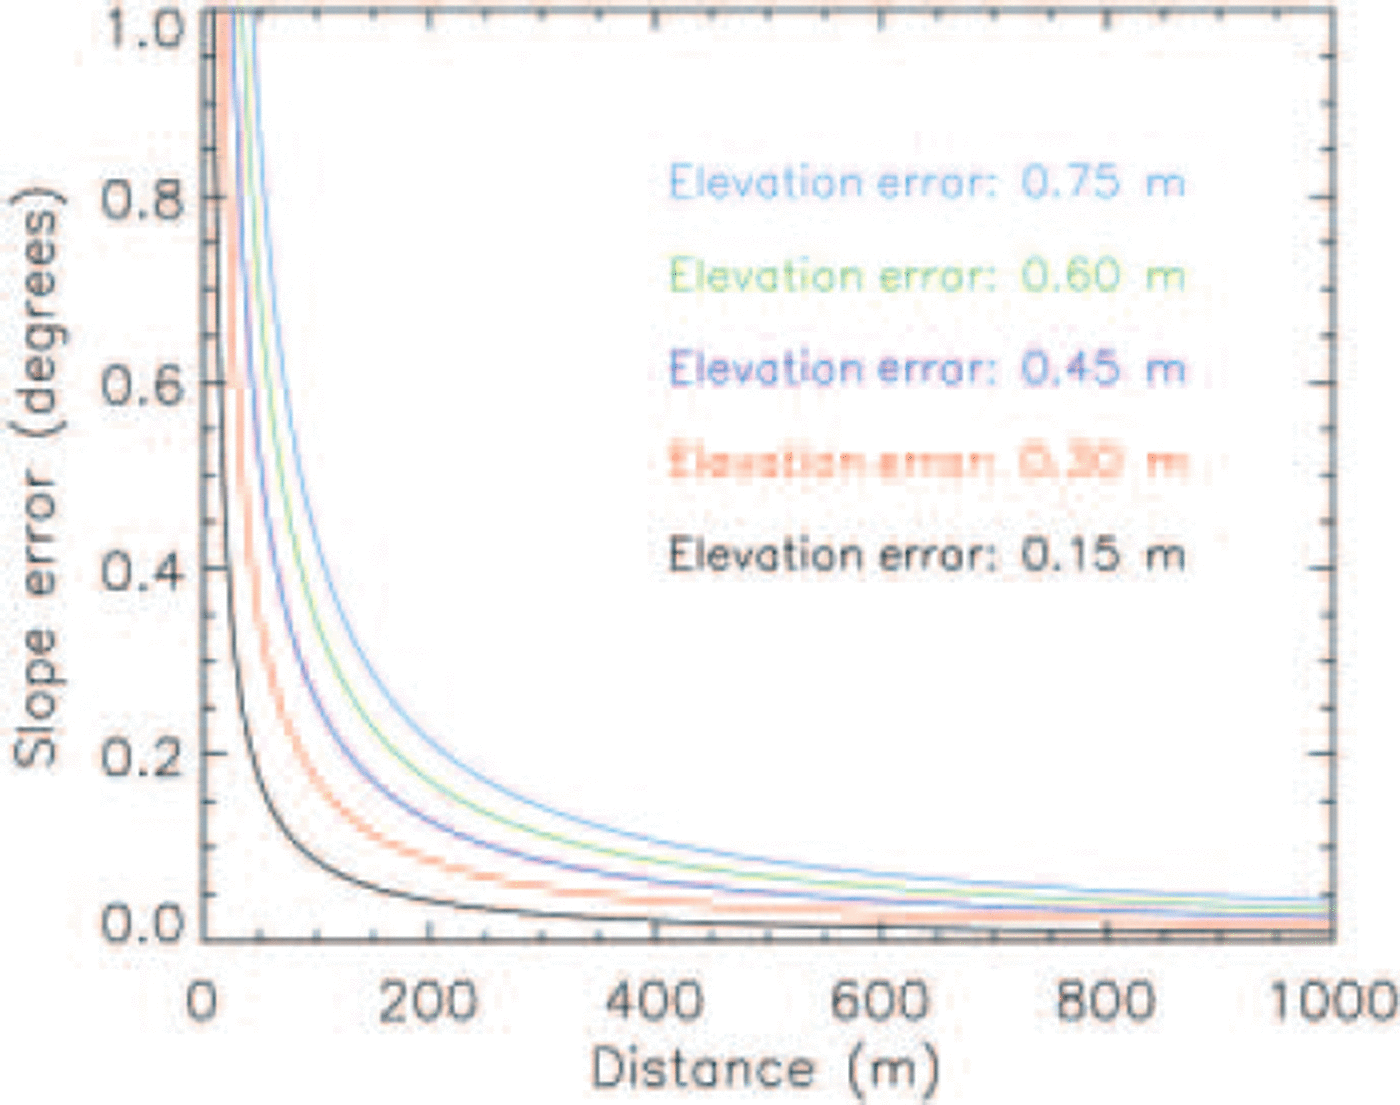
For a fixed surface slope between two points, the accuracy depends on the accuracy of the elevation measurements. It also depends on the distance between the two points. For a fixed error in surface elevation, the error in surface slope decreases when the distance increases, assuming a flat surface (see Fig. 9). The predicted accuracy for ICESat elevation is 0.15 m (Reference ZwallyZwally and others, 2002); the corresponding slope errors will be 0.172˚, 0.086˚, 0.017˚ and 0.001˚ for cross-track separation of 50, 100, 500 and 1000m respectively. In this study, surface elevation change during the 38 day period over Greenland is not considered and the slope error is assumed to be from ICESat measurement. The elevation change over time would also introduce an error in slope calculation since surface elevations for different repeat cycles are measured at different times.
Surface slope error as a function of elevation error and ground-track separation. For any given distance, slope error increases with elevation error.
All results shown here are calculated from ICESat Release 14 data. New data releases will improve elevation values by using more accurate laser-pointing information, which will also affect the distance between ground tracks used in this study. This research demonstrates ICESat’s ability to measure surface slope in the cross-track direction using slightly separated repeat ground tracks. Improved pointing for later ICESat operations will reduce the repeat ground-track distance (to most likely within 400 m) and increase the slope error in the cross-track direction. The improved pointing will also improve the elevation measurement accuracy, which will improve the slope measurement.
The difference between along-track and cross-track slope (Fig. 4c) indicates that the along-track slope alone is inadequate to represent surface slope. Three-dimensional surface slope from the ICESat 8 day repeat orbit data may be used in slope correction to improve radar altimeter measured surface elevation. The difference between 1 and 10 km along-track slopes (Fig. 5b) indicates that the smaller-scale surface slope interpolated from DEM grids may introduce significant error except over very flat regions such as central Greenland. Once the saturation correction algorithm for echo pulse width is developed, the small-scale (<70 m) surface slope and surface roughness will be derived from individual echo waveforms.
The study of surface slope at repeat ground-track separation scale is the base of using repeat ground tracks to study ice-sheet mass balance. Knowing cross-track slope will make it possible to compare elevations and calculate elevation changes along repeat ground tracks. This will use all data points while the traditional crossover method (Reference Zwally, Brenner, Major, Bindschadler and MarshZwally and others, 1989) only uses data adjacent to crossover points.
Acknowledgements
This work is supported by NASA’s funding of the ICESat/ GLAS Science Team. We thank the reviewers M. Nolan and F. Cawkwell for their helpful comments on the manuscript.


