

Trinidad and Tobago is a Caribbean nation (population 1·3 million) situated off the north-east coast of Venezuela. The country is dominated by two major cultural traditions: Creole and East Indian. Creole is a mixture of African elements with Spanish, French and British colonial influences, while the East Indian tradition originated with the arrival of indentured servants from India to work on the sugar plantations after the abolition of slavery in 1833(1). Today, the country's multi-ethnic population consists of people of East Indian descent 40·3 %, African descent 39·5 %, mixed descent 18·4 %, Europeans 0·6 %, and Chinese and others 1·2 %(2). From 1960 to 2009 the average life expectancy of Trinidadians at birth rose from 63·5 to 69·6 years(3). During the same time period, however, the country has experienced an epidemiological transition characterised by a shift in leading causes of death from communicable to non-communicable chronic diseases, including heart disease, cancers, cerebrovascular diseases, diabetes mellitus and hypertensive diseases(Reference Sinha4–Reference Ivey, Legall and Boisson6). In 2004 Trinidad and Tobago ranked 4th highest in the Americas for mortality from non-communicable diseases(7). Estimated age-standardised mortality rates from CVD, diabetes mellitus and cancers in that year were 364, 128 and 123 per 100 000 population, respectively, compared with 179, 17 and 133 per 100 000 in the USA(7). Diabetes has become a major public health burden(Reference Boyne8) with prevalence rates having increased from 1·3 % in the 1950s to more than 12 % in the 1990s(Reference Miller, Beckles and Maude9). Total direct and indirect costs attributed to diabetes in Latin America and the Caribbean were estimated at $US 284·5 million in 2000(Reference Barceló, Aedo and Rajpathak10). This escalating economic burden due to non-communicable chronic disease is set to continue with the increasing prevalence of metabolic syndrome components such as obesity, dyslipidaemia and insulin resistance(Reference Ezenwaka and Kalloo11). The WHO Global InfoBase Obesity Comparison Tool(7) predicted that by 2010 some 81 % of women and 65 % of men in Trinidad and Tobago would be overweight, and that of these, 53 % of women and 19 % of men would be obese. In terms of BMI, this would rank the country 10th highest in the world for females (mean BMI = 30·6 kg/m2) and 33rd for males (mean BMI = 26·6 kg/m2).
Several factors are thought to have contributed to the shift in mortality patterns from communicable to non-communicable chronic diseases in the Caribbean. These include greater access to high-fat/high-energy foods, decreased consumption of fruit and vegetables, decreased physical activity and the adoption of an increasingly sedentary lifestyle(Reference Ivey, Legall and Boisson6). Diet and a healthy lifestyle are important components of non-communicable chronic disease prevention(12) and assessment of dietary intake patterns can provide insights into nutrient intakes and dietary adequacy, upon which chronic disease associations can be drawn and public health strategies based. In Trinidad and Tobago, however, there have been few studies assessing dietary intake.
At their crudest level, dietary trends can be followed using aggregate data from food production, imports and exports(Reference Hiller and McMichael13). This is called the food disappearance method and utilises national food balance sheets compiled annually by the FAO(14). Although these data represent the annual per capita supply of commodities available for consumption within a country rather than the actual dietary intakes of individuals, provided they are analysed appropriately they can reveal useful information on the overall changes in energy and nutrient supply taking place within a country over several decades. This approach is especially useful for dealing with lower- and middle-income countries undergoing nutrition transition, where few, if any, national food consumption studies may have ever been carried out. In a previous study we analysed FAO food balance sheets to investigate changes in per capita energy and macronutrient supply since the early 1960s in the neighbouring Caribbean island of Barbados(Reference Sheehy and Sharma15). Commodities were coded using dietary analysis software, using a list of commonly consumed foods from a population-specific quantitative FFQ (QFFQ)(Reference Sharma, Cao and Harris16) to inform the coding process. A QFFQ with a list of commonly consumed foods for Trinidad and Tobago has since become available(Reference Ramdath, Hilaire and Cheong17). The objective of the present study was to analyse the FAO food balance sheets for Trinidad and Tobago with the aid of this instrument in order to characterise the changes in per capita energy, macronutrient and micronutrient supply that have taken place there between 1961 and 2007.
Methods
FAO food balance sheets for Trinidad and Tobago for the period 1961–2007 were downloaded as csv files from the FAOSTAT database(14). These food balance sheets provide overall supply (as kg/capita per annum) for food commodities including cereals, starchy roots, vegetables, fruits, oilseeds and oilseed oils, treenuts, animal fats, milk, meats, eggs and fish. The full list of commodities is shown in the Appendix. Having imported the data into Microsoft® Office Excel 2003, supply was then converted to g/capita per d.
In order to calculate the energy and nutrient supply, the foods were coded and entered into WISP version 3·0 dietary analysis software. The food composition database supplied with this software is from McCance and Widdowson's The Composition of Foods, 5th and 6th editions plus supplements(18). For consistency and wherever possible, foods were coded as being in their most unprocessed form (e.g. ‘bananas, weighed with skin’, ‘barley, whole grain, raw’, etc.). However certain broad categories, such as peas, beans, treenuts, those referring to fish and those labelled as ‘other’, were lacking in detail about the specific foods that made up the category. To code these categories in a way that would more closely reflect the Trinidadian diet we referred to the food list of a QFFQ that was recently developed specifically for this population by one of the authors (S.S.)(Reference Ramdath, Hilaire and Cheong17). Using the 146-item food list as a guide, we coded ‘peas’ as pigeon peas, ‘beans’ as green beans, and ‘treenuts’ as almonds and cashew nuts. We populated the category ‘fish’ with cod, tuna, herring and sardines. ‘Pulses (other)’ was populated with split peas, lentils and chick peas. ‘Vegetables (other)’ was populated with cabbage, carrots, taro leaves, pumpkin, beetroot, aubergine, okra, sweetcorn, spinach, cucumber, lettuce, peppers, watercress and avocado. The category ‘citrus (other)’ contained clementines, while ‘fruits (other)’ contained mangoes, papaya, pears, plums, melon and sapodilla. For categories where this procedure was carried out, supply was divided equally among the constituent foods. Overall, the commodities we coded accounted for over 98 % of the total energy supply. We excluded certain minor categories such as tea, coffee, other sweeteners and spices either because of low energy contribution or lack of information.
The FAO food balance sheets are limited in the amount of nutritional information they provide. For example, they provide no information on carbohydrates (e.g. sugars, starch and fibre), fatty acids, cholesterol, amino acids or micronutrients. However they do provide estimates of per capita energy, protein and fat supply, and these values can be compared with the calculated values derived from the dietary analysis software in order to check whether appropriate coding of the commodities has been carried out. To determine the level of agreement between the food balance sheet estimates and our calculated values for energy, protein and fat supply, we obtained Pearson correlations using Microsoft® Office Excel 2003. Statistical significance of correlations was accepted at the 5 % level. All tests were two-sided.
Results
Food balance sheet estimates and calculated values for per capita energy, protein and fat supply
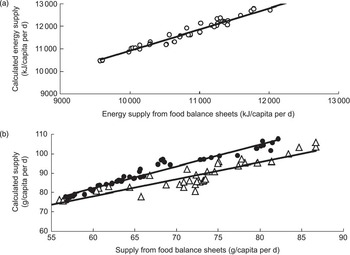
Figure 1(a) shows the relationship between estimated daily per capita energy supply for Trinidad and Tobago according to the FAO food balance sheets and the values we derived using dietary analysis software. On average, our values were some 7 % higher than the food balance sheet estimates, but the relationship between them was highly significant (R 2 = 0·976, P < 0·0001). For fat and protein supply, our values were, on average, some 25 % and 35 % higher, respectively, than the estimates provided on the food balance sheets. Again, however, there was a strong and statistically significant correlation between them (R 2 = 0·910, P < 0·0001 for fat and R 2 = 0·952, P < 0·0001 for protein; Fig. 1(b)).
Relationship between FAO food balance sheet estimates and our calculated values for (a) energy ( $$$$) and (b) protein (
 $$$$) and fat (
 $$$$) supply in Trinidad and Tobago. Regression equations: y = 0·9435x + 1484·7, R 2 = 0·976 for energy; y = 1·1347x + 14·078, R 2 = 0·952 for protein; y = 0·8773x + 25·423, R 2 = 0·910 for fat
Energy and macronutrients
Figure 2(a) shows that the trends in energy supply in Trinidad and Tobago between 1961 and 2007 according to the food balance sheet estimates and our calculated values were virtually identical. According to our calculations, energy supply increased by some 1561 kJ (373 kcal)/capita per d between 1961 and 2007. There was a sharp increase from 1961 to the mid-1980s, reaching a maximum in 1986. During the late 1980s and early 1990s energy supply declined by about 17 %. However, since 1993 it has risen again, going up by some 8 % over the course of the last decade and a half.
Food balance sheet estimates ( $$$$) and our calculated values (
 $$$$) for (a) energy (kJ/capita per d), (b) fat (g/capita per d) and (c) protein (g/capita per d) supply in Trinidad and Tobago between 1961 and 2007

Figures 2(b) and (c) show the trends in fat and protein supply between 1961 and 2007 according to the food balance sheet estimates and our calculated values. Once again, the trends are virtually identical. Our data revealed that fat supply has increased by approximately 32 % over this period, while protein supply rose by 22 %. The food balance sheets do not report carbohydrate supply, but according to our calculations (data not shown) overall carbohydrate supply increased by 26 % between 1961 and 1980 but has fallen back by 15 % since then.
Contribution of macronutrients to total energy supply
Figure 3 shows our calculated values for the contributions of protein, fat, carbohydrate and alcohol to total energy supply in Trinidad and Tobago between 1961 and 2007. In 1961 some 62 % of energy was provided by carbohydrate, whereas by 1985 this figure had fallen to 56 %. Fats provided only 26 % of energy in 1961 but by 1985 this figure had reached 31 %. Between 1986 and 1990 the figures began to diverge quite sharply, but since then the trend towards decreasing carbohydrate and increasing fat supply has become re-established, so that by 2007 the values were 57 % of energy coming from carbohydrate and 30 % of energy coming from fat. The contribution of protein to energy supply has remained relatively constant at about 12–14 %, while only about 1–2 % of energy was contributed by alcohol.
Contributions of carbohydrate ( $$$$), fat (
 $$$$), protein (
 $$$$) and alcohol (
 $$$$) to energy supply (%) in Trinidad and Tobago between 1961 and 2007

Sugars, starch and fibre
Figure 4 shows the trends in sugars, starch and fibre (as NSP) supply in Trinidad and Tobago between 1961 and 2007. Sugars increased from 134 g/capita per d in 1961 to 199 g/capita per d in 2007, whereas starch supply fell from 274 to 235 g/capita per d. Between 1961 and 2007 the ratio of sugars to starch rose from 0·49 to 0·89. Energy from sugars increased from 20 % to 26 % of total energy and most of this was in the form of non-milk extrinsic sugars (data not shown). The maximum value for NSP supply (36·2 g/capita per d) was recorded in 1986 and the minimum value (25·1 g/capita per d) occurred in 1994. NSP supply in 2007 was 30·3 g/capita per d.
Trends in starch ( $$$$), sugars (
 $$$$) and fibre (NSP;
  $$$$) supply (g/capita per d) in Trinidad and Tobago between 1961 and 2007

Saturated, monounsaturated and polyunsaturated fat and cholesterol
Figure 5(a) shows the trends in saturated, monounsaturated and polyunsaturated fat supply in Trinidad and Tobago between 1961 and 2007. Between 1961 and the mid-1980s the most notable features were the consistently high level of saturated fats, at between 11 % and 14 % of energy, and the progressive rise in both monounsaturated and polyunsaturated fats. Between 1985 and 1990 the levels of saturated fat fell sharply from 13·2 % to 9·9 % of energy. By 2007 the contribution of saturated fats to total energy was about 10·8 %, with monounsaturated and polyunsaturated fats contributing 8 % and 6·5 % of energy, respectively.
(a) Contributions of SFA ( $$$$), MUFA (
 $$$$) and PUFA (
 $$$$) to energy supply (% of energy) and (b) relationship between polyunsaturated:saturated (P:S) ratio of the food supply (
 $$$$) and supply of soyabean oil (g/capita per d;
  $$$$) in Trinidad and Tobago between 1961 and 2007

Figure 5(b) shows the change in the polyunsaturated:saturated (P:S) ratio of the food supply from 1961 to 2007. The P:S ratio more than tripled from 0·15 in 1961 to 0·50 in 1990, reached a maximum of 0·73 in 2000, and was 0·60 in 2007. Figure 5(b) also shows that the major factor associated with this shift in the P:S ratio, especially since the mid-1980s, was the increasing usage of soyabean oil. Soyabean oil supply rose from 0·8 g/capita per d in 1961 to 17·0 g/capita per d in 2007, whereas coconut oil, which it largely replaced, fell from 20·6 to 5·8 g/capita per d over the same period (data not shown). Overall, the correlation between soyabean oil supply and the P:S ratio of the food supply was highly significant (R 2 = 0·922, P < 0·0001).
Cholesterol supply increased from 124 to 225 mg/capita per d between 1961 and 2007 (data not shown), and was significantly correlated to milk (R 2 = 0·83, P < 0·0001) and meat (R 2 = 0·66, P < 0·0001) supply.
Fe, vitamin A, Ca and folate
Figure 6 shows the trends in Fe, vitamin A, Ca and folate supply in Trinidad and Tobago between 1961 and 2007. Values are expressed on a nutrient density basis as percentage of the mean WHO/FAO recommendations for males and females aged 19–50 years per 10 MJ (2390 kcal) energy(19). Fe supply exceeded the mean recommendation (14·4 mg/d) between 1961 and the early 1980s but has been in a downward trend overall. Vitamin A supply rose from 63 % to 99 % of the mean recommendation (550 μg retinol equivalents/d) between 1961 and the early 1980s; however, during the last 20 years it has fallen back to less than 75 % of the recommendation. For folate and Ca, supplies ranged from approximately one-half to two-thirds of the mean recommendation of 400 μg dietary folate equivalents/d and 1000 mg Ca/d, respectively.
Per capita supply of iron ( $$$$), vitamin A (
 $$$$), folate (
 $$$$) and calcium (
 $$$$) (expressed as percentage of WHO recommendations for adults aged 19–50 years per 10 MJ energy) in Trinidad and Tobago between 1961 and 2007

Major food sources of protein, fat and carbohydrate
Figure 7 shows the top three sources of (a) protein, (b) fat and (c) carbohydrate (g/capita per d) in Trinidad and Tobago between 1961 and 2007. Wheat is still the most important source of protein, providing more than 30 g protein/capita per d, but its contribution has tended to fall over the last three decades. Poultry meat, on the other hand, is increasing in importance and is now the second highest source of protein, having overtaken milk. In the early 1960s, coconut oil was by far the most important source of fat. However since the early 1990s soyabean oil has taken over as the major fat source, followed closely by milk. For many years wheat was the most important source of carbohydrate but during the 1990s it was overtaken by sugar. Rice usage has been in long-term decline and rice now provides less than 30 g carbohydrate/capita per d, compared with approximately 160 g/capita per d coming from wheat and sugar.
Top three sources of (a) protein, (b) fat and (c) carbohydrate (g/capita per d) in Trinidad and Tobago between 1961 and 2007 ( $$$$, wheat;
  $$$$, milk;
  $$$$, poultry meat;
  $$$$,coconut oil;
  $$$$, soyabean oil;
  $$$$, sugar; ×, rice)

Discussion
The objective of the present study was to analyse the FAO food balance sheets for Trinidad and Tobago from 1961 to 2007 in order to characterise the changes that have taken place in the nutrient supply of the country during this period. The changes we observed, such as the increase in total energy supply, the growing contribution of fat and sugars to dietary energy, the dramatic increase in the P:S ratio due to the sudden shift to unsaturated oil usage in the 1980s, and the rapidly changing role of different commodities as nutrient sources, are characteristic features of the latest phase of the nutrition transition(Reference Popkin20, Reference Popkin21).
Our calculated values for total energy, fat and protein supply were 7 %, 25 % and 35 % higher, respectively, than those given on the food balance sheets. However both sets of values were significantly correlated (Figs 1(a) and (b)) and the trends observed over time were virtually identical, suggesting that coding of the commodities was appropriate. Absolute values can be expected to differ because there are differences between the food composition tables upon which our analysis was based(18) and the older nutrient values used in the FAO statistical databases(22). FAO cautions that for a variety of reasons these older compositional data may not be reflective, in many cases, of the foods and nutrients consumed today.
Our analysis showed that for Trinidad and Tobago, energy, protein and fat supply rose steadily from the early 1960s until the early to mid 1980s (Fig. 2), with energy supply reaching a maximum in 1986. The sharp falls that occurred between then and 1993 corresponded with a period when the country was going through a deep recession brought about by a downturn in the price of oil, its major export commodity(Reference Braumann23). Our finding that the food supply in 2007 provided some 1561 kJ (373 kcal) more energy per capita daily than it did in 1961 is consistent with the observation of Kennedy(Reference Kennedy24) that around the world as a whole there has been an average increase of approximately 2092 kJ (500 kcal)/capita per d in energy supply between 1961 and 1999.
The WHO recommends that 55–70 % of dietary energy should come from carbohydrate and 15–30 % should come from fat(12). Our results (Fig. 3) show that during the early 1960s the food supply of Trinidad and Tobago had a high carbohydrate component (62–63 % of energy) while fat, at only 25–26 % of energy, was well within the WHO recommendations. The most recent figures from 2007, however, indicate that fat, at 30 % of energy, is now at the upper limit of the WHO recommendations. Energy from carbohydrate is still within the recommended range; however a high and increasing proportion is in the form of sugars (Fig. 4). Sugars supply has been increasing at a rate of about 1 % per annum, whereas starch supply – the main sources of which are wheat, rice, maize, potatoes and peas – has been falling at a rate of about 0·3 % per annum. Consequently, in 2007, sugars provided about 26 % of energy, with some 21 % of energy being in the form of ‘free’ (or non-milk extrinsic) sugars (e.g. glucose, fructose, galactose, sucrose, maltose and oligosaccharides). The WHO recommendation is that <10 % of energy should be in the form of free sugars. Although the food balance sheets do account for the amounts of basic commodities (e.g. wheat, cocoa beans, milk, sugar, other sweeteners, etc.) used in the manufacture of products such as confectioneries and sweetened beverages, they provide no information on per capita consumption of these products. Thus the role these foods might be playing as potential sources of additional free sugars cannot be determined from the present analysis. For fibre, WHO recommends that intake should be >25 g total dietary fibre/d or >20 g NSP/d. Our data show that per capita supply of NSP was about 30 g/d in 2007. Although supply appears to be adequate, it is possible that intakes may not be because FAO food balance sheets make no allowances for losses that occur beyond the retail level(Reference Schmidhuber and Traill25).
One of the most striking features seen in countries undergoing the nutrition transition is the effect that societal and economic changes (such as, for example, increasing wealth and urbanisation, and changes in food policies, agricultural practices, food processing, transportation and marketing) can have over relatively short periods of time on the relative usage of commodities that make up the bulk of the food supply in individual countries(Reference Du, Mroz and Zhai26–Reference Popkin and Du28). Wheat remains the single most important food commodity in Trinidad and Tobago and is a major source of both carbohydrate and protein (Fig. 7); however, sugar is now providing at least as much carbohydrate as wheat. On the other hand, rice, which during the 1960s was also an important source of carbohydrate, now provides less than one-fifth of the carbohydrate provided by either wheat or sugar. The increasingly important role being played by milk and especially poultry meat as protein sources signifies a shift towards animal product consumption that is also happening in other countries in nutritional transition(Reference Popkin and Du28). The sudden sharp increase in soyabean oil supply during the 1980s (Fig. 5) is especially interesting. Over a 9-year period between 1985 and 1994 soyabean oil supply quadrupled, and this, coupled with the continuous decline in coconut oil usage since the 1960s (Fig. 7), resulted in a dramatic increase in the P:S ratio of the food supply from 0·15 to 0·73 between 1968 and 2000. Vegetable oil usage increased markedly through much of the world during the 1970s and 1980s, fuelled apparently by an aggressive publicity campaign by the vegetable oil industry against saturated fats because of their tendency to raise blood cholesterol, which led to the reformulation of products on a massive scale by food manufacturers(Reference Fife29, Reference Fife30). The P:S ratio has been shown to be strongly and inversely related to CHD risk in adults(Reference Hu, Stampfer and Manson31) and while there are no WHO recommendations for it, the UK Department of Health in 1984 recommended that it should be between 0·23 and 0·45(32).
For the majority of micronutrients, per capita supply (expressed per 10 MJ of energy) met or exceeded WHO recommendations throughout the study period (data not shown). However, vitamin A, folate and Ca supplies were lower than recommended levels and Fe supply was borderline (Fig. 6). These observations need to be interpreted with caution because no allowance was made for either micronutrient bioavailability or fortification. Mandatory Fe fortification of flour does take place in Trinidad and Tobago(Reference Hurrell, Ranum and de Pee33–35) and at least some flour is being fortified with folic acid(36). Likewise, in the case of Na, it is not possible to take into account Na or salt added during processing, cooking or at the table, since these events happen after the commodity stage. Thus further studies using different methodologies will be needed to ascertain the extent to which intakes of these micronutrients may be problematic.
Limitations
There are a number of limitations to the present study. As mentioned earlier, food balance sheets overestimate food consumption and nutrient intakes because they fail to take into account food waste or spoilage or other losses that occur after the retail level(Reference Schmidhuber and Traill25). Also, they allow only for per capita estimates and lack the information necessary to analyse the population by sex, age and socio-economic status(Reference Jacobs and Sumner37). Hence it is not possible to equate food balance sheet data directly with data generated using other techniques such as food consumption surveys because each approach measures different levels of dietary information(Reference Serra-Majem, MacLean and Ribas38). To try to overcome this limitation and facilitate at least some sort of comparison with official recommendations, we presented our data in relative terms (for example, as percentages of total energy, as ratios or per 10 MJ of energy, as appropriate). Another limitation is that foods are listed on the food balance sheets as basic commodities rather than the specific products that individuals eat. This presents a challenge regarding how to code the data properly for nutritional analysis. For consistency, we coded at the level of the raw unprocessed commodity wherever possible; however, this could lead to an overestimation of some components – for example, fibre. Another important limitation is the lack of detail regarding the precise make-up of certain commodity groupings, such as types of fish, fruits and vegetables. To try to overcome this issue we populated these categories using information about commonly consumed foods from a QFFQ developed specifically for a Trinidadian population(Reference Ramdath, Hilaire and Cheong17). Although this could give only an approximation of true supply for these categories, it ensured that foods typically consumed in Trinidad and Tobago but which were not already specifically accounted for in the food balance sheets would be represented. The use of a UK rather than a Caribbean food composition database is another potential limitation, although basic commodities would not be expected to differ much in composition between the two countries. On the other hand, the UK database is extremely comprehensive, which facilitates more accurate coding.
Conclusions
Despite the inherent limitations of the food balance sheet approach, the present study revealed that changes in the food supply typical of the global nutritional transition have been taking place in Trinidad and Tobago since the early 1960s. These changes include an increase in overall energy supply and energy from fat, a fall in energy from carbohydrates, and a pronounced increase in both the sugars:starch ratio and the P:S ratio of dietary fats. Energy from fat is at the upper limit of WHO recommendations and energy from sugars is well above the recommended level. In addition, a number of important micronutrients including Ca, folate and vitamin A appear to be undersupplied. Further research should be carried out using different methodologies to try to confirm these findings. The imbalances in the Trinidadian food supply brought about by the nutrition transition need to be addressed in order to try to combat the rising tide of nutrition-related chronic diseases that are projected to cause increasing disability and premature death in the country over the coming years.
Acknowledgements
Sources of funding: This research received no specific grant from any funding agency in the public, commercial or not-for-profit sectors. Conflicts of interest: The authors declare they have no conflicts of interest. Ethics: Ethical approval was not required. Authors’ contributions: T.S. conceived and designed the study, collated and analysed the data and drafted the manuscript. S.S. provided QFFQ data on commonly foods consumed in Trinidad and Tobago, critically reviewed the manuscript and revised it for important intellectual content. Acknowledgements: The authors express their sincere gratitude to FAOSTAT, Statistics Division of the FAO, for allowing use of its data.
Commodities listed in FAO food balance sheets
Cereals – excluding beer: wheat; rice (milled equivalent); barley; maize; rye; cereals (other)
Starchy roots: cassava; potatoes; sweet potatoes; yams; roots (other)
Sugar crops: sugar (raw equivalent); sweeteners (other); honey
Pulses: beans; peas; pulses (other)
Treenuts
Oilcrops: soyabeans; groundnuts (shelled equivalent); sunflowerseed; rape and mustardseed; coconuts - including copra; sesameseed; olives
Vegetable oils: soyabean oil; groundnut oil; sunflowerseed oil; cottonseed oil; palmkernel oil; coconut oil; sesameseed oil; olive oil; maize germ oil
Vegetables: tomatoes; vegetables (other)
Fruits – excluding wine: oranges; lemons; grapefruit; citrus (other); bananas; plantains; apples; pineapples; dates; grapes; fruits (other)
Stimulants: coffee; cocoa beans; tea
Spices: pepper; pimento; cloves; spices (other)
Alcoholic beverages: wine; beer; beverages (fermented); beverages (alcoholic)
Meat: bovine meat; mutton & goat meat; pig meat; poultry meat; meat (other)
Animal fats: butter, ghee; cream; animal fats (raw); fish body oil; fish liver oil;
Milk – excluding butter
Eggs
Fish, seafood: freshwater fish: demersal fish; pelagic fish; marine fish; crustaceans; cephalopods; molluscs; other


