


1 Introduction
The free energy stored in magnetically confined, toroidal plasmas gives rise to a number of plasma instabilities. As fluctuations excited by these instabilities grow, they develop into turbulence, which rapidly transports thermal energy from the plasma core to the plasma edge. The resulting heat loss is a major obstacle to developing a commercially viable fusion reactor, and finding ways to reduce turbulent transport is one of the primary goals of current fusion research. An important step towards achieving this goal is to determine the linear stability thresholds of the relevant plasma modes.
At sufficiently small values of  $\beta$ (the ratio of plasma pressure to magnetic pressure), it is difficult for plasma fluctuations to perturb the magnetic field, and the dominant instabilities, such as the ion- and electron-temperature-gradient modes, are electrostatic (see, e.g. Cowley, Kulsrud & Sudan Reference Cowley, Kulsrud and Sudan1991; Dorland et al. Reference Dorland, Jenko, Kotschenreuther and Rogers2000). However, as
  $\beta$ increases, electromagnetic instabilities, such as the microtearing mode (MTM) and kinetic ballooning mode (KBM), eventually become the main drivers of turbulence. Such electromagnetic instabilities are of particular relevance to spherical tokamaks, in which
  $\beta$ is typically several times larger than in conventional tokamaks (see, e.g. Giacomin et al. (Reference Giacomin, Dickinson, Kennedy, Patel and Roach2023), Kennedy et al. (Reference Kennedy, Giacomin, Casson, Dickinson, Hornsby, Patel and Roach2023) and references therein). The purpose of this paper is to derive the gyrokinetic MTM dispersion relation in the collisionless limit, which is relevant to the hot plasmas in the cores of existing and planned fusion devices.
We have organized the remainder of this paper as follows. In §§ 1.1 to 1.5, we highlight selected results from the literature and preview the main steps in our derivation of the MTM dispersion relation, which follows in detail in § 2. In § 3, we present several numerical examples, and in § 4 we discuss our principal findings and conclude.
1.1 Magnetic drift waves
A simple but useful reference point for understanding the MTM is the isobaric magnetic drift wave in a plasma in which the equilibrium magnetic field  $\boldsymbol {B}$ is uniform and static, and neither the equilibrium electron pressure
  $p_{\rm e}$ nor the fluctuating quantities vary along
  $\boldsymbol {B}$. If we neglect electron inertia, then we can write the component of the electron momentum equation along the total magnetic field
  $\boldsymbol {B} + \delta \boldsymbol {B}$ as
 \begin{equation} \frac{e n_0}{c} \frac{\partial }{\partial t} \delta A_\parallel= \frac{\delta \boldsymbol{B}_\perp}{B}\boldsymbol{\cdot} \boldsymbol{\nabla} p_{\rm e}, \end{equation}
or, equivalently,
 \begin{equation} \left( \frac{\partial }{\partial t} + \boldsymbol{v}_{{\ast} {\rm e}} \boldsymbol{\cdot} \boldsymbol{\nabla} \right)\delta A_\parallel= 0,\end{equation}
where  $e$ is the proton charge,
  $c$ is the speed of light,
  $\delta A_\parallel = \boldsymbol {b} \boldsymbol {\cdot } \delta \boldsymbol {A}$,
  $\boldsymbol {b} = \boldsymbol {B}/B$,
  $\delta \boldsymbol {A}$ is the perturbation to the vector potential,
 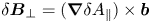 $\delta \boldsymbol {B}_\perp = (\boldsymbol {\nabla } \delta A_\parallel ) \times \boldsymbol {b}$ is the component of
  $\delta \boldsymbol {B}$ perpendicular to
  $\boldsymbol {B}$, and
 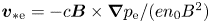 $\boldsymbol {v}_{\ast {\rm e}} = - c\boldsymbol {B} \times \boldsymbol {\nabla } p_{\rm e} / (en_0 B^2)$ is the electron diamagnetic drift velocity. This equation is equivalent to (D20) of Adkins et al. (Reference Adkins, Schekochihin, Ivanov and Roach2022) in the limit that
  $\lambda \gg d_{\rm e}$, where
  $\lambda$ is the perpendicular wavelength and
  $d_{\rm e}$ is the electron skin depth. Equation (1.2) describes magnetic drift waves, in which
  $\delta A_\parallel$ is advected at velocity
  $\boldsymbol {v}_{\ast {\rm e}}$.
1.2 Ballooning transformation, quasimodes and mode rational surfaces
Throughout the rest of this paper, we consider axisymmetric toroidal equilibria and focus on individual Fourier modes 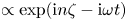 $\propto \exp ( {\rm i} n \zeta - {\rm i} \omega t)$ with infinitesimal amplitudes, where
  $\zeta$ is the toroidal angle,
  $n$ is the toroidal mode number and
  $\omega$ is the frequency. In order to enforce rapid spatial variation perpendicular to
  $\boldsymbol {B}$, slow variation along
  $\boldsymbol {B}$ and periodicity in the poloidal angle
  $\theta$, we set
  $n\gg 1$ and employ the ballooning transformation (Connor, Hastie & Taylor Reference Connor, Hastie and Taylor1978, Reference Connor, Hastie and Taylor1979; Tang, Connor & Hastie Reference Tang, Connor and Hastie1980),
 \begin{equation} \boldsymbol{u} (\psi, \theta,\zeta) = \sum_{j={-}\infty}^\infty \hat{\boldsymbol{u}}(\psi,\theta+2{\rm \pi} j) \exp\left\{ {\rm i}n \left[\alpha(\psi, \theta + 2{\rm \pi} j, \zeta) + \int^\psi \bar{k}(\psi^\prime)\,{\rm d}\psi^\prime \right]\right\},\end{equation}
where  $\boldsymbol {u}$ is a vector whose components are the various fluctuating quantities,
  $\psi$ is the poloidal flux and
  $\bar {k}(\psi )$ is a function that is discussed in the run-up to (2.9). The triad
  $(\alpha, \psi, \theta )$ is a Clebsch coordinate system, in which
  $\alpha (\psi, \theta, \zeta )$ (defined in (2.4)) and
  $\psi$ are constant along magnetic-field lines, while the poloidal angle
  $\theta$ serves to measure position along
  $\boldsymbol {B}$. Although the (position-space) mode
  $\boldsymbol {u}(\psi,\theta,\zeta )$ is periodic in
  $\theta$, the (ballooning-space) ‘quasimode’
  $\hat {\boldsymbol {u}}$ is not. Instead,
  $\hat {\boldsymbol {u}}(\psi, \theta ) \rightarrow 0$ as
  $\theta \rightarrow \pm \infty$ to ensure that the sum in (1.3) converges. As discussed further in § 2.2, the very broad
  $\theta$ envelope of the MTM's electrostatic potential eigenfunction
  $\delta \hat {\varPhi }$ implies that
  $\delta \varPhi$ in position space is peaked around mode rational surfaces on which
  $n q(\psi )$ is an integer, where
  $q(\psi )$ is the safety factor defined in (2.5) (Cowley et al. Reference Cowley, Kulsrud and Sudan1991; Hardman et al. Reference Hardman, Parra, Patel, Roach, Ruiz Ruiz, Barnes, Dickinson, Dorland, Parisi, St-Onge and Wilson2023). It follows from (2.20) and (2.24a,b) that mode rational surfaces are, for each
  $n$, spaced a distance
  $\sim k_\wedge ^{-1}$ apart, where
  $k_\wedge$ is the binormal wavenumber (the wavevector component perpendicular to both
  $\boldsymbol {B}$ and
  $\boldsymbol {\nabla } \psi$) defined in (2.14). Because of magnetic shear (illustrated in figure 1b), quasimode structure at
  $|\theta |\gg 1$ corresponds to mode structure at spatial scales
  $\sim (k_\wedge |\theta |)^{-1}$ in the
  $\boldsymbol {\nabla } \psi$ direction (see (2.13) and (2.14)).
The blue lines are segments of an equilibrium magnetic-field line that traces out a mode rational surface in a hypothetical spherical tokamak. (a) The black dashed curve shows, in an exaggerated fashion, how a segment of this field line might be perturbed by an MTM. (b) The red line highlights one of the blue field-line segments, and the black dotted line is a nearby equilibrium magnetic-field line at slightly larger  $\psi$. We assume
  ${\rm d}q/{\rm d}\psi >0$, where
  $q$ is defined in (2.5), so that the black dotted field line rotates through a smaller
  $\theta$ interval than the solid red line as the two lines traverse the same interval of toroidal angle. This magnetic shear rotates the phase fronts of the MTMs, causing them to draw closer together in the
  $\boldsymbol {\nabla } \psi$ direction as one follows the red field-line segment from the lower right-hand side of the figure to the upper left-hand side, as illustrated schematically by the blue-and-grey-striped squares.

1.3 Tearing parity
MTMs involve  $\delta A_\parallel$ perturbations that behave like the magnetic drift waves described in § 1.1, propagating at a velocity
  $\simeq \boldsymbol {v}_{\ast {\rm e}}$ (see figure 3). As we discuss in greater detail in § 2.2, a defining feature of the MTM is ‘tearing parity’, which means that
  $\delta \hat {A}_\parallel$ has a non-vanishing line integral along the magnetic field (Hatch Reference Hatch2010; Dickinson et al. Reference Dickinson, Saarelma, Scannell, Kirk, Roach and Wilson2011; Ishizawa et al. Reference Ishizawa, Maeyama, Watanabe, Sugama and Nakajima2015; Patel et al. Reference Patel, Dickinson, Roach and Wilson2022). This in turn implies that, as one follows a perturbed magnetic-field line at a mode rational surface, the field line wanders secularly in the
  $\psi$ direction (Hardman et al. Reference Hardman, Parra, Patel, Roach, Ruiz Ruiz, Barnes, Dickinson, Dorland, Parisi, St-Onge and Wilson2023), as illustrated in figure 1(a). Magnetic-field lines perturbed by MTMs thus create channels for electrons to transport heat down the temperature gradient, enabling MTMs to tap into the free energy stored in the electron temperature profile (Drake et al. Reference Drake, Gladd, Liu and Chang1980; Guttenfelder et al. Reference Guttenfelder, Candy, Kaye, Nevins, Wang, Zhang, Bell, Crocker, Hammett, LeBlanc, Mikkelsen, Ren and Yuh2012b). In contrast, in KBMs, a perturbed magnetic-field line at a mode rational surface returns to its initial equilibrium magnetic flux surface after each poloidal revolution about the plasma (see § 2.2). This essential difference between the MTM and KBM is why the MTM (in contrast to the KBM) is driven by the electron temperature gradient (and the rapid transport of heat along perturbed magnetic-field lines by electrons) and not by the density gradient (see § 2.10 and, e.g., Hazeltine, Dobrott & Wang Reference Hazeltine, Dobrott and Wang1975; Drake & Lee Reference Drake and Lee1977; Hassam Reference Hassam1980; Applegate et al. Reference Applegate, Roach, Connor, Cowley, Dorland, Hastie and Joiner2007; Guttenfelder et al. Reference Guttenfelder, Candy, Kaye, Nevins, Bell, Hammett, LeBlanc and Yuh2012a; Predebon & Sattin Reference Predebon and Sattin2013; Zocco et al. Reference Zocco, Loureiro, Dickinson, Numata and Roach2015; Hamed et al. Reference Hamed, Muraglia, Camenen, Garbet and Agullo2019; Geng, Dickinson & Wilson Reference Geng, Dickinson and Wilson2020; Patel et al. Reference Patel, Dickinson, Roach and Wilson2022; Giacomin et al. Reference Giacomin, Dickinson, Kennedy, Patel and Roach2023; Hardman et al. Reference Hardman, Parra, Patel, Roach, Ruiz Ruiz, Barnes, Dickinson, Dorland, Parisi, St-Onge and Wilson2023; Yagyu & Numata Reference Yagyu and Numata2023).
1.4 Characteristic scales and quasimode eigenfunctions
The characteristic MTM binormal wavenumber satisfies  $k_\wedge \rho _{\rm e} \ll 1$, where
  $\rho _{\rm e}$ is the electron gyroradius. As we discuss further in § 2, the
  $\delta \hat {A}_\parallel$ fluctuation of an MTM is approximately localized to a
  $\theta$ interval of order unity (e.g. Applegate et al. Reference Applegate, Roach, Connor, Cowley, Dorland, Hastie and Joiner2007; Hamed et al. Reference Hamed, Muraglia, Camenen, Garbet and Agullo2019; Hardman et al. Reference Hardman, Parra, Patel, Roach, Ruiz Ruiz, Barnes, Dickinson, Dorland, Parisi, St-Onge and Wilson2023). Because the MTM has tearing parity, this localized
  $\delta \hat {A}_\parallel$ fluctuation creates parallel current density
  $\delta \hat {j}_\parallel$ via two very powerful mechanisms: the rapid streaming of passing electrons along perturbed magnetic-field lines that connect different equilibrium magnetic flux surfaces, and the parallel inductive electric field
 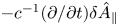 $-c^{-1} (\partial /\partial t)\delta \hat {A}_\parallel$. In § 4, we label the current densities created by these two mechanisms
  $\delta \hat {j}_{\delta B_\psi }$ and
  $\delta \hat {j}_{\delta E_\parallel }$, respectively, and give mathematical expressions for each. Because of the rapid motion of electrons, the non-Boltzmann part of the perturbation to the passing-electron gyrokinetic distribution function, denoted by
  $\hat {h}_{{\rm e,\, passing}}$, created by these two current-generation mechanisms persists out to great distances along the magnetic field (i.e. out to
  $|\theta | \gg 1$) and generates, via the quasineutrality condition, a perturbation to the electrostatic potential
  $\delta \hat {\varPhi }$ that likewise extends to
  $|\theta | \gg 1$ (Hardman et al. Reference Hardman, Parra, Chong, Adkins, Anastopoulos-Tzanis, Barnes, Dickinson, Parisi and Wilson2022, Reference Hardman, Parra, Patel, Roach, Ruiz Ruiz, Barnes, Dickinson, Dorland, Parisi, St-Onge and Wilson2023).
The width of the  $\delta \hat {\varPhi }$ eigenfunction in
  $\theta$ is ultimately limited by several factors. Magnetic shear (i.e. non-zero
  ${\rm d}q/{\rm d}\psi$) endows
  $\delta \hat {\varPhi }$ and
  $\hat {h}_{{\rm e,\, passing}}$ at large
  $|\theta |$ with spatial structure at scales
  $\ll k_\wedge ^{-1}$ in the
  $\boldsymbol {\nabla } \psi$ direction, as illustrated in figure 1(b). In addition, at large
  $|\theta |$, passing electrons at the same position but different velocities that are moving towards larger
  $|\theta |$ will have previously interacted with electromagnetic fluctuations at smaller
  $|\theta |$ that were at substantially different phases, which causes
  $\hat {h}_{{\rm e,\, passing}}$ at sufficiently large
  $|\theta |$ to become a rapidly varying function of velocity. As we discuss further in Appendix B, the rapid variation of
  $\hat {h}_{{\rm e,\, passing}}$ (in space and velocity) causes
  $\delta \hat {\varPhi }$ to decay (via gyroaveraging and phase mixing) at
 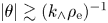 $|\theta | \gtrsim (k_\wedge \rho _{\rm e})^{-1}$ (cf. Hardman et al. Reference Hardman, Parra, Chong, Adkins, Anastopoulos-Tzanis, Barnes, Dickinson, Parisi and Wilson2022, Reference Hardman, Parra, Patel, Roach, Ruiz Ruiz, Barnes, Dickinson, Dorland, Parisi, St-Onge and Wilson2023).Footnote 1 As the MTM
  $\delta \hat {\varPhi }$ eigenfunction extends out to
  $|\theta | \sim (k_\wedge \rho _{\rm e})^{-1}$ in ballooning space, the
  $\delta \varPhi$ fluctuations in position space have a characteristic scale
  $(k_\wedge \theta )^{-1} \sim \rho _{\rm e}$ in the
  $\boldsymbol {\nabla } \psi$ direction.
1.5 The MTM dispersion relation
Our derivation of the MTM dispersion relation in § 2 consists of four steps to determine the four unknowns  $\hat {h}_{\rm e}$,
  $\delta \hat {A}_\parallel$,
  $\delta \hat {\varPhi }$ and
  $\omega$, where
  $\hat {h}_{\rm e}$ is the non-Boltzmann part of the perturbed electron distribution function for both passing and trapped electrons. First, we integrate the gyrokinetic equation (2.25) to solve for
  $\hat {h}_{\rm e}$ in terms of
  $\delta \hat {A}_\parallel$,
  $\delta \hat {\varPhi }$ and
  $\omega$. Second, we take
  $\partial /\partial \theta$ of
  $1/B$ times the parallel component of Ampere's law to show that
  $\delta \hat {A}_\parallel$ is localized at
  $\theta \sim O (1)$. This localization implies that further appearances of
  $\delta \hat {A}_\parallel$ are always inside its line integral along the magnetic field,
  $\int _{-\infty }^\infty J B \delta \hat {A}_\parallel \,{\rm d} \theta$, where
  $J = (\boldsymbol {B} \boldsymbol {\cdot } \boldsymbol {\nabla } \theta )^{-1}$ is the Jacobian of the
  $(\alpha, \psi, \theta )$ coordinate system. As long as it is non-zero (as it is for a tearing-parity mode), this integral can be factored out of the remaining equations as an overall normalization constant. Third, we evaluate the parallel component of Ampere's law at
  $\theta =0$ to obtain a single equation for the two remaining unknowns,
  $\omega$ and
  $\delta \hat {\varPhi }$. Finally, we use the quasineutrality condition to solve for
  $\delta \hat {\varPhi }$ in terms of
  $\omega$ and plug this value back into the parallel component of Ampere's law at
  $\theta =0$.
Our analysis is greatly simplified by the two-scale nature of the problem. In particular, the contribution of  $\delta \hat {\varPhi }$ to the parallel current at
  $\theta =0$, denoted by
  $\delta \hat {j}_{\delta \varPhi }$, is dominated by the
  $\delta \hat {\varPhi }$ fluctuations at
  $\theta \sim (k_\wedge \rho _{\rm e})^{-1}$. As a consequence, when we use the quasineutrality condition to solve for
  $\delta \hat {\varPhi }$ in step 4 of the programme described in previous paragraph, we can, to leading order, restrict our attention to values of
  $|\theta |$ that are sufficiently large that: (i) the non-Boltzmann part of the perturbed ion distribution function
  $\hat {h}_{\rm i}$ can be neglected because of gyroaveraging and phase mixing, and (ii)
  $\delta \hat {A}_\parallel$ enters the quasineutrality condition only via the quantity
  $\int _{-\infty }^\infty J B \delta \hat {A}_\parallel \,{\rm d} \theta$, as already mentioned.
We note that  $\delta \hat {j}_{\delta \varPhi }$ does not arise from the parallel electric field associated with
  $\delta \varPhi$, whose effects are included in the Boltzmann response, which is an even function of the parallel velocity and hence does not generate parallel current. Instead,
  $\delta \hat {j}_{\delta \varPhi }$ arises from electron energization or de-energization caused by the partial time derivative of the electrostatic potential energy
  $-e\partial \delta \hat {\varPhi }/\partial t$ and from
  $\delta \hat {\varPhi }$ causing electrons to
  $\boldsymbol {E} \times \boldsymbol {B}$-drift across the equilibrium flux surfaces.Footnote 2
2 Derivation of the MTM dispersion relation
We consider a gyrokinetic model of a plasma whose equilibrium state is axisymmetric. A comprehensive derivation of the equations describing this system is reviewed by Abel et al. (Reference Abel, Plunk, Wang, Barnes, Cowley, Dorland and Schekochihin2013), who included plasma rotation, which we neglect for simplicity. In this model, the equilibrium distribution function of species  $s$ (with
  $s = \mathrm {i}$ for the lone ion species and
  $s = \mathrm {e}$ for electrons) is a Maxwellian, and the number density
  $n_0$ and temperature
  $T_{s}$ are flux functions:
 \begin{equation} F_{0s} = \frac{n_0(\psi)}{{\rm \pi}^{3/2} v_{T s}^3} \exp\left( - \frac{m_{s} E}{T_{s}(\psi)} \right),\end{equation}
where  $\psi$ is the poloidal flux,
  $E = v^2/2$,
  $\boldsymbol {v}$ is the particle velocity,
  $v_{T s} = ( 2 T_{s}/m_{s})^{1/2}$ is the thermal speed of species
  $s$, and
  $m_{s}$ is the mass of a particle of species
  $s$.
$s$.
The equilibrium magnetic field  $\boldsymbol {B}$ can be written in two equivalent ways: the standard form for axisymmetric equilibria,
 \begin{equation} \boldsymbol{B} = \boldsymbol{\nabla} \zeta \times \boldsymbol{\nabla} \psi + I(\psi) \boldsymbol{\nabla} \zeta, \end{equation}
and the Clebsch form (Kruskal & Kulsrud Reference Kruskal and Kulsrud1958)
 \begin{equation} \boldsymbol{B} = \boldsymbol{\nabla} \alpha \times \boldsymbol{\nabla} \psi.\end{equation}
Here,  $\zeta$ is the toroidal angle,
  $I(\psi )$ is the axial current divided by
  $2{\rm \pi}$,
 \begin{equation} \alpha(\psi, \theta, \zeta) \equiv \zeta - q(\psi) \theta - \nu(\psi, \theta),\end{equation}
 $\theta$ is the poloidal angle,
 \begin{equation} q(\psi ) \equiv \frac{1}{2{\rm \pi}} \int_0^{2{\rm \pi}} \frac{\boldsymbol{B} \boldsymbol{\cdot} \boldsymbol{\nabla} \zeta}{\boldsymbol{B} \boldsymbol{\cdot} \boldsymbol{\nabla} \theta} \,{\rm d}\theta ,\end{equation}
is the safety factor and
 \begin{equation} \nu(\psi, \theta) = \int_0^\theta \frac{\boldsymbol{B} \boldsymbol{\cdot} \boldsymbol{\nabla} \zeta}{\boldsymbol{B} \boldsymbol{\cdot} \boldsymbol{\nabla} \theta^\prime}\, {\rm d} \theta^\prime - q(\psi)\theta. \end{equation}
The  $\theta$ integrals in (2.5) and (2.6) are evaluated at constant
  $\psi$. Unlike
  $\alpha$,
  $\nu$ is a single-valued, periodic function of
  $\theta$. As mentioned in § 1.2, in Clebsch coordinates
  $(\alpha, \psi, \theta )$,
  $\alpha$ and
  $\psi$ serve to label the magnetic-field lines, and
  $\theta$ determines the position along a magnetic-field line.
2.1 Ballooning transformation
As mentioned in § 1.2, we represent all fluctuating quantities as Fourier series in the toroidal angle  $\zeta$ and focus on a single Fourier mode with toroidal mode number
  $n$. Because the spatial variation of MTMs in the plane perpendicular to
  $\boldsymbol {B}$ is much more rapid than their spatial variation along
  $\boldsymbol {B}$, it would be natural to take all fluctuating quantities to be of the form
  $f(\psi, \theta ) \exp \{{\rm i} n [\alpha + g(\psi )]\}$ with
  $|n| \gg 1$, where
  $f(\psi, \theta )$ and
  $g(\psi )$ are slowly varying functions. However, as pointed out by Connor et al. (Reference Connor, Hastie and Taylor1978), fluctuations of this form are unphysical when
  $q$ is irrational, because they are not periodic in
  $\theta$. This is problematic because
  $q$ is irrational in essentially all of the plasma volume when
  $q^\prime (\psi ) \neq 0$.
To circumvent this difficulty, we follow Connor et al. (Reference Connor, Hastie and Taylor1978), Tang et al. (Reference Tang, Connor and Hastie1980) and others by employing the ballooning transformation,
 \begin{equation} \boldsymbol{u}(\psi, \theta, \zeta)=\sum_{j={-}\infty}^\infty \hat{\boldsymbol{u}}(\psi, \theta + 2{\rm \pi} j) \,{\rm e}^{{\rm i} n S(\psi, \theta + 2 {\rm \pi}j, \zeta)}, \end{equation}
where  $\boldsymbol {u}$ is a vector whose components are the various fluctuating quantities,
  $|n| \gg 1$,
  $\hat {\boldsymbol {u}}$ is a slowly varying function of
  $\psi$ and
  $\theta$, and
  $\boldsymbol {B} \boldsymbol {\cdot } \boldsymbol {\nabla } S = 0$. These last three conditions guarantee rapid spatial variation, but only in directions perpendicular to
  $\boldsymbol {B}$. We require that
  $\hat {\boldsymbol {u}}(\psi, \theta )\rightarrow 0$ sufficiently rapidly as
  $|\theta | \rightarrow \infty$ for the sum in (2.7) to converge. As mentioned in § 1.2, we refer to
  $\boldsymbol {u}$ as the ‘mode’ and
  $\hat {\boldsymbol {u}}$ as the ‘quasimode.’ The ballooning transformation represents
  $\boldsymbol {u}$ as the sum of an infinite number of copies of
  $\hat {\boldsymbol {u}} e^{inS}$ that are translated in
  $\theta$ by successive integer multiples of
  $2{\rm \pi}$, thereby ensuring that
  $\boldsymbol {u}$ is periodic in
  $\theta$.
As we are taking  $\boldsymbol {u}(\psi, \theta, \zeta )$ to be
  $\propto {\rm e}^{{\rm i} n \zeta }$ with no other
  $\zeta$ dependence, the condition
  $\boldsymbol {B} \boldsymbol {\cdot } \boldsymbol {\nabla } S = 0$ implies that (Tang et al. Reference Tang, Connor and Hastie1980)
 \begin{equation} S = \alpha + \int^\psi \bar{k}(\psi^\prime)\,{\rm d}\psi^\prime,\end{equation}
where  $\bar {k}(\psi )$ is some function of
  $\psi$ alone. Thus, the eikonal form conjectured in the first paragraph of this section describes the rapid cross-field spatial variation of the summand in (2.7) rather than the spatial variation of
  $\boldsymbol {u}(\psi, \theta, \zeta )$ in its entirety. The function
  $\bar {k}(\psi )$ can in principle be determined through a global analysis, but here we carry out a local analysis about some flux surface
  $\psi =\psi _0$, with
  $\bar {k}(\psi _0)$ a free parameter that is related to the ballooning angle (see, e.g. Hardman et al. Reference Hardman, Parra, Chong, Adkins, Anastopoulos-Tzanis, Barnes, Dickinson, Parisi and Wilson2022)
 \begin{equation} \theta_0 = \frac{\bar{k}(\psi_0)}{q^\prime(\psi_0)}.\end{equation}
If we represent the linear eigenvalue problem that determines the MTM eigenfunctions and dispersion relation in the form
 \begin{equation} {\mathcal{L}} \boldsymbol{u} = 0,\end{equation}
where  ${\mathcal {L}}$ is a linear operator whose coefficients are periodic in
  $\theta$ with period
  $2{\rm \pi}$, then the condition
 \begin{equation} {\mathcal{L}} \bar{\boldsymbol{u}} = 0\end{equation}
is sufficient for  $\boldsymbol {u}$ to solve (2.10). In subsequent sections, we will solve (2.11) rather than (2.10) and simplify notation by writing
  $\hat {\boldsymbol {u}}(\psi, \theta ) = \hat {\boldsymbol {u}}( \theta )$ without explicitly referencing the slow dependence on
  $\psi$.
The perpendicular wavevector is
 \begin{equation} \boldsymbol{k}_\perp= n \boldsymbol{\nabla} S.\end{equation}
The component of  $\boldsymbol {k}_\perp$ in the
  $\boldsymbol {\nabla } \psi$ direction can be written in the form (Hardman et al. Reference Hardman, Parra, Chong, Adkins, Anastopoulos-Tzanis, Barnes, Dickinson, Parisi and Wilson2022)
 \begin{equation} k_{{\perp} \psi} \equiv \boldsymbol{k}_\perp \boldsymbol{\cdot} \frac{\boldsymbol{\nabla} \psi}{|\boldsymbol{\nabla} \psi|} = n q^\prime(\psi) |\boldsymbol{\nabla} \psi| (\theta_0 - \theta) - \frac{n}{|\boldsymbol{\nabla} \psi|} ( q \boldsymbol{\nabla} \psi \boldsymbol{\cdot} \boldsymbol{\nabla} \theta + \boldsymbol{\nabla} \psi \boldsymbol{\cdot} \boldsymbol{\nabla} \nu), \end{equation}
which shows that  $|k_{\perp \psi }|$ grows approximately linearly with
  $\theta$ when
  $|\theta | \gg 1$ in the presence of magnetic shear (non-zero
  $q^\prime$). The binormal wavenumber is
 \begin{align} k_\wedge= \boldsymbol{k}_\perp \boldsymbol{\cdot} \left( \frac{\boldsymbol{\nabla} \psi}{|\boldsymbol{\nabla} \psi|} \times \boldsymbol{b} \right) = n \boldsymbol{\nabla} \alpha \boldsymbol{\cdot} \left( \frac{\boldsymbol{\nabla} \psi}{|\boldsymbol{\nabla} \psi|} \times \boldsymbol{b} \right) = \frac{n}{|\boldsymbol{\nabla} \psi|} (\boldsymbol{\nabla} \alpha \times \boldsymbol{\nabla} \psi) \boldsymbol{\cdot} \boldsymbol{b} = \frac{nB}{|\boldsymbol{\nabla} \psi|}, \end{align}
where  $\boldsymbol {b} = \boldsymbol {B}/B$, and the fourth equality in (2.14) follows from (2.3).
2.2 Mode rational surfaces and tearing parity
With the aid of (2.4) and (2.8), we can rewrite (2.7) in the form
 \begin{equation} \boldsymbol{u}(\psi, \theta, \zeta)=\sum_{j={-}\infty}^\infty \hat{\boldsymbol{u}}(\psi, \theta + 2{\rm \pi} j) \,{\rm e}^{{\rm i} n\left[\alpha(\psi, \theta, \zeta) - 2{\rm \pi} q(\psi) j + \int^\psi \bar{k}(\psi^\prime)\, {\rm d} \psi^\prime\right]}.\end{equation}
As discussed in § 1,  $\delta \hat {\varPhi }$ retains a comparable magnitude as
  $|\theta |$ increases to values
  $\gg 1$. If one were to treat
  $\delta \hat {\varPhi }(\theta )$ as approximately constant out to large values of
  $|\theta |$, then the sum on the right-hand side of (2.15) would add to large values (exhibiting constructive interference of quasimodes) at mode rational surfaces on which
  $nq(\psi ) = m$, where
  $m$ is an integer (Cowley et al. Reference Cowley, Kulsrud and Sudan1991). For this reason, in position space, the electrostatic-potential fluctuations of MTMs are peaked on mode rational surfaces.
Mode rational surfaces have an additional significance related to the perturbed magnetic-field lines. As mentioned in § 1.3, MTMs, unlike KBMs, satisfy the tearing-parity condition (Hatch Reference Hatch2010; Dickinson et al. Reference Dickinson, Saarelma, Scannell, Kirk, Roach and Wilson2011; Ishizawa et al. Reference Ishizawa, Maeyama, Watanabe, Sugama and Nakajima2015; Patel et al. Reference Patel, Dickinson, Roach and Wilson2022)
 \begin{equation} \int_{-\infty}^\infty {\rm d}\theta J B \delta \hat{A}_{{\parallel}} \sim \int_{-\infty}^\infty {\rm d}\theta J B \,|\delta\hat{A}_{{\parallel}}|,\end{equation}
where  $J = [(\boldsymbol {\nabla } \zeta \times \boldsymbol {\nabla } \psi ) \boldsymbol {\cdot } \boldsymbol {\nabla } \theta ]^{-1} = [(\boldsymbol {\nabla } \alpha \times \boldsymbol {\nabla } \psi ) \boldsymbol {\cdot } \boldsymbol {\nabla } \theta ]^{-1} = (\boldsymbol {B}\boldsymbol {\cdot } \boldsymbol {\nabla } \theta )^{-1}$ is the Jacobian of both the
  $(\zeta, \psi, \theta )$ and
  $(\alpha, \psi, \theta )$ coordinate systems that was previously mentioned in § 1.5. Equation (2.16) implies that perturbed magnetic-field lines at mode rational surfaces wander secularly towards either larger or smaller
  $\psi$ (Hardman et al. Reference Hardman, Parra, Patel, Roach, Ruiz Ruiz, Barnes, Dickinson, Dorland, Parisi, St-Onge and Wilson2023). To show this, we parameterize the perturbed magnetic-field line that passes through position
  $(\alpha _1, \psi _1, \theta _1)$ using the Clebsch coordinate functions
  $\alpha (\theta ) = \alpha _1 + \delta \alpha (\theta )$ and
 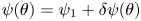 $\psi (\theta ) = \psi _1 + \delta \psi (\theta )$, with
  $\delta \alpha (\theta _1) = 0$ and
  $\delta \psi (\theta _1) = 0$. We define
  $l(\theta )$ to be the distance along this perturbed magnetic-field line and
  $s_\perp (\theta )$ to be the distance between this perturbed field line and the equilibrium flux surface
  $\psi = \psi _1$. To leading order in the (infinitesimal) MTM amplitude,
 \begin{align} \delta \psi(\theta_1 + 2{\rm \pi}) &= \int_{\theta_1}^{\theta_1+2{\rm \pi}} \frac{{\rm d}\psi}{{\rm d}s_\perp} \frac{{\rm d}s_\perp}{{\rm d}l} \frac{{\rm d}l}{{\rm d}\theta}\,{\rm d}\theta \nonumber\\ & =\int_{\theta_1}^{\theta_1+2{\rm \pi}} |\boldsymbol{\nabla} \psi| \sum_{j={-}\infty}^\infty\delta \hat{B}_\psi(\theta+ 2{\rm \pi} j)\, {\rm e}^{{\rm i}n(S_1 - 2{\rm \pi} j q_1 )} \frac{{\rm d}\theta}{\boldsymbol{B} \boldsymbol{\cdot} \boldsymbol{\nabla} \theta}, \end{align}
where we have taken  $s_\perp$ to increase in the direction of increasing
  $\psi$ and
  $l$ to increase in the direction of
  $\hat {\boldsymbol {b}}$,
 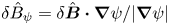 $\delta \hat {B}_\psi = \delta \hat {\boldsymbol {B}} \boldsymbol {\cdot } \boldsymbol {\nabla } \psi / |\boldsymbol {\nabla } \psi |$,
  $S_1 = \alpha _1 + \int ^{\psi _1}\bar {k}(\psi )\, {\rm d}\psi$,
  $q_1 = q(\psi _1)$, and the
  $\theta$ integral in (2.17) is carried out at
  $\alpha = \alpha _1$ and
  $\psi = \psi _1$. To leading order in
  $1/n$,
  $\delta \hat {B}_\psi = - {\rm i} k_\wedge \delta \hat {A}_\parallel$. If we take
  $\psi =\psi _1$ to be a mode rational surface on which
  $nq_1$ is an integer, then, with the aid of (2.14), we can rewrite (2.17) as
 \begin{align} \delta \psi(\theta_1+2{\rm \pi})|_{n q_1 = \mathrm{integer}} &={-} {\rm i} n\, {\rm e}^{{\rm i}nS_1} \sum_{j={-}\infty}^\infty \int_{\theta_1}^{\theta_1+2{\rm \pi}} J(\theta) B(\theta) \delta \hat{A}_\parallel(\theta + 2{\rm \pi} j) \, {\rm d}\theta\nonumber\\ &={-} {\rm i} n\, {\rm e}^{{\rm i}nS_1} \int_{-\infty}^\infty J B \delta \hat{A}_\parallel\,{\rm d} \theta. \end{align}
Equation (2.16) implies that the right-hand side of (2.18) is non-zero. (In contrast,  $\int _{-\infty }^\infty J B \delta \hat {A}_\parallel \, {\rm d} \theta$ vanishes for KBMs in the low- and intermediate-frequency regimes; Tang et al. Reference Tang, Connor and Hastie1980.) Because the right-hand side of (2.18) is a function of
  $\alpha _1$ and
  $\psi _1$ but not
  $\theta _1$, a perturbed magnetic-field line on a mode rational surface keeps wandering in the same direction in
  $\psi$ each time it winds around the plasma in the poloidal direction.
2.3 Orderings
We assume that
 \begin{equation} \beta_{\rm e} \equiv \frac{8 {\rm \pi}n_0 T_{\rm e}}{B^2} \ll 1,\end{equation}
and that
 \begin{equation} \frac{B_{{\rm p}}}{B} \sim \frac{a}{R} \sim q(\psi) \sim a |\boldsymbol{\nabla} q| \sim O (1), \end{equation}
where  $B_{{\rm p}}$ is the poloidal magnetic field,
  $a$ is the plasma minor radius and
  $R$ is the plasma major radius. We take the mode's frequency
  $\omega$ to satisfy
 \begin{equation} |\omega| \sim |\omega_{{\ast} {\rm e}}| ,\end{equation}
where
 \begin{equation} \omega_{{\ast} s} = n \frac{c T_{s}}{Z_{s}e} \frac{\textrm{d} \ln n_0}{\textrm{d} \psi},\end{equation}
is the diamagnetic drift frequency of species  $s$,
$s$,  $Z_{s} e$ is the charge of species
  $s$,
$s$,  $e$ is the proton charge, and
  $c$ is the speed of light. We also assume that
 \begin{equation} k_\wedge \rho_{\rm e} \ll 1,\end{equation}
where  $\rho _{\rm e} = v_{T{\rm e}} / |\varOmega _{\rm e}|$ is the electron gyroradius, and
  $\varOmega _{s} = Z_{\rm s} eB/(m_{s} c)$ is the cyclotron frequency of species
  $s$. We note that, from (2.14), (2.20) and (2.22),
 \begin{equation} n \sim k_\wedge a \quad \mbox{and} \quad \omega_{{\ast} {\rm e}} \sim k_\wedge \rho_{\rm e} \frac{v_{T{\rm e}}}{a}.\end{equation}
2.4 Linearized gyrokinetic equation
In the limit of infinitesimal fluctuation amplitudes, the ballooning-space representation of the non-Boltzmann, gyrotropic part of the perturbed gyrokinetic distribution function  $\hat {h}_{s}$ satisfies the linearized gyrokinetic equation (Tang et al. Reference Tang, Connor and Hastie1980),
 \begin{equation} v_\parallel (\boldsymbol{b}\boldsymbol{\cdot} \boldsymbol{\nabla}\theta) \frac{\partial \hat{h}_{s}}{\partial \theta} - i(\omega - \omega_{{\rm D}s}) \hat{h}_{s} ={-}\frac{{\rm i} Z_{s} e}{T_{s}} F_{0 s} [ \omega - \varOmega_{{\ast} s}(E) ] J_0(\alpha_{s}) \left(\delta \hat{\varPhi} - \frac{v_\parallel}{c} \delta \hat{A}_\parallel\right), \end{equation}
where  $v_\parallel = \boldsymbol {v} \boldsymbol {\cdot } \boldsymbol {b}$,
 \begin{equation} \omega_{{\rm D} s}= \boldsymbol{k}_\perp \boldsymbol{\cdot} \boldsymbol{v}_{{\rm D} s},\end{equation}
is the magnetic drift frequency,
 \begin{equation} \boldsymbol{v}_{{\rm D} s} = \frac{\boldsymbol{b}}{\varOmega_s} \times \left( v_\parallel^2 \boldsymbol{b} \boldsymbol{\cdot} \boldsymbol{\nabla} \boldsymbol{b} + \frac{1}{2} v_\perp^2 \boldsymbol{\nabla} \ln B \right),\end{equation}
is the guiding-centre drift velocity,  $J_l$ denotes the Bessel function of the first kind of order
  $l$,
$l$,  $\alpha _{s} = k_\perp v_\perp /\varOmega _s$ (not to be confused with the Clebsch coordinate
  $\alpha$),
 \begin{equation} \varOmega_{{\ast} s}(E) = \omega_{{\ast} s} \left[ 1 + \eta_{s} \left( \frac{m_{s}E}{T_{s}} - \frac{3}{2} \right)\right] \end{equation}
and  $\eta _s = \textrm {d} \ln T_s /\textrm {d} \ln n_0$. In (2.25), the partial derivative
  $\partial /\partial \theta$ is taken at constant
  $\psi$,
  $\alpha$,
  $\mu$ and
  $E$, where
  $\mu = v_\perp ^2 / (2B)$, and
  $v_\perp$ is the velocity component perpendicular to
  $\boldsymbol {B}$. In writing (2.25), we neglected a term involving the parallel component of the fluctuating magnetic field, which leads to only a small correction to the MTM dispersion relation when
  $\beta _{\rm e} \ll 1$ (Applegate et al. Reference Applegate, Roach, Connor, Cowley, Dorland, Hastie and Joiner2007; Patel et al. Reference Patel, Dickinson, Roach and Wilson2022; Kennedy et al. Reference Kennedy, Giacomin, Casson, Dickinson, Hornsby, Patel and Roach2023).
2.5 Passing electrons
To determine  $\hat {h}_{\rm e}$ for passing electrons, we solve (2.25) subject to the boundary condition
 \begin{equation} \lim_{|\theta| \rightarrow \infty} \hat{h}_{\rm e}(\theta) = 0, \end{equation}
which, as noted in § 2.1, is required in order for the sum in (2.7) to converge. The unique solution for  $\mathrm {Im}\, \omega > 0$ is given by (Frieman et al. Reference Frieman, Rewoldt, Tang and Glasser1980; Tang et al. Reference Tang, Connor and Hastie1980)
 \begin{equation} \hat{h}_{{\rm e,\, passing} \pm} ={\mp} {\rm i} \xi_{\rm e} \int_{{\mp} \sigma_J \infty}^\theta {\rm d}\theta^\prime JB J_0(\alpha_{\rm e}) \left(\frac{\delta \hat{\varPhi}}{|v_\parallel|} \mp \frac{\delta \hat{A}_\parallel }{c}\right) \, {\rm e}^{ {\pm} {\rm i} \left(I_0^\theta - I_0^{\theta ^\prime}\right)}.\end{equation}
Here and in the following, the  $\pm$ sign indicates the sign of
  $v_\parallel$,
  $\sigma _J = J/|J|$,
  $J$ is the Jacobian defined following (2.16),
 \begin{equation} \xi_{s} \equiv \frac{Z_{s} e}{T_{s}} [\omega - \varOmega_{{\ast} s}(E)]F_{0 s},\end{equation}
and
 \begin{equation} I_a^b \equiv \int_a^b {\rm d}\theta \frac{JB}{|v_\parallel|}(\omega - \omega_{\rm De}) \end{equation}
is ( $-|v_\parallel |/v_\parallel$ times) the change in the MTM phase factor
  $nS - \omega t$ at the position of a passing electron as it propagates from
  $\theta =a$ to
  $\theta =b$. In (2.30) and (2.32), the
  $\theta ^\prime$ and
  $\theta$ integrals are carried out at constant
  $\psi$,
  $\alpha$,
  $E$ and
  $\mu$. In (2.30) and in the following, if a function of
  $\theta$ appears in an integral over
  $\theta ^\prime$ but the function's arguments are not listed, the function is to be evaluated at
  $\theta ^\prime$ rather than
  $\theta$. The lower limit of integration in (2.30) is chosen to ensure that
  $\hat {h}_{{\rm e} \pm } \rightarrow 0$ as
  $\theta \rightarrow \mp \sigma _J \infty$. The condition
  $\mathrm {Im}\,\omega > 0$ ensures that
  $\hat {h}_{{\rm e}\pm } \rightarrow 0$ as
  $\theta \rightarrow \pm \sigma _J \infty$ because
  $\delta \hat {\varPhi }(\theta )$ and
  $\delta \hat {A}_\parallel (\theta )$ also vanish as
  $|\theta | \rightarrow \infty$.
2.6 Leading-order parallel component of Ampere's law and its  $\theta$ derivative at $\theta \sim O (1)$


In ballooning space, the parallel component of Ampere's law is (Tang et al. Reference Tang, Connor and Hastie1980)
 \begin{equation} \frac{k_\perp^2 c}{4{\rm \pi}} \delta \hat{A}_\parallel= \delta \hat{j}_\parallel= \sum_{s} 2{\rm \pi} Z_s e \int_0^\infty {\rm d} E \int_0^{E/B} {\rm d}\mu B \left(\hat{h}_{s+} -\hat{h}_{s-}\right) J_0(\alpha_{s}).\end{equation}
We only need to evaluate (2.33) at  $\theta \sim O (1)$. The ion contribution to the parallel current can be neglected as it is
  $\sim (m_{\rm e}/m_{\rm i})^{1/2}$ times the passing-electron contribution, the ions being much slower than the electrons. The trapped-electron contribution to the parallel current can also be neglected, as we show in Appendix A. Using the solution (2.30) in (2.33) and dividing by
  $B$, we obtain
 \begin{align}
\stackrel{{\bigcirc{\kern-6pt 1}}}{\frac{k_\perp^2 c}{4{\rm \pi} B} \delta
\hat{A}_\parallel} &={-} 2{\rm \pi} {\rm i} e \int_0^\infty
{\rm d}E \int_0^{E/B_{\rm max}}{\rm d}\mu J_0(\alpha_{\rm
e}) \xi_{\rm e} \nonumber\\ &\quad
\times \left [\int_{-\infty}^\theta {\rm d}\theta^\prime |J| B
J_0(\alpha_{\rm e} )\left (-\sigma_J
\dfrac{\stackrel{{\bigcirc{\kern-8pt 2a}}}{\delta
\hat{\varPhi}}}{|v_\parallel|} +
\dfrac{\stackrel{{\bigcirc{\kern-8pt 3a}}}{\delta
\hat{A}}_{\!\!\!\parallel}}{c}\right ){\rm e}^{{\rm
i}\left(\bar{I}_0^\theta - \bar{I}_0^{\theta^\prime}\right)}\nonumber \right. \\ &\quad \left. +\int_{\theta}^\infty {\rm
d}\theta^\prime |J| B J_0(\alpha_{\rm e}) \left (\sigma_J
\dfrac{\stackrel{{\bigcirc{\kern-8pt 2b}}}{\delta
\hat{\varPhi}}}{|v_\parallel|} +
\dfrac{\stackrel{{\bigcirc{\kern-8pt 3b}}}{\delta
\hat{A}}_{\!\!\!\parallel}}{c}\right ){\rm e}^{ -{\rm i}
\left(\bar{I}_0^\theta -\bar{I}_0^{\theta^\prime}\right)} \right ],
\end{align}
\begin{align}
\stackrel{{\bigcirc{\kern-6pt 1}}}{\frac{k_\perp^2 c}{4{\rm \pi} B} \delta
\hat{A}_\parallel} &={-} 2{\rm \pi} {\rm i} e \int_0^\infty
{\rm d}E \int_0^{E/B_{\rm max}}{\rm d}\mu J_0(\alpha_{\rm
e}) \xi_{\rm e} \nonumber\\ &\quad
\times \left [\int_{-\infty}^\theta {\rm d}\theta^\prime |J| B
J_0(\alpha_{\rm e} )\left (-\sigma_J
\dfrac{\stackrel{{\bigcirc{\kern-8pt 2a}}}{\delta
\hat{\varPhi}}}{|v_\parallel|} +
\dfrac{\stackrel{{\bigcirc{\kern-8pt 3a}}}{\delta
\hat{A}}_{\!\!\!\parallel}}{c}\right ){\rm e}^{{\rm
i}\left(\bar{I}_0^\theta - \bar{I}_0^{\theta^\prime}\right)}\nonumber \right. \\ &\quad \left. +\int_{\theta}^\infty {\rm
d}\theta^\prime |J| B J_0(\alpha_{\rm e}) \left (\sigma_J
\dfrac{\stackrel{{\bigcirc{\kern-8pt 2b}}}{\delta
\hat{\varPhi}}}{|v_\parallel|} +
\dfrac{\stackrel{{\bigcirc{\kern-8pt 3b}}}{\delta
\hat{A}}_{\!\!\!\parallel}}{c}\right ){\rm e}^{ -{\rm i}
\left(\bar{I}_0^\theta -\bar{I}_0^{\theta^\prime}\right)} \right ],
\end{align}
where  $\bar {I}_a^b = \sigma _J I_a^b$,
  $B_{\rm max}$ is the maximum value of the magnetic field on the flux surface, and the upper limit of integration of the
  $\mu$ integral restricts the integral to the passing region of velocity space. The circled numbers in (2.34) are shorthand for the values of the terms underneath them after all multiplications and integrations have been carried out. In Appendix B, we will show that
 \begin{equation}
\begin{array}{c@{}} {\bigcirc{\kern-10pt 2a}} \sim {\bigcirc{\kern-10pt 2b}}
\sim \left( {\bigcirc{\kern-10pt 3a}} + {\bigcirc{\kern-10pt 3b}}\right) \\
{\bigcirc{\kern-6pt 1}} \sim \dfrac{k_\wedge \rho_{\rm e}}{\beta_{\rm
e}} \times \left({\bigcirc{\kern-10pt 3a}} +{\bigcirc{\kern-10pt 3b}}\right)
\end{array}\end{equation}
\begin{equation}
\begin{array}{c@{}} {\bigcirc{\kern-10pt 2a}} \sim {\bigcirc{\kern-10pt 2b}}
\sim \left( {\bigcirc{\kern-10pt 3a}} + {\bigcirc{\kern-10pt 3b}}\right) \\
{\bigcirc{\kern-6pt 1}} \sim \dfrac{k_\wedge \rho_{\rm e}}{\beta_{\rm
e}} \times \left({\bigcirc{\kern-10pt 3a}} +{\bigcirc{\kern-10pt 3b}}\right)
\end{array}\end{equation}
at  $\theta \sim O (1)$, a set of relations that we will use in our derivation of (2.36).
As a first step towards solving (2.34), we consider its  $\theta$ derivative. When
  $\partial / \partial \theta$ acts upon the right-hand side of (2.34), the resulting quantity is the sum of three terms. The first results from taking the
  $\theta$ derivative of
  $J_0(\alpha _\textrm {e}(\theta ))$, which is
  $\propto J_1(\alpha _\textrm {e}(\theta ))$; this term is a factor
  $\sim k_\wedge \rho _\textrm {e}$ smaller than the right-hand side of (2.34), because
  $\alpha _\textrm {e}(\theta ) \sim k_\wedge \rho _\textrm {e}$ when
  $\theta \sim O (1)$. The second term results from taking the
  $\theta$ derivative of
  $\exp (\pm \textrm {i} \bar {I}_0^{\theta })$; it follows from (2.32) that this term is a factor
  $\sim k_\wedge \rho _\textrm {e}$ smaller than the right-hand side of (2.34) when
  $\theta \sim O (1)$. The third term results from evaluating the integrands in
  ${\bigcirc{\kern-10pt 2a}}$,
  ${\bigcirc{\kern-10pt 2b}}$,
  ${\bigcirc{\kern-10pt 3a}}$ and
  ${\bigcirc{\kern-10pt 3b}}$ at the endpoints of the
  $\theta ^\prime$ integrations. The resulting
  $\delta \hat {A}_\parallel$ terms vanish identically. The resulting
  $\delta \hat {\varPhi }$ terms are a factor of
  $\sim k_\wedge \rho _\textrm {e}$ smaller than the sum of
  ${\bigcirc{\kern-10pt 2a}}$ and
  ${\bigcirc{\kern-10pt 2b}}$ because, as we will show in Appendix B, the
  $\theta ^\prime$ integrand in
  ${\bigcirc{\kern-10pt 2a}}$ has a similar magnitude throughout the interval
 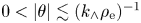 $0 < |\theta | \lesssim (k_\wedge \rho _\textrm {e})^{-1}$ before decaying at larger
  $|\theta |$, and likewise for the
  $\theta ^\prime$ integrand in
  ${\bigcirc{\kern-10pt 2b}}$. The integrands in terms
  ${\bigcirc{\kern-10pt 2a}}$ and
  ${\bigcirc{\kern-10pt 2b}}$ are therefore of order
  $\sim k_\wedge \rho _\textrm {e}$ times the integrals. To summarize, at
  $\theta \sim \mathrm { O}(1)$, the
  $\theta$ derivative of the right-hand side of (2.34) is of order
  $\sim k_\wedge \rho _\textrm {e}$ times the right-hand side of (2.34).
In contrast, taking the  $\theta$ derivative of the left-hand side of (2.34) does not change its order in
  $\beta _\textrm {e}$ and
  $k_\wedge \rho _\textrm {e}$. Hence, when we take the
  $\theta$ derivative of (2.34) and make use of (2.35), we find that the left-hand side of (2.34) becomes
  $\sim \beta _\textrm {e}^{-1}$ times larger than the right-hand side, so that, to leading order,
 \begin{equation} \frac{\partial}{\partial \theta} \left(\frac{k_\perp^2 c}{4{\rm \pi} B} \delta \hat{A}_{{\parallel} } \right) = 0,\end{equation}
where the  $\theta$ derivative is computed at constant
  $\alpha$ and
  $\psi$. Equation (2.36) is equivalent to the condition that
 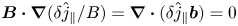 $\boldsymbol {B} \boldsymbol {\cdot } \boldsymbol {\nabla } (\delta \hat {j}_{\parallel } / B) = \boldsymbol {\nabla } \boldsymbol {\cdot } (\delta \hat {j}_{\parallel } \boldsymbol {b}) = 0$. Upon integration, (2.36) yields
 \begin{equation} \delta \hat{A}_{{\parallel}} = C_1 \frac{4{\rm \pi} B}{k_\perp^2 c},\end{equation}
where  $C_1$ is a function of
  $\psi$, but not of
  $\theta$ (cf. Hamed et al. Reference Hamed, Muraglia, Camenen, Garbet and Agullo2019).
Equations (2.13) and (2.37) imply that  $\delta \hat {A}_{\parallel } \propto \theta ^{-2}$ at large
  $|\theta |$; i.e.
  $\delta \hat {A}_{\parallel }$ is effectively localized near
  $\theta \sim O (1)$, as mentioned previously. Therefore, the dominant contributions to the
  $\theta ^\prime$-integrals of
  $\delta \hat{A}_{{\parallel}}(\theta ^\prime)$ appearing in (2.34) arise from
  $|\theta ^\prime | \sim O (1)$, where
  $\exp ( \pm \textrm {i} \bar {I}_0^{\theta ^\prime })$ and
  $J_0(\alpha _\textrm {e}(\theta ^\prime ))$ are both
  $\simeq 1$, and, to leading order in
  $\beta _\textrm {e}$ and
  $k_\wedge \rho _\textrm {e}$,
 \begin{equation} \int_{-\infty}^\theta {\rm d} \theta^\prime |J|BJ_0(\alpha_{\rm e}) \frac{\delta \hat{A}_{{\parallel} }}{c} \, {\rm e}^{ - {\rm i} \bar{I}_0^{\theta^\prime}} + \int_{\theta}^\infty {\rm d} \theta^\prime |J|BJ_0(\alpha_{\rm e}) \frac{\delta \hat{A}_{{\parallel} }}{c} \,{\rm e}^{ {\rm i} \bar{I}_0^{\theta^\prime}} = \frac{1}{c} \int_{-\infty}^\infty{\rm d}\theta^\prime |J| B \delta \hat{A}_{{\parallel}}, \end{equation}
which is independent of  $E$ and
  $\mu$. When
  $|\theta | \sim O (1)$,
  $\exp ( \pm \textrm {i} \bar {I}_0^{\theta })$ and
  $J_0(\alpha _\textrm {e}(\theta ))$ equal unity plus small corrections, and, to leading order in
  $\beta _\textrm {e}$ and
  $k_\wedge \rho _\textrm {e}$, (2.34) becomes
 \begin{equation} \omega - \omega_0 + {\rm i} {\rm \pi}^{1/2} \left(\frac{v_{T{\rm e}}}{L}+ \frac{\omega^2 B_{\rm max}}{2 v_{T{\rm e}}} \int_{-\infty}^\infty \textrm{d} \theta |J| \varGamma \delta \tilde{\varPhi} \right) = 0,\end{equation}
where
 $$\begin{gather} \omega_0 = \omega_{{\ast} {\rm e}}\left(1 + \frac{\eta_{\rm e}}{2}\right), \quad L = \int_{-\infty}^\infty {\rm d}\theta \frac{|J| B^2\beta_{\rm e}}{B_{\rm max}(k_\perp \rho_{\rm e})^2}, \end{gather}$$
 $$\begin{gather} \varGamma(\theta) = \mathrm{sgn}(\theta) \int_{\rm passing} {\rm d}^3 v \frac{F_{0{\rm e}}}{n_0} \left[\frac{\omega - \varOmega_{{\ast} {\rm e}}(E)}{\omega}\right] J_0(\alpha_{\rm e})\, {\rm e}^{ {\rm i}\, \mathrm{sgn}(\theta) \bar{I}_0^\theta}, \end{gather}$$
 $\int _\textrm {passing} \textrm {d}^3 v$ is an integral over the part of velocity space corresponding to passing particles,
 \begin{equation} \delta \tilde{\varPhi} = \frac{\delta \hat{\varPhi}}{\hat{\psi}_{{\parallel},\infty}},\end{equation}
and
 \begin{equation} \hat{\psi}_{{\parallel}, \infty} = \frac{{\rm i}\omega}{2c}\int_{-\infty}^\infty {\rm d}\theta J B \delta \hat{A}_{{\parallel}}.\end{equation}
In writing (2.42), we have invoked (2.16), which guarantees that  $\hat {\psi }_{\parallel, \infty }$ is non-vanishing. We note that (2.13) and (2.20) imply that
 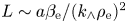 $L \sim a \beta _\textrm {e}/ (k_\wedge \rho _\textrm {e})^2$. In the next section, we will show how to determine
  $\delta \tilde {\varPhi }(\theta )$ for any given value of
  $\omega$; i.e. how to solve for the function
  $\delta \tilde {\varPhi }(\theta, \omega )$. With that solution, (2.39) will become the MTM dispersion relation, which we will solve using Newton's method in § 3.
2.7 Quasineutrality: determining $\delta \hat {\varPhi }_0$ at $|\theta | \gg 1$


In ballooning space, the quasineutrality condition is (Tang et al. Reference Tang, Connor and Hastie1980)
 \begin{equation} 0 ={-}\sum_{s}\frac{n_0 Z_{s}^2 e^2}{T_{s}}\delta \hat{\varPhi} + \sum_{s} 2{\rm \pi} Z_{s} e \int_0^\infty {\rm d}E \int_0^{E/B} {\rm d}\mu \frac{B}{|v_\parallel|}\left(\hat{h}_{s+} + \hat{h}_{s-}\right) J_0(\alpha_{s}),\end{equation}
where the first term on the right-hand side of (2.44) is the Boltzmann response. Our goal in this section is to use (2.44) to determine  $\delta \hat {\varPhi }(\theta )$ for any given value of
  $\omega$ so that we can evaluate the
  $\theta$ integral in (2.39). As shown in Appendix B, this integral is dominated by
 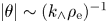 $|\theta |\sim (k_\wedge \rho _\textrm {e})^{-1}$. The contribution from
  $\hat {h}_\textrm {i}$ to (2.44) at such large values of
  $|\theta |$ is much smaller than the ion Boltzmann term because of gyroaveraging: at
  $\theta \sim (k_\wedge \rho _\textrm {e})^{-1}$,
  $\alpha _\textrm {i} \sim (m_\textrm {i}/m_\textrm {e})^{1/2}$ and
  $J_0(\alpha _\textrm {i})\ll 1$. With the aid of (2.30), we obtain
 \begin{align} \left(\hat{h}_{{\rm e}+} + \hat{h}_{{\rm e}-}\right)_{\rm passing} &= {\rm i} \xi_{\rm e}\left[ \int_{-\infty}^\theta {\rm d} \theta^\prime |J| B J_0(\alpha_{\rm e}) \left(-\frac{\delta \hat{\varPhi}}{|v_\parallel|} + \sigma_{J} \frac{\delta \hat{A}_\parallel}{c} \right) {\rm e}^{{\rm i} \bar{I}_0^\theta - {\rm i} \bar{I}_0^{\theta^\prime}} \right.\nonumber\\ & \quad - \left. \int_{\theta}^\infty {\rm d} \theta^\prime |J| B J_0(\alpha_{\rm e}) \left( \frac{\delta \hat{\varPhi}}{|v_\parallel|} + \sigma_{J} \frac{\delta \hat{A}_\parallel}{c} \right) {\rm e}^{-{\rm i} \bar{I}_0^\theta + {\rm i} \bar{I}_0^{\theta^\prime}} \right]. \end{align}
Upon substituting (2.45) into (2.44), neglecting  $\hat {h}_\textrm {i}$ and making use of the results in Appendix A for the value of
  $\hat {h}_\textrm {e}$ for trapped electrons, we find that
 \begin{equation} \delta \tilde{\varPhi}(\theta) + \int_{-\infty}^\infty {\rm d}\theta^\prime W_{{\rm p}} ( \theta, \theta^\prime) \delta \tilde{\varPhi}(\theta^\prime) + \int_{{\rm \pi}(2j-1)}^{{\rm \pi} (2j + 1)} {\rm d}\theta^\prime W_{\rm tr}(\theta, \theta^\prime) \delta \tilde{\varPhi}(\theta^\prime) = \frac{\tau \varGamma(\theta)}{1 + \tau},\end{equation}
where  $\tau = T_\textrm {i}/T_\textrm {e}$,
  $j$ is the largest integer such that
  ${\rm \pi} (2j-1)<\theta$ (we assume that
  $B$ attains its maximum value at
  $\theta ={\rm \pi}$),
 $$\begin{gather} W_{{\rm p}}( \theta, \theta^\prime) = \frac{2 {\rm \pi}{\rm i} \tau}{1+\tau}| J(\theta^\prime)| \int_0^\infty {\rm d}E\, Q(E) \int_0^{E/B_{\rm max}} {\rm d}\mu\, g_+(\theta_{>}, E, \mu) g_-( \theta_{<}, E, \mu), \end{gather}$$
 $$\begin{gather}W_{\rm tr}(\theta, \theta^\prime) ={-} \frac{4{\rm \pi} \tau}{1 + \tau} |J(\theta^\prime)| \int_0^\infty {\rm d}E\, Q(E) \int_{E/B_{\rm max}}^{\mu_{\rm max}(\theta, \theta^\prime)} {\rm d}\mu \frac{g_{\rm tr}(\theta, E, \mu) g_{\rm tr}(\theta^\prime, E, \mu)}{\langle \omega - \omega_{\rm De}\rangle_{{\rm b}} \tau_{{\rm b}}}, \end{gather}$$
 $$\begin{gather}Q( E) = \frac{F_{0{\rm e}}}{n_0}[ \omega - \varOmega_{{\ast} {\rm e}}(E)], \end{gather}$$
 $$\begin{gather}g_\pm ( \theta, E, \mu) = \frac{B J_0(\alpha_{\rm e} ) e^{{\pm} {\rm i} \bar{I}_0^\theta} }{|v_\parallel|}, \quad g_{\rm tr}(\theta, E, \mu) = \frac{B J_0(\alpha_{\rm e})}{|v_\parallel|} \cos\left(\frac{n q^\prime(\psi) I(\psi) |v_\parallel|\theta}{\varOmega_{\rm e}} \right), \end{gather}$$
 $\mu _\textrm {max}(\theta, \theta ^\prime ) = \textrm {min}[E/B(\theta ), E/B(\theta ^\prime )]$,
  $\theta _> = \max (\theta, \theta ^\prime )$,
  $\theta _< = \min (\theta, \theta ^\prime )$ and
  $\langle \cdots \rangle _{{\rm b}}$ and
  $\tau _{{\rm b}}$ are, respectively, the bounce average and bounce time defined in (A 7a,b). Equation (2.46) can be solved numerically by discretizing the integral over
  $\theta ^\prime$, which converts (2.46) into a matrix equation for
  $\delta \tilde {\varPhi }$. We present examples of such solutions in Section 3.Footnote 3
We note that (2.39) and (2.46) can be combined into a single eigenvalue equation for  $\delta \hat {\varPhi }$ and
  $\omega$ by multiplying both equations by
  $\hat {\psi }_{\parallel, \infty }$, using (2.39) to solve for
  $\hat {\psi }_{\parallel, \infty }$ and substituting that value into (2.46) to obtain
 \begin{equation} \delta \hat{\varPhi}(\theta) + \int_{-\infty}^\infty {\rm d}\theta^\prime\, \bar{W}_{{\rm p}} ( \theta, \theta^\prime) \delta \hat{\varPhi}(\theta^\prime) + \int_{{\rm \pi}(2j-1)}^{{\rm \pi} (2j + 1)} {\rm d}\theta^\prime W_{\rm tr}(\theta, \theta^\prime) \delta \hat{\varPhi}(\theta^\prime) = 0,\end{equation}
where
 \begin{equation} \bar{W}_{{\rm p}}(\theta, \theta^\prime) = W_{{\rm p}}(\theta, \theta^\prime) + \frac{ {\rm i} {\rm \pi}^{1/2} B_{\rm max} \tau \omega^2 |J(\theta^\prime)| \varGamma(\theta) \varGamma(\theta^\prime)}{2 v_{T{\rm e}} (1 + \tau)(\omega - \omega_0 + {\rm i} {\rm \pi}^{1/2} v_{T{\rm e}}/L)}. \end{equation}
Although (2.51) could be used to determine  $\omega$, in this work we obtain the MTM dispersion relation from (2.39) and (2.46).
2.8 Maximum unstable binormal wavenumber
Given the scaling estimates in Appendix B, the first term ( $\omega$), second term (
 $\omega _0$) and fourth term (containing
  $\delta \tilde {\varPhi }$) in (2.39) are all comparable, and the ratio of the third term (
 $\textrm {i} {\rm \pi}^{1/2} v_{T\textrm {e}}/L$) to these other terms is
  $k_\wedge \rho _\textrm {e} / \beta _\textrm {e}$. These estimates also follow from (2.35) upon noting that the
  $\textrm {i} {\rm \pi}^{1/2} v_{T\textrm {e}}/L$ term in (2.39) comes from term
  ${\bigcirc{\kern-6pt 1}}$ in (2.34), the
  $\omega$ and
  $\omega _0$ terms come from the sum of terms
  ${\bigcirc{\kern-10pt 3a}}$ and
  ${\bigcirc{\kern-10pt 3b}}$ in (2.34) and the term containing
  $\delta \tilde {\varPhi }$ in (2.39) comes from the sum of terms
  ${\bigcirc{\kern-10pt 2a}}$ and
  ${\bigcirc{\kern-10pt 2b}}$ in (2.34). As the
  $\textrm {i} {\rm \pi}^{1/2} v_{T\textrm {e}}/L$ term in (2.39) is always stabilizing, the MTM can only be unstable if (cf. Hardman et al. Reference Hardman, Parra, Patel, Roach, Ruiz Ruiz, Barnes, Dickinson, Dorland, Parisi, St-Onge and Wilson2023)
 \begin{equation} k_\wedge \rho_{\rm e} \lesssim \beta_{\rm e}.\end{equation}
2.9 The limit of long wavelength and cold ions
In this section, we specialize our results to the limit in which
 \begin{equation} \frac{T_{\rm i}}{T_{\rm e}} \sim \frac{k_\wedge \rho_{\rm e}}{\beta_{\rm e} } \ll 1.\end{equation}
As  $W_{{\rm p}}(\theta, \theta ^\prime )$ and
  $W_\textrm {tr}(\theta, \theta ^\prime )$ are
  $\propto \tau$ when
  $\tau \equiv T_\textrm {i}/T_\textrm {e}\ll 1$, the approximate magnitudes of
  $W_{{\rm p}}(\theta, \theta ^\prime )$ and
  $W_\textrm {tr}(\theta, \theta ^\prime )$ in the cold-ion limit are the same as estimated in Appendix B, only multiplied by
  $\tau$. To leading order in
  $\tau$, (2.46) thus yields
 \begin{equation} \delta \tilde{\varPhi} = \tau \varGamma.\end{equation}
Upon substituting (2.55) into (2.39) and defining  $\omega _\textrm {r}$ and
  $\gamma$ to be the real and imaginary parts of
  $\omega$, respectively, we find that, to leading order in
  $\tau$,
 \begin{equation} \omega_{\rm r} = \omega_0,\end{equation}
and
 \begin{equation} \gamma ={-} {\rm \pi}^{1/2} \left[ \frac{v_{T{\rm e}}}{L} + \frac{\tau \omega_0^2 B_{\rm max}}{2 v_{T{\rm e}}} \int_{-\infty}^\infty \textrm{d} \theta |J| {\rm Re}(\varGamma^2)_{\omega \rightarrow \omega_0} \right], \end{equation}
where the subscript ‘ $\omega \rightarrow \omega _0$’ means that
  $\omega$ is replaced with
  $\omega _0$ in (2.32) and (2.41) when the subscripted quantity (
 $\varGamma^{2}$) is evaluated.
2.10 The limit of long wavelength and zero temperature gradient
In this section, we assume that
 \begin{equation} k_\wedge \rho_{\rm e} \ll \beta_{\rm e}, \quad \eta_{\rm e} = 0. \end{equation}
When  $k_\wedge \rho _\textrm {e} \ll \beta _\textrm {e}$, we can drop the
  $\textrm {i}{\rm \pi} ^{1/2} v_{T\textrm {e}}/L$ term in (2.39), and when
  $\eta _\textrm {e}= 0$,
  $\varOmega _{\ast \textrm {e}}(E) = \omega _{\ast \textrm {e}}$. Equation (2.39) then has the solution
  $\omega = \omega _{\ast \textrm {e}}$, and for this solution
  $\omega - \varOmega _{\ast \textrm {e}}(E)$,
  $\varGamma (\theta )$,
  $W_{{\rm p}}(\theta, \theta ^\prime )$,
  $W_\textrm {tr}(\theta, \theta ^\prime )$ and
  $\delta \varPhi (\theta )$ all vanish. The stability of the MTM at
  $k_\wedge \rho _\textrm {e} \ll \beta _\textrm {e}$ when
  $\eta _\textrm {e}=0$ implies that the MTM at
  $k_\wedge \rho _\textrm {e} \ll \beta _\textrm {e}$ is driven by the electron temperature gradient and not by the density gradient.
3 Numerical examples
We consider a Miller–Mercier–Luc model (Mercier & Luc Reference Mercier and Luc1974; Miller et al. Reference Miller, Chu, Greene, Lin-Liu and Waltz1998) of a local Grad–Shafranov equilibrium with parameters taken from table 2 of Patel et al. (Reference Patel, Dickinson, Roach and Wilson2022), except for the electron collision frequency  $\nu _\textrm {e}$, which we set equal to zero. These parameters were chosen to model a flux surface in the core of the proposed STEP spherical tokamak (Wilson et al. Reference Wilson, Chapman, Denton, Morris, Patel, Voss and Waldon2020). We plot the shape of this flux surface and the
  $\theta$ profiles of the poloidal and total magnetic-field strengths on this surface in figure 2. Throughout this section, we take
  $\theta$ to be the particular poloidal angle used by Miller et al. (Reference Miller, Chu, Greene, Lin-Liu and Waltz1998). The linear average of
  $\beta _\textrm {e}$ around the flux-surface contour in the poloidal plane in this equilibrium is
 \begin{equation} \beta_{\rm e,\, av} = 0.125.\end{equation}
Panels (a–c) show, respectively, the shape of the flux surface about which the local Grad–Shafranov equilibrium is calculated in § 3, the strength of the poloidal magnetic field  $B_{{\rm p}}$ on this flux surface as a function of the poloidal angle
  $\theta$ and the strength of the total magnetic field
  $B$ on this flux surface as a function of
  $\theta$.

To obtain the MTM dispersion relation for this equilibrium, we solve (2.39) using Newton's method. At each step in Newton's method, we need to determine  $\delta \tilde {\varPhi }$ in (2.39) for some assumed value of
  $\omega$. To do so, we discretize in
  $\theta$, which converts (2.46) into a matrix equation for
  $\delta \tilde {\varPhi }$. When we solve this matrix equation, we first compute
  $\bar {I}_0^\theta = \sigma _J I_0^\theta$ from (2.32) on a
  $\theta$ grid with 512 uniformly spaced grid points per
  $2{\rm \pi}$ increment in
  $\theta$. We evaluate all integrals over
  $\theta$,
  $E$ and
  $\mu$ using the trapezoid rule. We evaluate
  $\bar {I}_0^\theta$ and all other functions of
  $E$ and
  $\mu$ on a grid of 64 uniformly spaced grid points along the velocity (
 $v$) axis ranging from
  $0.1 v_{T\textrm {e}}$ to
  $6 v_{T\textrm {e}}$ and, at each
  $v$, 64 evenly spaced grid points in
  $\mu$ within the passing region of velocity space and another 64 evenly spaced grid points in
  $\mu$ within the trapped region of velocity space. We evaluate
  $\varGamma ( \theta )$,
  $W_{{\rm p}}(\theta, \theta ^\prime )$,
  $W_\textrm {tr}(\theta, \theta ^\prime )$ and
  $\delta \tilde {\varPhi }$ on a coarser
  $\theta$ grid with only 32 points per
  $2{\rm \pi}$ increment in
  $\theta$. We adjust the total width of the
  $\theta$ grid as we vary
  $n$ to ensure that
  $\delta \hat {\varPhi }$ decays to small values before the edge of the grid is reached. In all the examples in this section, we set
  $\theta _0 = 0$.
In figure 3, we plot the real and imaginary parts of  $\omega$, denoted by
  $\omega _\textrm {r}$ and
  $\gamma$, respectively, for seven values of
  $n$: 25, 50, 100, 200, 400, 800 and 1060. At
  $n< 800$,
  $\omega _\textrm {r}$ lies between the cold-ion MTM frequency
 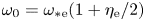 $\omega _0 = \omega _{\ast \textrm {e}}(1 + \eta _\textrm {e}/2)$ and the magnetic-drift-wave frequency that follows from (1.2) and (2.14), which is
  $\omega _\textrm {mdw} = \boldsymbol {k}_\perp \boldsymbol {\cdot } \boldsymbol {v}_{\ast \textrm {e}} = \omega _{\ast \textrm {e}}(1+ \eta _\textrm {e})$, where the electron diamagnetic drift velocity
  $\boldsymbol {v}_{\ast \textrm {e}}$ is defined below (1.2). The MTM frequency differs from
  $\omega _\textrm {mdw}$ because (1.2) is the fluid-theory requirement for avoiding infinite current in a perfectly conducting plasma with massless electrons, whereas (2.39) is the gyrokinetic statement of the parallel component of Ampere's law, which accounts for the finite values of the current and electron mass, the current produced by
  $\delta \hat {\varPhi }$, and how an electron's response to the fluctuating fields depends upon the electron's velocity. Nevertheless, the approximate equality
  $\omega \simeq \omega _\textrm {mdw}$ indicates that the MTM phase velocity is approximately
  $\boldsymbol {v}_{\ast \textrm {e}}$ and that the MTM approximates the force balance that arises in a fluid-theory magnetic drift wave. Across these same
  $n$ values (
 $n< 800$), the MTM growth rate is approximately 1/6 to 1/5 of
  $\omega _\textrm {r}$. However, as
  $n$ increases above 800,
  $k_\wedge$ approaches the approximate maximum unstable binormal wavenumber
  $\beta _\textrm {e}/\rho _\textrm {e}$ given in (2.53), and
  $\gamma$ drops sharply.
The real and imaginary parts of the MTM frequency ( $\omega _\textrm {r}$ and
  $\gamma$, respectively) as a function of the toroidal mode number
  $n$ (top
  $x$ axis) and
  $k_\wedge \rho _\textrm {e}|_{\theta =0}$ (bottom
  $x$ axis), where
  $k_\wedge$ is the binormal wavenumber defined in (2.14). Frequencies are given in units of
  $v_{T\textrm {e}}/a$, where
  $a$ is the plasma minor radius. The dotted line is a plot of
  $\omega _0$, which is defined in (2.40a,b), and the dash–dotted line is a plot of the magnetic-drift-wave frequency
  $\omega _\textrm {mdw} = \omega _{\ast \textrm {e}}(1+ \eta _\textrm {e})$ that follows from (1.2). The vertical dashed line shows the approximate instability threshold
  $k_\wedge \rho _\textrm {e} \lesssim \beta _\textrm {e}$ from (2.53), where we have set
  $\beta _\textrm {e}$ equal to the value in (3.1). As in all the numerical examples in this paper, we have set the ballooning angle
  $\theta _0$ equal to zero.

In figure 4, we plot  $\delta \hat {A}_\parallel$ from (2.37). We note that the
  $\theta$ profile of
  $\delta \hat {A}_\parallel$ in (2.37) is independent of
  $n$, and thus this same profile applies to all of the data points in figure 3.
The parallel component of the fluctuating vector potential  $\delta \hat {A}_\parallel (\theta )$ from (2.37) normalized to its value at
  $\theta =0$ when the ballooning angle
  $\theta _0$ is zero. The
  $\theta$ profile of
  $\delta \hat {A}_\parallel (\theta )$ that follows from (2.37) is independent of
  $n$.
$n$.

In figure 5, we plot  $\delta \hat {\varPhi }$ for
  $n=25$, 50, 100, 200 and 400, with
  $n$ increasing from the top row to the bottom row. As
  $n$ increases, the width
  ${\rm \Delta} \theta$ of the
  $\delta \hat {\varPhi }$ eigenfunction decreases, in agreement with the estimate in § 2 that
 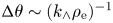 ${\rm \Delta} \theta \sim (k_\wedge \rho _\textrm {e})^{-1}$. Aside from the decrease in
  ${\rm \Delta} \theta$, the qualitative shape of the
  $\delta \hat {\varPhi }(\theta )$ eigenfunction and the value of
  $\gamma /\omega _\textrm {r}$ remain similar as
  $n$ ranges from
  $25$ to
  $400$, even though this range of
  $n$ corresponds to
  $k_\wedge \rho _\textrm {i}$ values ranging from less than 1 to greater than 1, where
  $\rho _\textrm {i}$ is the ion gyroradius. This latter point is consistent with the analysis of § 2, in which the ions play no particular role in the MTM other than via their Boltzmann response.
The real (a,c,e,g,i) and imaginary (b,d,f,h,j) parts of the normalized fluctuating electrostatic potential 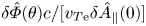 $\delta \hat {\varPhi }(\theta ) c /[v_{T\textrm {e}} \delta \hat {A}_{\parallel }(0)]$ when
  $\theta _0=0$. From top to bottom, the five rows correspond to the toroidal mode numbers 25, 50, 100, 200 and 400, respectively, which can be converted to
  $k_\wedge \rho _\textrm {e}$ values by comparing the upper and lower horizontal axes in figure 3.

Although we have retained the trapped-electron  $\hat {h}_\textrm {e}$ terms in our analysis, they have only a modest effect on the MTM growth rate for the spherical-tokamak equilibrium that we investigated in § 3. For example, these terms increase
  $\gamma$ by
  $\simeq 10\,\%$ for the
  $n=50$ data point in figure 3 and by
  $\simeq 0.6\,\%$ for the
  $n=400$ data point.
4 Conclusion
In this paper, we have derived the collisionless gyrokinetic MTM dispersion relation, which is given by (2.39),
 \begin{equation} \omega - \omega_0 + {\rm i} {\rm \pi}^{1/2} \left(\frac{v_{T{\rm e}}}{L}+ \frac{\omega^2 B_{\rm max}}{2 v_{T{\rm e}}} \int_{-\infty}^\infty \textrm{d} \theta |J| \varGamma \delta \tilde{\varPhi} \right) = 0,\end{equation}
supplemented by the quasineutrality condition, (2.46), which determines the function  $\delta \tilde {\varPhi }(\theta,\omega )$. In agreement with past studies, we find that the MTM is driven unstable by the electron temperature gradient rather than by the density gradient (§ 2.10), and that the MTM instability mechanism requires the electrostatic potential fluctuation to be present: when the term containing
  $\delta \tilde {\varPhi }$ in (4.1) is neglected, the imaginary part of
  $\omega$ is strictly negative. The instability mechanism also depends on magnetic drifts in a way that is quantified by the
  $\bar {I}_0^\theta$ terms in (2.39), (2.41) and (2.46) through (2.50a,b).
As discussed in § 2.6, (4.1) is just the parallel component of Ampere's law evaluated at  $\theta =0$. Upon multiplication by
  $C_2 = \sigma _J n_0 e^2 B v_{T\textrm {e}}\hat {\psi }_{\parallel, \infty } / ({\rm \pi} ^{1/2} T_\textrm {e} B_\textrm {max} \omega )$, (4.1) becomes
 \begin{equation} \delta \hat{j}_{\delta E_\parallel} + \delta \hat{j}_{\delta B_\psi} - \delta \hat{j}_{\rm net} + \delta \hat{j}_{\delta \varPhi}= 0,\end{equation}
where  $\delta \hat {j}_{\delta E_\parallel }= C_2 \omega$ is the parallel current density at
  $\theta =0$ produced by the inductive parallel electric field
  $i c^{-1} \omega \delta \hat {A}_\parallel$,
 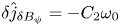 $\delta \hat {j}_{\delta B_\psi } = - C_2 \omega _0$ is the parallel current density at
  $\theta =0$ produced by
  $\delta \hat {B}_\psi = \delta \hat {\boldsymbol {B}} \boldsymbol {\cdot } \boldsymbol {\nabla } \psi / |\boldsymbol {\nabla } \psi | = - \textrm {i} k_\wedge \delta \hat {A}_\parallel$ (i.e. by electrons streaming along perturbed magnetic-field lines that wander across the equilibrium flux surfaces),
  $\delta \hat {j}_\textrm {net}$ is the net parallel current density at
  $\theta =0$ (which is given by
 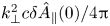 $k_\perp ^2 c \delta \hat {A}_\parallel (0) / 4{\rm \pi}$, or, equivalently,
  $-C_2$ times the term proportional to
  $1/L$ in (4.1)), and
  $\delta \hat {j}_{\delta \varPhi }$ is
  $C_2$ times the term proportional to
  $\delta \tilde {\varPhi }$ in (4.1), or, equivalently, the parallel current density at
  $\theta =0$ produced by
  $\delta \hat {\varPhi }$, the nature of which is discussed at the end of § 1.5. Figure 3 shows that
  $\omega _\textrm {r} \simeq \omega _0$ and
  $\gamma /\omega _\textrm {r} \lesssim 1/5$ for MTMs at
  $k_\wedge \rho _\textrm {e} \ll \beta _\textrm {e}$ in the spherical-tokamak equilibrium considered in § 3, which implies that the
  $\delta \tilde {\varPhi }$ term in (4.1) is significantly smaller than the
  $\omega$ and
  $\omega _0$ terms, and hence that
  $\delta \hat {j}_{\delta \varPhi }$ is significantly smaller than the current densities
  $\delta \hat {j}_{\delta E_\parallel }$ and
  $\delta \hat {j}_{\delta B_\psi }$ that result from
  $\delta \hat {A}_\parallel$. The MTMs in § 3 at
  $k_\wedge \rho _\textrm {e} \ll \beta _\textrm {e}$ are thus basically magnetic drift waves (with
 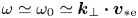 $\omega \simeq \omega _0 \simeq \boldsymbol {k}_\perp \boldsymbol {\cdot } \boldsymbol {v}_{\ast \textrm {e}}$ — see § 1.1 and the discussion of figure 3 in § 3) that are driven weakly unstable (
 $\gamma \ll \omega _\textrm {r}$) by the electron temperature gradient via
  $\delta \hat {\varPhi }$.
The analogy to the magnetic drift wave suggests the following heuristic way of thinking about how the MTM frequency is determined. In the case of the magnetic drift wave (§ 1.1),  $\omega$ is fixed by requiring that the force from the inductive parallel electric field
  $\textrm {i} c^{-1} \omega \delta \hat {A}_\parallel$ cancel out the component of the electron pressure force parallel to the total magnetic field
  $\boldsymbol {B} + \delta \boldsymbol {B}$ in order to avoid unphysically large currents. Analogously, in the case of the MTM,
  $\omega$ is determined by requiring that
  $\delta \hat {j}_{\delta E_\parallel }$ offset any difference between
  $\delta \hat {j}_\textrm {net}$ and
  $\delta \hat {j}_{\delta B_\psi } + \delta \hat {j}_{\delta \varPhi }$. In an approximate sense (with corrections of order
  $\delta \hat {j}_{\delta \varPhi }/\delta \hat {j}_{\delta B_\psi }$), the real part of
  $\omega$ is determined by the condition that the
  $C_2 \omega _\textrm {r}$ part of
  $\delta \hat {j}_{\delta E_\parallel }$ cancel
  $\delta \hat {j}_{\delta B_\psi }$, which is always
  $90^\circ$ out of phase with
  $\delta \hat {j}_\textrm {net}$. This first condition is very similar to the force balance that arises in the magnetic drift wave and is the reason that the MTM propagates at approximately the electron diamagnetic drift velocity
  $\boldsymbol {v}_{\ast \textrm {e}}$. The MTM growth rate is then determined by the condition that the
  $C_2 \times \textrm {i} \gamma$ part of
  $\delta \hat {j}_{\delta E_\parallel }$ match the difference between
  $\delta \hat {j}_\textrm {net}$ and the part of
  $\delta \hat {j}_{\delta \varPhi }$ that is in phase with
  $\delta \hat {j}_\textrm {net}$.
There is some tension between the numerical examples presented in § 3 and previous studies that suggest that  $\gamma \rightarrow 0$ as
  $\nu _\textrm {e} \rightarrow 0$ when
  $k_\wedge \rho _\textrm {i} < 1$ (Applegate et al. Reference Applegate, Roach, Connor, Cowley, Dorland, Hastie and Joiner2007; Guttenfelder et al. Reference Guttenfelder, Candy, Kaye, Nevins, Bell, Hammett, LeBlanc and Yuh2012a; Patel et al. Reference Patel, Dickinson, Roach and Wilson2022), and further work is needed to clarify the extent of, and reasons for, this discrepancy. Other potentially fruitful directions for future research include applying the results of this paper to other tokamak equilibria and stellarator equilibria and generalizing the analysis to account for collisions.
Acknowledgements
We thank I. Abel, T. Adkins, M. Barnes, E. Chandran, S. Cowley, B. Dorland, M. Hardman, P. Helander, D. Kennedy, N. Loureiro, F. Parra, B. Patel and Y. Zhang for helpful discussions. B.C. thanks Merton College and the Rudolf Peierls Centre for Theoretical Physics for their hospitality throughout his month-long visit to the University of Oxford in 2022, when this research project was initiated.
Editor W. Dorland thanks the referees for their advice in evaluating this article.
Funding
The work of A.A.S. was supported in part by the UK EPSRC grant EP/R034737/1 and by the Simons Foundation via a Simons Investigator award.
Declaration of interest
The authors report no conflict of interest.
Appendix A. Trapped electrons
To determine  $\hat {h}_{\textrm {e}\pm }$ for trapped electrons, we integrate (2.25) for both
  $\hat {h}_{\textrm {e}+}$ and
  $\hat {h}_{\textrm {e} -}$ from
  $\theta$ to the nearest bounce points surrounding
  $\theta$, denoted
  $\theta _1$ and
  $\theta _2$, with
  $\theta _1 < \theta < \theta _2$. This yields four equations for the six unknowns
  $\hat {h}_{\textrm {e}+}(\theta )$,
  $\hat {h}_{\textrm {e}-}(\theta )$,
  $\hat {h}_{\textrm {e}+}(\theta _1)$,
  $\hat {h}_{\textrm {e}-}(\theta _1)$,
  $\hat {h}_{\textrm {e}+}(\theta _2)$ and
  $\hat {h}_{\textrm {e}-}(\theta _2)$. We eliminate two of these six unknowns,
  $\hat {h}_{\textrm {e}+}(\theta _2)$, and
  $\hat {h}_{\textrm {e}-}(\theta _2)$, by imposing the trapped-particle boundary conditions
 \begin{equation} \hat{h}_{{\rm e} +}(\theta_1) = \hat{h}_{{\rm e} -}(\theta_1) \quad \hat{h}_{{\rm e} +}(\theta_2) = \hat{h}_{{\rm e} -}(\theta_2),\end{equation}
leaving a system of four equations in four unknowns. Two subtractions (of one equation from another) eliminate  $\hat {h}_{\textrm {e}+}(\theta _1)$ and
  $\hat {h}_{\textrm {e}-}(\theta _1)$, leaving a system of two linear equations in the two unknowns
  $\hat {h}_{\textrm {e}+}(\theta )$ and
  $\hat {h}_{\textrm {e}-}(\theta )$, whose solutions can be combined to yield
 \begin{align} \frac{1}{2} \left[
\hat{h}_{{\rm e} +}(\theta) + \hat{h}_{{\rm e}
-}(\theta)\right]_{\rm tr} &= \frac{\xi_{\rm e}}{\sin
I_{\theta_1}^{\theta_2}} \left[ \int_{\theta_1}^\theta
\textrm{d}\theta^\prime \frac{JB}{|v_\parallel|}\Big( \sigma_1
\cos I_{\theta_1}^{\theta^\prime} \cos I_{\theta_2}^\theta
+ {\rm i}\sigma_2 \sin I_{\theta_1}^{\theta^\prime} \cos
I_{\theta_2}^\theta\Big)\right. \nonumber\\ &\quad +\left.
\int_\theta^{\theta_2} \textrm{d} \theta^\prime
\frac{JB}{|v_\parallel|} \Big( \sigma_1 \cos
I_{\theta_2}^{\theta^\prime} \cos I_{\theta_1}^\theta +
{\rm i}\sigma_2 \sin I_{\theta_2}^{\theta^\prime} \cos
I_{\theta_1}^\theta\Big)\right],
\end{align}
\begin{align} \frac{1}{2} \left[
\hat{h}_{{\rm e} +}(\theta) + \hat{h}_{{\rm e}
-}(\theta)\right]_{\rm tr} &= \frac{\xi_{\rm e}}{\sin
I_{\theta_1}^{\theta_2}} \left[ \int_{\theta_1}^\theta
\textrm{d}\theta^\prime \frac{JB}{|v_\parallel|}\Big( \sigma_1
\cos I_{\theta_1}^{\theta^\prime} \cos I_{\theta_2}^\theta
+ {\rm i}\sigma_2 \sin I_{\theta_1}^{\theta^\prime} \cos
I_{\theta_2}^\theta\Big)\right. \nonumber\\ &\quad +\left.
\int_\theta^{\theta_2} \textrm{d} \theta^\prime
\frac{JB}{|v_\parallel|} \Big( \sigma_1 \cos
I_{\theta_2}^{\theta^\prime} \cos I_{\theta_1}^\theta +
{\rm i}\sigma_2 \sin I_{\theta_2}^{\theta^\prime} \cos
I_{\theta_1}^\theta\Big)\right],
\end{align}
and
 \begin{align} \frac{1}{2} \left[
\hat{h}_{{\rm e} +}(\theta) - \hat{h}_{{\rm e}
-}(\theta)\right]_{\rm tr} &= \frac{\xi_{\rm e}}{\sin
I_{\theta_1}^{\theta_2}} \left[ \int_{\theta_1}^\theta
\textrm{d}\theta^\prime \frac{JB}{|v_\parallel|}\Big( {\rm
i}\sigma_1 \cos I_{\theta_1}^{\theta^\prime} \sin
I_{\theta_2}^\theta - \sigma_2 \sin
I_{\theta_1}^{\theta^\prime} \sin
I_{\theta_2}^\theta\Big)\right. \nonumber\\ &\quad +
\left.\int_\theta^{\theta_2} \textrm{d} \theta^\prime
\frac{JB}{|v_\parallel|} \Big( {\rm i}\sigma_1 \cos
I_{\theta_2}^{\theta^\prime} \sin I_{\theta_1}^\theta -
\sigma_2 \sin I_{\theta_2}^{\theta^\prime} \sin
I_{\theta_1}^\theta \Big)\right],
\end{align}
\begin{align} \frac{1}{2} \left[
\hat{h}_{{\rm e} +}(\theta) - \hat{h}_{{\rm e}
-}(\theta)\right]_{\rm tr} &= \frac{\xi_{\rm e}}{\sin
I_{\theta_1}^{\theta_2}} \left[ \int_{\theta_1}^\theta
\textrm{d}\theta^\prime \frac{JB}{|v_\parallel|}\Big( {\rm
i}\sigma_1 \cos I_{\theta_1}^{\theta^\prime} \sin
I_{\theta_2}^\theta - \sigma_2 \sin
I_{\theta_1}^{\theta^\prime} \sin
I_{\theta_2}^\theta\Big)\right. \nonumber\\ &\quad +
\left.\int_\theta^{\theta_2} \textrm{d} \theta^\prime
\frac{JB}{|v_\parallel|} \Big( {\rm i}\sigma_1 \cos
I_{\theta_2}^{\theta^\prime} \sin I_{\theta_1}^\theta -
\sigma_2 \sin I_{\theta_2}^{\theta^\prime} \sin
I_{\theta_1}^\theta \Big)\right],
\end{align}
where 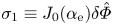 $\sigma _1 \equiv J_0(\alpha _\textrm {e}) \delta \hat {\varPhi }$ and
 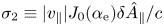 $\sigma _2 \equiv |v_\parallel | J_0(\alpha _\textrm {e}) \delta \hat {A}_\parallel /c$.Footnote 4 Equations (A2) and (A3) were obtained by Tang et al. (Reference Tang, Connor and Hastie1980), but with two minor differences; the
  $\textrm {i}\sigma _2 \sin I_{\theta _2}^{\theta ^\prime } \cos I_{\theta _1}^\theta$ term at the end of (A2) was written as
  $\textrm {i}\sigma _2 \sin I_{\theta _2}^{\theta ^\prime } \sin I_{\theta _1}^\theta$, and the
  $\textrm {i}\sigma _1 \cos I_{\theta _1}^{\theta ^\prime } \sin I_{\theta _2}^\theta$ term at the beginning of (A3) was written as
  $\textrm {i}\sigma _1 \cos I_{\theta _1}^{\theta ^\prime } \sin I_{\theta _1}^\theta$.
When we evaluate the trapped-electron contribution to the parallel component of Ampere's law in § 2.6, we need only the odd (in  $v_\parallel$) part of
  $\hat {h}_\textrm {e}$, given by (A3), and we only consider
  $\theta \sim O (1)$, where all quantities of the form
  $I_{\theta _a}^{\theta _b}$ in (A3) are
 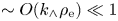 $\sim O (k_\wedge \rho _\textrm {e} ) \ll 1$. The smallness of the
  $I_{\theta _a}^{\theta _b}$ terms makes the trapped-electron contribution to
  $\hat {h}_{\textrm {e}+} - \hat {h}_{\textrm {e}-}$ a factor
  $\sim k_\wedge \rho _\textrm {e}$ smaller than the passing-electron contribution.Footnote 5 Physically, magnetic mirroring reduces the part of the distribution function that is odd in
  $v_\parallel$, making the trapped-electron parallel current negligible.
In § 2.7, when we evaluate the quasineutrality condition, we need only the even part of  $\hat {h}_\textrm {e}$, given by (A2), and we consider only
  $|\theta | \gg 1$, as the value of
  $\delta \hat {\varPhi }$ at
  $|\theta | \ll (k_\wedge \rho _\textrm {e})^{-1}$ contributes only a small correction to (2.39). At
  $|\theta | \gg 1$,
  $\delta \hat {A}_\parallel$ is negligible because of (2.37), and we can drop the
  $\sigma _2$ term in (A2). If
  $\theta _a$ or
  $\theta _b$ differs from a bounce point in any of the
  $I_{\theta _a}^{\theta _b}$ terms in (A2), then the dominant contribution to that
  $I_{\theta _a}^{\theta _b}$ term comes from the
  $\omega _\textrm {De}$ term in (2.32), and in particular the part of
  $\omega _\textrm {De}$ that arises from component of
  $\boldsymbol {v}_\textrm {De}$ along
  $\boldsymbol {\nabla } \psi$, which satisfies the identity (Hinton & Wong Reference Hinton and Wong1985)
 \begin{equation} \boldsymbol{v}_{\rm De} \boldsymbol{\cdot} \boldsymbol{\nabla} \psi = \frac{v_\parallel I(\psi)}{JB} \left.\frac{\partial }{\partial \theta}\right|_{\alpha, \psi, E, \mu} \left(\frac{v_\parallel}{\varOmega_{\rm e}}\right).\end{equation}
At  $|\theta | \gg 1$, (2.13) implies that
  $k_{\perp \psi } = - n |\boldsymbol {\nabla } \psi | (\textrm {d} q / \textrm {d}\psi ) \theta$ to leading order in
  $1/\theta$ (where we have taken
  $\theta _0 \sim O (1)$). We thus find that
 \begin{equation} I_{\theta_a}^{\theta_b} = n q^\prime(\psi) I(\psi) \left. \frac{\theta |v_\parallel|}{\varOmega_{\rm e}}\right|_{\theta_a}^{\theta_b},\end{equation}
to leading order in  $1/\theta$, where
  $\theta _a$ and
  $\theta _b$ are chosen from
  $\{\theta _1, \theta _2, \theta, \theta ^\prime \}$, provided all three of the following conditions are met: (i)
  $|\theta | \gg 1$; (ii)
  $\theta _a$ or
  $\theta _b$ is not a bounce point; and (iii)
  $|\theta _a - \theta _b| \sim O (1)$. When
  $\theta _a$ and
  $\theta _b$ are both bounce points, the right-hand side of (A5), which is usually the dominant term in
  $I_{\theta _a}^{\theta _b}$, vanishes, and
  $I_{\theta _a}^{\theta _b}$ is instead dominated by the remaining terms, which, although non-vanishing, are
  $\ll 1$. We can thus write
 \begin{equation} \sin I_{\theta_1}^{\theta_2} = I_{\theta_1}^{\theta_2} + \cdots = \int_{\theta_1}^{\theta_2}{\rm d}\theta \frac{JB}{|v_\parallel|} (\omega - \omega_{\rm De}) + \cdots = \sigma_J \tau_{\rm b\ } \langle \omega - \omega_{\rm De} \rangle_{{\rm b}} + \cdots, \end{equation}
where  $\cdots$ represents higher-order corrections, and
 \begin{equation} \langle \cdots \rangle_{{\rm b}} \equiv \frac{1}{\tau_{{\rm b}}}\int_{\theta_1}^{\theta_2} {\rm d}\theta \frac{|J|B}{|v_\parallel|} (\cdots) \quad \mbox{and} \quad \tau_{{\rm b}}(E, \mu) \equiv \int_{\theta_1}^{\theta_2}{\rm d}\theta \frac{|J|B}{|v_\parallel|} \end{equation}
are the bounce average and bounce time, respectively. Upon substituting (A5) and (A6) into (A2), we find that
 \begin{equation} \left[ \hat{h}_{{\rm e} +}(\theta) + \hat{h}_{{\rm e} -}(\theta)\right]_{\rm tr} = \frac{ 2\xi_{\rm e}\cos(P)}{\langle \omega - \omega_{\rm De}\rangle_{{\rm b}}} \left\langle J_0(\alpha_{\rm e}) \cos(P) \delta \hat{\varPhi} \right\rangle_{{\rm b}},\end{equation}
where 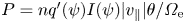 $P = n q^\prime (\psi ) I(\psi ) |v_\parallel | \theta /\varOmega _\textrm {e}$. Substituting (A8) into (2.44) for the value of
  $\hat {h}_{\textrm {e}+} + \hat {h}_{\textrm {e}-}$ at
  $\mu > E/B_\textrm {max}$ leads to the
  $W_\textrm {tr}(\theta, \theta ^\prime )$ term in (2.46).
Appendix B. Justification of (2.35)
By the same arguments that led to (2.39), the sum of terms  ${\bigcirc{\kern-10pt 3a}}$ and
  ${\bigcirc{\kern-10pt 3b}}$ in (2.34) is
 \begin{equation} {\bigcirc{\kern-10pt 3a}} + {\bigcirc{\kern-10pt 3b}} = \frac{ \sigma_J n_0 e^2v_{T{\rm e}}(\omega- \omega_0) \hat{\psi}_{{\parallel}, \infty}}{ {\rm \pi}^{1/2} T_{\rm e}B_{\rm max}\omega}.\end{equation}
Equations (2.37) and (2.40a,b) imply that
 \begin{equation} {\bigcirc{\kern-6pt 1}} = C_1 ={-}\frac{ 2 {\rm i}\sigma_J n_0 e^2 \hat{\psi}_{{\parallel}, \infty}}{m_{\rm e} \omega B_{\rm max} L}. \end{equation}
The second line of (2.35) follows from dividing (B2) by (B1) and making use of the orderings in § 2.3.
To estimate terms  ${\bigcirc{\kern-10pt 2a}}$ and
  ${\bigcirc{\kern-10pt 2b}}$ in (2.34), we first estimate
  $I_0^\theta$ in (2.32) for electrons with
  $v \sim v_{T\textrm {e}}$. Equations (2.21), (2.24a,b) and (2.26) imply that the contributions to
  $I_0^\theta$ from terms proportional to
  $\omega$ or
  $k_\wedge$ are
  $\sim k_\wedge \rho _\textrm {e} \theta$. The remaining contribution to
  $I_0^\theta$, which is
  $\propto k_{\perp \psi }$, is a little trickier to estimate, because
  $k_{\perp \psi }$ grows secularly with
  $\theta$. Keeping just the dominant part of
  $k_{\perp \psi }$ at large
  $|\theta |$, which from (2.13) is
  $- n |\boldsymbol {\nabla } \psi | (\textrm {d} q / \textrm {d}\psi ) \theta$, employing (A4), and defining
  $v_{\textrm {De},\psi } = \boldsymbol {v}_\textrm {De} \boldsymbol {\cdot } \boldsymbol {\nabla } \psi /|\boldsymbol {\nabla } \psi |$, we find that
 \begin{equation} \int_0^\theta {\rm d}\theta^\prime \frac{JB}{|v_\parallel|} n |\boldsymbol{\nabla} \psi| \frac{{\rm d} q}{{\rm d}\psi} \theta^\prime v_{{\rm De}, \psi} = n \frac{{\rm d} q}{{\rm d}\psi} I(\psi) \theta \left( \frac{|v_\parallel|}{\varOmega_{\rm e}} - \left\langle \frac{|v_\parallel|}{\varOmega_{\rm e}}\right\rangle \right) \sim k_\wedge \rho_{\rm e} \theta, \end{equation}
where  $\langle f \rangle \equiv (1/\theta )\int _0^\theta \textrm {d}\theta ^\prime f(\theta ^\prime )$. Therefore,
  $I_0^\theta$ in its entirety is
  $\sim k_\wedge \rho _\textrm {e}\theta$.
At  $|\theta | \lesssim (k_\wedge \rho _\textrm {e})^{-1}$,
  $|I_0^\theta | \lesssim 1$,
  $\textrm {e}^{\pm \textrm {i} \bar {I}_0^\theta } \sim O (1)$ and
  $J_0(\alpha _\textrm {e}(\theta )) \sim O (1)$. Equations (2.41) and (2.47) then show, respectively, that
  $\varGamma (\theta ) \sim O (1)$ and
  $W_{{\rm p}}(\theta, \theta ^\prime ) \sim k_\wedge \rho _\textrm {e}$ when
  $|\theta | \lesssim (k_\wedge \rho _\textrm {e})^{-1}$ and
  $|\theta ^\prime | \lesssim (k_\wedge \rho _\textrm {e})^{-1}$. On the other hand, at
  $|\theta | \gg (k_\wedge \rho _\textrm {e})^{-1}$,
  $\bar {I}_0^\theta$ becomes large, and
  $\exp (\pm \textrm {i} \bar {I}_0^\theta )$ becomes a rapidly oscillating function of velocity. This rapid oscillation and the decay in
  $J_0(\alpha _\textrm {e}(\theta ))$ at
  $|\theta | \gg (k_\wedge \rho _\textrm {e})^{-1}$ cause
  $|\varGamma (\theta )|$ to decay to values
  $\ll 1$ and
  $|W_{{\rm p}}(\theta, \theta ^\prime )|$ to decay to values
  $\ll k_\wedge \rho _\textrm {e}$ when
  $|\theta |$ or
  $|\theta ^\prime |$ is
  $\gg (k_\wedge \rho _\textrm {e})^{-1}$. For similar reasons,
  $W_\textrm {tr}(\theta,\theta ^\prime ) \sim O (1)$ when
  $|\theta | \lesssim (k_\wedge \rho _\textrm {e})^{-1}$ and
  $|\theta^{\prime}| \lesssim (k_\wedge \rho _\textrm {e})^{-1}$, and
  $W_\textrm {tr}(\theta,\theta ^\prime ) \ll 1$ when
  $|\theta |$ or
  $|\theta ^\prime |$ is
  $\gg (k_\wedge \rho _\textrm {e})^{-1}$. Given these approximate values of
  $W_{{\rm p}}(\theta, \theta ^\prime )$,
  $\varGamma$ and
  $W_\textrm {tr}(\theta, \theta ^\prime )$, it follows from (2.46) that
  $\delta \tilde {\varPhi } \sim O (1)$ at
 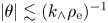 $|\theta | \lesssim (k_\wedge \rho _\textrm {e})^{-1}$ and that
  $|\delta \tilde{\varPhi}| \ll 1$ at
 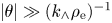 $|\theta | \gg (k_\wedge \rho _\textrm {e})^{-1}$. This behaviour of
  $\delta \tilde {\varPhi }$ enables us to estimate the magnitude of terms
  ${\bigcirc{\kern-10pt 2a}}$ and
  ${\bigcirc{\kern-10pt 2b}}$ in (2.34) by setting
  $\delta \hat {\varPhi }(\theta ^\prime ) \sim \hat {\psi }_{\parallel, \infty }$ for
  $|\theta ^\prime | \lesssim (k_\wedge \rho _\textrm {e})^{-1}$ and
  $\delta \hat {\varPhi }(\theta ^\prime ) \rightarrow 0$ for
  $|\theta ^\prime | \gg (k_\wedge \rho _\textrm {e})^{-1}$, which then, in conjunction with (B1), leads to the first line of (2.35).


 Open access