



Milk, as a high-protein and fat food, is the only food for newborn mammals and a very important food for people. Milk protein and fat are synthesised and secreted by mammary epithelial cells (MEC), which are the functional units of mammary glands(Reference Truchet and Honvo-Houéto1). The quantity of MEC directly influences the volume of milk secreted by mammary glands, and the milk synthesis ability and proliferative state of MEC in the lactation stage of the mammary gland are influenced by hormones and nutrients such as amino acids(Reference Herve, Quesnel and Lollivier2–Reference Hannan, Elajnaf and Vandenberg4).
The mechanistic target of rapamycin (mTOR), a conserved Ser/Thr protein kinase, serves as a main signalling hub in regulating protein and lipid synthesis and cell proliferation(Reference Sabatini5,Reference Wullschleger, Loewith and Hall6) . mTOR can enhance or attenuate diverse cellular metabolic processes in responding to nutrients and various other growth signals(Reference Szwed, Kim and Jacinto7). Amino acids are required for mTOR activation and exert significant influence on cell metabolism and proliferation(Reference Sabatini5). It has been established that mTOR is the central regulator of milk synthesis and proliferation of MEC, and amino acids can promote milk synthesis through activating mTOR(Reference Han and Zhang8,Reference Kim and Lee9) .
G protein-coupled receptors (GPCR), a large profoundly conserved protein superfamily, have seven transmembrane α-helical structures and can perceive a myriad of extracellular stimuli including hormones, growth factors, amino acids, etc.(Reference Jakubík and El-Fakahany10) These signals can bind to the extracellular N-terminal domain of certain GPCR and thereby change the conformation of its intracellular C-terminal domain and thereby transduce extracellular signals to trimeric G-proteins and their downstream effectors such as phosphoinositide 3-kinase (PI3K) to govern various pivotal cellular functions(Reference Seyedabadi, Ghahremani and Albert11–Reference Carnero13). The ligands of many GPCR have been identified, but the ligands of some GPCR, which are known as orphan receptors, are still unknown. Amino acids are ligands of some GPCR including T1R1/T1R3 and GPRC6A and regulate cellular processes in a positive feedback way through upregulating expression of these GPCR(Reference Zheng, Zhang and Zhou14–Reference Li, Li and Wang16). Little is still known about other GPCR sensing different amino acids.
Methionine (Met) is a well-known sulfur-containing amino acid and one of the restrictive essential amino acids for animals and human being. Met is not only a substrate for protein synthesis but also a key stimulus to regulate cell proliferation and various cellular metabolic processes(Reference Mladenović, Radosavljević and Hrnčić17). Met can promote milk synthesis and proliferation of MEC through a multitude of signalling pathways, such as the SNAT2, PI3K and GPR87 signalling pathways(Reference Han and Zhang8,Reference Qi, Meng and Jin18,Reference Luo, Yu and Li19) . It remains elusive the exact GPCR capable of perceiving Met.
It has been reported that G protein-coupled receptor 183 (GPR183) is the oxysterol receptor, playing an important role in inflammation and immune response(Reference Misselwitz, Wyss and Raselli20,Reference Emgård, Kammoun and García-Cassani21) . GPR183 participates in the progression of various diseases and has considerable potential as a pharmacological target(Reference Misselwitz, Wyss and Raselli20,Reference Frascoli, Ferraj and Miu22) . Notably, GPR183 is highly expressed in the small intestine of mice and promotes lymphoid organ development(Reference Emgård, Kammoun and García-Cassani21). Stimulation with GPR183 and its ligand oxysterol 7α,25-dihydroxycholesterol facilitated the intracellular proliferation of Mycobacterium tuberculosis (Reference Tang, Shi and Zhan23). These reports point out that GPR183 undertakes multiple important roles in regulating cellular physiology, but it has not been reported the role of GPR183 in milk synthesis and amino acid sensing pathway.
Transcriptomic analysis can find new genes associated with milk synthesis in MEC and cell proliferation(Reference Finucane, McFadden and Bond24–Reference Saeki, Chang and Kanaya26). Furthermore, amino acids can stimulate the expression of some GPCR which can stimulate milk synthesis in MEC, and these GPCR might be receptors of amino acids(Reference Han and Zhang8,Reference Li, Li and Wang16,Reference Luo, Yu and Li19) . Thus, in this study, we employ transcriptome sequencing and gene function study approaches to uncover GPCR that can sense Met in MEC.
Materials and methods
Collection of mouse mammary gland tissues
Mouse mammary gland tissue samples were collected, and animal experiments were performed according to the Regulations on Animal Experimentation of Yangtze University. Briefly, twelve normally raised female ICR mice fed with maintenance diet were divided into three groups (n 4 in each group): group 1, puberty, 8-week-old; group 2, on the 14th day of lactation, 11-week-old; and group 3, on the 3rd day of dry period, 12-week-old. The dislocation of the spinal cord was used to kill these mice, and then tissues of these mammary glands were collected and stored in a –80°C refrigerator.
Cell culture and treatment
HC11 cells were purchased from the Cell Repository/Stem Cell Repository of the Chinese Academy of Sciences (Shanghai, China). Cells were cultivated for successive passages in RPMI 1640 Medium (31800-022, Gibco, Grand Island, NY, USA), supplemented with 10 % fetal bovine serum (PAN-Biotech), NaHCO3, sodium pyruvate (Gibco), GlutaMAX-1 (35050-61, Gibco), as well as 100 U/ml penicillin and 0·1 mg/ml streptomycin. These cultured cells were subsequently employed for subsequent experiments. For Met treatment, the original culture medium was replaced with Opti-MEM I (31985-070, Gibco) free of fetal bovine serum, upon the cell growth density reaching 40 % in a 6-well or 24-well plate. Cells were then starved for 12 h and next treated with Met at different concentrations at 37°C for 24 h.
Construction of cDNA library and RNA sequencing
Cells in a 6-well plate were treated with Met (0·6 mM) (three blank samples and three Met-treated samples) for 24 h. As previously reported, this concentration of Met can effectively stimulate mTOR activation and milk synthesis in MEC(Reference Qi, Meng and Jin18). Then within a few minutes, a portion of these cells was swiftly placed in cryopreservation tubes containing the RNA Stabilization Reagent for Animal Tissue (R0118, Beyotime), followed by rapid freezing in liquid nitrogen. The remaining cells were designated for Western blotting prior to subsequent sequencing endeavours. The processed cell samples were preserved on dry ice and sent to APTBIO (Shanghai, China) for transcriptome sequencing.
To construct the cDNA Library, total RNA was extracted from the cellular samples using TRIzol reagent. The absorbance ratio of A260:A280 in the RNA samples was assessed using a NanoDrop ND-2000 instrument (Thermo), while the RNA’s integrity was evaluated through determination of the RNA integrity number using the Agilent Bioanalyzer 4150 system (Agilent). Paired-end libraries were prepared according to the instructions of the ABclonal mRNA-seq Library Preparation Kit (ABclonal). The library quality was assessed using the Agilent Bioanalyzer 4150. Lastly, the NovaSeq 6000 sequencing platform was employed with paired-end 150 bp read length for the sequencing process.
Bioinformatics analysis
The data generated from the Illumina platform were utilised for bioinformatics analysis. The raw data were processed using a Perl script to remove adapter sequences and filter out reads with low quality (base quality value less than 20) as well as reads containing more than five undetermined bases. The resulting set of clean reads was employed for subsequent analyses. The HISAT2 software was utilised to align the clean reads with the reference genome; thereby, the mapped reads were obtained for subsequent analysis.
Differentially expressed genes selection and functional enrichment analysis
The differentially expressed genes (DEG) were analysed using DESeq2, with the filtering criteria set at log2FoldChange > 1·0 and Padj < 0·05 for upregulated DEG and log2FoldChange < −1 and Padj < 0·05 for downregulated DEG. The P values were adjusted to Padj using the Bonferroni correction method. Gene Ontology (GO) and Kyoto Encyclopedia of Genes and Genomes (KEGG) enrichment analyses were performed on upregulated or downregulated DEG separately to elucidate the functional enrichment patterns of these genes using the R package ‘clusterProfiler’.
Quantitative real-time PCR
Total RNA from HC11 cells was extracted using the Animal RNA Isolation Kit with Spin Column (R0026, Beyotime). RNA was reverse transcribed into cDNA using the BeyoRT II First Strand cDNA Synthesis Kit (RNase H minus) (D7168S, Beyotime). Quantitative real-time PCR (RT-qPCR) was carried out using the BeyoFast SYBR Green qPCR Mix (D7260, Beyotime) on the CFX96 Touch RT-PCR System (Bio-Rad). For validation of the RNA-seq results, a total of nine GPCR with a log2FoldChange > 1·0 were selected. All primers were designed using Primer5 software for the nine target genes and the reference gene (online Supplementary Table S1). β-actin mRNA was used as the reference, and normal cultured cells (cells not treated with Met) were used as the blank samples. RT-qPCR results were calculated using the 2−ΔΔCT method.
Transfection and screening of G protein-coupled receptor 183 siRNA
The GPR183 gene coding sequence was gained by employing the National Center for Biotechnology Information (NCBI) database. Three siRNA fragments specific for different regions of GPR183 mRNA and a negative control siRNA were designed and made by GenePharma (online Supplementary Table S2). Following a 24 h transfection period using GP-transfect-Mate (GenePharma), transfected cells were harvested for Western blotting to select the siRNA that had the best transfection efficiency. The most efficacious GPR183 siRNA sequences were sense: 5’-GCUGGCCUUGGUUGUCAUUTT-3’ and antisense: 5’- AAUGACAACCAAGGCCAGCTT-3’.
Construction of G protein-coupled receptor 183 overexpression vector
The CRISPR/dCas9 gene editing technology was employed to activate the GPR183 gene. dCas9 (dead Cas9) is a mutant of Cas9 protein, which is produced by the simultaneous mutation of the RuvC1 and HNH nuclease active regions of Cas9. Its cleavage enzyme activity is lost, and only the ability to be guided into the genome by gRNA is retained. Briefly, cells were co-transfected with the pSPgRNA vector (no. 47108, Addgene, Middlesex, UK) harbouring specific single-guide RNA (sgRNA) sequence and the CRISPR/dCas9 vector SP-dCas9-VPR (hereinafter referred to as VPR) (no. 63798, Addgene) to achieve the activation of the GPR183 gene. The VPR plasmid contains three transcription factor binding domains (VP64, p65 and Rta) arranged in sequence at the dCas9 C-terminus. Thus VPR and pSPgRNA co-transfection is able to achieve strong target gene transcriptional activation(Reference Chavez, Scheiman and Vora27). To design sgRNA, the promoter sequence of GPR183 was retrieved from www.ncbi.nlm.nih.gov, and then four distinct sgRNA fragments were designed on www.zlab.bio. These sgRNAs were synthesised by BGI Genomics (Shenzhen, China). The DNA sequences of these four segments were as follows: sgRNA-1: 5’-CACCAGAATGGAGTTAGCTAAGCTGGG-3’; sgRNA-2: 5’-CACCGAAAAAGGCACCACCATAAAAGG-3’; sgRNA-3: 5’-CACCTATGTGAGGTTAACTGATCACGG-3’; sgRNA-4: 5’-CACCAAAAGCACGTAGCATATGTGAGG-3’. To construct the recombinant pSPgRNA vector, the pSPgRNA vector was cleaved using the Bbs I restriction endonuclease and ligated with the annealed oligonucleotides of the four sgRNAs. These four recombinant plasmids were named as pSPgRNA-1, pSPgRNA-2, pSPgRNA-3 and pSPgRNA-4.
Transfection and selection of the G protein-coupled receptor 183 overexpression vector
Two μg recombinant pSPgRNA plasmid and 2 μg VPR plasmid were mixed with 196 μl of Opti-MEM I to form solution A. Six μl GP-transfect-Mate transfection reagent was added into 194 μl of Opti-MEM I to create solution B. Then solutions A and B were blended to form the DNA-lipid complex solution, which was then added into the cell culture medium. Following 48 h transfection, cells were collected for Western blotting to select the optimal GPR183 overexpression vector.
Western blotting
Cell samples were subjected to protein extraction using RIPA enzymatic degradation. Protein samples (20 μg/lane) were segregated on an 8 % SDS polyacrylamide gel and subsequently translocated onto nitrocellulose membranes. These membranes were immersed in a 5 % skimmed milk sealing solution at 37°C for 1·5 h. Then they were incubated with the primary antibody at 4°C for 12 h. Primary antibodies used were as follows: GPR183 (12377-1-AP, Proteintech, 1:800), β-actin (66009-1-Ig, Proteintech, 1:5000), β-casein (bs-10032R, Bioss, 1:500), mTOR (66888-1-Ig, Proteintech, 1:5000), p-mTOR (67778-1-Ig, Proteintech, 1:2000), AKT (60203-2-Ig, Proteintech, 1:5000) and p-AKT (29163-1-AP, Proteintech, 1:1000). Subsequently, these membranes were incubated with horseradish peroxidase-conjugated goat anti-rabbit secondary antibody (ZB-2301, ZSGB-BIO, 1:2000) or goat anti-mouse secondary antibody (ZA-2305, ZSGB-BIO, 1:2000) at 37°C for 1 h. Finally, protein bands were detected by a chemiluminescence gel imaging system (JS-1070, Peiqing, Shanghai, China). Quantification of protein levels was accomplished using the ImageJ software.
CCK-8 assay
Cell proliferation level was assessed using the CCK-8 assay. Briefly, cells were mixed evenly and placed in a 96-well plate (∼5 × 10³ cells/well, 100 μl). Following further treatments, each well was supplemented with 10 μl of CCK-8 reagent (C0038, Beyotime). Then the plate was maintained at 37°C for 2 h. Finally, absorbance measurements were taken at 450 nm using a microplate reader (WD-2102B, Liuyi).
EdU assay
EdU assay was employed to assess cell proliferation capability using the BeyoClick EdU-488 Cell Proliferation Detection Kit (C0071s, Beyotime), according to the manufacturer’s guidelines. The fluorescence in cells was observed using a fluorescence inverted microscope (ICX41, Sunny).
TAG content detection
The content of TAG in HC11 cells was quantitatively assessed using a TAG assay kit (E1013, Applygen), according to the manufacturer’s operational manual.
Observation of lipid droplet formation
Cells after treatments were fixed onto coverslips using a 4 % paraformaldehyde solution. The hydrophobic fluorescence probe BODIPY (D3922, Invitrogen) was utilised at a concentration of 1 µg/ml to label lipid droplets. Subsequently, 4,6-diamidino-2-phenylindole (C1006, Beyotime) was employed to label the nucleus. Lipid droplets in cells were observed under a fluorescence inverted microscope.
Statistical analysis
The experimental data represent the mean ± se of three (for cell experiments) or four (for mouse experiment) repeated experiments. Statistical software IBM SPSS (IBM) was used for statistical analysis. ANOVA or Student’s t test was applied to determine the difference among the mean values. Different lowercase letters denote significant differences (P < 0·05; *, P < 0·05).
Results
Differentially expressed genes in cells treated with methionine
Western blotting was performed to validate the effectiveness of Met (0·6 mM) on cells, prior to conducting transcriptome sequencing. The effectiveness of Met was confirmed by the observation that Met significantly increased mTOR phosphorylation (online Supplementary Fig. S1(a) and (b)). For RNA-seq, the RNA quality of samples was first assessed to validate whether they met sequencing requirements. The quality assessment results of RNA-seq showed that the raw reads in the library of the blank group ranged from 40864078 to 65108516, with clean reads spanning from 40519526 to 65007162. The raw reads in the library of the Met-treated group ranged from 42218702 to 70330244, and the clean reads ranged from 40896918 to 70223266 (online Supplementary Table S3). The filtration of data fell within a reasonable range. The base quality value Q20 (sequencing error rate P < 1/100) for the six samples was ≥ 96·34, and Q30 (sequencing error rate P < 1/1000) was ≥ 91·06 (online Supplementary Table S3). The GC content was also within a reasonable range, indicating the absence of contamination in the cellular samples. The sequencing base error rate was a mere 0·05 %. In the blank group, the proportion of total mapped reads to total clean reads ranged from 83·42 to 89·29 %, and in the Met-treated group, it ranged from 82·18 to 92·78 %. The unique mapped reads accounted for 72·75–83·78 % and 71·58–83·94 % of total clean reads in the blank and Met-treated group, respectively (online Supplementary Table S4). From the above data, it is evident that the RNA-seq data possesses high quality and is suitable for subsequent analysis.
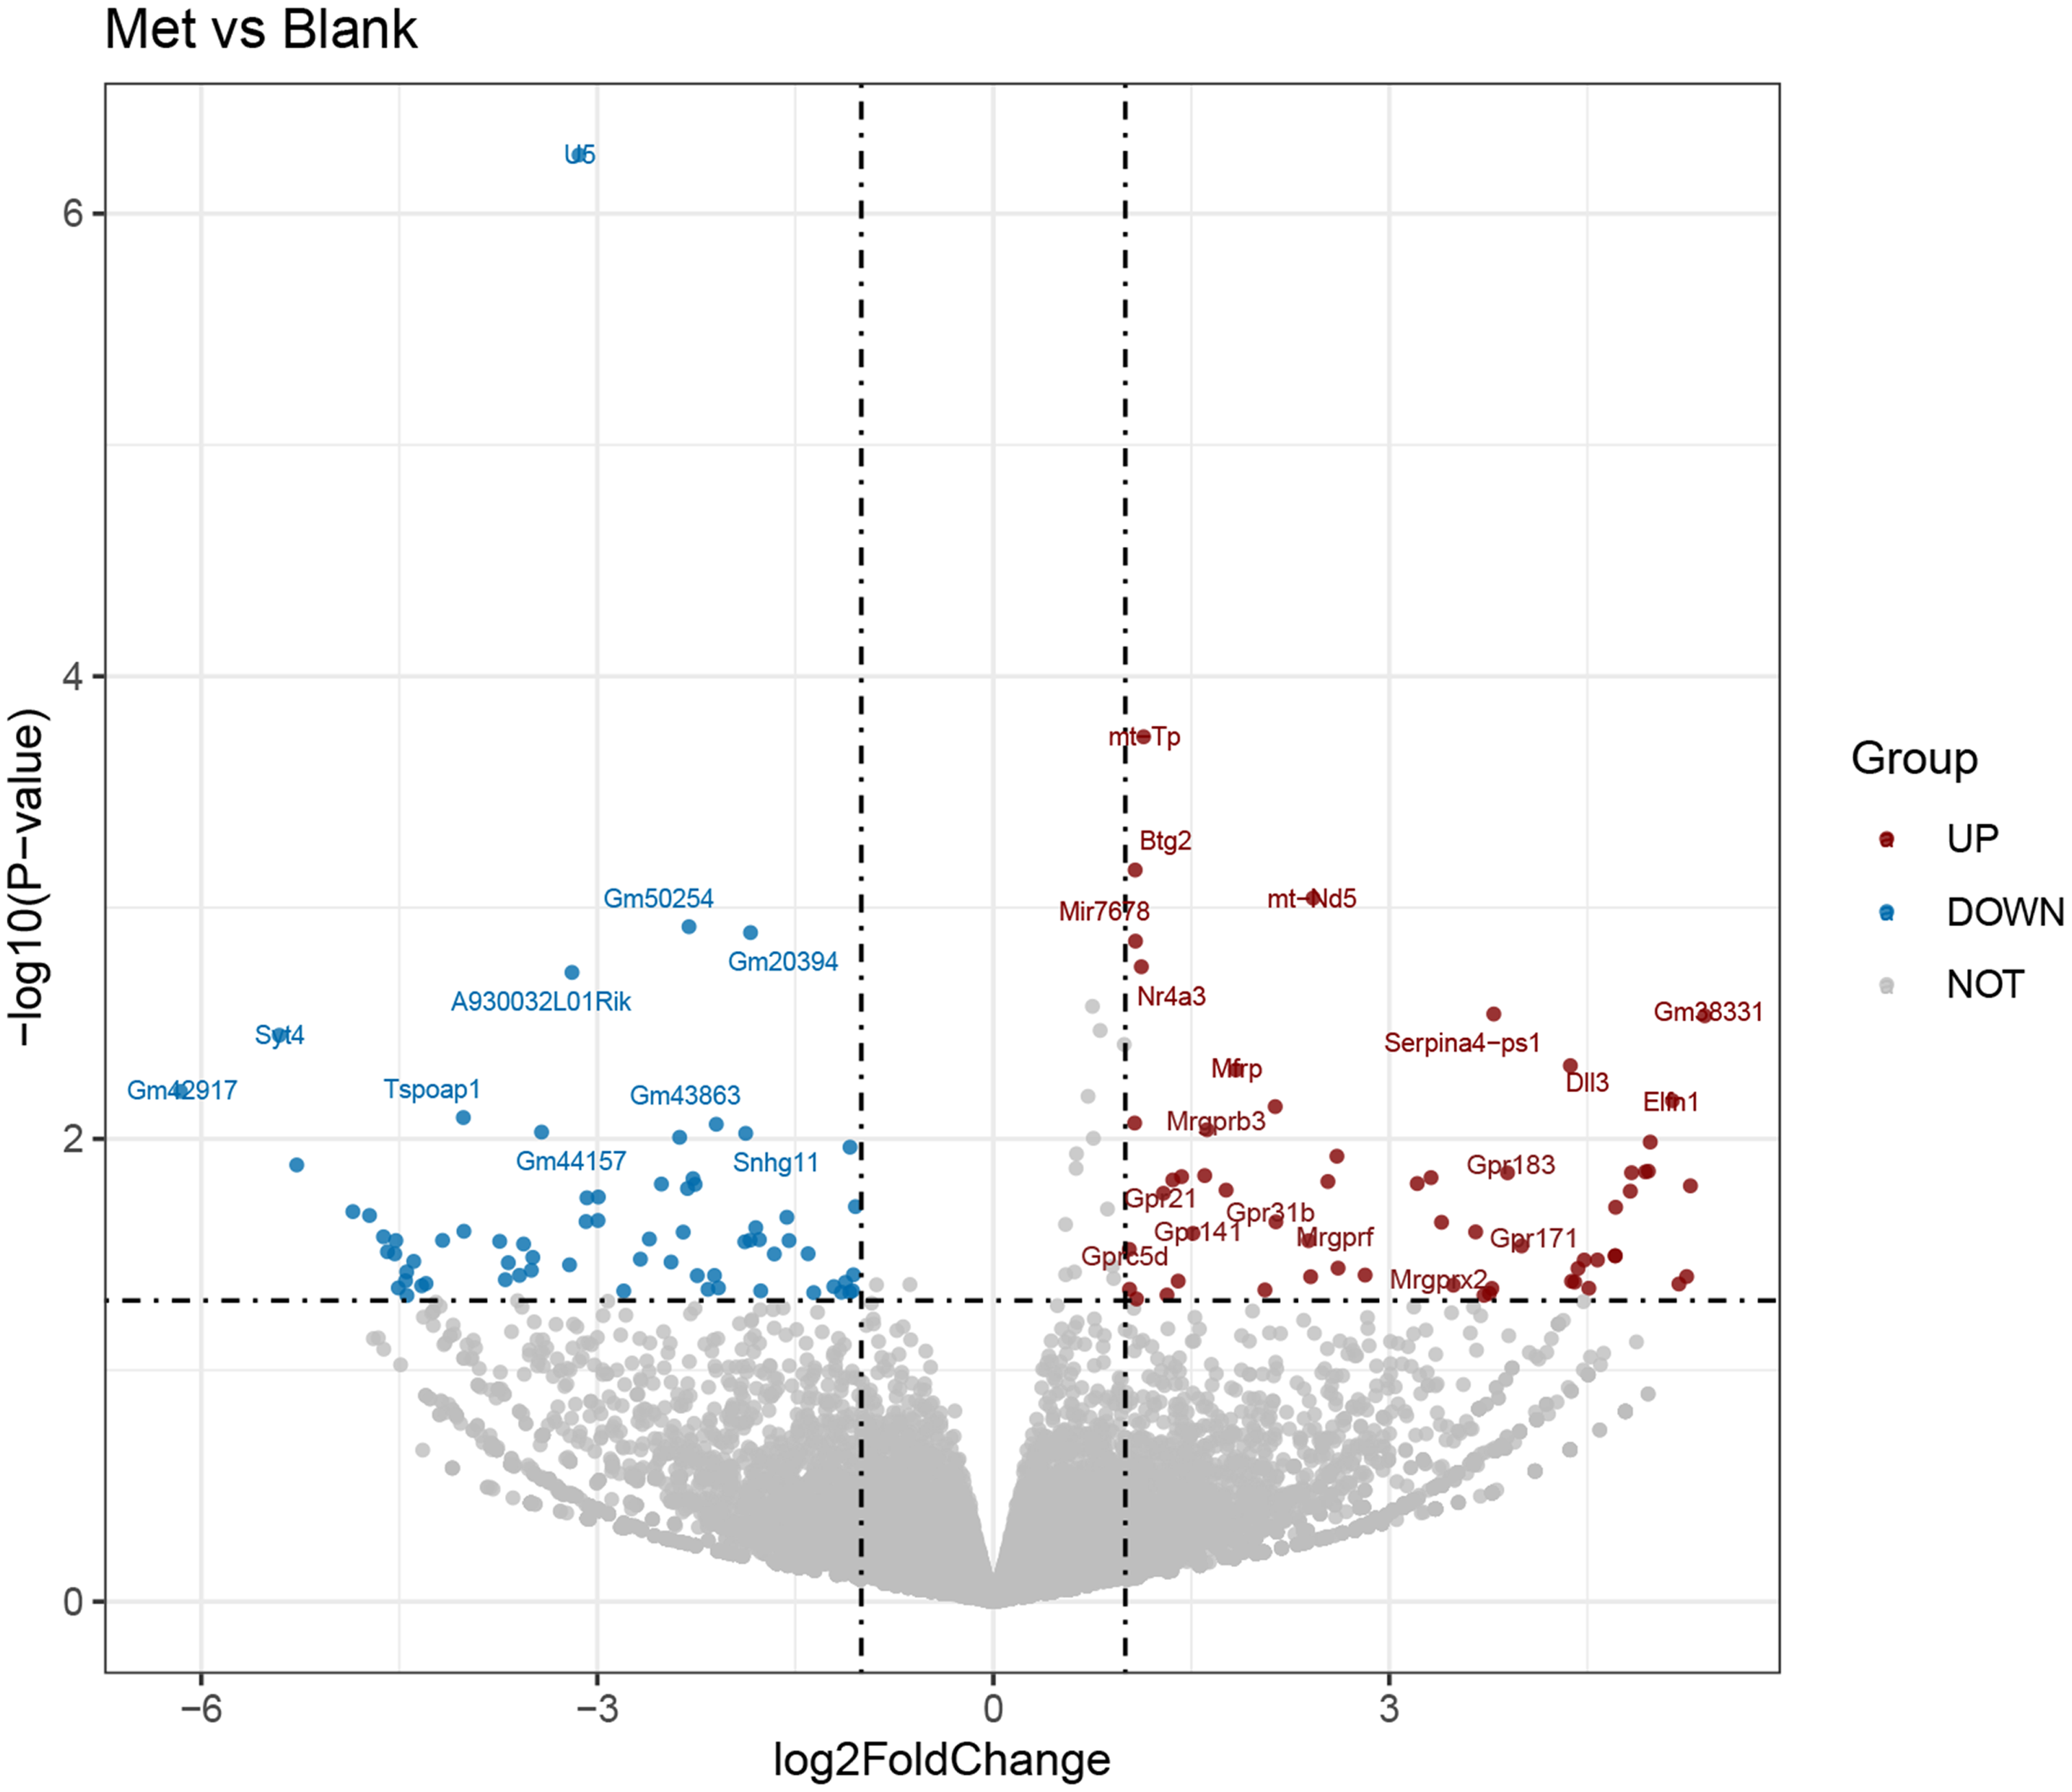
The RNA-seq data were analysed using Illumina sequencing and DESeq2. The expression levels of each gene in various samples were computed as FPKM (expected number of fragments per kilobase of transcript sequence per millions bp sequenced) by using the featureCounts software. A Padj value < 0·05 and an absolute log2FoldChange > 1 were used as the criteria for filtering DEG, and a volcano plot of DEG was generated. Cluster analysis of DEG and the volcano plot showed substantial disparities in gene expression between cell samples with and without Met treatment (Fig. 1, online Supplementary Fig. S2). From these, 129 genes were screened out. Among these genes, fifty-nine genes were upregulated, and seventy genes were downregulated. These DEG might potentially mediate the effects of Met on HC11 cells.
Analysis of differentially expressed genes (DEG) between the blank and methionine (Met)-treated group. Volcano plot of DEG between the blank group and Met (0·6 mM) treatment group. The abscissa represented the change of gene expression multiple, and the ordinate indicated the significance of gene expression differences. The blue dot indicated downregulated DEG, the red dot indicated upregulated DEG, and the grey dot indicated genes without differential expression.
Gene Ontology annotation of differentially expressed genes
GO comprises three major structural domains: biological process, molecular function and cellular component. The top ten enriched functional terms were selected from each of these domains, sorted by P value. Within the upregulated GO of the Met-treated group compared with the blank group, biologically significant enriched processes encompassed cell proliferation, nutrient transportation, metabolic byproducts and energy generation, as well as cell surface receptor activity; molecular functionalities encompassed NADH dehydrogenase activity, oxidoreduction-driven active transmembrane transporter activity, electron transfer activity, primary active transmembrane transporter activity and glutamate receptor binding; and prominently enriched cellular components encompassed respirasome, inner mitochondrial membrane protein complex, respiratory chain complex I, NADH dehydrogenase complex, etc. (online Supplementary Fig. S3(a)).
The GO of downregulated expression primarily encompassed biological processes including adult behaviour, developmental maturation, neuronal ion channel clustering, Ca ion-regulated exocytosis of neurotransmitters and nervous system development; notably enriched molecular functionalities encompassed metal ion transmembrane transporter activity, protein C-terminus binding, transmembrane transporter activity and more (online Supplementary Fig. S3(b)); and mainly involved cellular components included the presynapse, axon, neurone projection terminus and synaptic membrane.
Kyoto Encyclopedia of Genes and Genomes enrichment analysis of differentially expressed genes
The KEGG database in conjunction with Fisher’s exact test was used to analyse the enrichment levels of signal pathways among genes in the Met-treated group compared with the blank group.
Significantly enriched signal pathways among the upregulated genes comprised prion disease, oxidative phosphorylation, retrograde endocannabinoid signalling, endocrine resistance, breast cancer, mTOR signalling pathway, proteoglycans in cancer, etc. (Fig. 2(a)).
Kyoto Encyclopedia of Genes and Genomes (KEGG) enrichment map of differentially expressed genes (DEG) between the blank and methionine (Met)-treated group. (a and b) KEGG enrichment plot of DEG of upregulated (a) and downregulated (b) genes between the blank and Met (0·6 mM)-treated HC11 cells. The ordinate represented the name of the signalling pathway, and the abscissa represented the P value of the signalling pathway. The colour of the dot represented the size of the rich factor. The size of the dot represented the number of differential genes contained in the signalling pathway. mTOR, mechanistic target of rapamycin.
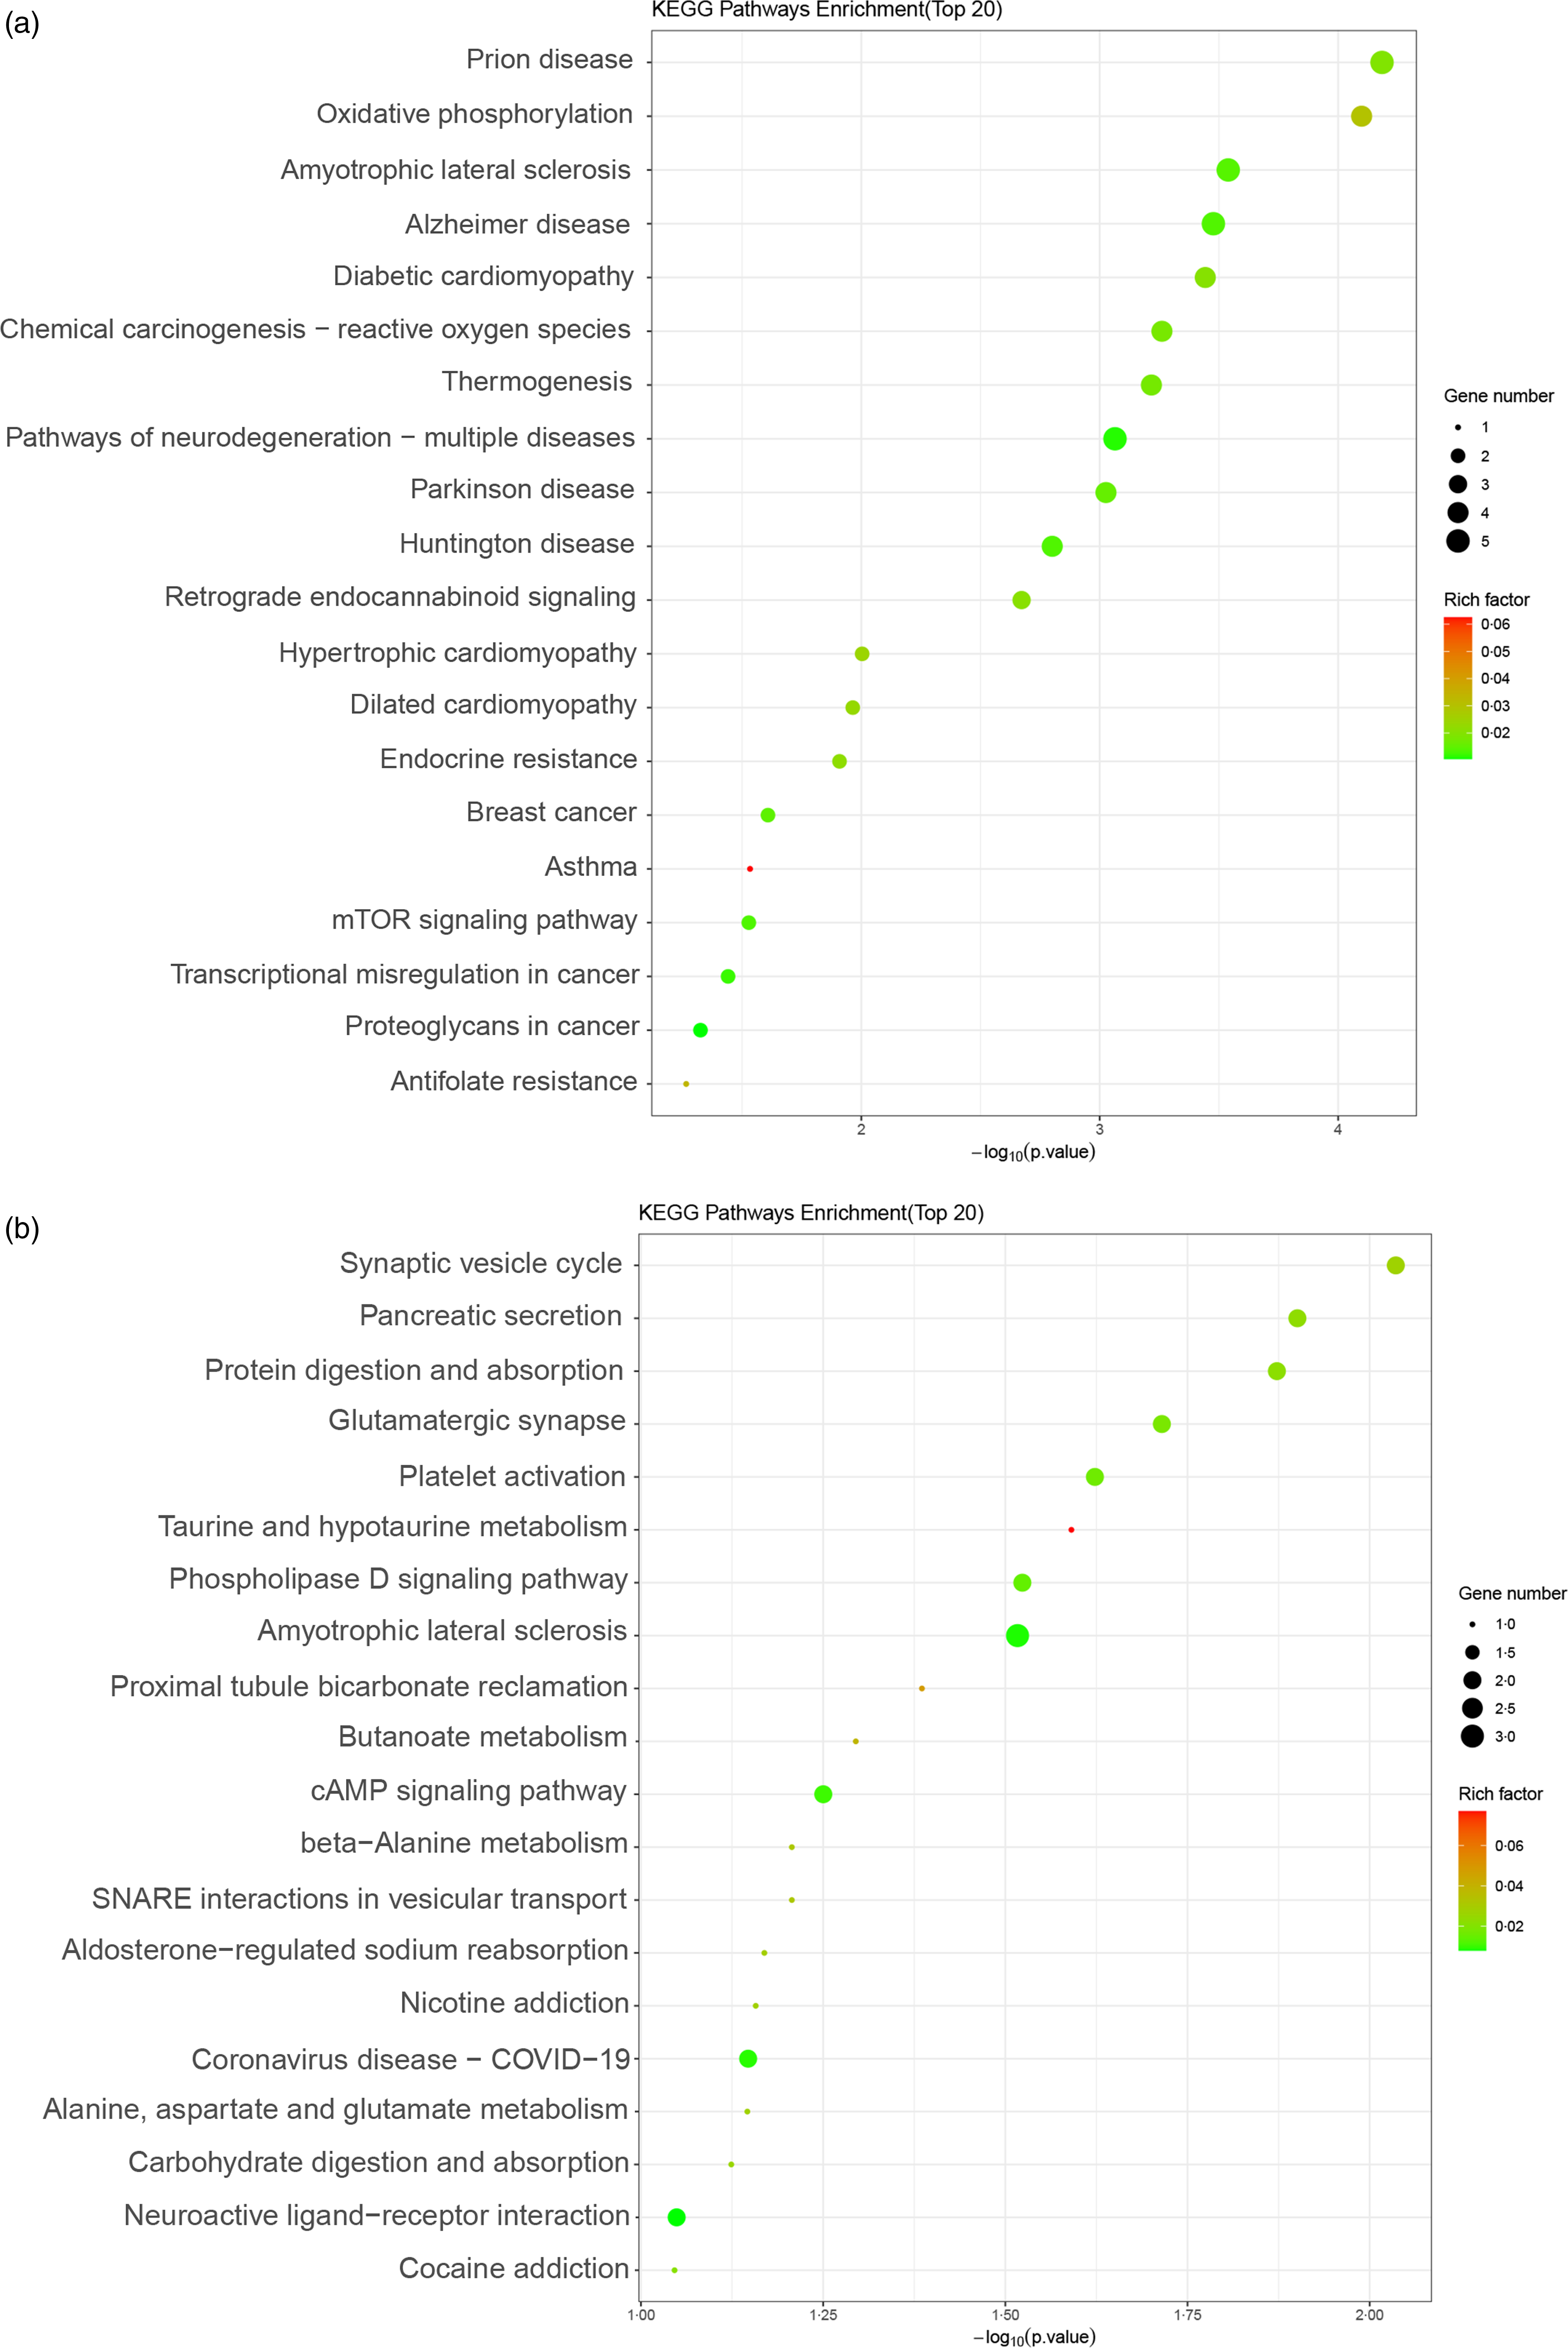
The significantly enriched signal pathways among the downregulated genes encompassed pancreatic secretion, protein digestion and absorption, glutamatergic synapse, taurine and hypotaurine metabolism, phospholipase D signalling pathway, butanoate metabolism, cAMP signalling pathway, beta-alanine metabolism and alanine, aspartate and glutamate metabolism, etc. (Fig. 2(b)).
Candidate G protein-coupled receptor selection and quantitative real-time PCR validation
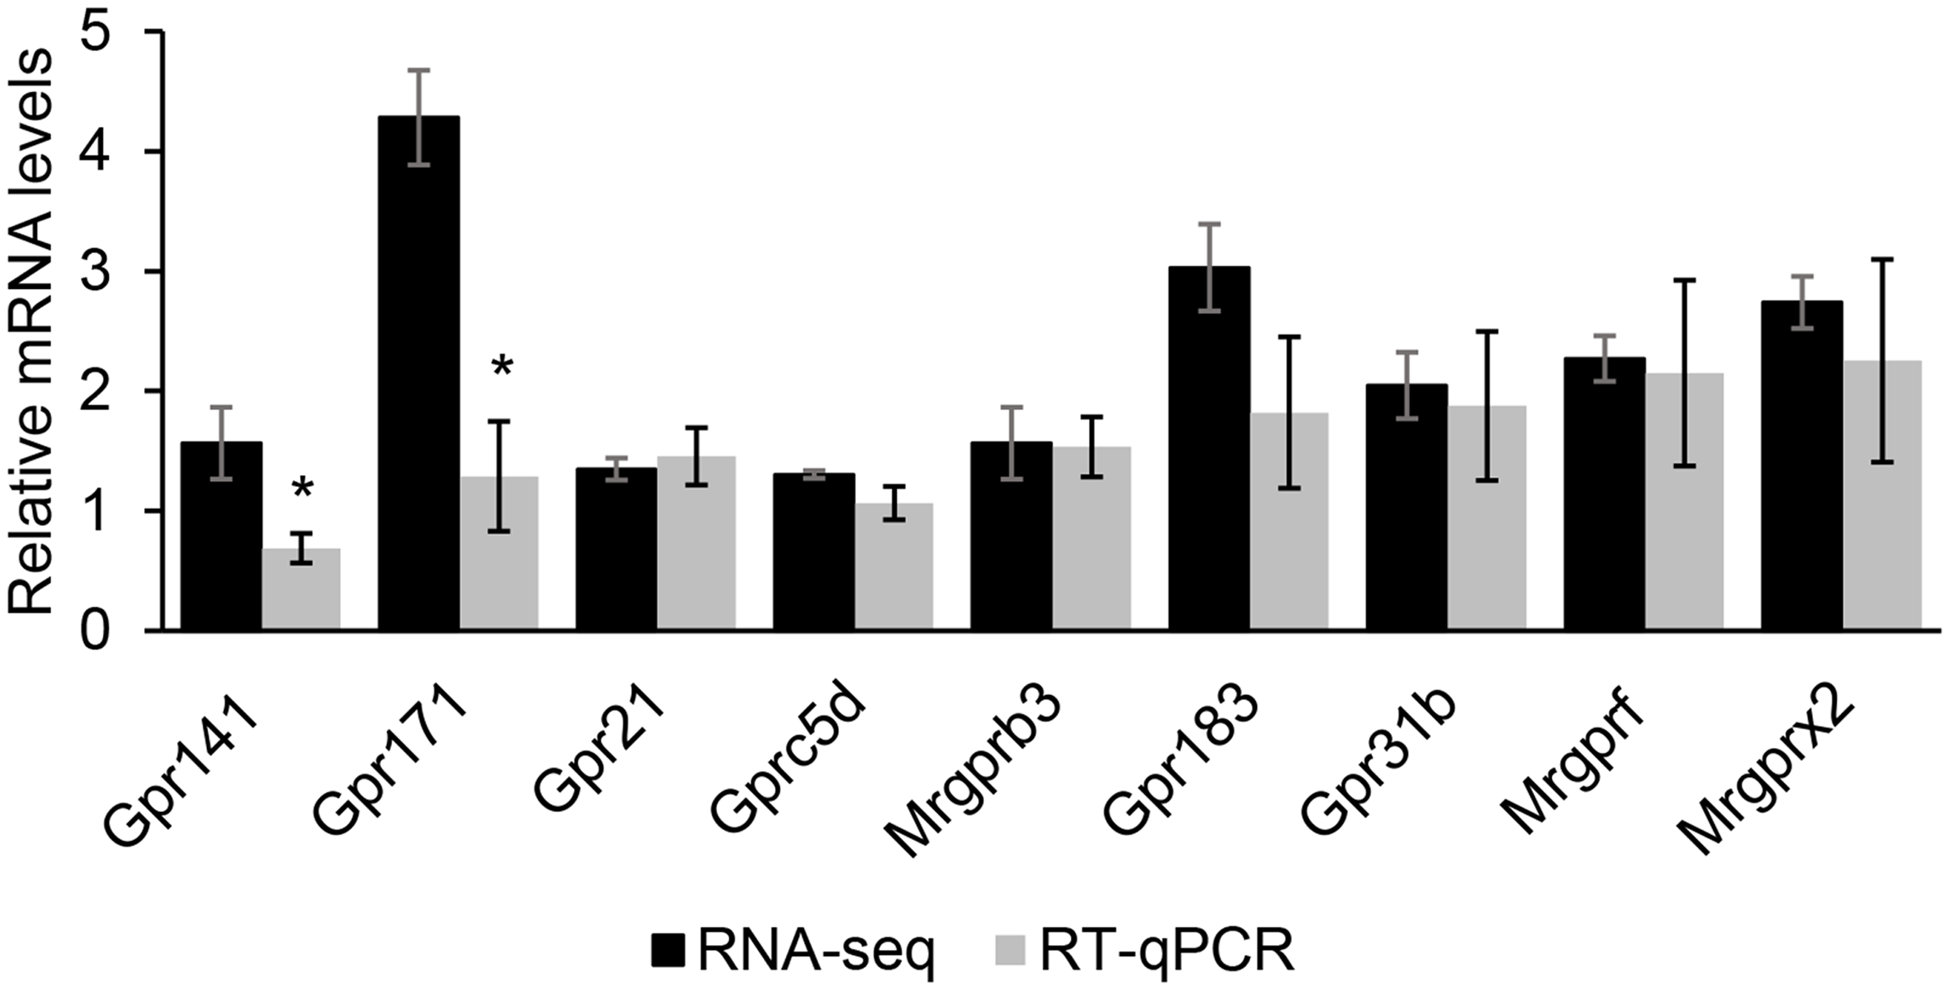
From the RNA-seq data (upregulated DEG) and GO and KEGG analysis, and further compared with the Mouse Genome Informatics database, an international database resource for the laboratory mouse, nine GPCR were selected: Gpr183, Gpr171, Gpr31b, Gpr141, Gpr21, Gprc5d, Mrgprf, Mrgprb3 and Mrgprx2. RT-qPCR analysis validated that most of these GPCR RNA-seq results had high reliability (Fig. 3).
The comparison of RNA sequencing (RNA-seq) and quantitative real-time PCR (RT-qPCR) results of nine selected G protein-coupled receptors (GPCR). The comparison between RNA-seq and RT-qPCR results of nine selected GPCR. The relative mRNA level was the ratio of RNA-seq or RT-qPCR results of the Met treatment group to that of the control group. Data were the mean ± se (n 3). *, P < 0·05.
G protein-coupled receptor 183 is highly expressed in mouse mammary gland tissue during the lactation stage
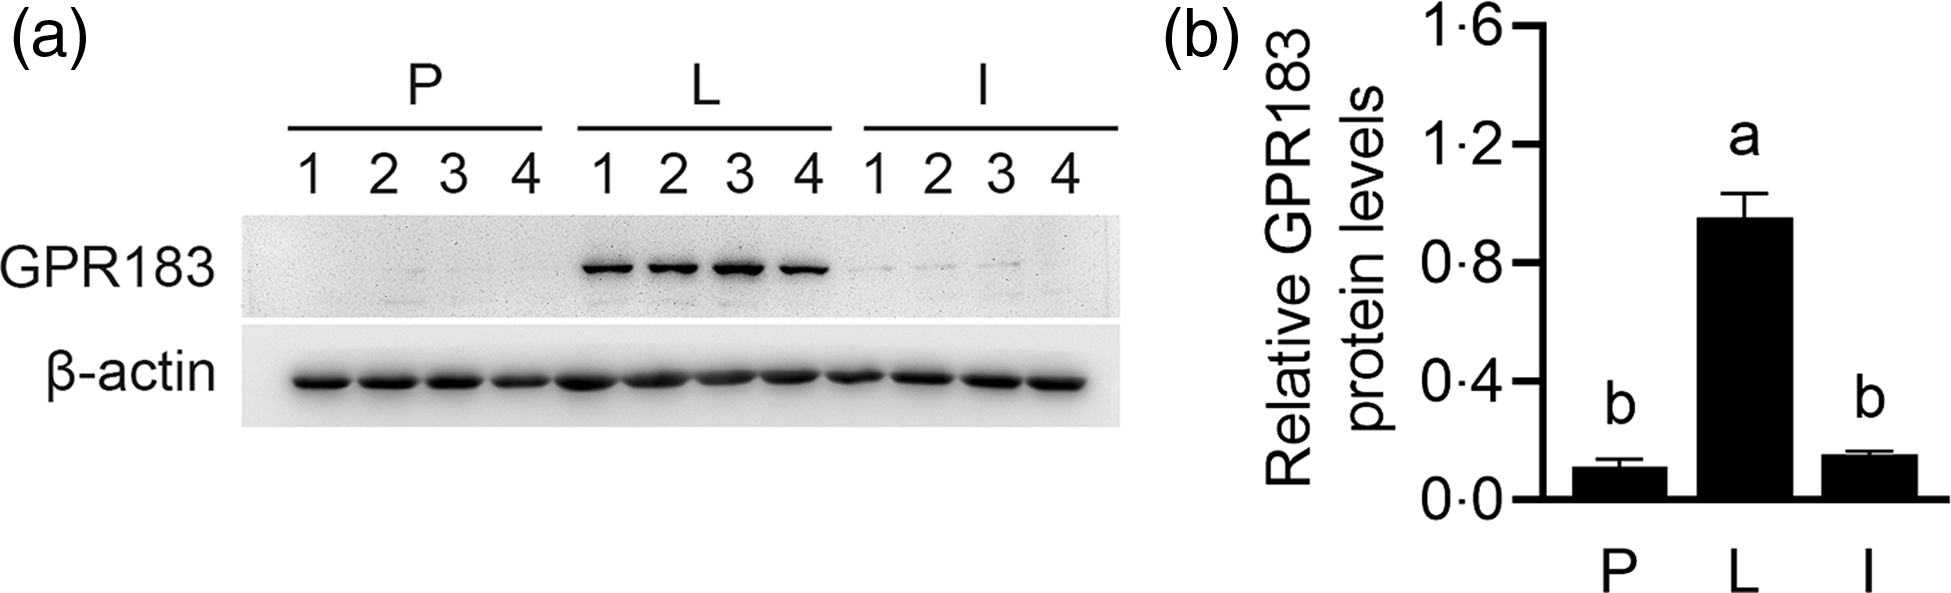
By analysing previous literature on these GPCR, GPR183 was further selected to analyse its role in Met-stimulated milk synthesis in HC11 cells. We first observed the expression of GPR183 by Western blotting analysis in mouse mammary gland tissues during puberty, lactation and involution stages. GPR183 protein was much more highly expressed in tissues during the lactation stage, compared with the other two stages (Fig. 4(a) and (b)). These data suggest that GPR183 might play a pivotal regulatory role in milk synthesis in the mammary gland.
G protein-coupled receptors 183 (GPR183) expression in mouse mammary gland tissues during different stages. (a) Western blotting analysis of GPR183 protein levels in mouse mammary gland tissues during puberty (P), lactation (L) and involution stages (I). (b) Quantification of GPR183 expression using ImageJ. Data were the mean ± se (n 4). Different letters marked above the values indicate significant differences (P < 0·05).
G protein-coupled receptor 183 positively regulates milk protein and fat synthesis in HC11 cells and cell proliferation
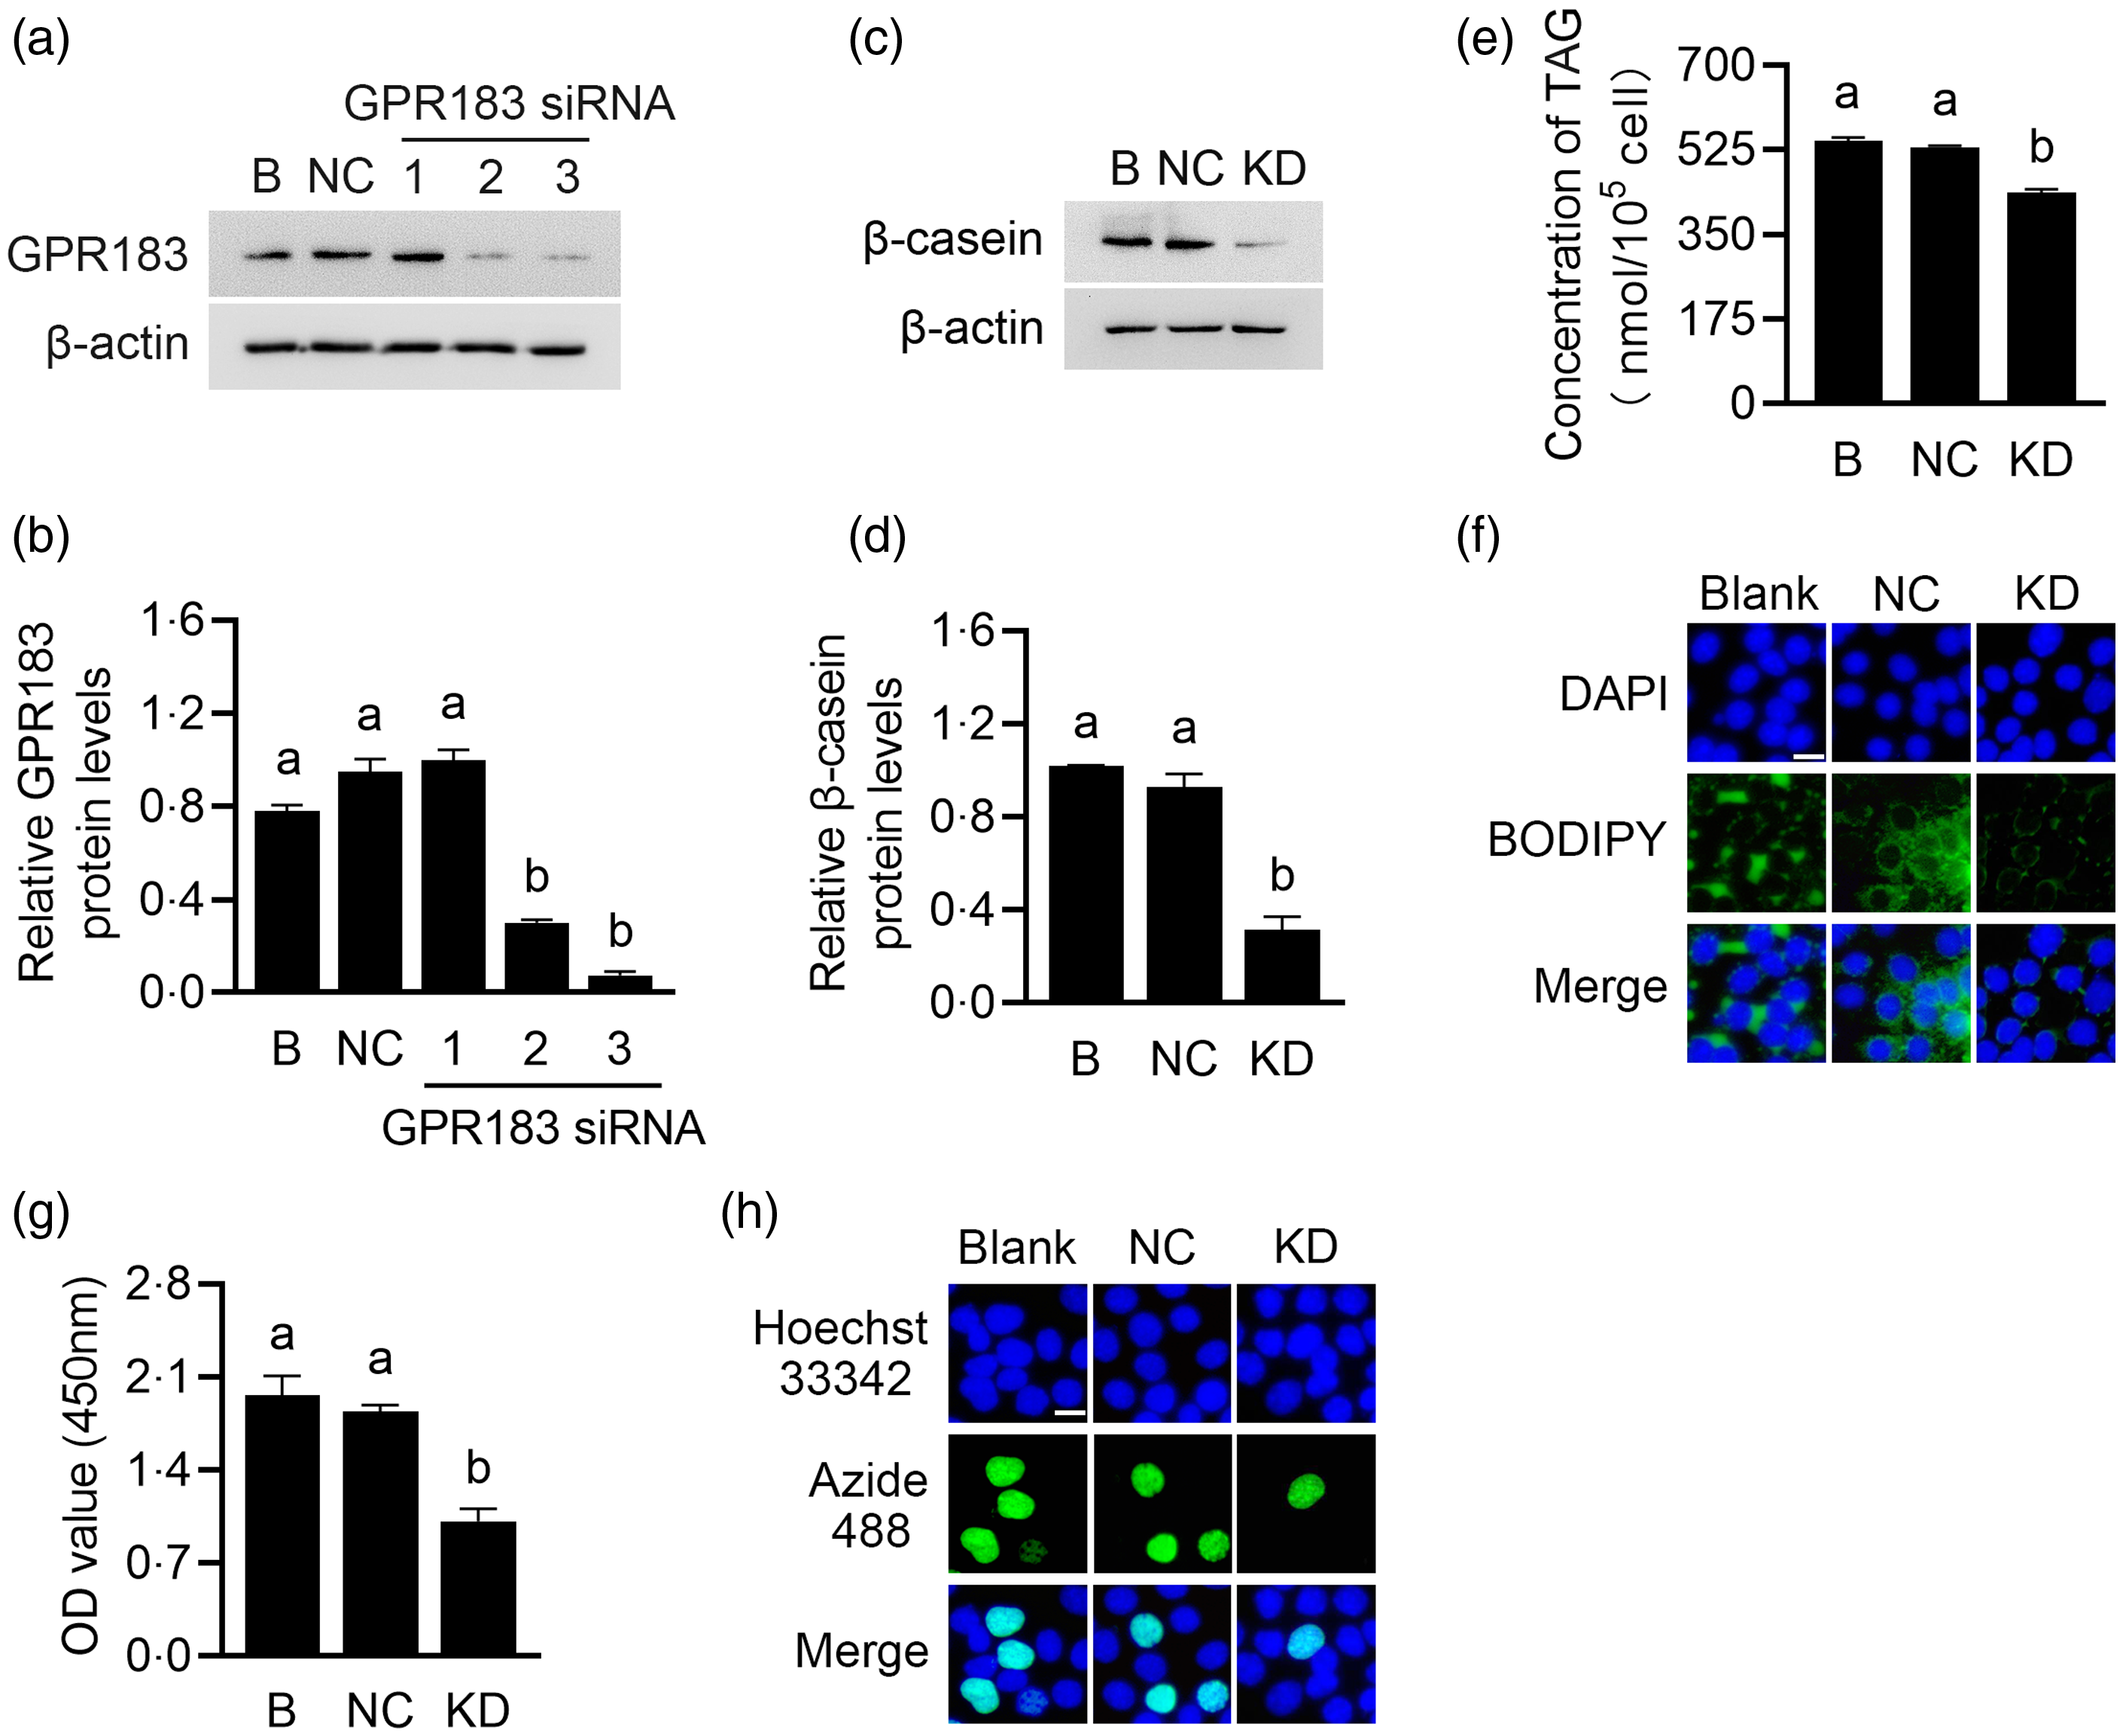
Gene function analysis was performed to determine the role of GPR183 in HC11 cells. GPR183 was knocked down through transfection of GPR183 siRNA into HC11 cells. Three GPR183 siRNAs were separately introduced into HC11 cells, and the third siRNA exhibited the most robust interference efficacy, which was chosen for subsequent experiments (Fig. 5(a) and (b)). GPR183 knockdown significantly decreased β-casein level (Fig. 5(c) and (d)) and content of TAG (Fig. 5(e)) and formation of lipid droplets (Fig. 5(f)) in cells and also reduced cell number (Fig. 5(g)) and proliferation ability (Fig. 5(h)).
Effects of G protein-coupled receptors 183 (GPR183) knockdown on cell proliferation and milk protein and fat synthesis. (a) GPR183 protein levels in HC11 cells transfected with three different siRNAs were analysed by Western blotting. 1, 2 and 3 represent three different siRNAs targeting GPR183. B, blank. (b) Quantification by ImageJ of GPR183/β-actin from Western blots in (a). (c) The protein level of β-casein in HC11 cells transfected with GPR183 siRNA3 was analysed by Western blotting. Normal cultured HC11 cell was used as a blank control, and negative control transfected cell was used as a negative control. (d) Quantification by ImageJ of β-casein/β-actin from Western blots in (c). (e) The content of TAG in cells was detected by a TAG detection kit. (f) Lipid droplets in cells were observed using BODIPY staining. Lipid droplets labelled with BODIPY, green; nuclei labelled with 4,6-diamidino-2-phenylindole, blue. Scale bar = 15 μm. (g) Cell number was determined using a CCK-8 detection kit. (h) Cell proliferation ability was determined using an EdU-488 detection kit. Azide 488 labelled proliferating cells, green; and Hoechst 33 342 labelled nuclei, blue. Scale bar = 15 μm. Data were the mean ± se (n 3). Different letters marked above values indicate significant differences (P < 0·05).
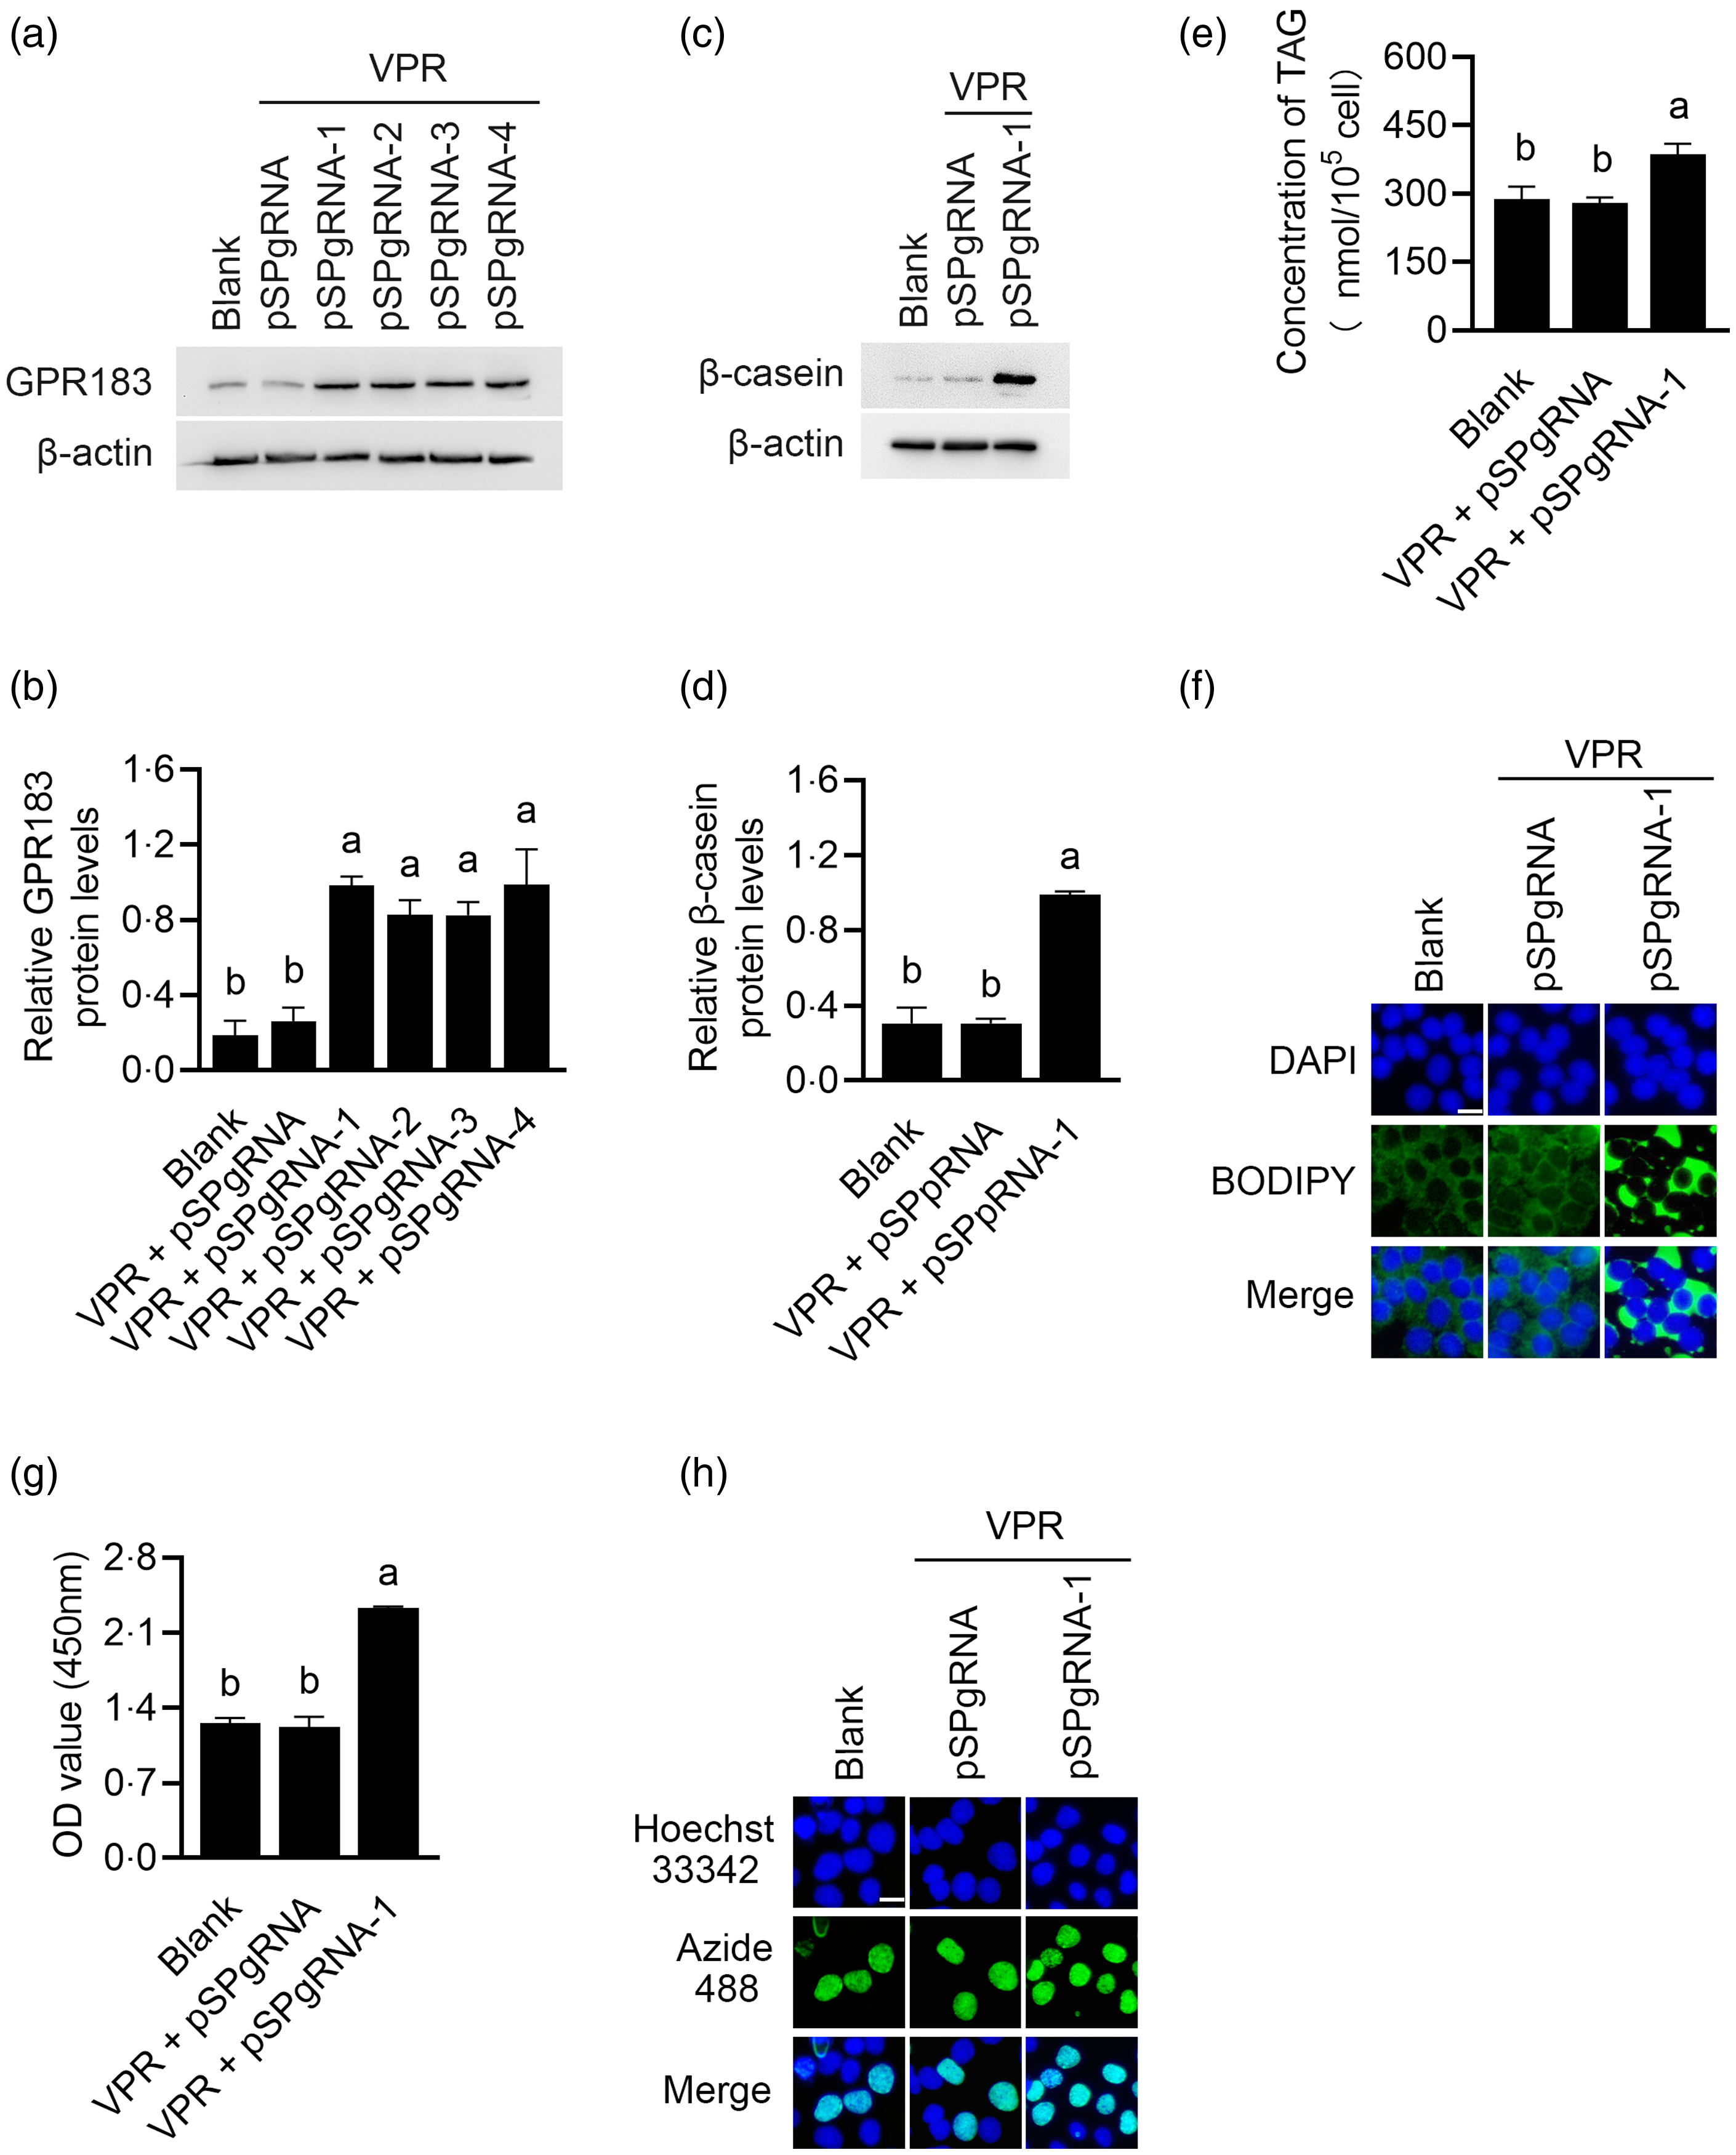
GPR183 overexpression was performed using the CRISPR/dCas9 technology. Western blotting detected that the first pSPgRNA among the four recombinant plasmids yielded the most potent overexpression effect (Fig. 6(a) and (b)), which was selected for subsequent experiments. GPR183 overexpression significantly upregulated β-casein level (Fig. 6(c) and (d)) and content of TAG (Fig. 6(e)) and formation of lipid droplets (Fig. 6(f)) in cells and also increased cell number (Fig. 6(g)) and proliferation ability (Fig. 6(h)). In summary, the above data demonstrate that GPR183 is a positive regulator of milk protein and fat synthesis in HC11 cells and cell proliferation.
Effects of G protein-coupled receptors 183 (GPR183) overexpression on cell proliferation and milk protein and fat synthesis. (a) GPR183 protein levels in cells co-transfected with VPR and four different recombinant pSPgRNA vectors were detected by Western blotting. pSPgRNA-1, pSPgRNA-2, pSPgRNA-3 and pSPgRNA-4:4 different pSPgRNA vectors. (b) Quantification by ImageJ of GPR183/β-actin expression from Western blots in (a). (c) The protein levels of β-casein in HC11 cells co-transfected with VPR and pSPgRNA-1 were analysed by Western blotting. Normal cultured HC11 cell was used as a blank control, and empty pSPgRNA and VPR transfected cells as a negative control. (d) Quantification by ImageJ of β-casein/β-actin expression from Western blots in (c). (e) The content of TAG in cells was detected by a TAG detection kit. (f) Lipid droplets in cells were observed using BODIPY staining. Lipid droplets labelled with BODIPY, green; nuclei labelled with labelled with 4,6-diamidino-2-phenylindole, blue. Scale bar = 15 μm. (g) CCK-8 assay of number of cells transfected with pSPgRNA-1. (h) EdU-488 cell proliferation detection kit was used to detect cell proliferation ability. Azide 488 labelled proliferating cells, green, and Hoechst 33 342 labelled nuclei, blue. Scale bar = 15 μm. Data were the mean ± se (n 3). Different letters marked above values indicate significant differences (P < 0·05).
G protein-coupled receptor 183 positively regulates the mechanistic target of rapamycin phosphorylation and mRNA expression
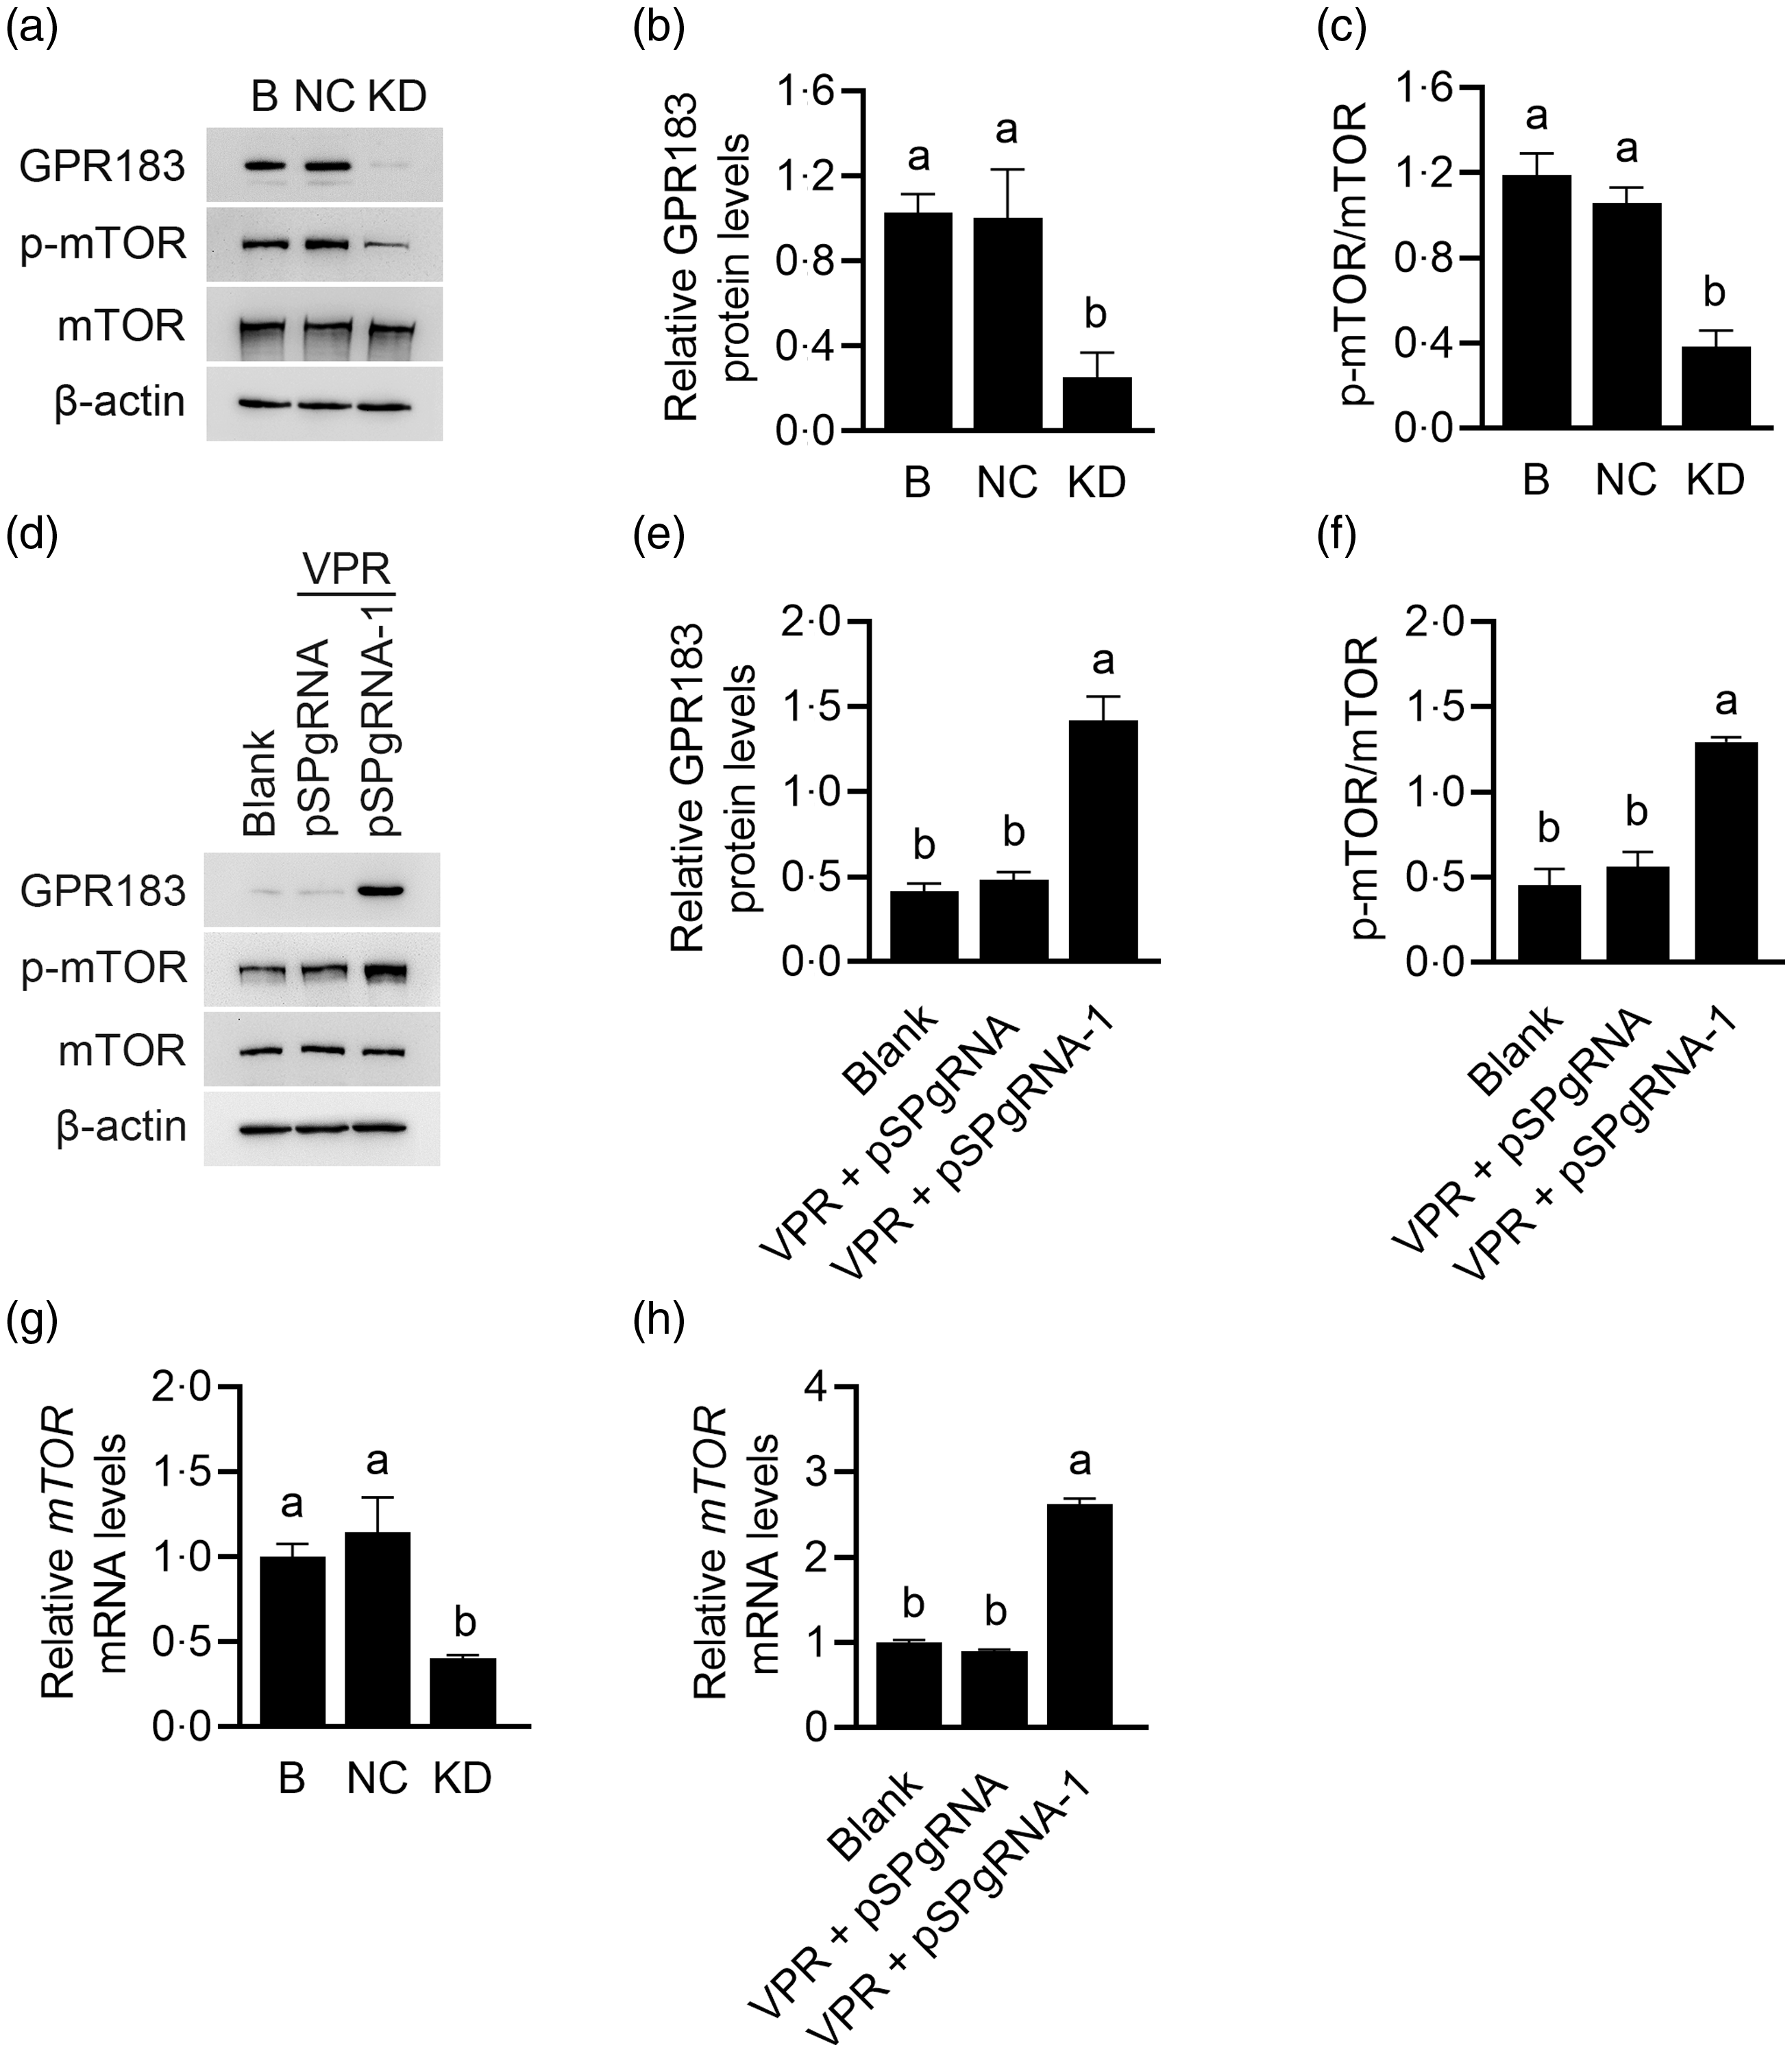
The effects of GPR183 on mTOR activation were further observed. GPR183 knockdown (Fig. 7(a) and (b)) significantly reduced mTOR phosphorylation (Fig. 7(a) and (c)), whereas GPR183 overexpression (Fig. 7(d) and (e)) had an opposite effect (Fig. 7(d) and (f)). RT-qPCR analysis detected a significant decrease in mTOR mRNA expression upon GPR183 knockdown (Fig. 7(g)). Conversely, GPR183 activation led to a marked increase in mTOR mRNA expression (Fig. 7(h)). These data demonstrate that GPR183 is a positive regulator of mTOR mRNA expression and protein activation.
Effects of G protein-coupled receptors (GPR183) on the mRNA expression and protein phosphorylation of the mechanistic target of rapamycin (mTOR). (a) Western blotting analysis of indicative protein levels in HC11 cells transfected with GPR183 siRNA-3. (b and c) Quantification by ImageJ of GPR183/β-actin (b) and p-mTOR/mTOR (c) from Western blots in (a). (d) Western blotting analysis of indicative protein levels in HC11 cells transfected with pSPgRNA-1. (e and f) Quantification by ImageJ of GPR183/β-actin (e) and p-mTOR/mTOR (f) from Western blots in (d). (g and h) RT-qPCR analysis of mRNA expression of mTOR in HC11 cells transfected with GPR183 siRNA-3 (g) or pSPgRNA-1 (h). Data were the mean ± se (n 3). Different letters marked above values indicate significant differences (P < 0·05).
Methionine stimulates G protein-coupled receptor 183 expression in a dose-dependent manner
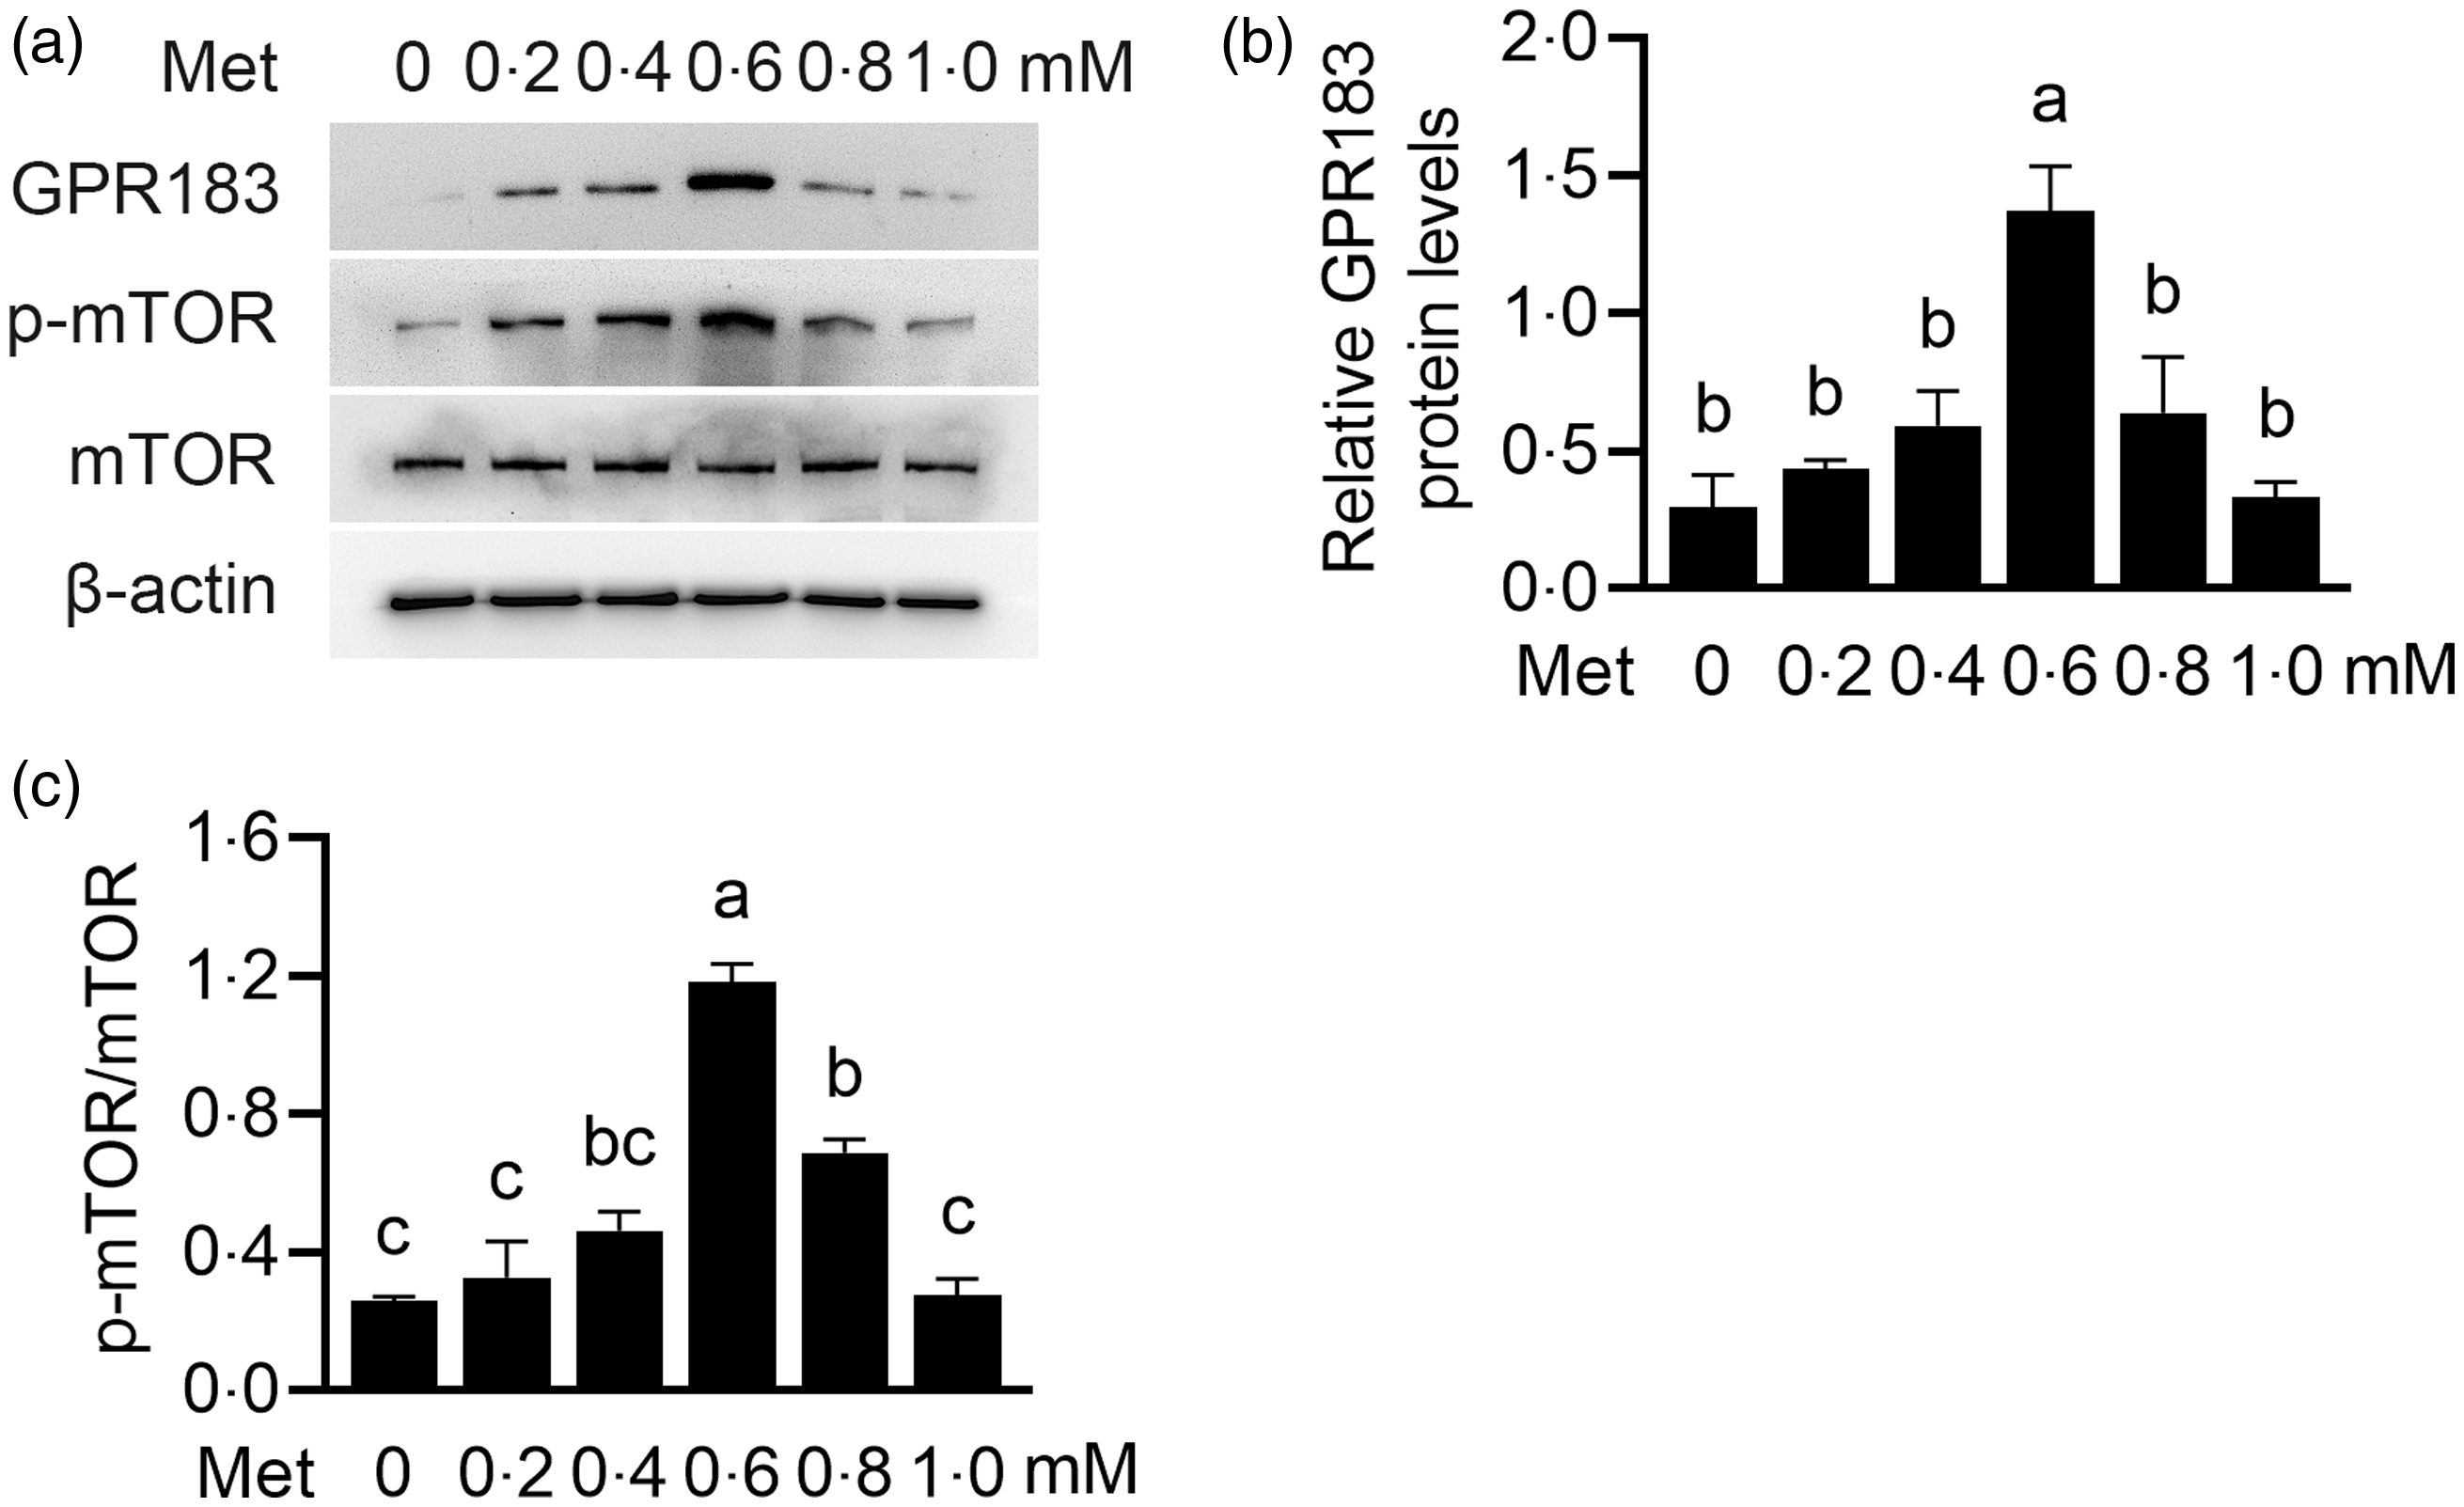
We further observed the influence of Met on HC11 cells. Cells were treated with Met (0, 0·2, 0·4, 0·6, 0·8 and 1·0 mM) for 24 h. GPR183 protein expression levels were gradually increased with increasing concentrations of Met (Fig. 8(a) and (b)). The peak expression was attained at a concentration of 0·6 mM, followed by a subsequent decline. Expectedly, the phosphorylation level of mTOR also had the same trend (Fig. 8(a) and (c)). These data suggest that, in responding to Met stimulation, the expression level of GPR183 can be changed to exert its regulatory role in sensing Met to activate mTOR.
Effect of methionine (Met) onGPR183 protein level in HC11 cells. (a) HC11 cells were treated with different concentrations of Met (0, 0·2, 0·4, 0·6, 0·8 and 1·0 mM). Indicated protein levels were detected by Western blotting. (b and c) Quantification by ImageJ of GPR183/β-actin (b) and p-mTOR/mTOR (c) from Western blots in (a). Data were the mean ± se (n 3). Different letters marked above values indicate significant differences (P < 0·05).
G protein-coupled receptor 183 mediates methionine stimulation on milk protein and fat synthesis, cell proliferation and mechanistic target of rapamycin activation
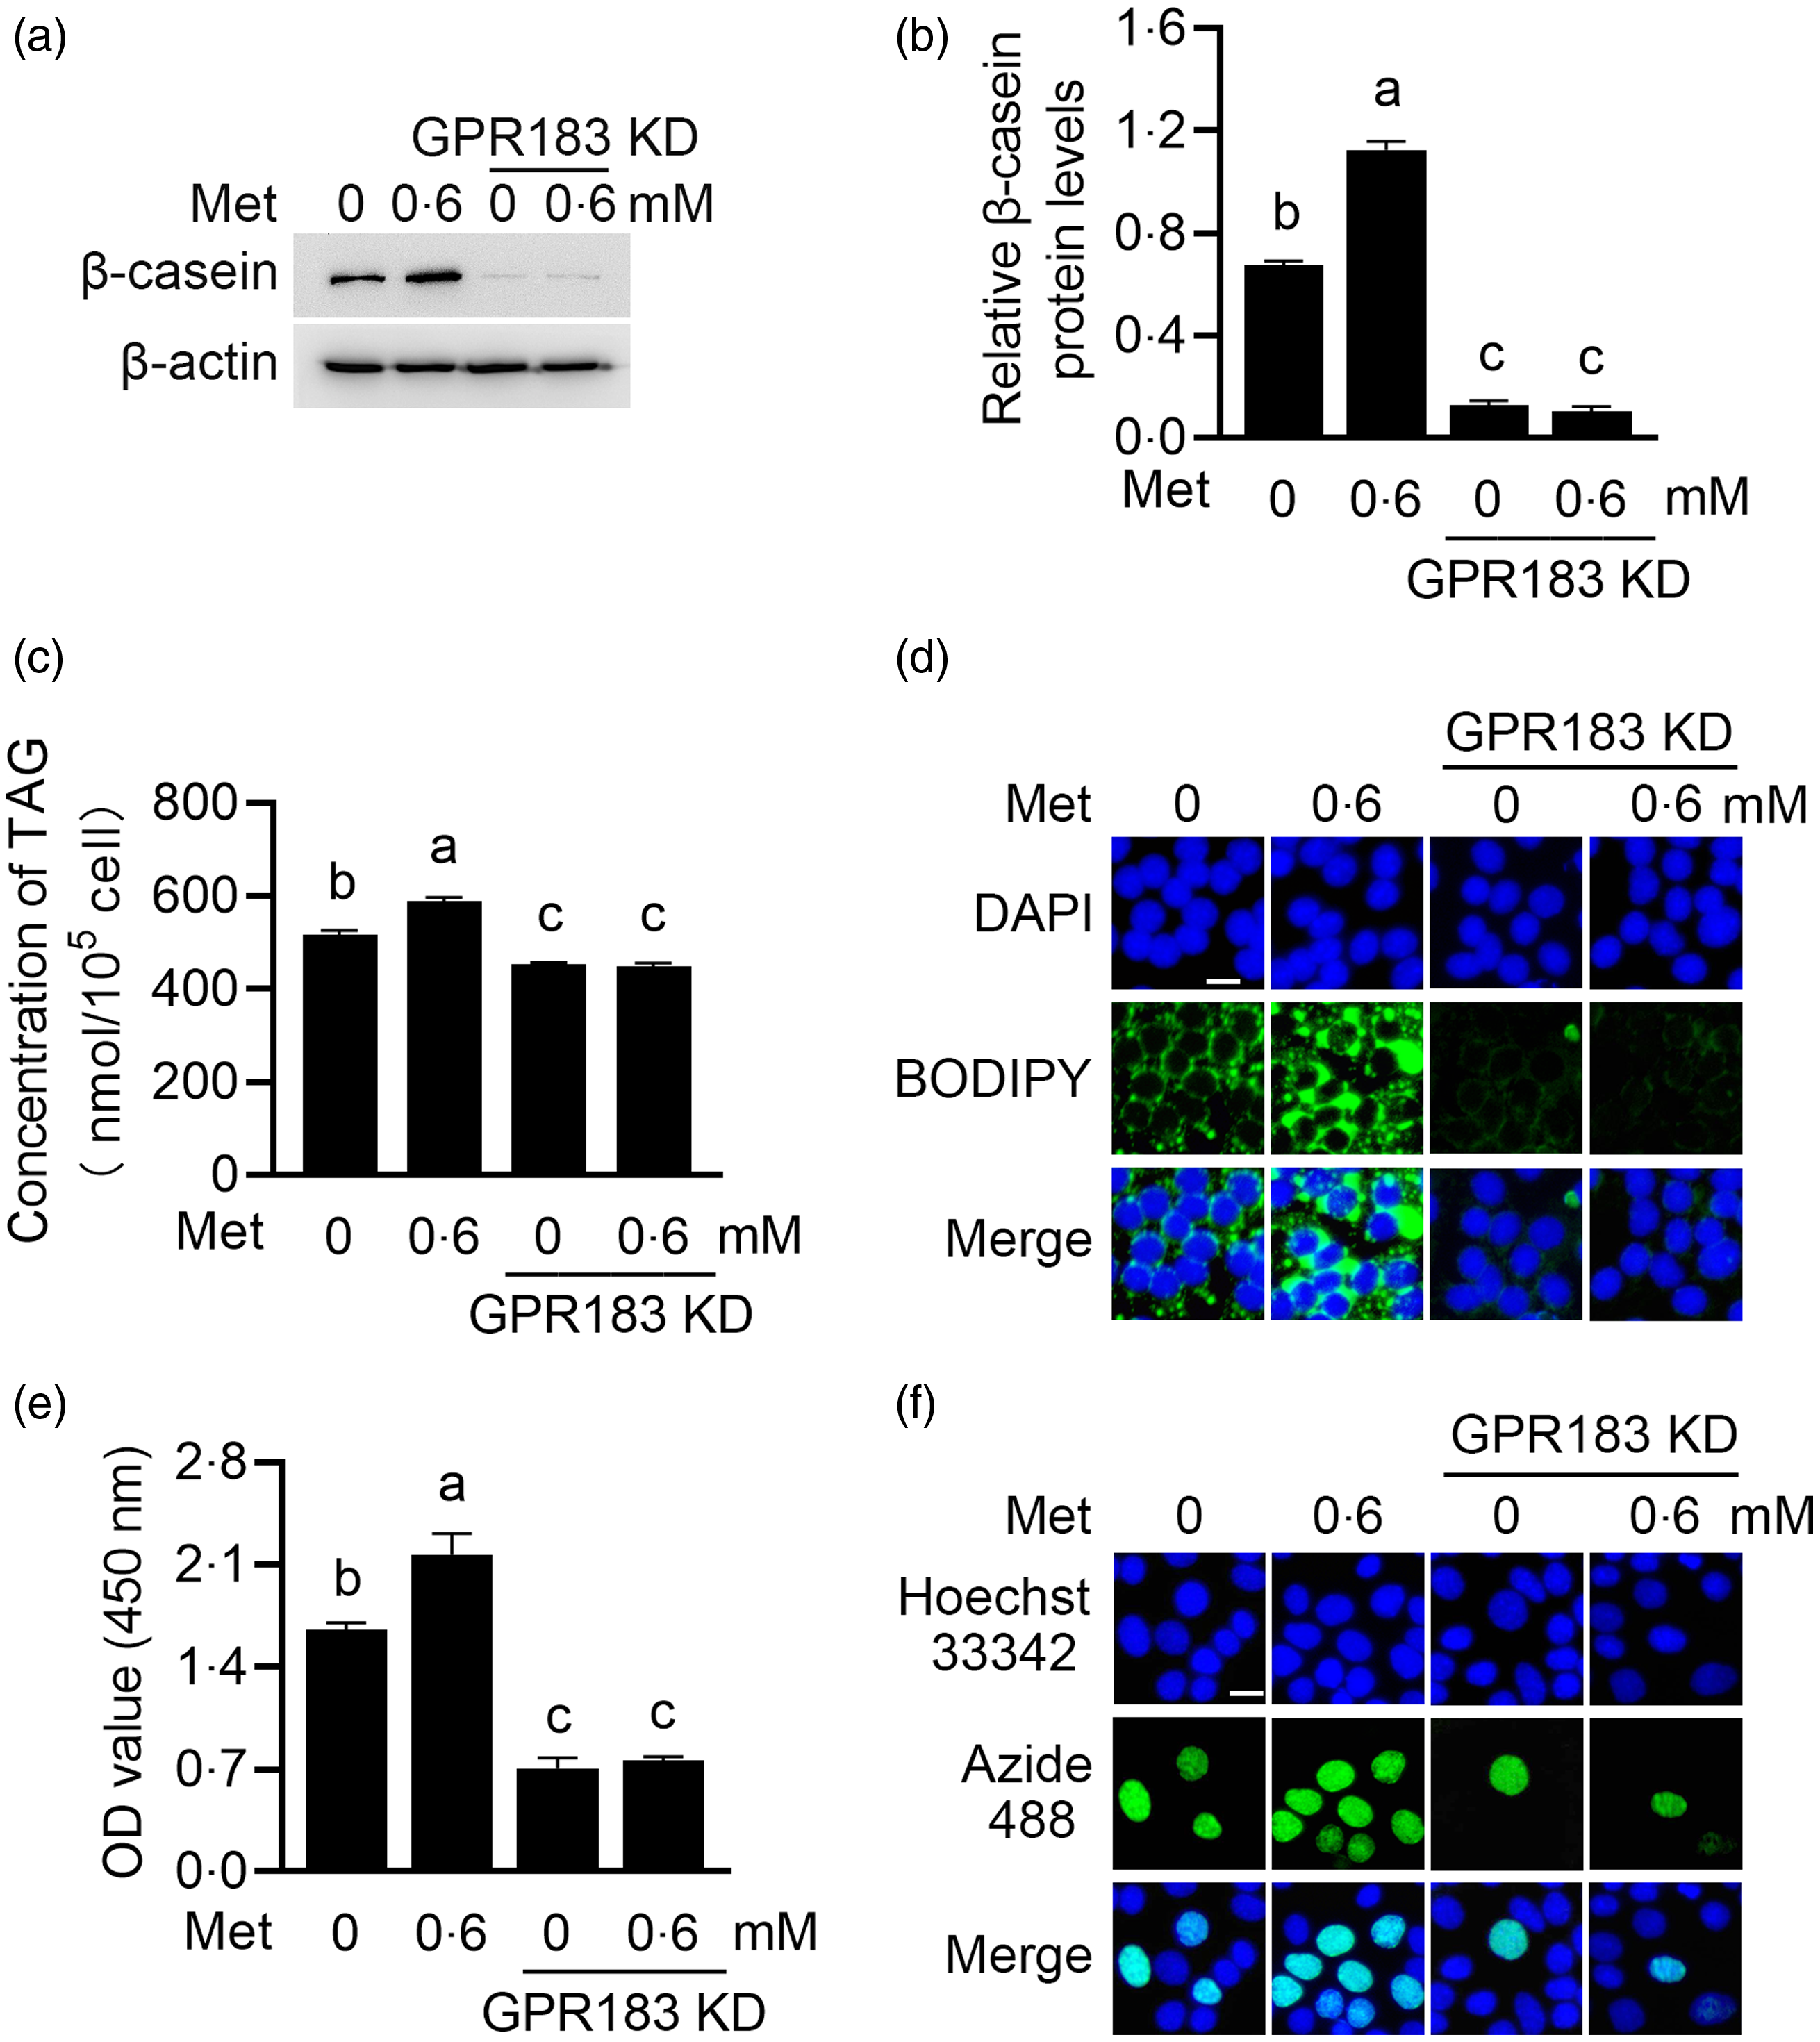
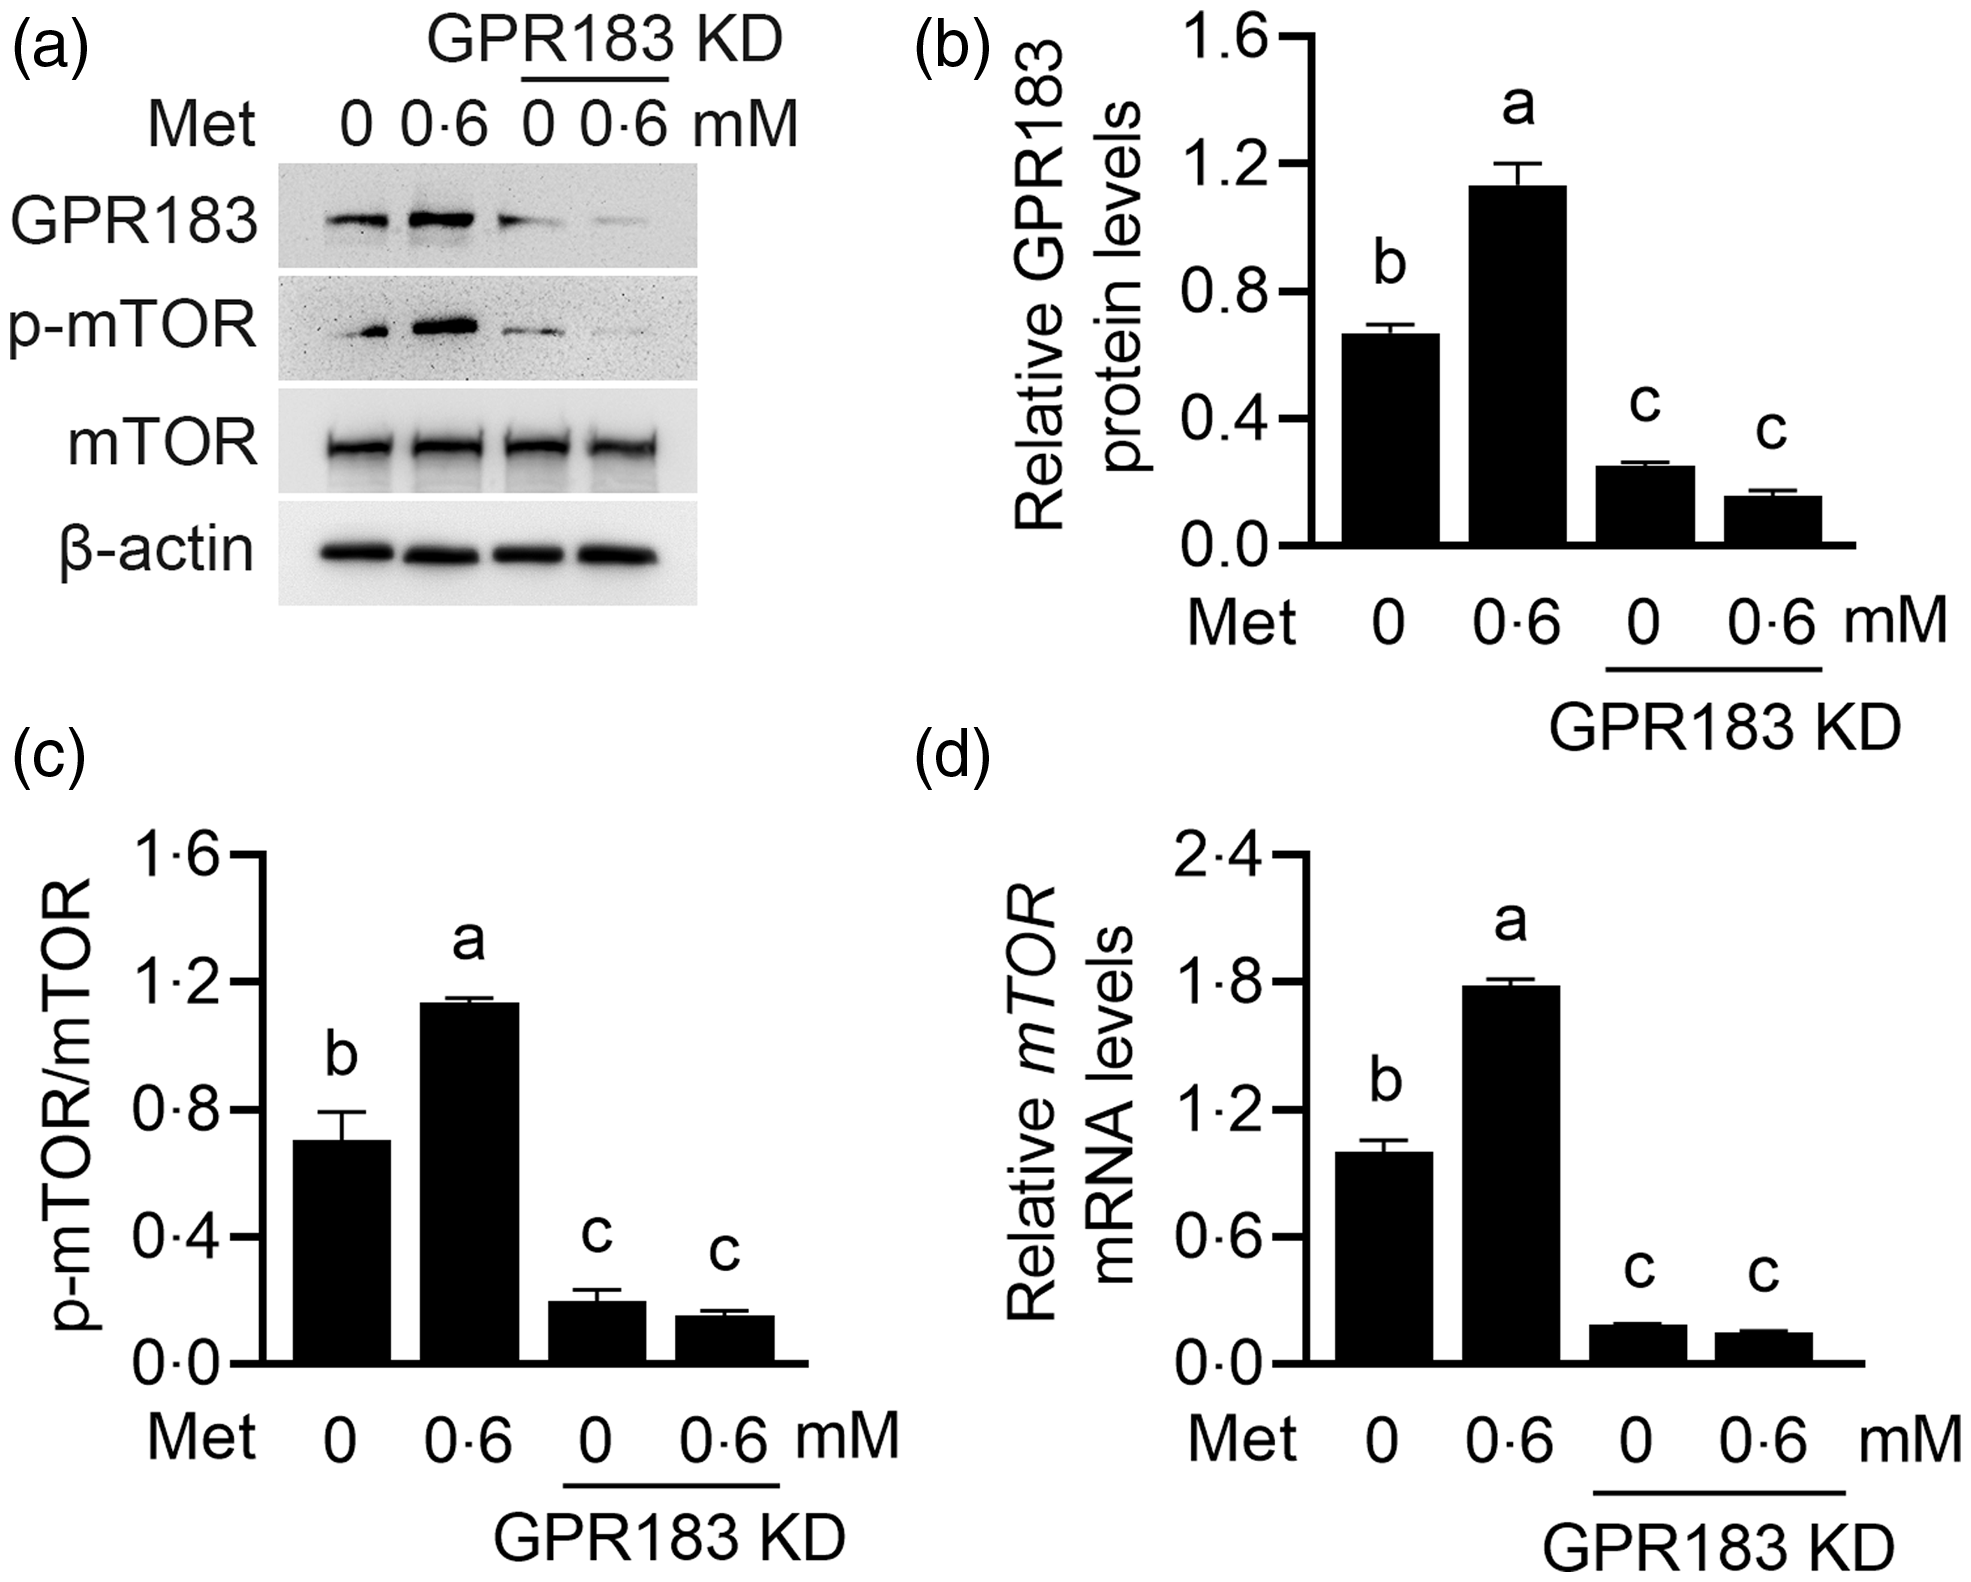
We next determined the effects of GPR183 in Met function on HC11 cells. GPR183 knockdown blocked the increase by Met of β-casein level (Fig. 9(a) and (b)) and content of TAG (Fig. 9(c)) and formation of lipid droplets (Fig. 9(d)) in cells and also cell number (Fig. 9(e)) and proliferation ability (Fig. 9(f)). GPR183 knockdown (Fig. 10(a) and (b)) also diminished the stimulation of Met on mTOR phosphorylation (Fig. 10(a) and (c)) and mRNA expression (Fig. 10(d)). Collectively, these data demonstrate that GPR183 is a key mediator for Met to stimulate mTOR phosphorylation and milk protein and fat synthesis and cell proliferation.
Effects of GPR183 on methionine (Met)-stimulated cell proliferation and milk protein and fat synthesis. (a) Western blotting analysis of β-casein protein levels in HC11 cells transfected with GPR183 siRNA-3 and treated with Met (0·6 mM) for 24 h. (b) Quantification by ImageJ of β-casein/β-actin from Western blots in (a). (c) The content of TAG in cells was detected by a TAG detection kit. (d) Lipid droplets in cells were observed using BODIPY staining. Lipid droplets labelled with BODIPY, green; nuclei labelled with 4,6-diamidino-2-phenylindole, blue. Scale bar = 15 μm. (e) CCK-8 assay of the number of cells transfected with GPR183 siRNA-3 and stimulated by Met (0·6 mM) for 24 h. (f) An EdU-488 cell proliferation detection kit was used to detect cell proliferation ability. Azide 488 labelled proliferating cells, green, and Hoechst 33 342 labelled nuclei, blue. Scale bar = 15 μm. Data were the mean ± se (n 3). Different letters marked above values indicate significant differences (P < 0·05).
Effects of G protein-coupled receptors 183 (GPR183) on methionine (Met)-stimulated mechanistic target of rapamycin (mTOR) mRNA expression and protein phosphorylation. (a) Cells were treated as in Fig. 9(a). Indicated protein levels were detected by Western blotting. (b and c) Quantification by ImageJ of GPR183/β-actin (b) and p-mTOR/mTOR (c) from Western blots in (a). (d) Quantitative real-time PCR analysis of mTOR mRNA expression. Data were the mean ± se (n 3). Different letters marked above values indicate significant differences (P < 0·05).
G protein-coupled receptor 183 stimulates the mechanistic target of rapamycin phosphorylation and mRNA expression in a PI3K-dependent manner
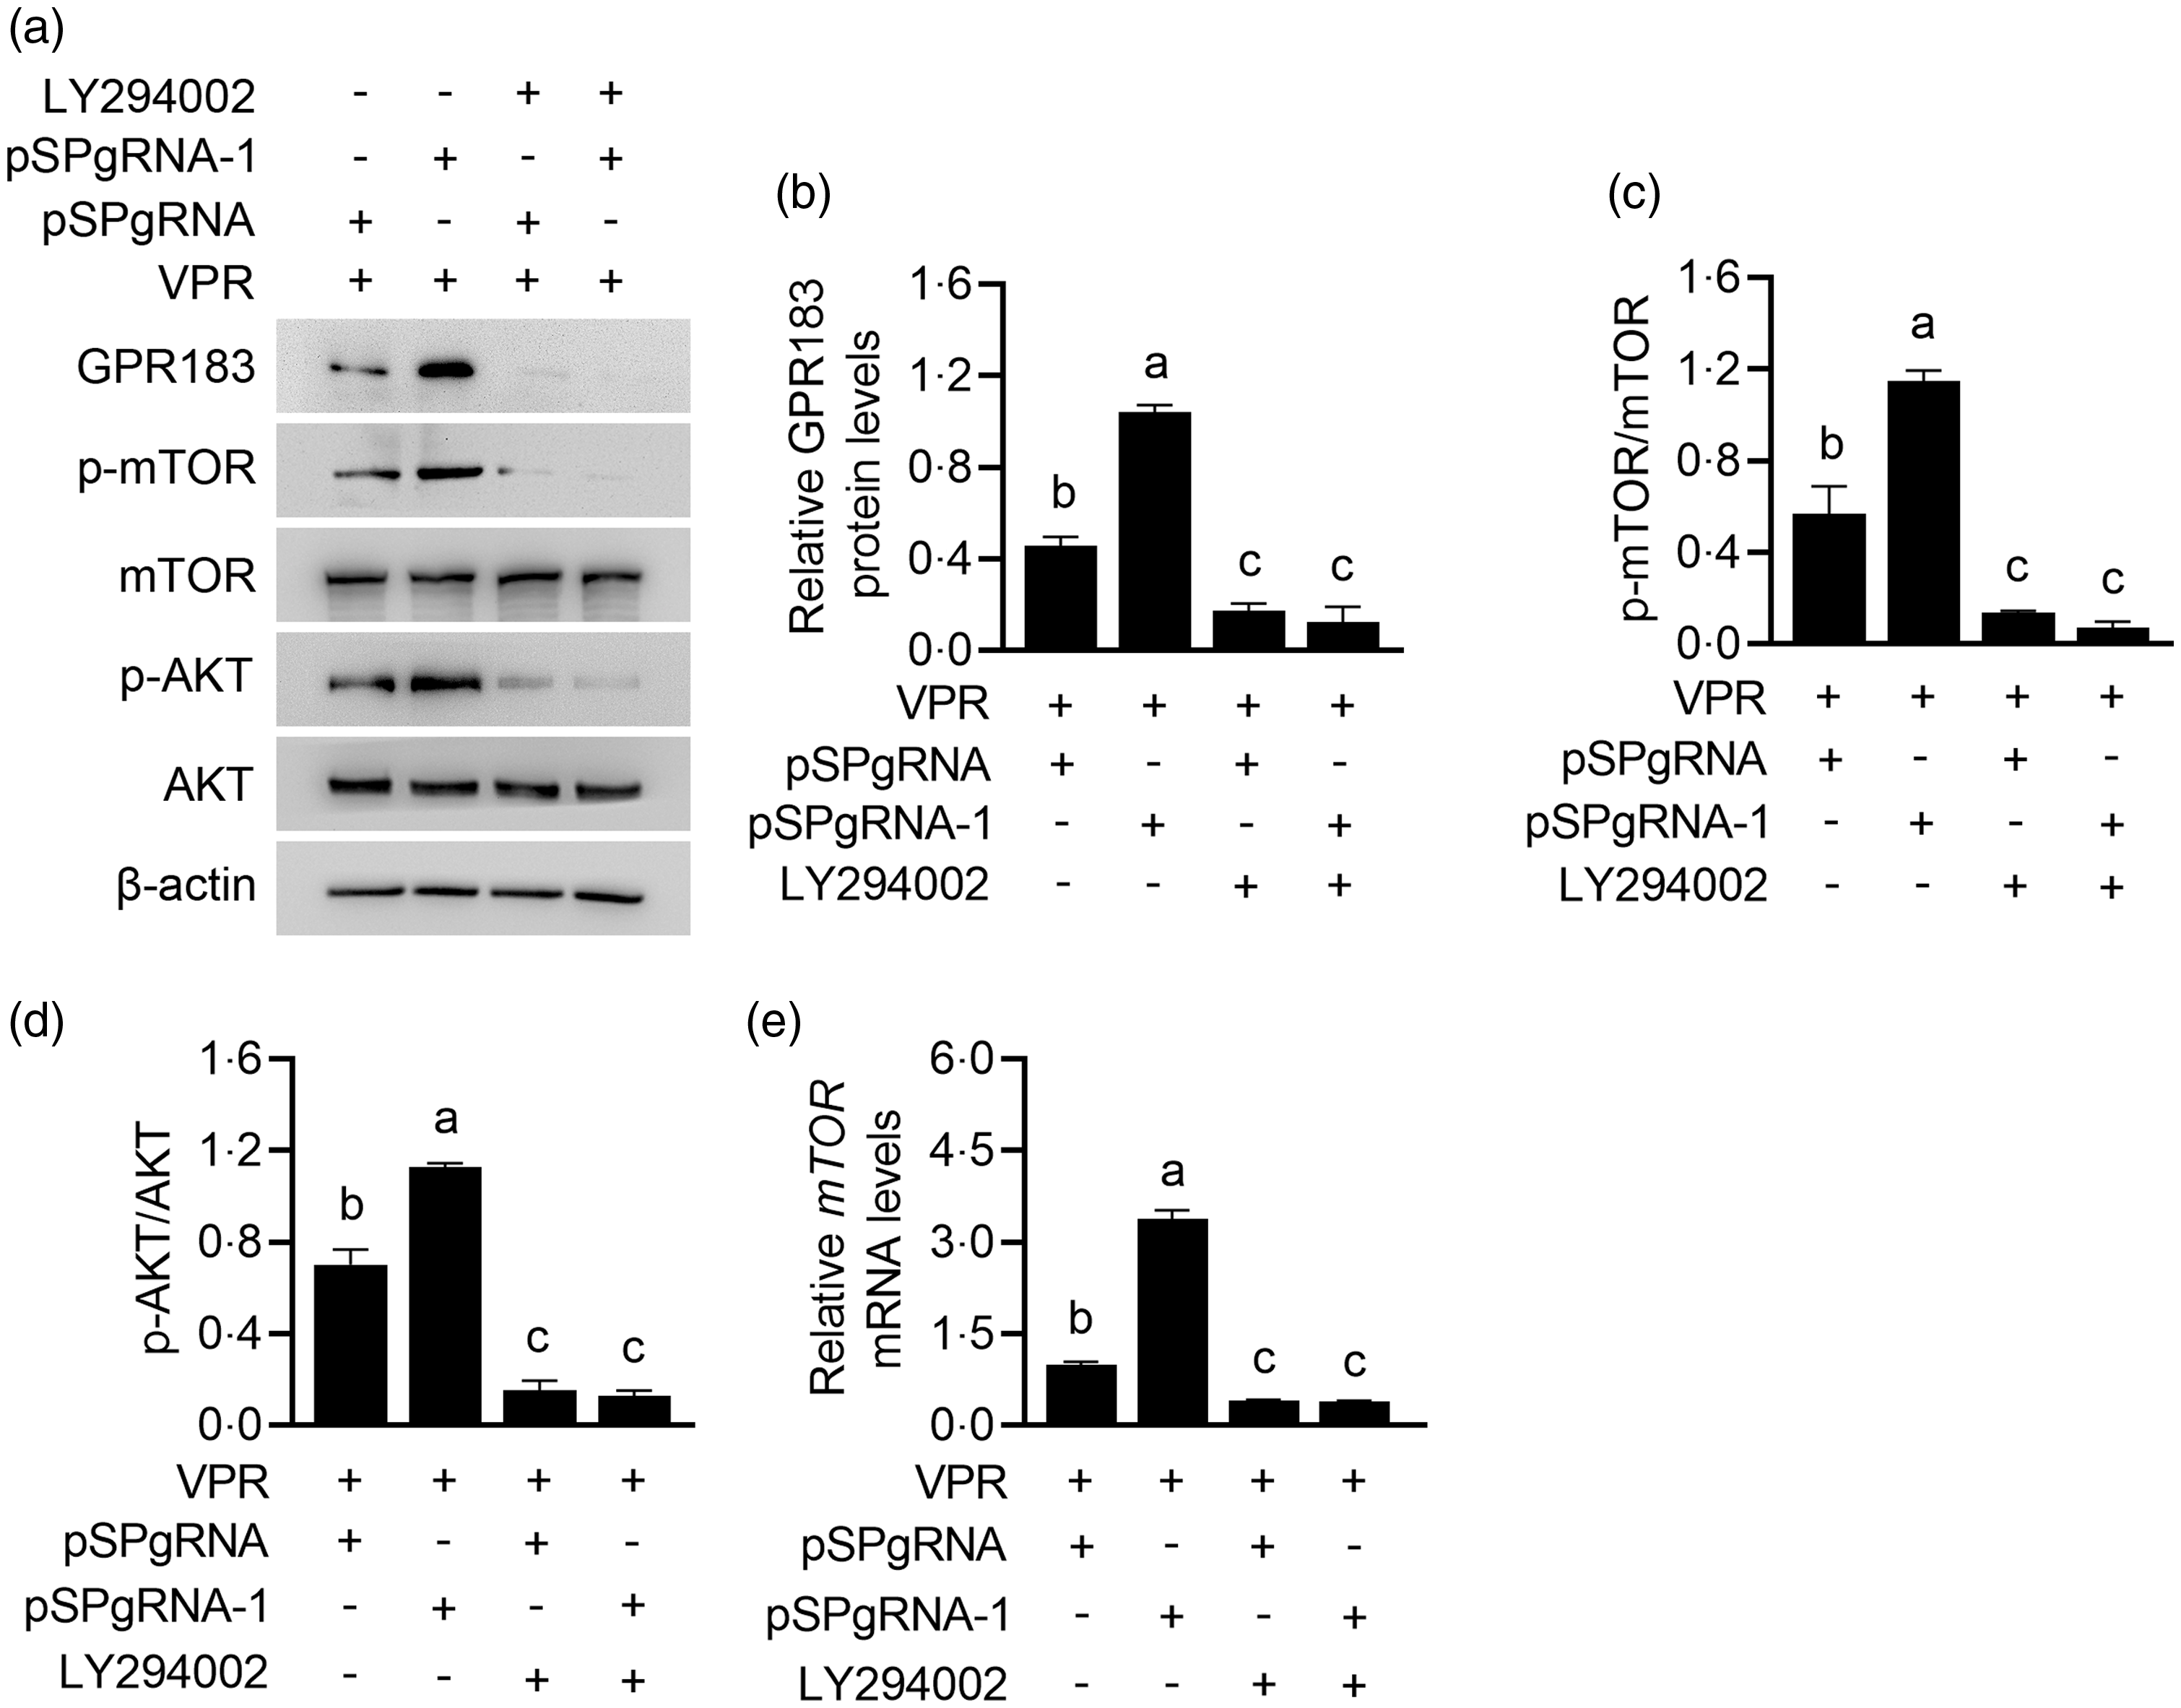
Since many GPCR can function through PI3K signalling, we further determined whether GPR183 can function in a PI3K-dependent manner. PI3K inhibition by LY294002 treatment almost entirely abrogated the induction of GPR183 overexpression (Fig. 11(a) and (b)) on mTOR (Fig. 11(a) and (c)) and AKT phosphorylation (Fig. 11(a) and (d)). The effect of LY294002 on PI3K inhibition was confirmed by the observation of AKT phosphorylation, which is a direct substrate of PI3K (Fig. 11(a) and (d)). PI3K inhibition also abrogated the induction of GPR183 overexpression on mTOR mRNA expression (Fig. 11(e)). We noted that PI3K inhibition also markedly decreased GPR183 expression, indicating that there might be a positive feedback mechanism in GPR183 signalling to PI3K activation. Collectively, these data suggest that GPR183 might regulate mTOR phosphorylation and mRNA expression in a PI3K-dependent manner.
Effect of phosphoinositide 3-kinase inhibition on G protein-coupled receptors 183 (GPR183)-stimulated mechanistic target of rapamycin (mTOR) mRNA expression and phosphorylation. (a) HC11 cells were transfected with pSPgRNA-1 and treated with LY294002 for 48 h. Indicated protein levels were detected by Western blotting. (b–d) Quantification by ImageJ of GPR183/β-actin (b), p-mTOR/mTOR (c) and p-AKT/AKT (d) from Western blots in (a). (e) Quantitative real-time PCR analysis of mTOR mRNA expression.
Discussion
GPCR represent the largest family of cell surface receptors. Though it has been reported that a few GPCR can sense several different amino acids, the GPCR sensing Met remains elusive. In this study, DEG analysis of RNA-seq libraries showed that 129 genes were differently expressed between blank and Met-treated HC11 cells, in which 59 genes were upregulated in cells treated with Met, while 70 genes were downregulated. From these, we further identified a subset of upregulated GPCR, encompassing nine members: Gpr183, Gpr171, Gpr31b, Gpr141, Gpr21, Gprc5d, Mrgprf, Mrgprb3 and Mrgprx2, and most of them were validated by RT-qPCR analysis. We further showed that GPR183 was highly expressed in mouse mammary tissue during the lactation stage. Gene function study demonstrates that GPR183 positively regulates mTOR phosphorylation and mRNA expression, milk protein and fat synthesis and cell proliferation. Met can affect GPR183 expression in a dose-dependent manner, and GPR183 mediates the impact of Met on mTOR phosphorylation and mRNA expression, milk protein and fat synthesis and cell proliferation. GPR183 functions in a PI3K-dependent manner.
GPR183 is known as a chemotactic receptor, playing important role in B cell maturation, and its endogenous ligand is 7α,25-dihydroxycholesterol(Reference Braden, Giancotti and Chen28). GPR183 can produce hypersensitivity in the spinal cord through the mitogen-activated protein kinase (MAPK) and NF-κB signalling pathways(Reference Braden, Campolo and Li29). Our experimental data uncover that GPR183 mediates Met signalling to mTOR activation and milk protein and fat synthesis and cell proliferation. Though it has not been reported that GPR183 can participate in Met sensing, a few recent reports have pointed that GPR183 can regulate the mTOR signalling pathway, in support of our finding. GPR183 can mediate the induction of 7α,25-dihydroxycholesterol on oxiapoptophagy of mouse fibroblast cells(Reference Kim, Lim and Seo30), and a recent report uncover that GPR183 functions through regulating the PI3K-mTOR signalling pathway(Reference Seo, Kim and Kang31). Our experimental data suggest that GPR183 might be the receptor of Met, which is worth exploring in future studies.
Our experimental data validated that 0·6 mM Met is the optimal concentration of Met to influence β-casein synthesis and proliferation of mouse MEC, in agreement with previous reports(Reference Qi, Meng and Jin18,Reference Lin, Qi and Guo32) . At 0·6 mM concentration, Met has the best stimulatory effect on the expression of GPR183, which can mediate Met induction of mTOR activation. At this concentration, Met can also stimulate the expression of the typical amino acid transporters such as SNAT2, which can transport Met into cells for its utilisation, to activate mTOR(Reference Qi, Meng and Jin18). It is still unknown whether GPCR is a competitor of Met transporters for mTOR activation, or they may collaborate to activate mTOR under Met stimulation.
It is still largely unknown the exact GPCR sensing Met. Several GPCR have been reported on the receptors of amino acids. Previous reports have pointed out that the GPCR T1R1-T1R3, a class C GPCR, can sense l-amino acids such as Phe, Leu and Glu, and T1R1-T1R3 partly mediates amino acid signalling to mTOR activation(Reference Daly, Al-Rammahi and Moran33–Reference Wauson, Zaganjor and Cobb35). GPRC6A can be activated by multiple ligands including basic amino acids such as Lys(Reference Pi, Nishimoto and Quarles15,Reference He, Su and Gao36) . We have previously shown that Met and taurine can stimulate mTOR phosphorylation and milk synthesis in MEC in a GPR87-dependent manner(Reference Luo, Yu and Li19,Reference Yu, Wang and Wang37) , but the detailed mechanism is still unknown. In this study, we demonstrate that Met stimulates milk protein and fat synthesis and cell proliferation in a GPR183-dependent manner. In the future study, to uncover whether GPR183 is a GPCR sensing Met, we need to determine the N-terminal binding site for Met in GPR183 protein and which G protein transmits the signal of GPR183 to activate the PI3K-mTOR signalling.
We showed that GPR183 mediated Met stimulation on mTOR mRNA expression and protein phosphorylation. This observation is consistent with previous reports. It has been well-established that amino acids can directly activate mTOR in the cytoplasm(Reference Wolfson and Sabatini38). We have previously shown that the activation of mTOR by amino acids such as Met, Leu and taurine also depends on its transcriptional activation, which will provide sustained mTOR protein for phosphorylation(Reference Ke, Zhao and Wang39–Reference Huo, Yu and Li42). From these previous reports and our experimental data, we conclude that Met and GPR183 can promote mTOR mRNA expression and activation.
In summary, this study identifies a total of 129 DEG in HC11 cells under Met stimulation. Furthermore, we elucidate that GPR183 is a positive regulator mediating Met stimulation on milk protein and fat synthesis and cell proliferation through activating the PI3K-mTOR signalling. Our findings would furnish novel theoretical underpinnings for the application of Met in milk production.
Acknowledgements
This work was supported by grants from the National Natural Science Foundation of China (No. 31671473).
Y. Z.: Perform experiments, collect and analyse data and write the manuscript. M. X. and S. F.: Perform experiments. M. Z.: Funding and analyse data. X. G.: Design experiments and write and review the manuscript.
The authors declare that they have no known competing financial interests or personal relationships that could have appeared to influence the work reported in this paper.
The data that support the findings of this study are available from the corresponding author upon reasonable request.
Supplementary material
For supplementary material/s referred to in this article, please visit https://doi.org/10.1017/S0007114524001223.



