





I. INTRODUCTION
Characterizing the disordered structure of glass at the atomic level remains a grand challenge. On the macroscopic level, glass is structurally homogenous and isotropic; only two independent elastic constants are needed to characterize its elasticity. Elastic constants are simple to define and easy to measure/calculate, and are directly related to the interatomic forces and potentials, embodying the local structure and bonding information. Reference Rouxel1,Reference Wang2 Therefore, perturbing the glass with thermal or mechanical agitation (e.g., temperature, pressure, or strain) and measuring the changes in elastic moduli can be used as a probe to gain insights into the atomic level structure of glass. Elastic moduli and their dependence on temperature, pressure, or strain are also critical inputs for developing and validating computer models of glasses with accurate short- and long-range interactions. Inversely, reliable computer models can complement experiments to obtain detailed structure–property relationships, which are crucial for the design of glasses with desired properties.
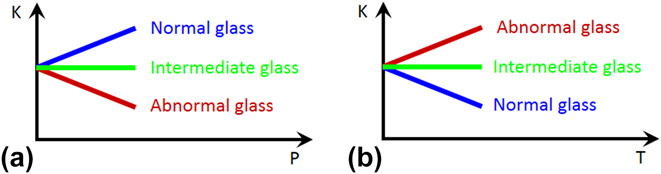
To demonstrate this approach, it would be ideal to start from a simple glass composition and change one parameter at a time to tune the elastic response of glass to pressure or temperature from abnormal to intermediate and to normal, or vice versa (see Fig. 1). A normal solid becomes stiffer when squeezed and softer when heated. In contrast, silica glass behaves the opposite way: its elastic moduli decrease upon compression and increase upon heating. Reference Kondo, Lio and Sawaoka3–Reference Zha, Hemley, Mao, Duffy and Meade5 In other words, silica glass has a positive temperature derivative and a negative pressure derivative of elastic modulus, opposite to normal glasses, such as soda-lime window glass. In between, intermediate glass with temperature or pressure independent elastic moduli can be obtained. Reference Dragic, Hawkins, Foy, Morris and Ballato6–Reference Zhao, Guerette, Scannell and Huang9 In this study, by either pressure-quenching, helium-stuffing, or alkali-modifying silica glass, we can change its elastic response to pressure systematically, i.e., to have a negative, zero, and positive slope. Then, by scrutinizing the structural differences among these three types of glasses in molecular dynamics (MD) simulations, we uncovered the structural origin of the elastic anomaly in silica glass, which can be attributed to localized structural transitions, analogous to those that occur in its crystalline counterparts. Furthermore, our studies show that the elastic anomaly of silica glass is inherently connected to the ability of the glass to undergo irreversible densification through either isothermal compression Reference Grimsditch10–Reference Rouxel, Ji, Guin, Augereau and Rufflé17 or heating under constant pressure. Reference Roy and Cohen18 By preparing silica glass in ways that eliminates the elastic anomaly, e.g., by pressure-quenching or He-stuffing, the propensity of the glass to undergo irreversible densification can be eradicated. Therefore, we can tune the structure and properties of silica glass in a controllable manner via processing. This is gained from a deeper understanding of the structure–property relationships at the microscopic level from MD simulations.
(a) Elastic modulus (K) as a function to pressure (P) in abnormal, intermediate, and normal glass. (b) Elastic modulus (K) as a function to temperature (T) in abnormal, intermediate, and normal glass.
The rest of the paper is organized as follows. Experimental and computational details are provided in Sec. II. A and B, respectively. Effects of pressure-quenching and helium-stuffing on the elastic anomaly and the irreversible densification of silica glass are presented in Sec. III. A. The structural origin of the elastic softening upon initial compression in silica glass is given in Sec. III. B. Structural changes with the increase of quench pressure and helium addition and their effects on the elastic anomaly are discussed in Sec. III. C. Section III. D briefly summarizes the correlation between the elastic anomaly and the irreversible densification of silica glass. Finally, conclusions are drawn in Sec. IV.
II. EXPERIMENTAL AND COMPUTATIONAL DETAILS
A. Experiments
Starting silica glass used in pressure-quenching process is Suprasil 300 with low OH content (≤1 ppm). Silica glass was compressed to specified pressure first, then heated to 1100 °C (T g ≈ 1200 °C) and held hydrostatically under this pressure and temperature for 30 min, followed by rapid quenching to room temperature before the pressure was released. Reference Guerette, Ackerson, Thomas, Yuan, Watson, Walker and Huang7 We stayed below the glass transition temperature with aims to allow some structural softening without allowing enough structural mobility for crystallization. Samples quenched under pressures up to 4 GPa were prepared in a piston-cylinder (PC) apparatus, Reference Boyd and England19 which has a practical working limit of 4 GPa, while 6 and 8 GPa pressure-quenched samples were synthesized in a Walker-type multianvil (MA) device. Reference Walker, Carpenter and Hitch20 Cylinders of 3 mm in diameter were core-drilled from a puck of the starting material and cut to 6 mm in length for PC experiments and 3 mm in length for use in MA. Details of the pressure-quenching process can be found in our previous publication. Reference Guerette, Ackerson, Thomas, Yuan, Watson, Walker and Huang7
A six-pass high contrast Fabry-Pérot interferometer was used to carry out in-situ high pressure light scattering experiments by using a 532 nm green laser as the probing light source. A membrane-driven diamond anvil cell (DAC) was used to generate hydrostatic pressures up to 26 GPa. A glass sample (∼100 × 100 × 20 μm in size), ruby ball (5–10 μm in diameter, as pressure calibrant), and pressure transmitting medium (PTM) were loaded into a hole drilled in a stainless steel gasket. Pressure in the DAC was determined from the pressure dependent ruby fluorescence shift. Reference Datchi, Dewaele, Loubeyre, Letoullec, Godec and Canny21 Hydrostatic conditions up to 15 GPa were achieved by using 4:1 methanol:ethanol mixture as the PTM. For tests above 15 GPa, liquid argon was cryogenically loaded into DAC to act as the PTM. After certain pressure was reached in the DAC, the sample was allowed to equilibrate for 15–20 min before any measurement was taken. Longitudinal Brillouin frequency shift (from which the longitudinal modulus can be calculated given the sample density and refractive index) was obtained from the backscattering geometry in the DAC by using a lens with f = 50.8 mm. Repeated measurements gave errors in Brillouin frequency shifts to be ∼0.1 GHz, errors in pressures were estimated by repeated measurements to be within 0.1 GPa.
B. Molecular dynamic simulations
All MD simulations were carried out in the Large-scale Atomic/Molecular Massively Parallel Simulator package. Reference Plimpton22 A charge-transfer three-body potential was used to describe the interactions in silica Reference Huang and Kieffer23,Reference Huang and Kieffer24 and sodium silicate glasses Reference Upadhyay, Sebeck and Kieffer25 (parameters were re-optimized to have elastic moduli as a function of composition in better agreement with experiment, details will be published elsewhere). 12-6 Lennard–Jones interaction parameters between He and other ions (such as Si and O) were taken from Guissani and Guillot's work Reference Guissani and Guillot26 on transport properties of inert atoms in silica glass. The columbic interaction was calculated via the Ewald summation technique with a relative precision of 10−5 in force. Velocity Verlet algorithm with a time step of 1.6 fs was used to integrate the Newton's equations of motion. Periodic boundary conditions were imposed in all simulations. Nose–Hover thermostat Reference Nosé27 and barostat Reference Shinoda, Shiga and Mikami28 were utilized to control the temperature and pressure of the sample when necessary. Four parallel samples were used in all simulations.
Silica liquid of 3000 atoms was obtained by heating cristobalite up to 7000 K and equilibrating it for at least 1 ns before certain pressure was applied, followed by quenching to 300 K with a cooling rate of 10 K/ps under the NPT ensemble (constant number of atoms, constant pressure, and constant temperature). Reference Yuan and Huang29 Densified and stress-free samples were obtained by releasing the pressure followed by relaxation for 20 ps at 300 K.
Normally processed silica (i.e., without any pressure applied during the quenching process) was used for He-stuffing by a random insertion method as follows:
-
(i) Randomly insert a certain number of He atoms into the starting glass sample at 300 K.
-
(ii) Heat the He-stuffed silica glass up to 1200 K and equilibrate for over 1 ns and cool down to 300 K under the NVT ensemble (constant number of atoms, constant volume, and constant temperature).
-
(iii) Release the internal pressure to obtain a stress-free He-stuffed silica glass.
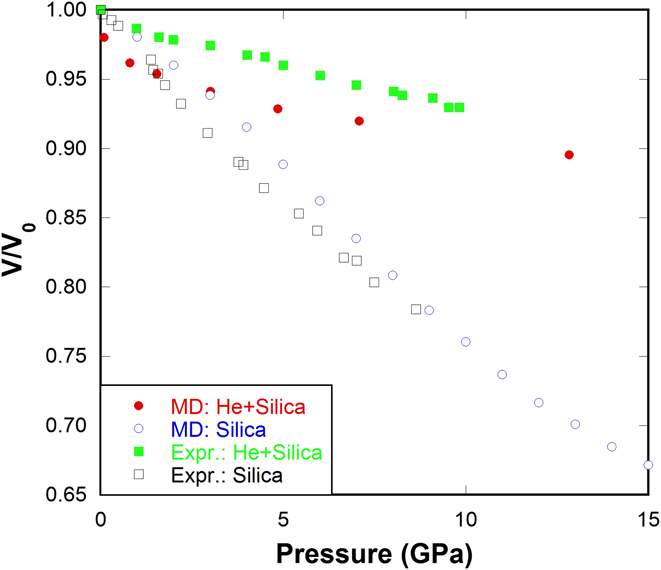
By using the above procedure, various concentrations of He in silica glass can be obtained, namely 0.2, 0.4, 0.6, 0.8, 1.0 (mol He)/(mol SiO2). This random insertion method can successfully reproduce the compression behavior of He-stuffed silica glass as observed in experiments Reference Sato, Funamori and Yagi30–Reference Weigel, Polian, Kint, Ruffle, Foret and Vacher32 (Fig. 2). The inclusion of He atoms into silica network substantially suppresses the volume shrinkage under pressure, which is observed in both our MD simulations and in experiments. Reference Sato, Funamori and Yagi30–Reference Weigel, Polian, Kint, Ruffle, Foret and Vacher32
Normalized volume versus pressure for silica glass and He-stuffed silica glass in our MD simulations compared with those from Weigel's experiments. Reference Weigel, Polian, Kint, Ruffle, Foret and Vacher32
Na2O–SiO2 glass samples with a system size of 3000 atoms of compositions ranging from 0 to 40% Na2O were prepared by the melt-quench process. Atoms were placed randomly in the simulation box such that they satisfy the composition requirements, with a Gaussian velocity distribution assigned to them so that the system temperature is 300 K. The system was then heated to around 5000 K in the NVT ensemble at a heating rate of 50 K/ps. The volume of the simulation box was adjusted to match the experimental density for each composition and then allowed to equilibrate in the liquid state for at least 200 ps. Samples were then quenched to 300 K in the NVT ensemble at a quenching rate of 20 K/ps and relaxed in the NPT ensemble for 40 ps to remove any residual pressure.
To study pressure dependent elastic modulus, each glass sample was compressed between 0 and 15 GPa at 1 GPa intervals at a compression rate of 0.5 GPa/ps. The bulk modulus of glass was calculated directly from the equation of state according to B = ρ(dP/dρ). To overcome the limitation of time in MD simulations, pressure-quenched and He-stuffed silica glass samples were heated to 1000 K and compressed to 20 GPa to facilitate the densification process. Further computational details can be found in our previous publications. Reference Huang, Duffrene and Kieffer33–Reference Huang and Kieffer35
III. RESULTS AND DISCUSSION
A. Elastic anomaly and irreversible densification
Figure 3(a) shows that for normally processed silica glass, the longitudinal Brillouin frequency shift initially decreases with pressure, reaches a minimum around 2–3 GPa, then increases as a normal solid. This is related to the well-known elastic anomaly of silica glass under pressure. Reference Kondo, Lio and Sawaoka3,Reference Zha, Hemley, Mao, Duffy and Meade5 With the increase of quench pressure, the minimum in the frequency shift decreases and displaces to higher pressure, and eventually disappears in the 6 and 8 GPa pressure-quenched samples. For the 6 GPa sample, the frequency shift does not change with pressure up to 5–6 GPa (an intermediate behavior), then adopts a slightly positive slope similar to that of the 8 GPa sample. Such intermediate glass would be ideal materials of choice for devices that may experience thermal and mechanical shocks during service, especially in systems made of different materials where strain mismatch can develop across the interfaces after such huge thermo-mechanical impact.
(a) Longitudinal frequency shift in pressure-quenched silica glass samples as a function of pressure from in-situ high pressure Brillouin light scattering experiments. (b) Longitudinal frequency shift in pressure-quenched silica glass samples during compression and decompression cycle from in-situ high pressure Brillouin light scattering experiments. Legend indicates the pressure at which the sample was quenched in experiments and pressure along the x-axis is what was applied during in-situ measurements in DAC at room temperature. Data for 0 GPa silica glass in (b) were taken from Sonneville et al. Reference Sonneville, Mermet, Champagnon, Martinet, Margueritat, de Ligny, Deschamps and Balima36
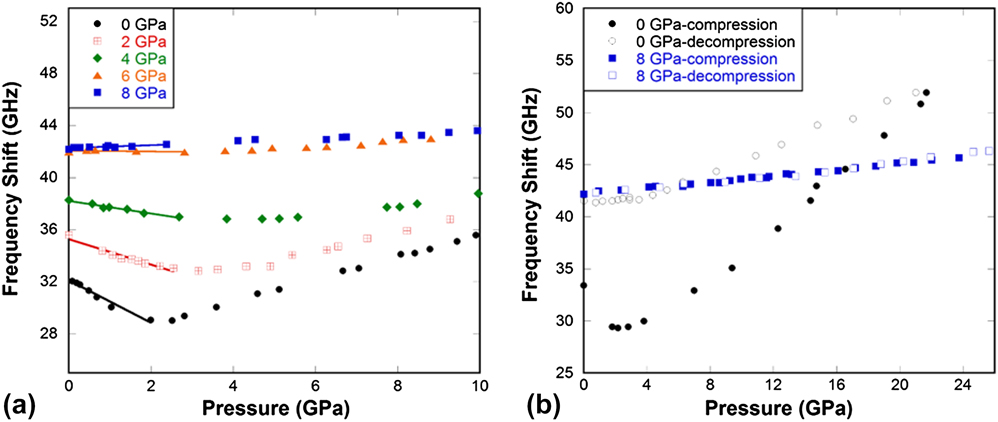
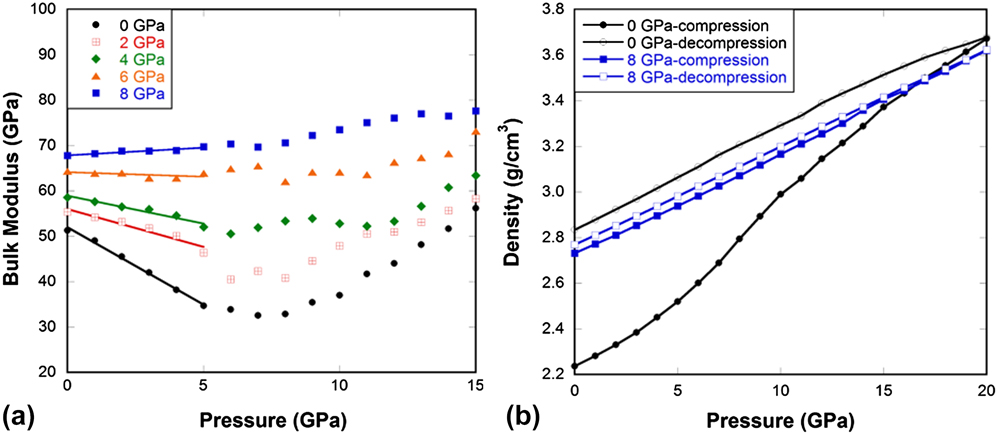
Figure 4(a) shows that MD simulated silica glass exhibits an initial decrease in bulk modulus with pressure until it reaches a minimum at approximately 6–8 GPa. The minimum occurs at slightly higher pressures compared to experiments, probably because of the high compression rate (∼0.1 MPa/ps) and the deficiency of the force field as it overestimates the bulk modulus of silica glass at ambient conditions (52 GPa versus 37 GPa from experiments Reference Guerette and Huang37 ). Nevertheless, the anomalous decrease in elastic modulus with increasing pressure upon initial compression is very well reproduced. Our computational study is in good agreement with previous studies Reference Grimsditch10,Reference Sonneville, Mermet, Champagnon, Martinet, Margueritat, de Ligny, Deschamps and Balima36 and with observations from our experiments [Fig. 3(a)] that the elastic anomaly progressively vanishes with the degree of densification during pressure-quenching. Similar to experimental observations, the bulk modulus of the 6 GPa sample is independent of pressure in the low pressure range, while the 8 GPa sample gets stiffer upon compression as a normal solid does.
(a) Bulk modulus in pressure-quenched silica glass samples as a function of pressure at 300 K from MD simulations. (b) Density of pressure-quenched silica glass samples during compression and decompression cycle at 1000 K from MD simulations. Legend indicates the pressure at which the sample was quenched in MD simulations and pressure along the x-axis is what was applied during compression at room temperature.
Interestingly, almost parallel behaviors are observed in He-stuffed silica glass [Fig. 5(a)] as in pressure-quenched samples. Increasing the amount of He has the same effect of increasing quench pressure. Silica glass gradually changes from abnormal, to intermediate and to normal behavior with the increase of He content. Weigel's experiments Reference Weigel, Polian, Kint, Ruffle, Foret and Vacher32 show that the He inclusion reduces the compressibility maximum in silica glass, which is very well reproduced in our MD simulations. The above observations imply a possible unified structural origin responsible for the eradication of mechanical anomaly in either pressure-quenched or He-stuffed silica glass.
(a) Bulk modulus in He-stuffed silica glass samples as a function of pressure at 300 K from MD simulations. (b) Density of He-stuffed silica glass samples during compression and decompression cycle at 1000 K from MD simulations. Legend indicates the amount of He stuffed into 1 mol of silica glass in MD simulations.
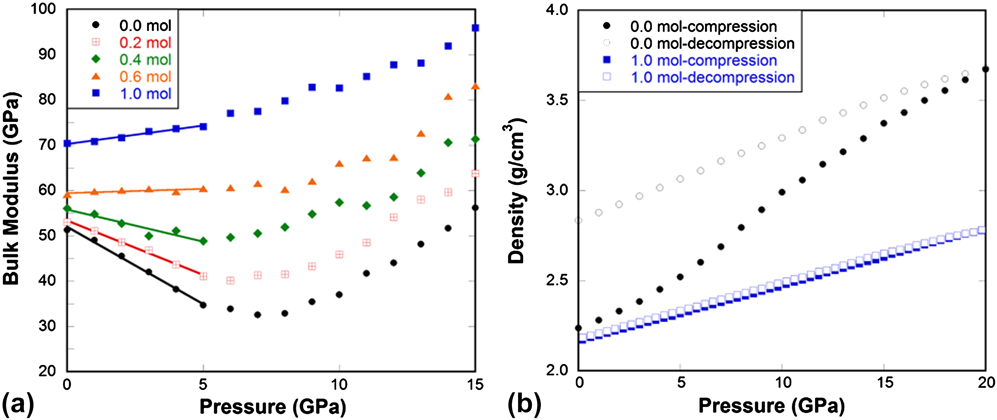
Figures 3–5(b) show that for normally processed silica glass, it can be irreversibly densified to a large extent after compression up to 20 GPa. After the elastic anomaly is eradicated, i.e., when silica behaves like a normal solid either through pressure-quenching or He-stuffing, the ability of the glass to be irreversibly densified diminishes. This clearly shows that the elastic anomaly is inherently connected to the ability of the glass to undergo irreversible densification. Next we will try to understand what the structural origins of these behaviors are.
B. Nature of elastic anomaly in silica glass
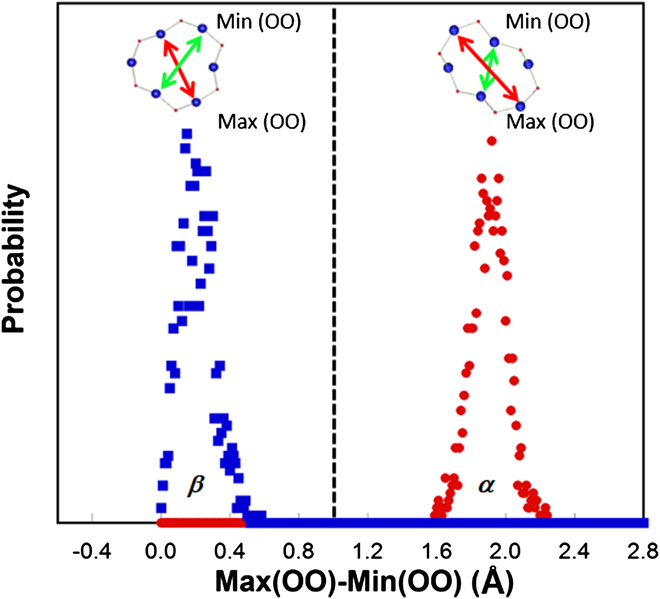
To understand the elastic anomaly in silica glass, it is useful to make connections to the structure and properties of its close crystalline counterparts, namely α- and β′-cristobalite, and the transformation between these two polymorphs. Reference Yuan and Huang38 In cristobalite, similar to many other silica polymorphs and silica glass, silicon is tetrahedrally coordinated by oxygen and by sharing oxygen between tetrahedra, which are linked into continuous network structure. As shown in our previous study, Reference Yuan and Huang38 in both α- and β′-cristobalite only one type of closed-loop structure can be identified within the network of tetrahedra, namely 6-membered rings, which are the most abundant rings over a range of size distribution in silica glass. Reference Pasquarello and Car39,Reference Sundararaman, Ching and Huang40 The transformation between the two polymorphs can occur with all network bonds remaining intact. To understand the structural difference between α- and β′-cristobalite, a criterion to differentiate the symmetry of 6-membered rings (identified using the shortest-path analysis Reference Marians and Hobbs41 ) in these phases was constructed. The idea is to track the variance (e.g., the maximum minus the minimum value) of the third nearest neighbor O–O distance in 6-membered rings as shown in Fig. 6. High-symmetry rings like beta-rings in β′-cristobalite generally have a smaller O–O variance (peak around 0.1 Å in Fig. 6), while low-symmetry rings like alpha-rings in α-cristobalite have a larger O–O variance (peak around 1.9 Å in Fig. 6). So we choose the O–O variance of 1.0 Å as a suitable value to differentiate the high-symmetry beta-rings from the low-symmetry alpha-rings.
Relative probability distribution of the O–O variance in α-rings (peak around 1.9 Å) and β-rings (peak around 0.1 Å) in α- and β′-cristobalite at 300 K.
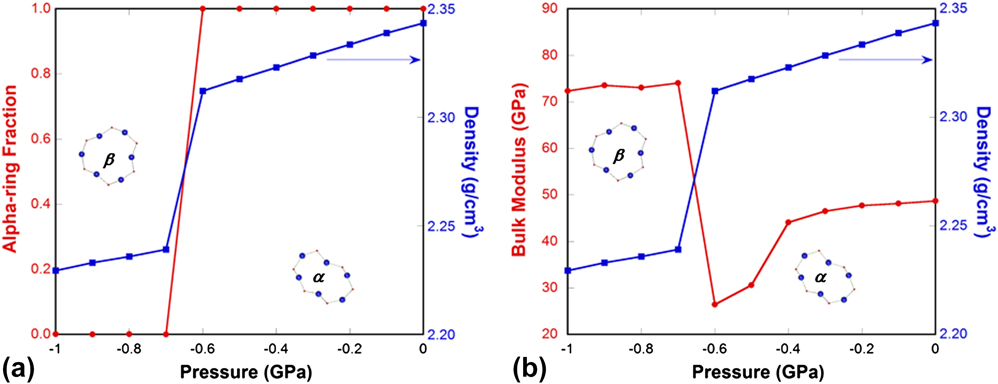
Using this method, we quantified the relative proportion of alpha-rings versus beta-rings throughout the pressure-induced α-to-β′ transition as seen in Fig. 7. Details of the simulations can be found in our previous study. Reference Yuan and Huang38 At the transition pressure of −0.7 GPa, we observe a step-change in the density, as expected for a first-order transition. At the same time, the alpha-ring fraction changes from 1 to 0, in other words, all of the alpha-rings convert into beta-rings during the phase transformation [Fig. 7(a)]. An interesting point to note is that, when going from the high- to the low-density modification, the elastic modulus increases [Fig. 7(b)]. This is due to the fact that in the low-density β′-cristobalite the geometry of an individual 6-membered ring is highly symmetric and all Si–O–Si bridges point outward, whereas in α-cristobalite some bridges point inward due to a partial twist in the ring structure. In β′-cristobalite applied stresses result in straining bonds between atoms or bending the angles formed by two adjoined bonds, whereas in α-cristobalite some of the load can be absorbed by advancing the twist deformation. This latter mode of deformation is responsible for the softer elastic response of α-cristobalite.
(a) Alpha-ring fraction (red line with circles) and density (blue line with squares) of simulated cristobalite silica through the α- to β′-cristobalite transformation under pressure. (b) Bulk modulus (red line with circles) and density (blue line with squares) of simulated cristobalite silica through the α- to β′-cristobalite transformation under pressure. Insets show the comparison of the geometries of a 6-membered ring in α- and β′-cristobalite. To the left of the discontinuity, β′-cristobalite, which has a lower density but higher modulus, is stable, and to the right α-cristobalite, which has a higher density and lower modulus, is stable.
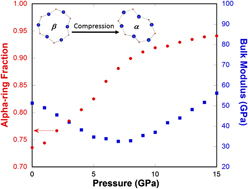
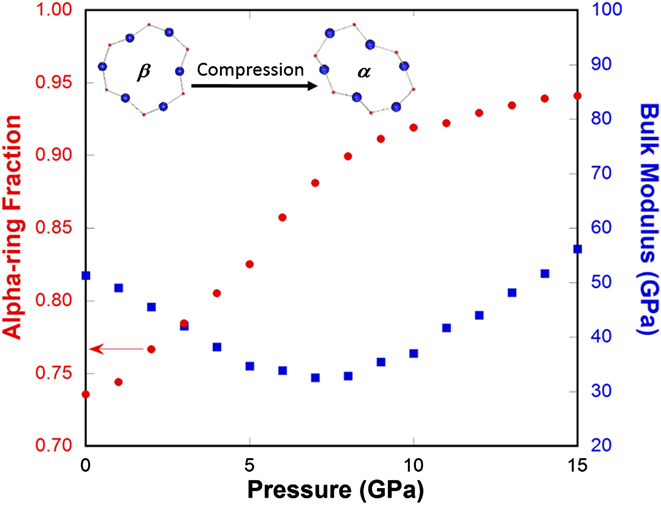
We then apply the two-state model devised for cristobalite silica (different from Vukcevich's theoretical two-state model based on oxygen angles Reference Vukcevich42 ) to explain the elastic anomaly in silica glass, considering the local disorder similarity between them. Reference Keen and Dove43 It should be pointed out that the ring conformation changes in silica glass are gradual and localized in contrast to the instantaneous and extended character of polymorphic transformation in crystals. For normally processed silica glass, in the pressure range where the bulk modulus decreases with increasing pressure (Fig. 8), a rapid increase in the alpha-ring fraction is seen. Because alpha-rings have a higher density and a lower modulus than beta-rings, an increasing population of alpha-rings will soften the silica network structure and lead to a lower bulk modulus. Above 8 GPa, the ability of silica glass network structure to accommodate such ring conformation changes diminishes (a slower alpha-ring fraction increase with pressure in Fig. 8) and silica glass returns to the normal behavior in terms of its elastic modulus response to pressure.
Alpha-ring fraction (red circles) and bulk modulus (blue squares) of silica glass as a function of pressure from MD simulations. Insets show the comparison of the geometries of a 6-membered α- and β-ring. Upon initial compression, β-rings, of higher symmetry, lower density, and high modulus convert into α-rings, of lower symmetry, higher density, and lower modulus, so the bulk modulus of silica glass decreases with pressure initially.
C. Tuning elastic anomaly via microscopic structure
For silica glass quenched under pressure, such as the 4 and 8 GPa samples [Fig. 9(a)], the initial alpha-ring fraction increases, and the dense structure does not allow local structural transitions to occur easily, the change in the alpha-ring fraction with pressure is much less comparing to the 0 GPa glass. This leads to a gradual diminish of the elastic anomaly as shown in Figs. 3–4(a). The above results show that the elimination of free volume inside the network structure reduces its capability to go through local structural transitions between alpha- and beta-rings. Therefore a densified silica glass behaves like a normal solid, while normally processed silica glass behaves abnormally due to its capability to undergo local structural transitions similar to those observed in the α- to β′-cristobalite silica phase transformation. Reference Yuan and Huang38
(a) Alpha-ring fraction as a function of pressure in 0, 4, and 8 GPa pressure-quenched silica glass. (b) Alpha-ring fraction as a function of pressure in 0.0, 0.4, and 1.0 mol He-stuffed silica glass.
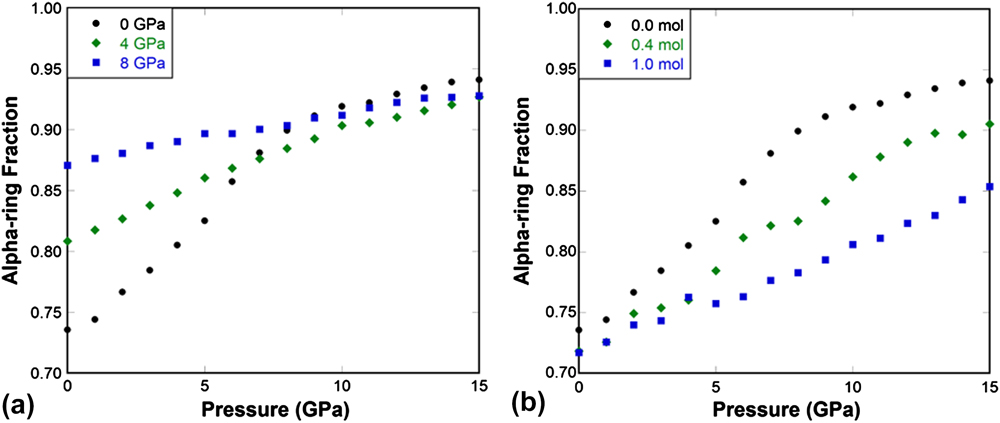
The ring conformational analysis was also performed for He-stuffed silica glasses at concentrations of 0.4 and 1.0 mol He per mol SiO2. The pressure dependence of alpha-ring fraction is plotted in Fig. 9(b). With increasing He concentration, the initial alpha-ring fraction does not change much, but the increase rate of the alpha-ring fraction with pressure reduces substantially. This reflects the effect of He inclusion on impeding the localized beta- to alpha-ring transitions and consequently suppressing the elastic anomaly induced by such local transitions in silica glass.
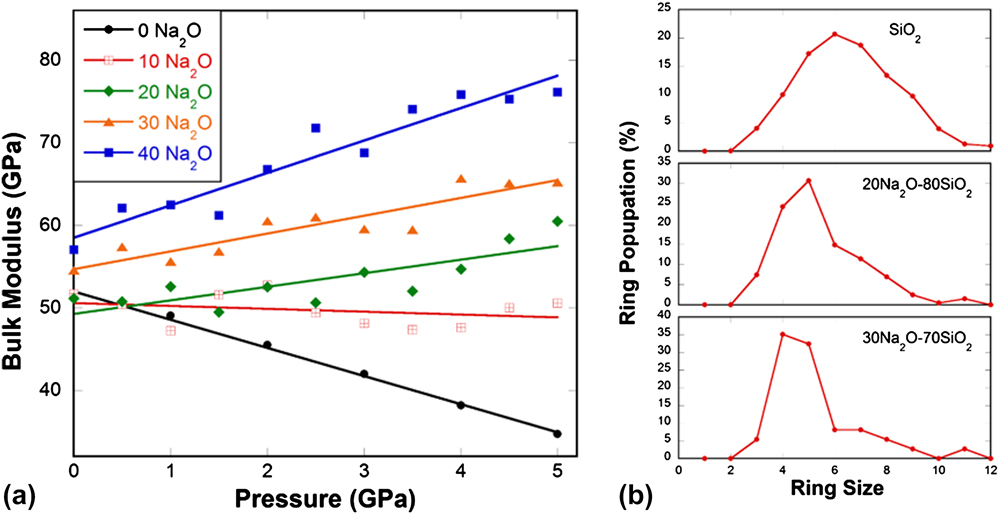
Pressure-quenching and He-stuffing play a similar role in suppressing the elastic anomaly in silica glass by reducing the local beta- to alpha-ring transitions. When such local transitions are gradually removed from the silica network, it would approach the behavior of a normal solid. If we consider the beta- to alpha-ring conversion as a chemical reaction, where beta-rings are the reactants, and alpha-rings are the products, as long as such a reaction cannot take place as much as in normally processed silica glass, the elastic anomaly would become less pronounced. In pressure-quenching case, the population of beta-rings, i.e., the amount of reactant is reduced. In He-stuffing case, the amount of reactant does not change, but the reaction becomes more difficult due to the hindrance of He atoms in the silica network. If flexible rings such as 6-membered alpha- and beta-rings are gradually removed from the glass matrix all together, thus the reaction itself, the elastic anomaly would eventually disappear. This is exactly what happens in Na2O–SiO2 glass system as seen in Fig. 10. When more Na2O is added, more nonbridging oxygen atoms are created, the connectivity of the silica network gradually breaks down. Flexible large rings, such as 6-membered and larger rings, gradually reduce their population, replaced by rigid small rings [Fig. 10(b)]. At the same time, the pressure dependence of elastic modulus changes from abnormal to intermediate and to normal [Fig. 10(a)], in a good agreement with experimental observation. Reference Sonneville, Ligny, Mermet, Champagnon, Martinet, Henderson, Deschamps, Margueritat and Barthel44
(a) Bulk modulus in sodium silicate glass samples (0–40% mol Na2O) as a function of pressure from MD simulations. (b) Ring size distribution in SiO2, 20Na2O–80SiO2, and 30Na2O–70SiO2 glasses from MD simulations.
The above results clearly show that it is such local beta- to alpha-ring transitions giving rise to the elastic softening upon initial compression in silica glass. Therefore, by eliminating localized ring conformation changes, the mechanical anomaly in silica glass can be completely eradicated. Our studies show that the microscopic structure of silica glass can be tuned in a controllable manner through processing such as pressure-quenching, He-stuffing or alkali-modifying, leading to predictable elastic response under pressure.
D. Link between elastic anomaly and densification capability
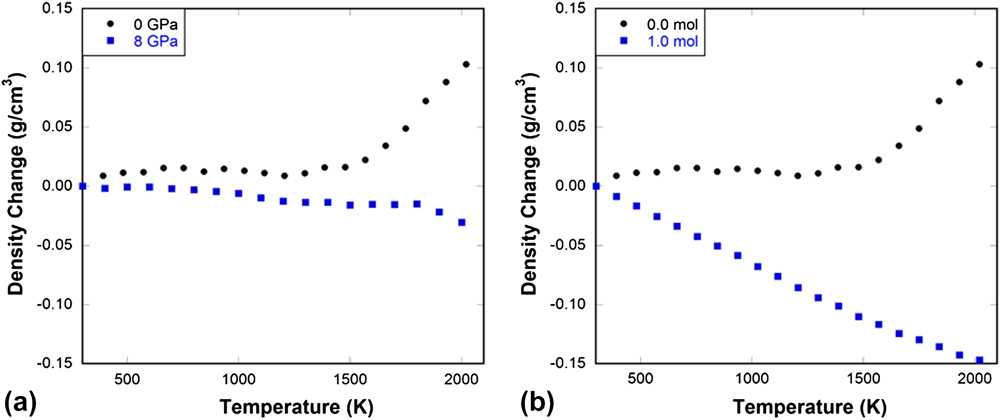
More importantly, our simulations demonstrate that the inherent instability of network rings in normally processed silica glass, as evidenced by a progressive weakening of the structure upon initial compaction (moduli decrease with pressure), is a key to facilitating irreversible densification under either isothermal compression as seen in Fig. 3(b) from experiments or in Figs. 4–5(b) from MD simulations or upon heating under constant pressure as seen in Fig. 11 from MD simulations. Our studies show that by processing in ways that gradually eliminates the elastic anomaly, the degree of silica glass to undergo irreversible densification can be precisely controlled. The amount of densification a glass can exhibit under indentation (largely compression) is directly linked to its ability to absorb energy, thus the crack initiation load. Reference Gross45,Reference Mauro, Tandia, Vargheese, Mauro and Smedskjaer46 Thus tailoring the elastic response to pressure (or temperature) via microscopic structure changes induced by processing may open new door to developing damage resistant glasses.
(a) Density change as a function of temperature in 0 and 8 GPa pressure-quenched silica glass tested under a constant pressure of 10 GPa in MD simulations. (b) Density change as a function of pressure in 0.0 and 1.0 mol He-stuffed silica glass tested under a constant pressure of 10 GPa in MD simulations.
IV. CONCLUSIONS
Our experimental and computational studies show that the structure and properties of silica glass can be systematically tuned via processing. By MD simulations of pressure-quenching, He-stuffing, and alkali-modifying, a unified structural explanation based on the ring conformational transition for the elastic anomaly of silica glass was obtained. In normally processed silica glass, the abundant beta-rings and the open structure allow for the beta- to alpha-ring conversion upon increasing pressure, leading to the decrease of elastic modulus with pressure in the low pressure range. In pressure-quenched silica glass, the dense structure substantially reduces the available beta-rings and the rate for the beta- to alpha-ring conversion and a normal densification mechanism becomes dominant. In He-stuffed silica glass, due to the impeding effect of helium atoms on the beta- to alpha-ring conversion, the conversion rate is greatly reduced and a normal behavior is observed. The addition of Na2O gradually breaks down the silica network connectivity and reduces the population of flexible large rings that can go through local transitions, yielding an increasingly normal behavior. Therefore, by eliminating localized structural transitions between motifs of different stiffness that are similar to those found in the material's crystalline counterparts, the elastic anomaly in silica glass can be completely removed. We further revealed that the elastic anomaly of silica glass is inherently connected to its ability to undergo irreversible densification. Our studies show that by processing in ways that eliminates the elastic anomaly, the propensity of silica glass to undergo irreversible densification can be eradicated.
ACKNOWLEDGMENTS
This work was supported by the National Science Foundation under Grant Nos. DMR-1105238 and DMR-1255378.


 Open access

