

Maternal milk is widely considered the best feeding source for newborns compared with the alternatives(Reference Liu, Roy and Guo1–Reference Walker3), even in the setting of maternal undernutrition during pregnancy and lactation, which not only affects maternal health but negatively programmes neonatal growth and organ development and maturation(Reference Bautista, Rodriguez-Gonzalez and Torres4–Reference Hanson and Gluckman8). Reduced maternal nutrition is the most extensively studied programming challenge of offspring phenotypic plasticity(Reference Reyes-Castro, Padilla-Gomez and Parga-Martinez9). Developmental programming is defined as the response to a specific challenge to the mammalian organism during a critical developmental time window that alters the trajectory of development with resulting effects on health that persist throughout life(Reference Zambrano and Nathanielsz10, Reference Vieau11). The implications of maternal undernutrition on milk quality and their consequences on maternal neonatal growth and development, to date, have been poorly studied.
During the early stages of lactation (0–7 days of lactation, dL) pups cannot synthesise many key metabolites. These must be provided in the maternal milk(Reference Levant, Ozias and Carlson12). Among the best known examples are the long-chain (LC)-PUFA, especially arachidonic acid (AA) and DHA, which are essential for offspring metabolic functions, for example, in liver and brain maturation(Reference Cao, Kevala and Kim13, Reference Bautista, Montano and Ramirez14). This need for LC-PUFA is particularly marked in the hippocampus, a major centre of behavioural control and cognitive function(Reference Nakamura and Nara15–Reference Bautista and Zambrano17). By mid lactation (8–14 dL), maximal milk production is associated with changes in maternal metabolism, hormone synthesis and physiological adaptations(Reference Ramos-Lobo, Furigo and Teixeira18). During this stage, pup growth increases dramatically and organ maturation accelerates(Reference Bautista, Boeck and Larrea7). If nutrition is adequate, then the neonate has been prepared for an independent existence by the end of lactation (21 dL)(Reference Cherala, Shapiro and D’Mello19–Reference Liu, Diorio and Tannenbaum21).
We have shown that maternal low-protein diet (LPD) during pregnancy impairs maternal liver fat composition(Reference Torres, Bautista and Tovar22) and mammary gland (MG) development and function at the end of pregnancy(Reference Bautista, Rodriguez-Gonzalez and Torres4), accompanied by decreased maternal and pup LC-PUFA in both organs. Previous publications have reported nutrient content(Reference Moretto, Ballen and Goncalves23), milk intake(Reference Wattez, Delmont and Bouvet24, Reference Fiorotto, Burrin and Perez25) or pup body weight gain(Reference Cherala, Shapiro and D’Mello19, Reference Cambraia, Vannucchi and De-Oliveira26) using the LPD model in rats. In the present study we evaluated the effects of maternal LPD on maternal liver metabolism, MG development and milk nutrient composition and production, and their consequences on pup milk nutrient intake and development at different lactation stages throughout lactation in rats. We hypothesised that maternal LPD during pregnancy and lactation results in maternal metabolic adaptations that lead to early programming of dysfuction in offspring organ development.
Methods
Care and maintenance of animals
All procedures were approved by the Animal Experimentation Ethics Committee of the Instituto Nacional de Ciencias Médicas y Nutrición Salvador Zubirán (INCMNSZ, BRE-105). Female albino Wistar rats approximately 120 d of age and weighing 200–240 g were assigned either to a control group (C: 20 % protein; n 21; seven animals per each stage of lactation) in which mothers ate control diet during pregnancy and lactation; or a restricted group (R: 10 % protein; n 18; six animals at each of the three stages studied) in which mothers ate a protein-restricted diet during pregnancy and lactation(Reference Bautista, Boeck and Larrea7). Water and food were provided ad libitum to all animals. Food was provided in the form of large flat biscuits retained behind a grill through which the food could be nibbled. Complete details of the maternal diet (Table 1), breeding and management have been published(Reference Bautista, Boeck and Larrea7). The day of delivery was considered as postnatal day 0 of life. Maternal and pup weights (g) were recorded throughout lactation: at 7 dL (early lactation), 14 dL (mid lactation) and 21 dL (late lactation)(Reference Bautista, Boeck and Larrea7). To ensure homogeneity of study subjects, litters >14 pups or <12 pups were not included in the study. Litters of 12–14 pups were adjusted to 12 pups for each mother while maintaining a sex ratio as close as possible to 1:1.
Maternal diet composition during pregnancy and lactation.

Maternal parameters
Blood collection. C (n 7) and R (n 6) rats were anaesthesised with isoflourane, followed by rapid decapitation, by personnel experienced in using a rodent guillotine (Thomas Scientific) on 7, 14 and 21 dL. Trunk blood was collected in polyethylene tubes, allowed to clot at 4°C for 1 h, centrifuged at 1500 g for 15 min at 4°C and serum stored at –20°C until assayed. Serum glucose (mg/dl) and TAG (mg/dl) concentrations were determined enzymatically using a Synchron CX® autoanalyser (Beckman Coulter Co.). Serum insulin concentration (ng/ml) was determined by RIA using commercial rat kits from Linco Research®. Homeostatic model assessment (HOMA) was calculated from baseline values using the formula: HOMA = glucose (mmol/l) × insulin (µU/ml)/22·5(Reference Vega, Reyes-Castro and Rodriguez-Gonzalez27). Each serum sample was determined in duplicate. The intra- and interassay coefficients of variation were <4 and <6 %, respectively(Reference Bautista, Boeck and Larrea7).
Liver and mammary gland analyses. Maternal liver(Reference Torres, Bautista and Tovar22) and complete MG chain were excised and weighed(Reference Bautista, Rodriguez-Gonzalez and Torres4). MG beneath the 6th right nipple (counted from the cephalad end) was longitudinally sectioned into two equal parts; one was immediately frozen at –20°C and the other immediately immersion-fixed in 4 % paraformaldehyde in neutral PBS. After 24 h of fixation, tissue sections were dehydrated with ethanol at increasing concentrations from 75 to 95 % and embedded in paraffin. Sections (5 µm) were stained with haematoxylin and eosin.
Mammary gland cell differentiation morphometric analysis. Morphometric analysis was performed on 10 pictures from 3 to 5 sections from each MG, and at least 150 lobules were quantified at 10× magnification. Adipose and parenchymal tissue (%; acinar and ductal epithelium) areas were determined. Fifty acini per animal were measured at a higher magnification (100×), and results expressed as cytoplasm area (μm2) and nuclei size (μm2) for cells in each acinus (around 7–15 cells per acinus) with AxioVision® software. All histological measurements were performed by two independent observers without knowledge of the source of the tissues, and results were averaged for each animal(Reference Bautista, Montano and Ramirez14).
Milk parameters
Nutrient content. Milk samples were collected on 7, 14 and 21 dL. Pups were removed from their mothers for 4 h after which mothers received 0·8 U oxytocin (intraperitoneally), and milk was expressed 15 min later. Milk samples were vortexed and divided into three aliquots of 1·5 ml and immediately frozen at −20°C until analysed. For analysis, milk samples were thawed at 37°C and shaken vigorously before removing assay aliquots to ensure sample uniformity as previously reported(Reference Bautista, Boeck and Larrea7). Water content (% of total milk) was analysed by gravimetric analysis(Reference Herlich28). Protein content (%) was measured by Bradford assay (Biorad®). Total fat content (%) was measured by the Folch method(Reference Torres, Bautista and Tovar22). AA and DHA content from milk fat were measured by gas chromatography(Reference Bautista, Rodriguez-Gonzalez and Torres4).
Production and pups’ milk component intake. Milk production was estimated as described by Russell and our published data(Reference Bautista, Boeck and Larrea7, Reference Russell29, Reference Romero, Canas and Baldwin30). At 07.00 hours on 6, 13 and 20 dL, pups were removed from their mothers for 4 h during which time mothers had free access to water and ate ad libitum (to produce milk), whereas the pups did not eat. Mothers were weighed at the beginning and end of the 4-h period. Pups were weighed individually immediately before they were returned to the mothers and again 1 h later. Pups’ milk component intakes (water, protein, fat, AA and DHA) were estimated by milk intake (g/h) × milk component (%)/100.
Pup parameters
Body, liver and brain weight. Pup body weight (n 12 pups per litter per age for both C and R) was registered and liver and brain excised, cleaned and weighed (g) at 7 (early), 14 (middle) and 21 (late) dL. The hippocampus was dissected and immediately frozen and stored at –70°C until use.
Fatty acid analysis. Maternal milk and pup hippocampal lipids were extracted by a modified Folch technique(Reference Torres, Bautista and Tovar22). Briefly, samples were homogenised with 2 ml of 0·9 % NaCl and 5 ml chloroform–methanol (2:1) as previously described(Reference Torres, Bautista and Tovar22). Fatty acid extraction was performed by the addition of chloroform (3 × 2 ml). The organic phase was pooled and 120–150 µl methanol was added until the organic phase turned transparent, then 1 g Na2SO4 was added and vortexed to provide the residue for analysis. The organic phase was evaporated under a stream of N2.
Preparation of fatty acid methyl esters. Samples of fatty acid methyl esters (FAME) were prepared as previously described(Reference Torres, Bautista and Tovar22). Briefly, 2 ml methanol, 100 µl toluene and 40 µl of 2 % methanolic sulfuric acid were added to the above residue and heated at 90°C for 2 h. Tubes were then placed on ice, and 1 ml of 5 % NaCl was added. FAME were extracted with hexane (3 × 2 ml), and the mixture was centrifuged at 1500 g for 1 min. The organic phase was pooled and evaporated under a stream of N2. Hexane (200 µl) was added to the residue, which was then centrifuged at 1500 g for 5 min. The clear solution was injected in an Agilent® model 6850 gas chromatography system equipped with a flame ionisation detector. Automatic split injection was carried out using an Agilent® 6850 auto-sampler. We used an HP-INNO® wax capillary column (30 m, 0·25 mm, 0·25 m; J & W Scientific). Heptadecanoic acid (125 µg) was added to 100 mg of the sample as internal standard. A 1-µl sample was injected in split mode (50:1) at 250°C. The carrier gas was He with a constant linear velocity of 24 cm/s, and the interface temperature was maintained at 280°C. The oven temperature was raised from 50 to 230°C. The identification of FAME was based upon retention times obtained for methyl ester standards from Poly Science®, and each one was expressed as a percentage of total fatty acids in the sample(Reference Torres, Bautista and Tovar22).
Statistical analysis
To assess the differences within lactation periods in the same experimental group (C or R) we performed a one-way multiple ANOVA followed by a Tukey test. To compare C and R groups, we performed unpaired Student’s t tests at the same lactation period. Preliminary analysis revealed no sex-dependent statistical significance by lactational stage, so pup data from the same litter were averaged for analysis. Data are presented as means with their standard errors. Significance was set at P ≤ 0·05.
Results
Maternal parameters
Body weight. Body weight of C mothers increased at 14 dL compared with 7 dL and then remained stable. Body weight of R mothers decreased during lactation. R mothers weighed lower than C at 14 and 21 dL (Fig. 1(a), P < 0·05).
Maternal parameters. (a) Body weight (g), (b) glucose (mg/dl), (c) insulin (ng/ml), (d) homeostatic model assessment (HOMA), (e) TAG (mg/dl), (f) liver weight (g), (g) liver weight relative to body weight (%), (h) mammary gland (MG) weight (g), (i) MG weight relative to body weight (%) at 7 (early stage), 14 (middle stage) and 21 (late stage) days of lactation (dL). Rats were fed control (C: −20 % protein; n 7 per each stage) or restricted (R: −10 % protein; n 6 per each stage) diet during pregnancy and lactation. Values are means, with their standard errors represented by vertical bars. *P < 0·05 v. C. Data not sharing a letter are different between ages in the same group (P < 0·05). •, C group; ○, R group. To convert glucose in mg/dl to mmol/l, multiply by 0·0555. To convert TAG in mg/dl to mmol/l, multiply by 0·0113.
Glucose, insulin and homeostatic model assessment. Glucose serum levels were constant throughout lactation in C. However, R glucose increased at 21 dL compared with 7 and 14 dL. Glucose serum levels were higher in R compared with C at 21 dL (Fig. 1(b), P < 0·05). Insulin serum levels were lower at 21 dL compared with 14 and 7 dL in C. In the R group, insulin serum levels decreased during lactation. R serum levels were lower than in C at all stages (Fig. 1(c), P < 0·05). HOMA was constant throughout lactation in C and was lower at 21 dL compared with 7 dL in R. However, R HOMA was lower compared with C at all stages (Fig. 1(d), P < 0·05).
TAG. TAG remained constant throughout lactation in C. However, in R, TAG was similar at 7 and 14 dL and increased between 14 and 21 dL. TAG was lower throughout lactation in R compared with C (Fig. 1(e), P < 0·05).
Liver weight. Liver weight in C was higher at 14 dL compared with 7 and 21 dL. In R, liver weight increased at 14 dL compared with 7 dL and remained constant until 21 dL (Fig. 1(f), P < 0·05). Lower liver weights were found throughout lactation in R compared with C. Liver weight relative to body weight remained constant throughout lactation in both C and R but was lower in R compared with C (Fig. 1(g), P < 0·05).
Mammary gland weight. In C, MG weight was higher at 14 dL compared with 7 and 21 dL. In R, MG weight was similar at 7 and 14 dL; at 21 dL, MG weight was lower than at 14 dL. Lower MG weights were found in R throughout lactation compared with C (Fig. 1(h), P < 0·05). MG weight relative to body weight was lower in both C and R at 21 dL compared with earlier time points. Lower values of MG weights relative to body weights were found throughout lactation in R compared with C (Fig. 1(i), P < 0·05).
Mammary gland morphometric analysis
Parenchymal tissue. In C, the percentage of parenchymal tissue was similar at 7 and 14 dL but higher than 21 dL. In contrast, R percentage of parenchymal tissue increased during lactation. Lower percentage of parenchymal tissue was present in R than C at 7 and 14 dL. However, at 21 dL, R contained a higher percentage of parenchymal tissue compared with C (Fig. 2(a) and (c), P < 0·05).
Mammary gland. (a) Parenchymal tissue (%), (b) adipose tissue (%), (c) microphotography with haematoxylin and eosin; 40×. Black arrows point to parenchymal and red adipose tissues, respectively, at 7 (early stage), 14 (middle stage) and 21 (late stage) days of lactation (dL). Rats were fed control (C: −20 % protein; n 7 per each stage) or restricted (R: −10 % protein; n 6 per each stage) diet during pregnancy and lactation. Values are means, with their standard errors represented by vertical bars. *P < 0·05 v. C. Data not sharing a letter are different between ages in the same group (P < 0·05). •, C group; ○, R group.
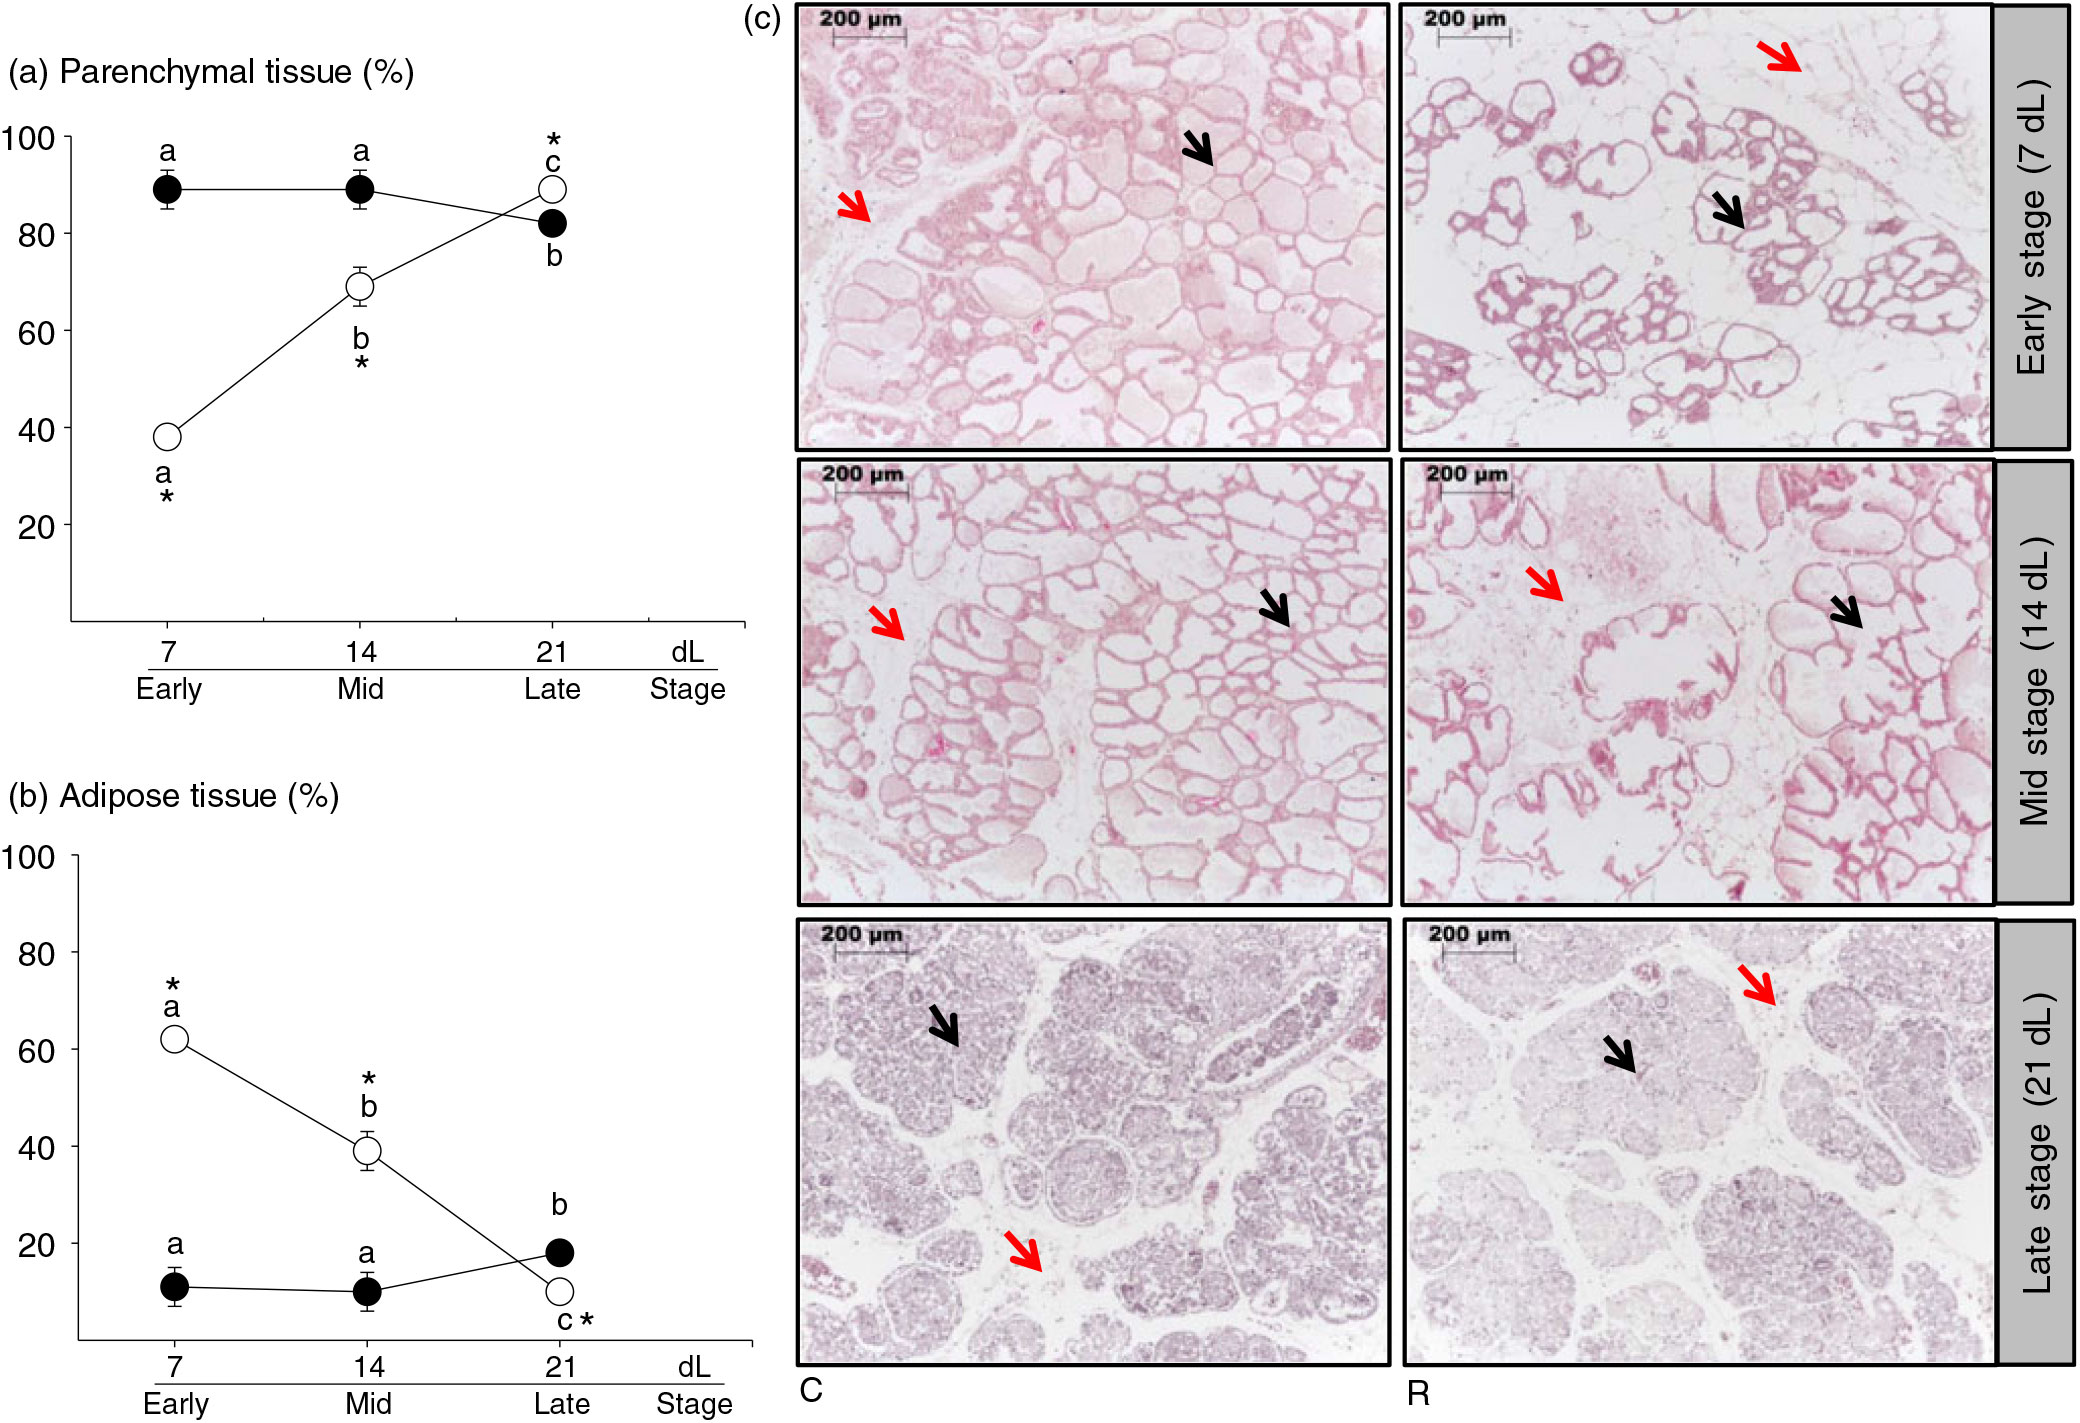
Adipose tissue. The percentage of adipose tissue was similar in 7 and 14 dL and increased between 14 and 21 dL in C. In R, the percentage of adipose tissue decreased during lactation. In R, the percentage of adipose tissue was higher at 7 and 14 dL and lower at 21 dL compared with C (Fig. 2(b) and (c), P < 0·05).
Cell cytoplasm area. In C, cell cytoplasm area was similar at 7 and 14 dL and higher than 21 dL. In R, cytoplasm area was higher at 21 dL compared with 14 dL. But it was lower at 7 and 14 dL compared with C (Fig. 3(a) and (c), P < 0·05).
Mammary gland. (a) Cytoplasm area (µm2), (b) nuclei size (µm2), and (c) microphotography with haematoxylin and eosin; 100× at 7 (early stage), 14 (middle stage) and 21 (late stage) days of lactation (dL). Rats were fed control (C: −20 % protein; n 7 per each stage) or restricted (R: −10 % protein; n 6 per each stage) diet during pregnancy and lactation. Values are means, with their standard errors represented by vertical bars. *P < 0·05 v. C. Data not sharing a letter are different between ages in the same group (P < 0·05). •, C group; ○, R group.
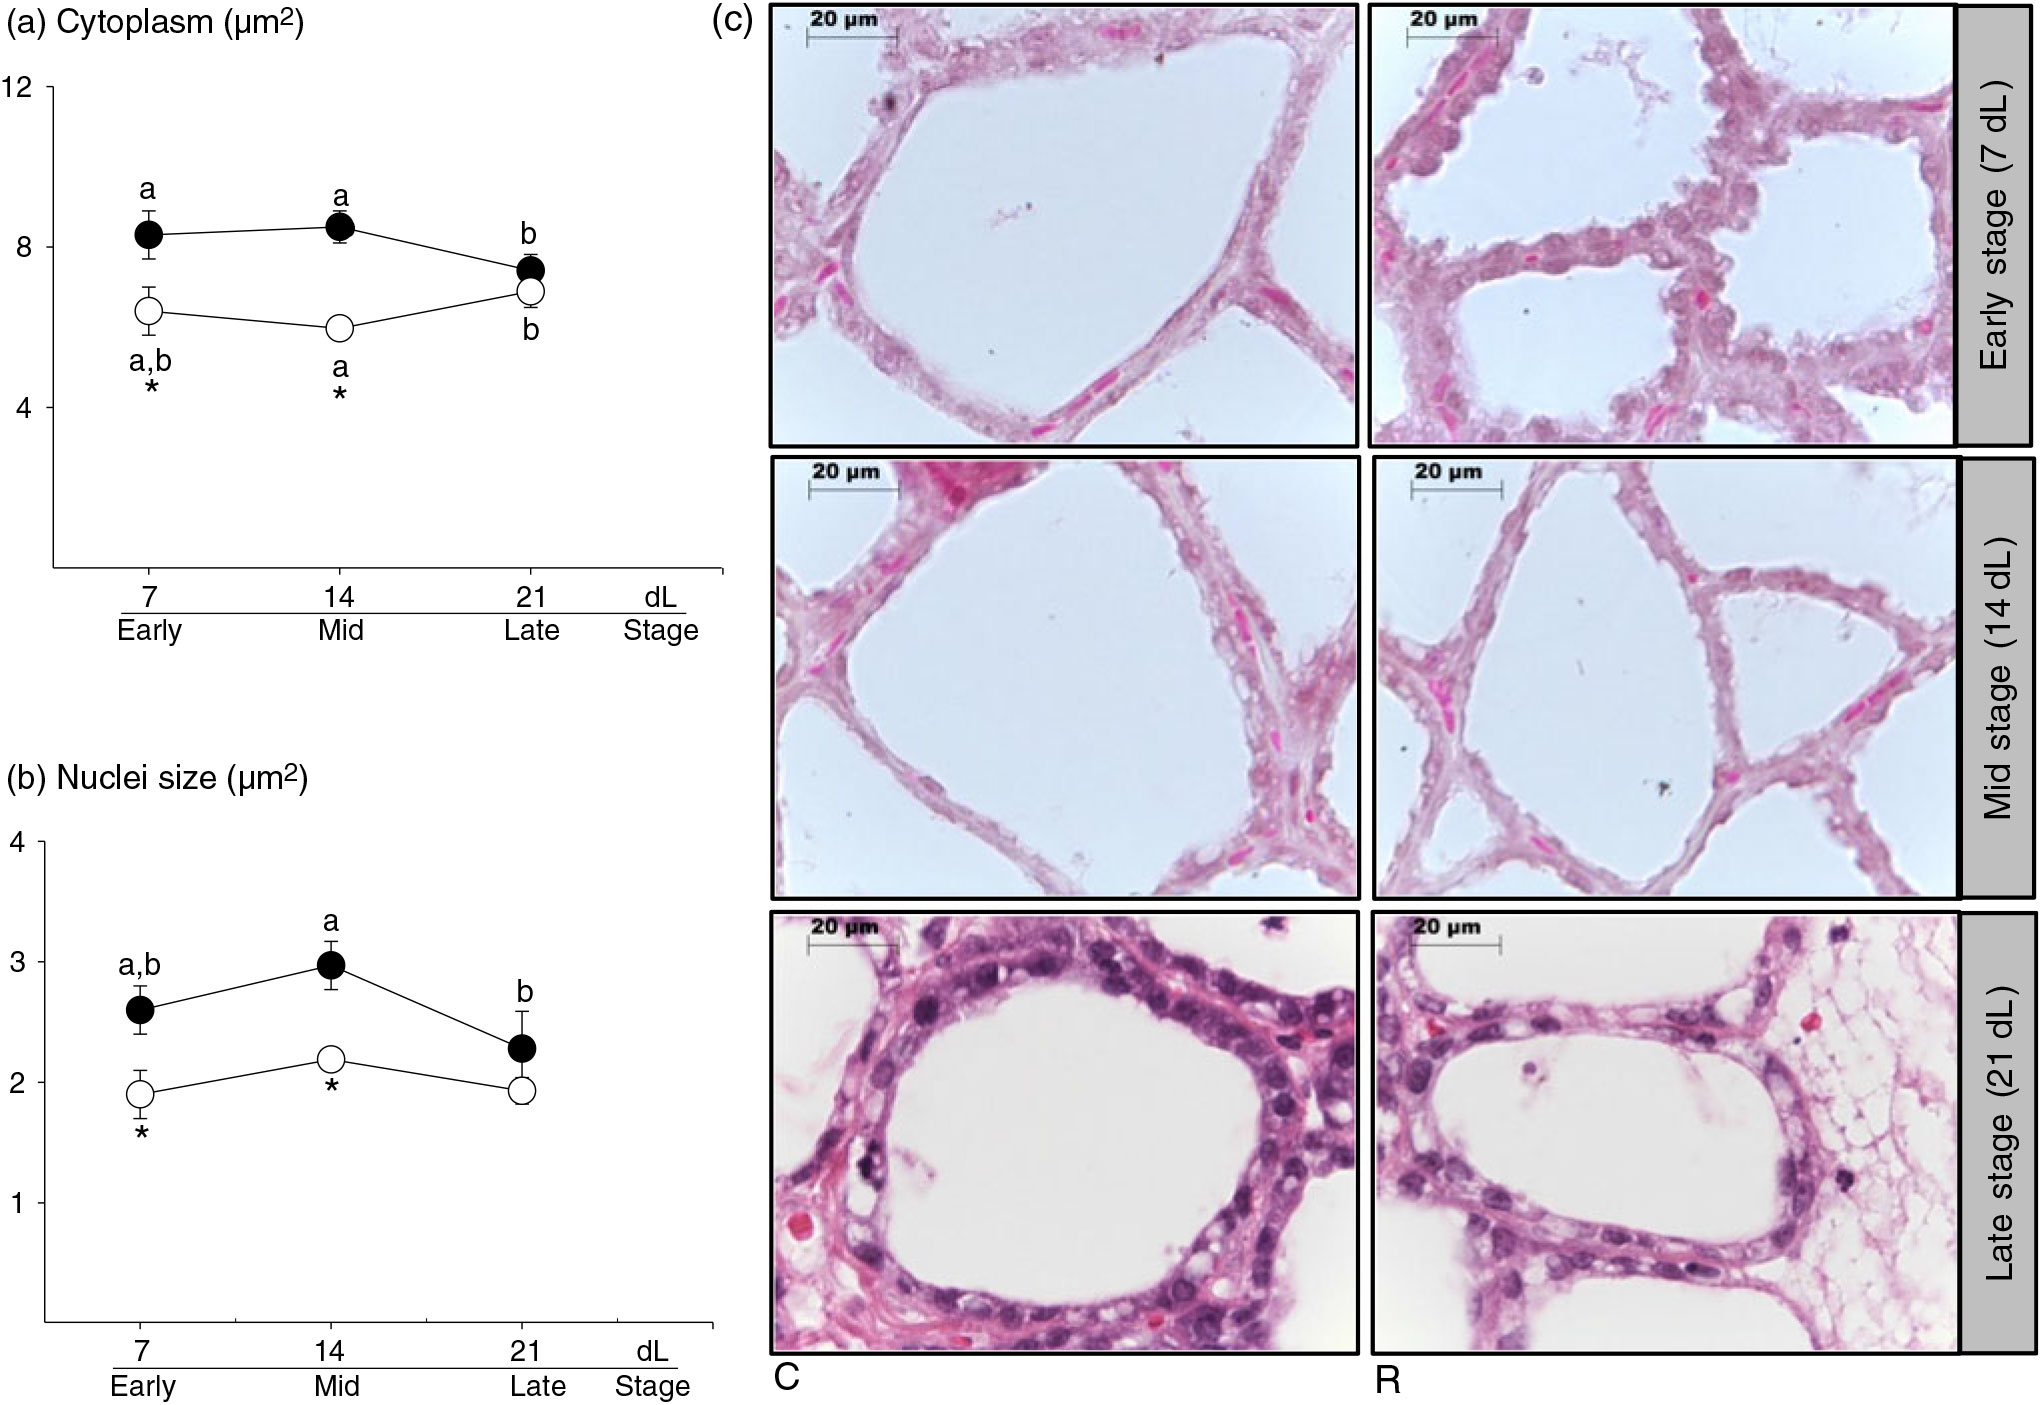
Nuclear size. Nuclear size decreased at 21 dL compared with 14 dL in C, but remained constant throughout lactation in R. Lower values were found in 7 and 14 dL in R compared with C (Fig. 3(b) and (c), P < 0·05).
Milk parameters
Water. No difference in the percentage of water content was observed at any stage of lactation within or between groups (Fig. 4(a), P < 0·05).
Milk parameters. (a) Water (%), (b) protein (%), (c) total fat (%), (d) arachidonic acid (AA) (%), and (e) DHA (%) at 7 (early stage), 14 (middle stage) and 21 (late stage) days of lactation (dL). Rats were fed control (C: −20 % protein; n 7 per each stage) or restricted (R: −10 % protein; n 6 per each stage) diet during pregnancy and lactation. Values are means, with their standard errors represented by vertical bars. *P < 0·05 v. C.Data not sharing a letter are different between ages in the same group (P < 0·05). •, C group; ○, R group.

Protein. Milk protein content in C was higher at 14 dL compared with 7 and 21 dL, and higher at 21 than 7 dL. In R, the protein content was higher at 21 dL compared with other stages. Protein content was lower at 7 and 14 dL in R compared with C (Fig. 4(b), P < 0·05).
Total fat. Total fat content was lower at 14 dL in comparsion with 7 and 21 dL, and lower at 21 dL compared with 7 dL in both C and R. No differences were found between C and R throughout lactation (Fig. 4(c), P < 0·05).
Arachidonic acid. AA increased at 21 dL in C compared with 7 and 14 dL, while AA in R was higher at 21 dL compared with 14 dL. Higher AA content was observed at 7 and 14 dL in R compared with C (Fig. 4(d), P < 0·05).
DHA. DHA decreased at 21 dL compared with 14 and 7 dL in both C and R. No differences were found between C and R throughout lactation (Fig. 4(e), P < 0·05).
Milk production and pup milk intake
Total intake. Total pup milk intake increased between 7 and 14 dL and remained constant until 21 dL in both C and R. Lower total milk intake throughout lactation was found in R compared with C (Fig. 5(a), P < 0·05).
Pup parameters. (a) Milk intake (g/h), (b) protein intake (g/h), (c) total fat intake (mg/h), (d) arachidonic acid (AA) intake (mg/h), and (e) DHA intake (mg/h) at 7 (early stage), 14 (middle stage) and 21 (late stage) days of lactation (dL). Rats were fed control (C: −20 % protein; n 7 per each stage) or restricted (R: −10 % protein; n 6 per each stage) diet during pregnancy and lactation. Values are means, with their standard errors represented by vertical bars. *P < 0·05 v. C. Data not sharing a letter are different between ages in the same group (P < 0·05). •, C group; ○, R group.
Protein intake. Pup protein intake increased between 7 and 14 dL and remained constant until 21 dL in C. In R, protein intake was higher at 21 dL compared with 7 dL. Lower protein intake was found at 7 and 14 dL in R compared with C (Fig. 5(b), P < 0·05).
Total fat intake. Pup total fat intake increased at 21 dL compared with 7 dL in both C and R. Fat intake was lower throughout lactation in R compared with C (Fig. 5(c), P < 0·05).
Arachidonic acid intake. Pup AA intake increased by 21 dL in C compared with 7 and 14 dL and in R compared with 7 dL. No differences were found between the groups (Fig. 5(d), P < 0·05).
DHA intake. Pup DHA intake remained constant throughout lactation in both C and R (Fig. 5(e)). Lower DHA intake was found at 14 and 21 dL in R compared with C (Fig. 5(e), P < 0·05).
Pup parameters
Body weight. Pup body weight increased throughout the lactation period in C. However, in R, pup body weight increased at 14 dL and remained constant thereafter. Body weight was lower in R compared with C at 14 and 21 dL (Fig. 6(a), P < 0·05).
Pup parameters. (a) Body weight (g), (b) liver weight (g), (c) brain weight (g), (d) arachidonic acid (AA) hippocampus (%) and (e) DHA hippocampus (%) at 7 (early stage), 14 (middle stage) and 21 (late stage) days of lactation (dL). Rats were fed control (C: −20 % protein; n 7 per each stage) or restricted (R: −10 % protein; n 6 per each stage) diet during pregnancy and lactation. Values are means, with their standard errors represented by vertical bars. *P < 0·05 v. C. Data not sharing a letter are different between ages in the same group (P < 0·05). •, C group; ○, R group.
Liver weight. Pup liver weight increased throughout lactation in C. However, in R, pup liver weight increased by 14 dL and remained constant through 21 dL. Liver weight was lower throughout lactation in R compared with C (Fig. 6(b), P < 0·05).
Brain weight. Pup brain weight increased throughout lactation in both C and R. Brain weight was lower at 14 and 21 dL in R compared with C (Fig. 6(c), P < 0·05).
Arachidonic acid in pup hippocampus. Pup hippocampal AA content decreased by 21 dL compared with 7 dL in C (AA %: 7 dL = 11·2 ± 0·3a; 14 dL = 10·2 ± 0·2ab; 21 dL = 8·4 ± 0·01b). Hippocampal AA levels in R were constant throughout lactation (AA %: 7 dL = 6·5 ± 0·02*; 14 dL = 5·6 ± 0·01*; 21 dL = 5·8 ± 0·01*) and lower than in C at all stages (Fig. 6(d), P < 0·05).
DHA in the pup hippocampus. Pup hippocampal DHA content in C decreased by 14 dL compared with 7 dL and remained constant until 21 dL (DHA %: 7 dL = 7·2 ± 0·02a; 14 dL = 5·5 ± 0·01b; 21 dL = 6·0 ± 0·02b). In R, pup hippocampal DHA decreased throughout lactation (DHA %: 7 dL = 5·8 ± 0·02a*; 14 dL = 4·1 ± 0·08b*; 21 dL = 3·2 ± 0·01c*). In R, hippocampal DHA was lower than in C at all stages of lactation (Fig. 6(e), P < 0·05).
Discussion
Under optimal conditions, breastfeeding provides all the necessary nutrients for neonatal growth and maturation(Reference Martin, Ling and Blackburn31, Reference Keen, Lonnerdal and Clegg32). Delay in offspring growth velocity during the lactation period may predispose the offspring to metabolic syndrome during adulthood, suggesting that milk composition and intake are important mediators of offspring metabolic programming(Reference Wattez, Delmont and Bouvet24). We studied the effects of maternal LPD on milk quality and production. Previous studies in rats have documented that maternal LPD negatively impacted maternal milk nutrient content(Reference Moretto, Ballen and Goncalves23, Reference Wattez, Delmont and Bouvet24, Reference Sturman, Resnick and Morgane33), pup milk intake(Reference Wattez, Delmont and Bouvet24, Reference Fiorotto, Burrin and Perez25) and pup body weight(Reference Cherala, Shapiro and D’Mello19, Reference Cambraia, Vannucchi and De-Oliveira26), with negative effects in offspring development(Reference Jahan-Mihan, Rodriguez and Christie34).
The present study is the first to attempt to analyse the effects of LPD on the delivery of milk nutrients to offspring during lactation and its association with pups’ liver and brain weight and hippocampal AA and DHA content at weaning.
Carefully controlled studies in precocial and altricial mammalian species provide insights into the mechanisms involved. Humans are monotocous and precocial species, meaning that women generally bear only one fetus at a fairly advanced stage of metabolic development. In contrast, rodents are polytocous and altricial, bearing large litters born at an immature stage after relatively short pregnancies and requiring considerable maternal care in the immediate postnatal period to regulate basic neonatal functions. Thus, even under optimal feeding conditions, the nutritional demands of pregnancy and lactation on the litter-bearing rodent mother are much greater compared with humans. The present study analyses the effects of maternal LPD on mother, milk and offspring outcomes in a rat model, which is a limitation of the study. However, comparative physiology provides the opportunity to observe the differences and similarities between species by understanding the differences in molecular, cellular, biochemical and hormonal mechanisms. Understanding these differences can provide insights that can guide interventions in cases of abnormal human development(Reference Zambrano and Nathanielsz10).
It has been reported that maternal food intake relative to the body weight, liver and MG weights is greater in lactating compared with non-lactating rats(Reference Cambraia, Vannucchi and De-Oliveira26, Reference Keen, Lonnerdal and Clegg32). In line with our findings, an increment in liver weight during lactation is related to increased maternal lipogenesis and β-oxidation processes(Reference Ramos-Lobo, Furigo and Teixeira18, Reference Bertics, Grummer and Cadorniga-Valino35–Reference Zambrano, Ibanez and Martinez-Samayoa38). Normal MG proliferation as well as functional differentiation are complex phenomena controlled by many hormones and growth factors(Reference Bhattacharjee, Wientroub and Vonderhaar39). C mothers showed increased MG weight at mid lactation associated with increased milk production. In contrast, maternal LPD impairs MG differentiation, proliferation and development throughout lactation accompanied by negative effects on milk nutrient content, milk production and pup milk intake.
Numerous metabolic adaptations occur during pregnancy(Reference Bautista, Rodriguez-Gonzalez and Torres4) and lactation(Reference Mohammad, Sunehag and Haymond40) to support milk synthesis without jeopardising maternal substrate homeostasis while optimising the delivery of appropriate nutrition to the offspring(Reference Mohammad, Sunehag and Haymond40, Reference Bauman and Currie41). We showed low desaturase and elongase gene expression at the end of gestation in LPD-fed mothers in both liver(Reference Torres, Bautista and Tovar22) and MG(Reference Bautista, Rodriguez-Gonzalez and Torres4). These lower levels were further associated with a low percentage of LC-PUFA in maternal liver(Reference Torres, Bautista and Tovar22) and MG(Reference Bautista, Rodriguez-Gonzalez and Torres4), as well as with poor fetal brain maturation, demonstrating negative impacts on both maternal and fetal homeostasis. Adequate maternal protein intake is necessary during both gestation and lactating periods(Reference Bautista, Rodriguez-Gonzalez and Torres4). Protein restriction during pregnancy does not affect maternal nursing behaviour, but the mobilisation of maternal stores may be insufficient for nutrient delivery to the pups(Reference Koiter, Moes and Valkhof42).
Pup milk intake was higher in C than R at all stages. Maternal LPD was found to decrease the suckling stimulus in newborns due to a low milk volume(Reference Cherala, Shapiro and D’Mello19, Reference Swierczynski and Sledzinski43). Milk yield also decreased because of protein reduction in the diet during gestation and lactation(Reference Martin Agnoux, Antignac and Boquien44, Reference Sampson and Jansen45). As a result, low neonate suckling behaviour negatively impacts total milk production, potentially due to a change in orexigenic drive in the pups’ appetitive centre at the hypothalamic level(Reference Bautista, Boeck and Larrea7). Non-human primate fetuses whose mothers were undernourished showed increased orexigenic and decreased anorexigenic peptides in the arcuate nucleus appetitive centres(Reference Li, McDonald and Wu46).
Milk protein concentration was higher at mid lactation in C, the time of maximum milk production in rodents(Reference Bautista, Boeck and Larrea7, Reference Bonomo, Lisboa and Passos47, Reference Rayner, Dalgliesh and Duncan48). In contrast, in R, protein concentration was lower than in C and did not show a peak during lactation. A reduction in maternal protein intake led to lower protein and amino acid availability to the pup, which together impaired pup’s health and growth(Reference Wada, Phinney and Weber49, Reference Ballard and Morrow50). Contrasting our results, Grigor et al. found no changes in protein and lipid concentrations in the milk of rats fed low-protein or energy-restricted diets at mid lactation(Reference Grigor, Allan and Carrington51). In agreement with our results, other studies showed that protein restriction in the first half of the lactating phase reduced milk protein concentrations(Reference Ramos, Teixeira and Passos52–Reference Palmquist, Beaulieu and Barbano55). Total protein and casein concentrations gradually increased throughout lactation in rats that doubled their pup weight in 5 d out of a weaning period of 21 d. Human babies doubled their weight in 120 d by consuming only their mother’s milk(Reference Nicholas and Hartmann20). Therefore, from the beginning of lactation, rats need to provide sufficient proteins to support the pups’ organ development(Reference Veith56, Reference Cox, Kent and Casey57). Human milk contains 1·2 mg/l protein, while rat milk contains 10 times that amount (around 11·8 mg/l), providing enough nutrients to double the infant’s birth weight in <5 d(Reference Ballard and Morrow50, Reference Veith56). Under normal conditions, rats produce around 1·5 ml/h milk for ≥10 pups(Reference Bautista, Montano and Ramirez14), while women produce 50 ml/h milk for one or two infants(Reference Kent, Mitoulas and Cregan58, Reference Kent, Hepworth and Sherriff59). Changes in the protein composition of human milk from colostrum to late lactation are associated with environmental variables such as feeding day-time(Reference Ballard and Morrow50). Differences are also associated with maternal geographical location (temperature, elevation, etc.), cultural, and ethnic factors(Reference Su, Thamarai Chelvi and Lim60, Reference Pak-Gorstein, Haq and Graham61). In contrast, since rats were maintained under controlled experimental conditions, changes in the protein content of rat milk only depended on the lactation stage and were relatively independent of environmental changes(Reference Martin, Ling and Blackburn31).
Our study did not modify the quantity or quality of fat in the maternal diet; only protein content was changed. Milk fat concentration was similar in both groups, in contrast to another study that reported a higher milk fat concentration at the beginning of lactation in rats fed a LPD(Reference Palmquist, Beaulieu and Barbano55). However, pup fat intake reduced in R mothers at all stages of lactation. Maternal LPD reduced the percentage of milk DHA as well as milk DHA intake at late lactation.
Other studies have shown that maternal LPD negatively programmed pup’s brain development(Reference Torres, Bautista and Tovar22, Reference Brenna62) and behaviour(Reference Reyes-Castro, Rodriguez and Charco63) in ways that continued into adulthood. DHA supplementation in rat mothers fed with a LPD restored milk fatty acid composition and brain development(Reference Brenna, Salem and Sinclair64). Maternal DHA consumption increased milk and infant plasma DHA levels in both human(Reference Sherry, Oliver and Marriage65) and baboon studies(Reference Carlson and Colombo66, Reference Diau, Hsieh and Sarkadi-Nagy67). Importantly, the biochemical form of long-chain polyunsaturates in milk affects incorporation into the neonatal brain(Reference Wijendran, Huang and Diau68).
Early programming by maternal LPD affects body, liver and brain development. Lower percentages of hippocampal AA and DHA correlate with neural cell membrane composition and cognitive function in early life(Reference Diau, Hsieh and Sarkadi-Nagy67, Reference Heird and Lapillonne69). These results also are in line with our previous studies showing that maternal LPD programmed offspring liver and brain development, metabolic dysfunction(Reference Zambrano, Martinez-Samayoa and Bautista70, Reference Zambrano, Bautista and Deas71), adult life appetitive behaviour, lower body weight and leptin serum concentrations(Reference Zambrano, Martinez-Samayoa and Bautista70, Reference Zambrano, Bautista and Deas71). LPD was found to impair reproductive functions(Reference Rodriguez-Gonzalez, Vigueras-Villasenor and Millan72, Reference Rodriguez-Gonzalez, Vega and Boeck73), delaying sexual maturation, onset of puberty and decreased sperm quality(Reference Rodriguez-Gonzalez, Reyes-Castro and Vega74). LPD also causes offspring anxiety-type behaviour and learning and cognitive problems(Reference Reyes-Castro, Padilla-Gomez and Parga-Martinez9, Reference Reyes-Castro, Rodriguez and Charco63, Reference Reyes-Castro, Rodriguez and Rodriguez-Gonzalez75). Here we found that offsprings of LPD-fed rats had lower hippocampal AA and DHA (%). The brain is the most complex and interactive organ in the body. The hippocampal region is closely involved in the control of both short- and long-term memory and in memories associated with spatial learning and planning(Reference Diau, Hsieh and Sarkadi-Nagy67, Reference Heird and Lapillonne69, Reference Buzsaki76, Reference Castro-Chavira, Aguilar-Vazquez and Martinez-Chavez77).
To our knowledge few studies have been conducted to identify the effects of inadequate maternal protein diet on maternal MG function and offspring nutrient delivery during lactation; studies that have been reported addressed mostly milk composition(Reference Martin Agnoux, Antignac and Boquien44). This is unfortunate since a LPD has been extensively studied to induce developmental programming in the offspring(Reference Pine, Jessop and Oldham54, Reference Agnoux, El Ghaziri and Moyon78). The present study provides data on the effects of LPD on maternal outcomes in key organs, milk production and composition, and pups’ organ development in a rat model. Milk also confers bioactive molecules that are known to protect the mother and offspring from infections and inflammation, contributing to maternal and neonatal immune maturation, organ development and healthy microbial colonisation(Reference Ballard and Morrow50).
In conclusion, maternal LPD delayed MG differentiation and milk production, affecting the pups’ milk nutrient intake, with negative consequences on the development of multiple organs in pups by weaning. Adequate maternal nutrition during lactation is a key factor in offspring’s life course health.
Acknowledgements
C. I. is a graduate student from Doctorado en Ciencias Bioquímicas, Universidad Nacional Autónoma de México, and is recipient of a Consejo Nacional de Ciencia y Tecnología (CONACyT) fellowship (262656).
This work was supported by CONACyT (E. Z., 155166), Mexico City, Mexico.
CONACyT had no role in the design, analysis or writing of this article.
C. J. B.: researched data, study design, manuscript writing; R. J. B., S. M. and L. R. C.: researched data; O. N. R. and C. A. I.: contributed to discussion and reviewed manuscript; P. W. N.: study design and preparation of the manuscript; E. Z.: responsible for the study design and preparation of the manuscript.
There were no conflicts of interest.


