


Introduction
Ammonoid cephalopod mollusks (commonly referred to as “ammonites” by Cretaceous ammonoid workers; Wright et al. Reference Wright, Calloman, Howarth and Moore1996) are classic organisms for evolutionary studies thanks to their excellent fossil record, high rates of speciation and extinction, and preservation of morphological changes through ontogeny (see references in reviews by De Baets et al. Reference De Baets, Bert, Hoffmann, Monnet, Yacobucci, Klug, Klug, Korn, De Baets, Kruta and Mapes2015a; Monnet et al. Reference Monnet, Klug, De Baets, Klug, Korn, Baets, Kruta and Mapes2015; Yacobucci Reference Yacobucci, Klug, Korn, De Baets, Kruta and Mapes2015). It is often argued that they show high levels of morphological/ecophenotypic plasticity similar to modern cephalopods (Doubleday et al. Reference Doubleday, Prowse, Arkhipkin, Pierce, Semmens, Steer, Leporati, Lourenço, Quetglas, Sauer and Gillanders2016). Intraspecific variability is rarely quantified in ammonoids, particularly for “heteromorph” or uncoiled ammonoids (Kakabadze Reference Kakabadze2004), but their fossil record provides the opportunity to examine large sample sizes geographically and temporally—perfect for testing hypotheses of macroevolutionary change versus stasis in the fossil record.
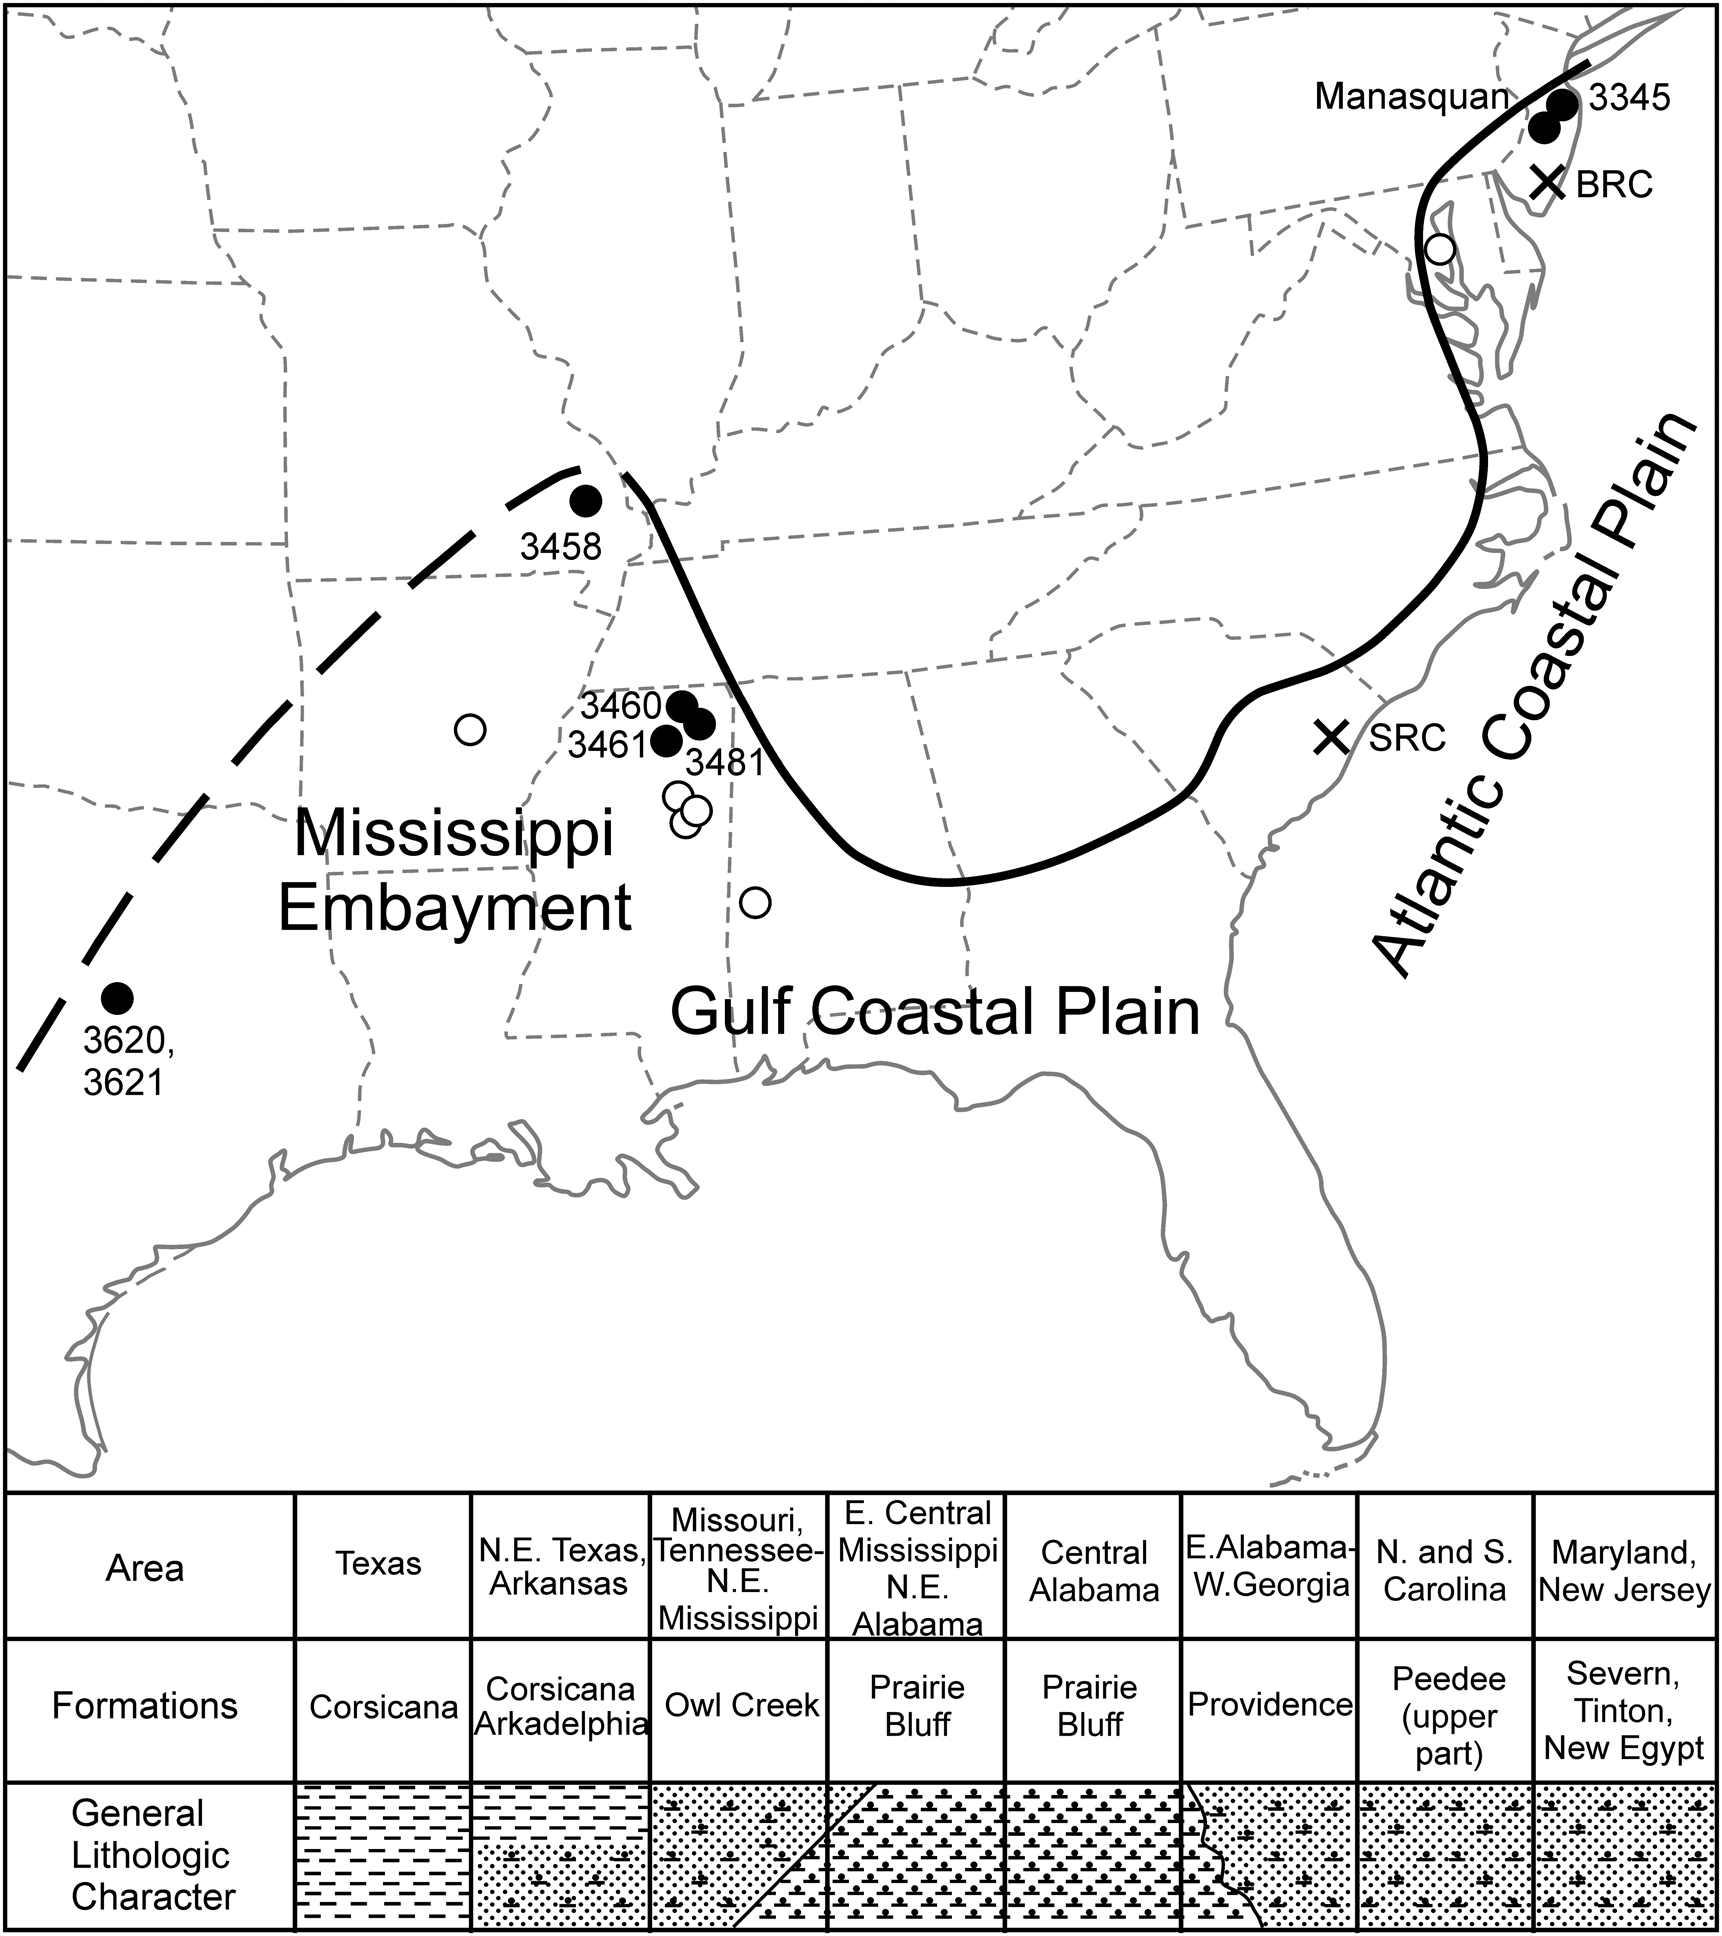
In this study, we examine the morphology of the ammonoid species Discoscaphites iris (family Scaphitidae) across the Atlantic Coastal Plain (ACP) and Gulf Coastal Plain (GCP) of the United States (Fig. 1) using collections from multiple sites. Scaphitid ammonoids are well preserved, widely distributed, and locally abundant in Late Cretaceous shallow-marine sediments across the Northern Hemisphere (e.g., Landman and Waage Reference Landman and Waage1993; Machalski Reference Machalski2005; Landman et al. Reference Landman, Kennedy, Cobban and Larson2010, Reference Landman, Goolaerts, Jagt, Jagt-Yazykova, Machalski and Yacobucci2014). Discoscaphites in particular is one of the last common ammonoid genera found at the end of the Cretaceous (see review by Landman et al. Reference Landman, Goolaerts, Jagt, Jagt-Yazykova, Machalski, Klug, Korn, De Baets, Kruta and Mapes2015), and in North America, numerous species occur in the Maastrichtian of the ACP, GCP, and the Western Interior Seaway (WIS) (Fig. 2). Discoscaphites iris is abundant in upper Maastrichtian sediments across the ACP and GCP and defines the D. iris Assemblage Zone—the highest ammonoid biostratigraphic zone in North America (Fig. 2) (Landman et al. Reference Landman, Johnson and Edwards2004a; Larina et al. Reference Larina, Garb, Landman, Dastas, Thibault, Edwards, Phillips, Rovelli, Myers and Naujokaityte2016; Witts et al. Reference Witts, Landman, Garb, Irizarry, Larina, Thibault, Razmjooei, Yancey and Myers2021). A single fragmentary specimen has also been reported from the upper Maastrichtian of Libya (Machalski et al. Reference Machalski, Jagt, Landman and Uberna2009), but this occurrence requires further study, and the species is otherwise unknown outside North America. Our sample from the ACP and GCP therefore represents a well-known and well-delineated “time slice” (see Koch Reference Koch1996) and provides an opportunity to examine morphological variation in an ammonoid species across virtually its entire geographic and temporal range. These data provide quantitative information on the range, limits, and potential drivers of intraspecific variation and adaptational change (or lack thereof) that characterize an ammonoid species. They also contribute to broader issues of evolutionary tempo during the latest Cretaceous (e.g., the species stasis debate; see Lidgard and Hopkins Reference Lidgard, Hopkins and Losos2015), and the drivers and predominate mode of ammonoid evolution and speciation (Wani Reference Wani2011; Yacobucci Reference Yacobucci, Klug, Korn, De Baets, Kruta and Mapes2015). Finally, a better understanding of the intraspecific evolutionary changes of species immediately preceding the end-Cretaceous (K/Pg) mass extinction event will shed light on the abundance and “health” of ammonoid populations immediately before their terminal extinction.
Locality map illustrating sites where Discoscaphites iris is found across the Atlantic Coastal Plain (ACP) and Gulf Coastal Plain (GCP) (black and white circles). Labeled black circles are sites that yielded specimens for this study. Black crosses are important drill cores used for biostratigraphic correlation of microfossil taxa (see Landman et al. Reference Landman, Johnson and Edwards2004a; Larina et al. Reference Larina, Garb, Landman, Dastas, Thibault, Edwards, Phillips, Rovelli, Myers and Naujokaityte2016). SRC, Santee Reserve Core; BRC, Bass River Core. Lower portion of figure is a cross section (SW–NE) illustrating general lithologic character/facies distribution and formations that contain the D. iris Zone across the ACP and GCP.
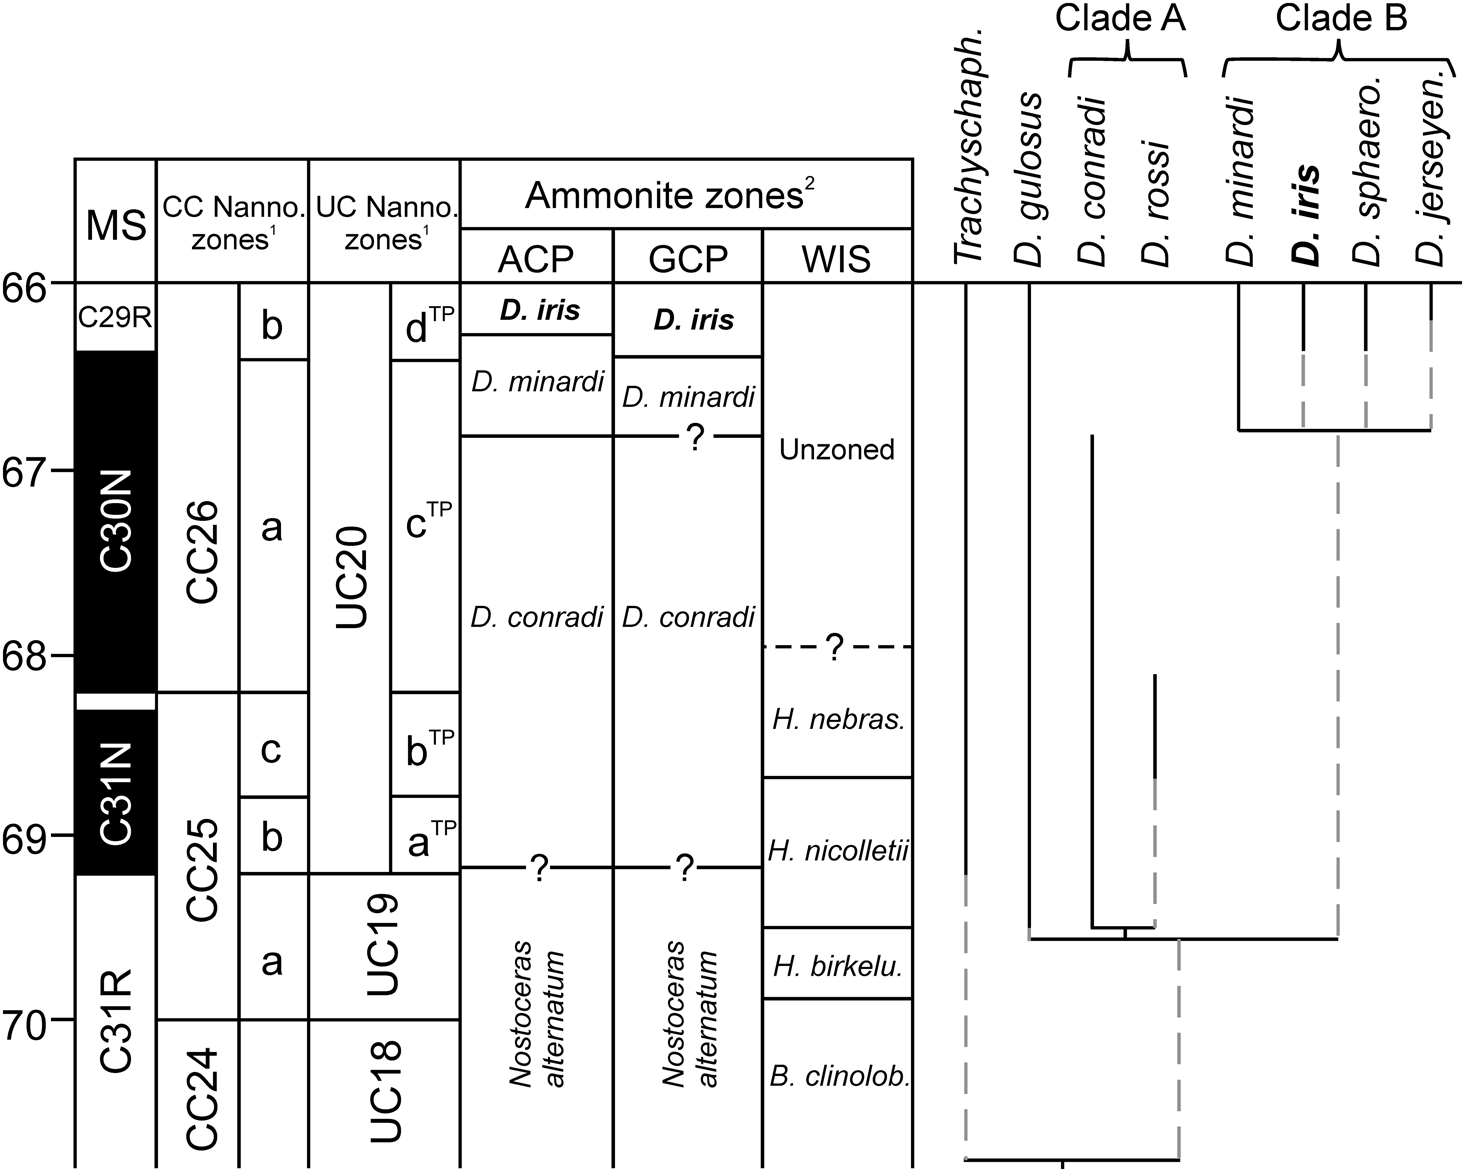
Biostratigraphic framework for the Gulf and Atlantic Coastal Plains, USA, based on (1) calcareous nannofossils and (2) ammonite zonation (modified from Larina et al. Reference Larina, Garb, Landman, Dastas, Thibault, Edwards, Phillips, Rovelli, Myers and Naujokaityte2016), with tentative correlation to the Western Interior Seaway (WIS) zonation (based on data in Landman et al. Reference Landman, Johnson and Edwards2004a, Reference Landman, Johnson, Garb, Edwards and Kyte2007; Cobban et al. Reference Cobban, Walaszczyk, Obradovich and McKinney2006). Also plotted is the phylogenetic analysis of relationships among North American Discoscaphites species from the consensus tree of Landman et al. (Reference Landman, Johnson, Garb, Edwards and Kyte2007), with the genus Trachyscaphites as the outgroup. Vertical black lines indicate observed stratigraphic ranges. MS, magnetostratigraphy; B. clinolob., Baculites clinolobatus; H. birkelu., Hoploscaphites birkelundae; H. nebras., Hoploscaphites nebrascensis; Trachyscaph., Trachyscaphites; D. sphaero., Discoscaphites sphaeroidalis; D. jerseyen., Discoscaphites jerseyensis.
Background
The Discoscaphites iris Zone is characterized in the ACP and GCP by the co-occurrence of the index ammonoid with (1) the calcareous nannofossil Micula prinsii—the marker of the uppermost Maastrichtian Subzone CC26b in the scheme of Perch-Nielsen (Reference Perch-Nielsen, Bolli, Saunders and Perch-Nielsen1985) or UC20dTP in the Tethyan scheme of Burnett (Reference Burnett, Gallagher, Hampton and Bown1998)—and (2) the dinoflagellates Palynodinium grallator, Disphaerogena carposphaeropsis, and Thalassiphora pelagica (Landman et al. Reference Landman, Johnson and Edwards2004a,Reference Landman, Johnson and Edwardsb; Larina et al. Reference Larina, Garb, Landman, Dastas, Thibault, Edwards, Phillips, Rovelli, Myers and Naujokaityte2016). It also coincides with planktonic foraminiferal zones CF1 (Plummerita hantkeninoides), CF2, and possibly the upper part of CF3 (Pseudoguembelina hariaensis) (Abramovich et al. Reference Abramovich, Keller, Berner, Cymbalista, Keller and Adatte2011; Witts et al. Reference Witts, Landman, Garb, Irizarry, Larina, Thibault, Razmjooei, Yancey and Myers2021). These biostratigraphic markers all overlap with the upper part of magnetochron C30N and overlying chron C29R (Landman et al. Reference Landman, Johnson and Edwards2004a; Abramovich et al. Reference Abramovich, Keller, Berner, Cymbalista, Keller and Adatte2011; Larina et al. Reference Larina, Garb, Landman, Dastas, Thibault, Edwards, Phillips, Rovelli, Myers and Naujokaityte2016; Witts et al. Reference Witts, Landman, Garb, Irizarry, Larina, Thibault, Razmjooei, Yancey and Myers2021), the base of which is currently dated at ~340–400 ka before the K/Pg boundary (66.04 Ma) (Fig. 2) (Batenburg et al. Reference Batenburg, Gale, Hilgen, Hüsing, Laskar, Liebrand, Lirer, Orue-Etxebarria, Pelosi and Smit2012; Thibault Reference Thibault2018; Ogg Reference Ogg, Gradstein, Ogg, Schmitz and Ogg2020). Although its precise duration is unknown, these combined data constrain the D. iris Zone to the last 1 Myr and more likely the last ~400 kyr of the Maastrichtian. As a minimum estimate for its duration, recent cyclostratigraphic analyses in the GCP suggest the D. iris Zone could represent as little as 185 kyr (Naujokaitytė et al. Reference Naujokaitytė, Garb, Thibault, Brophy, Landman, Witts, Cochran, Larina, Phillips and Myers2021).
As previously mentioned, this time interval is of interest due to its proximity to the K/Pg mass extinction event. Although substantial evidence suggests the primary cause of this event is a bolide impact at Chicxulub in the Gulf of Mexico (e.g., Schulte et al. Reference Schulte, Alegret, Arenillas, Arz, Barton, Bown, Bralower, Christeson, Claeys, Cockell, Collins, Deutsch, Goldin, Goto, Grajales-Nishimura, Grieve, Gulick, Johnson, Kiessling, Koeberl, Kring, MacLeod, Matsui, Melosh, Montanari, Morgan, Neal, Nichols, Norris, Pierazzo, Ravizza, Rebolledo-Vieyra, Reimold, Robin, Salge, Speijer, Sweet, Urrutia-Fucugauchi, Vajda, Whalen and Willumsen2010; Hull et al. Reference Hull, Bornemann, Penman, Henehan, Norris, Wilson, Blum, Alegret, Batenburg, Bown, Bralower, Cournede, Deutsch, Donner, Friedrich, Jehle, Kim, Kroon, Lippert, Loroch, Moebius, Moriya, Peppe, Ravizza, Röhl, Schueth, Sepúlveda, Sexton, Sibert, Śliwińska, Summons, Thomas, Westerhold, Whiteside, Yamaguchi and Zachos2020), the final ~400 kyr of the Maastrichtian are characterized by dynamic environmental changes. These coincide with emplacement of the “main phase” of the Deccan Traps Large Igneous Province (LIP) in India (Schoene et al. Reference Schoene, Eddy, Samperton, Keller, Keller, Adatte and Khadri2019; Sprain et al. Reference Sprain, Renne, Vanderkluysen, Pande, Self and Mittal2019), linked to a period of rapid global climate warming and cooling (Barnet et al. Reference Barnet, Littler, Kroon, Leng, Westerhold, Röhl and Zachos2018; Hull et al. Reference Hull, Bornemann, Penman, Henehan, Norris, Wilson, Blum, Alegret, Batenburg, Bown, Bralower, Cournede, Deutsch, Donner, Friedrich, Jehle, Kim, Kroon, Lippert, Loroch, Moebius, Moriya, Peppe, Ravizza, Röhl, Schueth, Sepúlveda, Sexton, Sibert, Śliwińska, Summons, Thomas, Westerhold, Whiteside, Yamaguchi and Zachos2020; also see Dzombak et al. Reference Dzombak, Sheldon, Mohabey and Samant2020). Shifts in the distribution, richness, and abundance of various groups of marine plankton occur alongside these climate changes before the K/Pg boundary (Olsson Reference Olsson2001; Thibault Reference Thibault2016; Vellekoop et al. Reference Vellekoop, Woelders, Sluijs, Miller and Speijer2019), while morphological changes (dwarfing) and increased fragmentation in some planktonic foraminifera hint at stressful conditions in the oceans (MacLeod et al. Reference MacLeod, Ortiz, Fefferman, Clyde, Schulter, MacLean, Culver and Rawson2000; Keller and Abramovich Reference Keller and Abramovich2009; Henehan et al. Reference Henehan, Hull, Penman, Rae and Schmidt2016; Gilabert et al. Reference Gilabert, Arenillas, Arz, Batenburg and Robinson2021). The influence of these environmental changes on ammonoid species has been debated, with some workers suggesting widespread global decline of ammonoids leading into the K/Pg (e.g., Stinnesbeck et al. Reference Stinnesbeck, Ifrlm and Salazar2012) and others supporting species’ health and even increased abundance during the latest Cretaceous (Landman et al. Reference Landman, Goolaerts, Jagt, Jagt-Yazykova, Machalski and Yacobucci2014, Reference Landman, Goolaerts, Jagt, Jagt-Yazykova, Machalski, Klug, Korn, De Baets, Kruta and Mapes2015; Witts et al. Reference Witts, Bowman, Wignall, Alistair Crame, Francis and Newton2015, Reference Witts, Landman, Garb, Boas, Larina, Rovelli, Edwards, Sherrell and Cochran2018, Reference Witts, Landman, Garb, Irizarry, Larina, Thibault, Razmjooei, Yancey and Myers2021).
Methods
To date, Discoscaphites iris has been recorded from >15 localities across the ACP and GCP (see summary in Witts et al. Reference Witts, Landman, Garb, Irizarry, Larina, Thibault, Razmjooei, Yancey and Myers2021). The abundance of specimens at each locality varies due to local differences in preservation and differing sampling intensities. Our final morphometric dataset consists of 328 specimens collected from nine localities in Texas, Missouri, Mississippi, and New Jersey, representing a ~2000 km transect from SW to NE and encompassing the full geographic spread of these occurrences (Fig. 1). Some examples of D. iris are illustrated in Supplementary Figures 1 and 2. Specimens are reposited in the collections of the American Museum of Natural History (Division of Paleontology) (AMNH), Department of Earth and Planetary Sciences, University of New Mexico (UNM), U.S. Geological Survey (USGS), Monmouth County Amateur Paleontological Society (MAPS), and the Museum at the Black Hills Institute of Geological Research (MBHI) (full details for each specimen are available in Supplementary Dataset 1). The stratigraphy of most of the localities these specimens are derived from is detailed in the literature (e.g., Landman et al. Reference Landman, Johnson and Edwards2004b, Reference Landman, Johnson, Garb, Edwards and Kyte2007; Larina et al. Reference Larina, Garb, Landman, Dastas, Thibault, Edwards, Phillips, Rovelli, Myers and Naujokaityte2016; Witts et al. Reference Witts, Landman, Garb, Boas, Larina, Rovelli, Edwards, Sherrell and Cochran2018, Reference Witts, Landman, Garb, Irizarry, Larina, Thibault, Razmjooei, Yancey and Myers2021) and briefly reviewed in the following sections; a summary of locality information is provided in Table 1.
Summary of locality and sample information for sites across the geographic extent of the Discoscaphites iris Zone included in this study.
New Jersey
The D. iris Zone is present at the top of the Tinton and New Egypt Formations, which outcrop in Monmouth County, New Jersey. Both units are glauconite-rich mudstones. At AMNH locality 3345, D. iris specimens are derived from the upper 20 cm of the New Egypt Formation below the K/Pg boundary, which at this locality is an unconformable lag deposit (also known as the “Main Fossiliferous Layer”) containing reworked macro- and microfossils (Landman et al. Reference Landman, Johnson and Edwards2004b). In the Manasquan River basin (e.g., AMNH localities 3335 and 3372), material comes from the upper 1 m of the Tinton Formation, primarily from the top 20 cm, which is a richly fossiliferous unit known as the “Pinna Layer” (Landman et al. Reference Landman, Johnson, Garb, Edwards and Kyte2007). An iridium anomaly occurs at the base of the “Pinna Layer,” suggesting a conformable K/Pg sequence, but the boundary itself is probably best placed at the top of this unit (see discussion in Landman et al. Reference Landman, Garb, Rovelli, Ebel and Edwards2012b). Measurements from AMNH localities 3335, 3345, and 3372 were mostly taken from the published literature (Landman et al. Reference Landman, Johnson and Edwards2004b, Reference Landman, Johnson, Garb, Edwards and Kyte2007) and are combined due to geographic proximity.
Mississippi
The D. iris Zone occurs in both the mixed carbonate-clastic Prairie Bluff Chalk and the laterally equivalent siliciclastic Owl Creek Formation (Fig. 1). A 1.55-m-thick section of the Owl Creek Formation crops out at AMNH locality 3481 in Union County (Witts et al. Reference Witts, Landman, Garb, Boas, Larina, Rovelli, Edwards, Sherrell and Cochran2018), comprising three distinct units: a 52-cm-thick lower, brown-colored muddy sandstone; a 35-cm-thick gray-colored micaceous muddy siltstone; and a 68-cm-thick yellow-colored bioturbated and well-bedded silty sandstone. Discoscaphites iris specimens come from both the brown and gray units, which are abundantly fossiliferous. Only fragments were found in the upper, yellow-bedded unit. The K/Pg boundary occurs at the base of the overlying Clayton Formation, which is a 30-cm-thick poorly sorted muddy quartz sand containing rip-up clasts of Owl Creek Formation, bioclasts, and altered Chicxulub impact spherules (Witts et al. Reference Witts, Landman, Garb, Boas, Larina, Rovelli, Edwards, Sherrell and Cochran2018). Lithologically similar sediments are also exposed in Union County at AMNH locality 3461, with specimens of D. iris abundant in the upper Owl Creek Formation. At this site, the Owl Creek Formation is a ~1-m-thick yellow-colored, bioturbated, and fossiliferous silty sandstone. The K/Pg boundary occurs at the base of the Clayton Formation, which is a 15-cm-thick cross-bedded sandstone that again contains altered Chicxulub impact spherules overlain by a 10-cm-thick bioclastic limestone.
At the Owl Creek type locality in Tippah County (AMNH loc. 3460), D. iris occurs throughout a ~9-m-thick succession of bioturbated micaceous siltstones and sandstones with occasional laminated intervals (Larina et al. Reference Larina, Garb, Landman, Dastas, Thibault, Edwards, Phillips, Rovelli, Myers and Naujokaityte2016). Macrofossils at this locality are often found in “pods” that may represent relict burrows and are beautifully preserved with original aragonitic shell material permitting isotopic analyses (e.g., Sessa et al. Reference Sessa, Larina, Knoll, Garb, Cochran, Huber, MacLeod and Landman2015; Ferguson et al. Reference Ferguson, Macleod, Landman and Sessa2019). The Clayton Formation again overlies the Owl Creek Formation and is composed of 5 m of poorly fossiliferous orange fine-grained quartz sand and intervals of bryozoan-rich bioclastic limestone. The K/Pg boundary is coincident with the unconformable contact at the top of the Owl Creek Formation.
Missouri
The Owl Creek Formation outcrops along Crowley's Ridge in Stoddard and Scott Counties (Stephenson Reference Stephenson1955). The D. iris biozone occurs at AMNH locality 3458, which consists of a 1.5-m-thick outcrop of micaceous sandy siltstone overlain by 0.5-m-thick glauconite-rich muddy sandstones of the Danian Clayton Formation. The unconformable contact between these units marks the K/Pg boundary (Dastas et al. Reference Dastas, Chamberlain and Garb2014). Fossils are abundant in the Owl Creek Formation, and like the Owl Creek type section in Mississippi, often occur in pods that may represent in-filled burrows.
Texas
Material comes from outcrops along the Brazos River and its tributaries in Falls County that preserve a continuous and expanded record across the K/Pg boundary (Witts et al. Reference Witts, Landman, Garb, Irizarry, Larina, Thibault, Razmjooei, Yancey and Myers2021). Discoscaphites iris were collected from AMNH localities 3620 (Darting Minnow Creek) and 3621 (Cottonmouth Creek), which both contain 1.5- to 2-m-thick outcrops of the upper Corsicana Formation, a fossiliferous dark mudstone. The lower part of the overlying Kincaid Formation contains complex clastic “event deposits” related to the Chicxulub impact event, the base of which marks the K/Pg boundary (Hansen et al. Reference Hansen, Farrand, Montgomery, Billman and Blechschmidt1987; Hart et al. Reference Hart, Yancey, Leighton, Miller, Liu, Smart and Twitchett2012; Yancey and Liu Reference Yancey and Liu2013). Most D. iris come from the Corsicana Formation, but one specimen is derived from the basal unit of the K/Pg event deposit.
To assess paleoenvironmental conditions at each locality, grain-size analyses were conducted on bulk sediment samples collected from stratigraphic units or intervals containing D. iris specimens (Table 1). Data for localities in New Jersey were taken from the published literature (Landman et al. Reference Landman, Johnson and Edwards2004b, Reference Landman, Johnson, Garb, Edwards and Kyte2007). For other localities, sediment samples were physically disaggregated and mixed with a 6% hexametaphosphate solution for 10 minutes. They were then wet sieved in a 63 μm sieve to separate sand- and mud-size (<63 μm) fractions, and percentages of these grain-size fractions were then calculated based on weight loss.
Morphometric Measurements
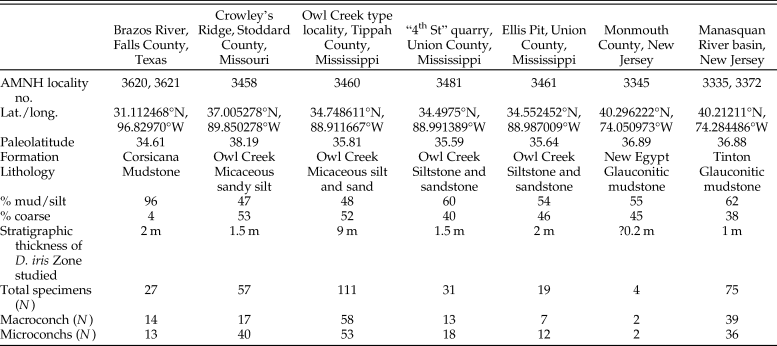
Morphometric parameters were measured on well-preserved adult specimens and are the same as those described in Witts et al. (Reference Witts, Landman, Hopkins and Myers2020) for the closely related species Hoploscaphites nicolletii (Fig. 3). All measurements were made using electronic calipers (accuracy of 0.01 mm) on actual specimens. The adult shell of D. iris consists of two parts, a closely coiled phragmocone and a slightly to strongly uncoiled body chamber. The adult phragmocone is the part of the phragmocone that is exposed in the adult shell. The body chamber consists of the shaft, beginning near the last septum, and a hook terminating at the aperture. The point at which the hook curves backward is called the point of recurvature. Dimorphism is present in D. iris, as in all scaphitid ammonoids and many modern cephalopods, and is interpreted as sexual in nature (Landman and Waage Reference Landman and Waage1993; Davis et al. Reference Davis, Landman, Dommergues, Marchand, Bucher, Landman, Tanabe and Davis1996; Landman et al. Reference Landman, Kennedy, Cobban and Larson2010). The dimorphs are referred to as the macroconch, presumably the female, and the microconch, presumably the male. Dimorphism is generally expressed by differences in size, robustness, and degree of uncoiling. Results for each dimorph are described separately. A full taxonomic description is available in Supplementary Material.
Specimen of Discoscaphites iris (AMNH 115966—a macroconch—taken from AMNH locality 3460 [Owl Creek type locality, Mississippi]) with explanation of morphometric parameters measured in this study. A, Lateral view showing maximum length (LMAX) and whorl height measurements (HP, HS, HH). B, Ventral view showing whorl width measurements (WP, WS, WH). All measurements are intercostal. See text for further explanation of morphological terminology.
Maximum length (LMAX) was measured from the venter of the phragmocone to the venter of the hook parallel to the umbilical margin; whorl height was measured at three points on the shell: the end of the phragmocone (HP), midshaft (HS), and the point of recurvature (HH); whorl width was also measured at these same points (WP, WS, WH). The ratios of whorl width to whorl height were calculated at each of these three points (e.g., WP/HP) and provide a measure of the degree of whorl compression. Two additional shape ratios were also calculated; the ratio of maximum length to whorl height of the phragmocone along the line of maximum length (LMAX/HP) is a measure of the degree of uncoiling. The ratio of maximum length to whorl height at midshaft (LMAX/HS) is a measure of the degree of curvature of the body chamber in lateral view. If the outline of the body chamber in lateral view is a semicircle, the ratio equals 2. The ratio applies only to macroconchs, because the umbilical seam of the body chamber usually coincides with the line of maximum length in these forms, and the whorl height is the distance from the line of maximum length to the venter of the body chamber (equivalent to the radius in the case of a semicircle).
Shape measurements were made at each locality, but whorl compression ratios were not measured on specimens from the Brazos River localities, as these specimens were still embedded in matrix. It is important to note that these data represent variation among mature adults rather than ontogenetic variation (Landman et al. Reference Landman, Klofak, Sarg and Harries2008). This is because the mature stage of scaphitid ammonoids is well defined by the uncoiling of the body chamber (e.g., Landman and Waage Reference Landman and Waage1993; Landman et al. Reference Landman, Kennedy, Cobban and Larson2010); whorl compression ratios taken at different points on the shell provide some information on ontogenetic changes.
Statistical Analyses
Morphological changes were evaluated using box-and-whisker plots to graphically examine the entire distribution of morphological parameters across the D. iris Zone (sensu Monnet et al. Reference Monnet, Bucher, Guex and Wasmer2012). We also calculated the coefficient of variation (CV) for size and shape ratios as well as whorl compression ratios at each site. CV is the standard deviation divided by the mean value of each morphological trait and is often used as a measure of intraspecific variation in ammonoids (e.g., De Baets et al. Reference De Baets, Klug and Monnet2013, Reference De Baets, Bert, Hoffmann, Monnet, Yacobucci, Klug, Klug, Korn, De Baets, Kruta and Mapes2015a; Klein and Landman Reference Klein and Landman2019). Nonparametric Mann-Whitney U-tests were used to evaluate the statistical significance of changes in mean morphological trait values between localities. To correct for multiple comparisons we adjusted p-values generated by the Mann-Whitney tests for each morphological trait using three methods. We applied a Bonferroni correction and also controlled for the false discovery rate using the methods of Benjamini and Hochberg (Reference Benjamini and Hochberg1995) and Benjamini and Yekutieli (Reference Benjamini and Yekutieli2001). Only results considered below are those that were consistently statistically significant across all four of these methods, or at least three out of four methods if the conservative Bonferroni correction did not show significance.
We also explored relationships between morphological traits and several environmental variables available at each locality using linear modeling via the LM function in R (R Core Team 2021). Variables considered for each locality were paleolatitude (available using the Paleolatitude Calculator: www.paleolatitude.org ; van Hinsbergen et al. Reference Hinsbergen, van, van Schaik, Spakman, Bijl, Sluijs, Langereis and Brinkhuis2015) and present-day longitude, which act as reliable proxies for original geographic location and distribution of the samples along the paleoshoreline of the ACP and GCP, and sediment grain size defined as percent of sand-sized material derived from our analyses (Table 1). Grain size varies according to lithology, which itself varies according to numerous factors such as energy level in the environment of deposition, relative water depth, or position relative to shore (Jacobs et al. Reference Jacobs, Landman and Chamberlain1994; Klein and Landman Reference Klein and Landman2019). These physical changes occur along with changes in various biological factors (see “Discussion”). Models were run for each morphological trait and separately for macroconchs and microconchs (Table 2). Separate linear models were also run excluding specimens from the Brazos River localities, which lack shell compression data. All statistical and linear modeling analyses were conducted in R (R Core Team 2021).
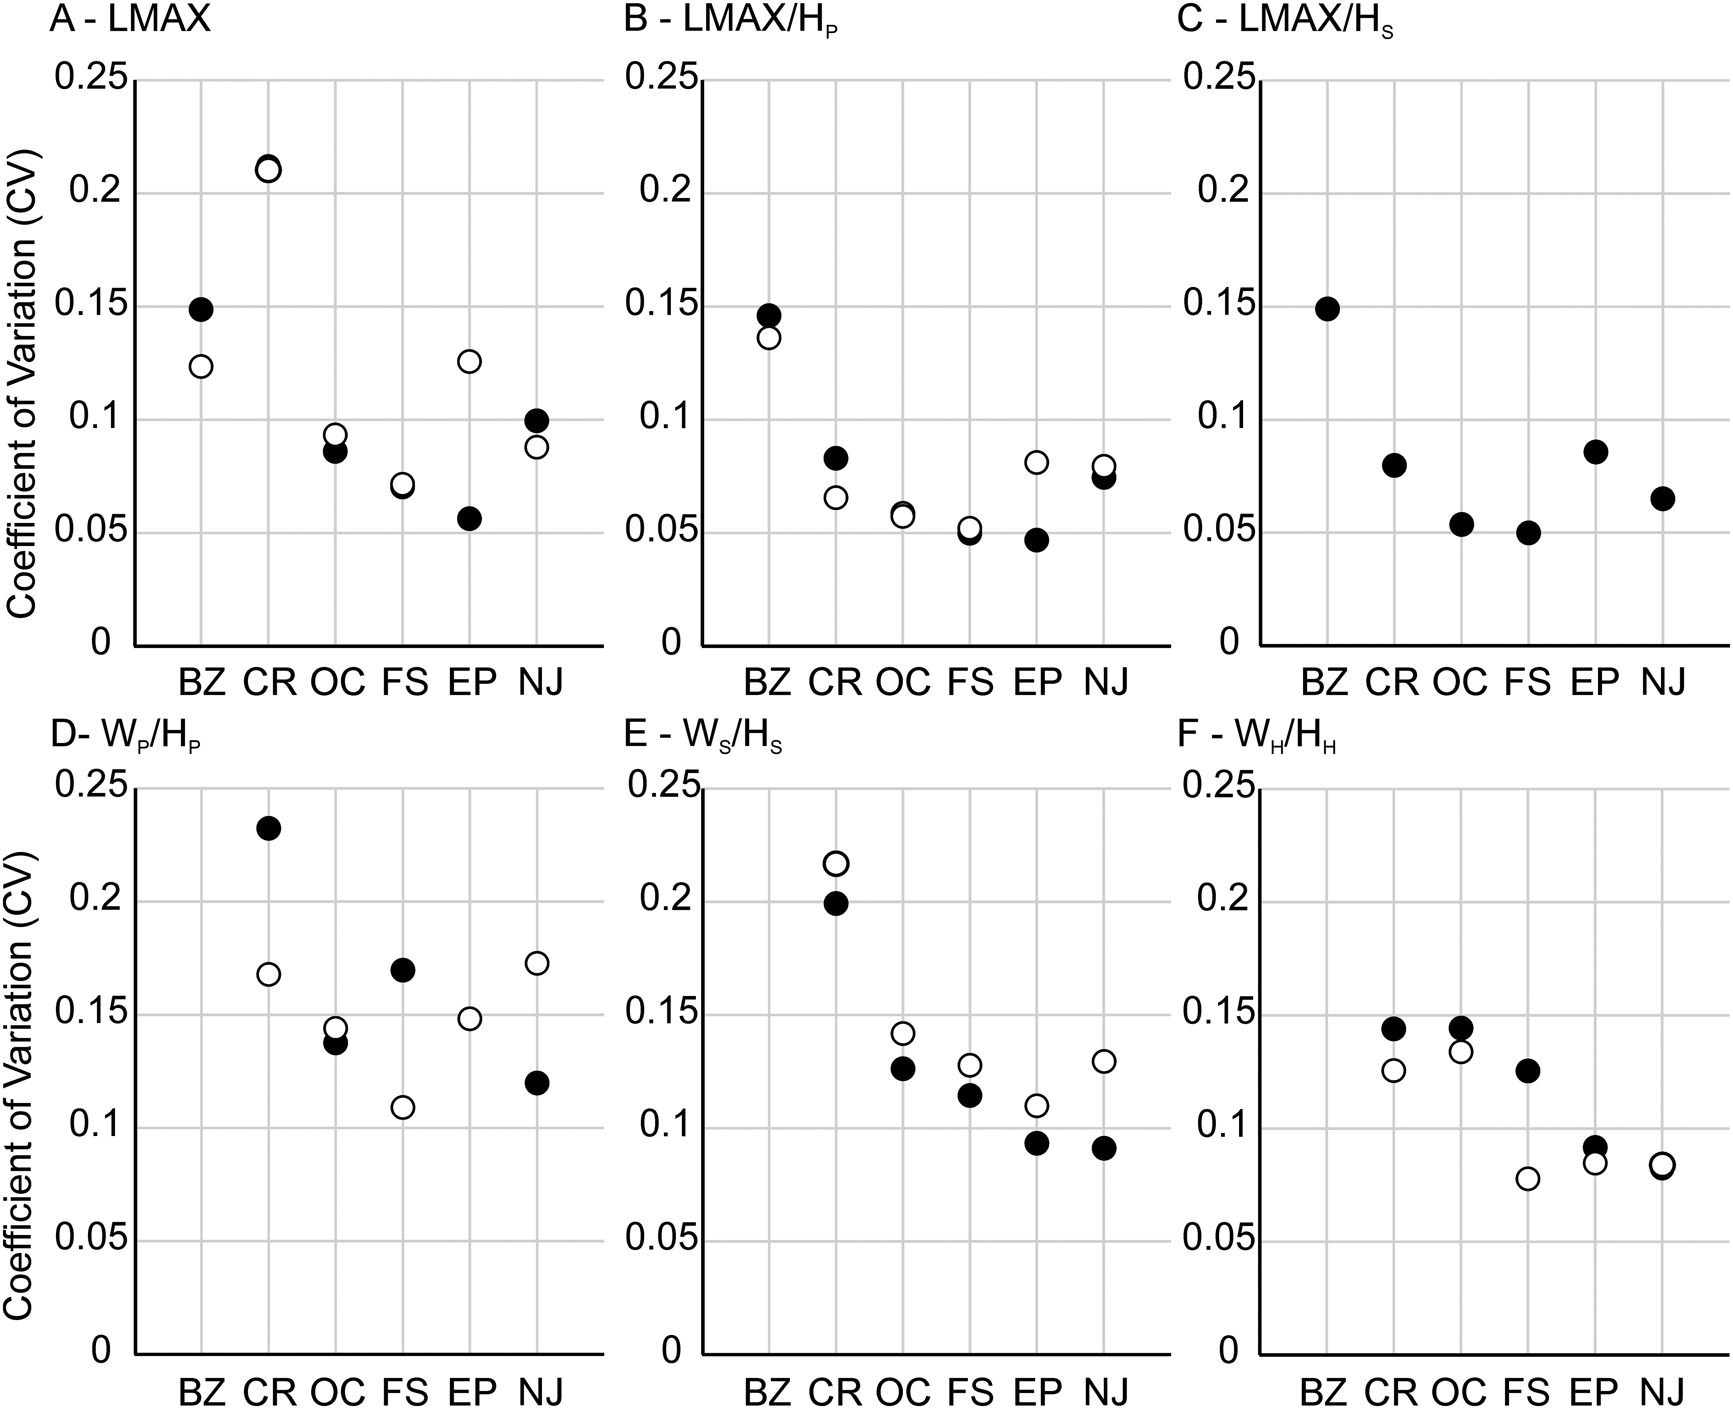
Descriptions of four multiple linear regression models with morphological traits analyzed in each model (size = LMAX; shape = LMAX/HP, LMAX/HS; compression = WP/HP, WS/HS, WH/HH), environmental variables, and geographic localities (coded according to U.S. state) analyzed. NJ, New Jersey; MS, Mississippi; MO, Missouri; TX, Texas.
Results
The total distribution of size, shape, and shell compression measurements for specimens of Discoscaphites iris are illustrated in Figures 4 and 5 as box-and-whisker plots. Plots are arranged geographically from Texas to New Jersey along a general SW-NE transect. For shape traits like maximum length (LMAX) and degree of uncoiling (LMAX/HP), a clear difference is visible between macroconchs and microconchs at each locality (Fig. 4A,B). Macroconchs are larger than microconchs, while microconchs are more rounded, reflecting the inflated body chamber and straight umbilical margin in macroconchs. All shape traits (also including degree of curvature [LMAX/HS] for macroconchs; Fig. 4C) show overlap between localities. The ratio of the largest to smallest specimen ranges from 1.14 (AMNH loc. 3461, Ellis Pit) to 1.83 (AMNH loc. 3458, Crowley's Ridge) for macroconchs, and from 1.34 (AMNH loc. 3481, “4th St”) to 2.38 (AMNH loc. 3458) for microconchs. Whorl compression ratios also show overlap at all sites between macro- and microconchs (Fig. 5), and between localities across the entire extent of the D. iris Zone with no consistent pattern. Full morphological and environmental datasets are available in Supplementary Datasets 2 and 4.
Box-and-whisker plots showing size (A, LMAX) and shape ratios (B, LMAX/HP, C, LMAX/HS) of Discoscaphites iris specimens, plotted geographically from SW (Texas) to NE (New Jersey). Box edges represent the first and third quartile, horizontal black line is the median. Whiskers illustrate the minimum and maximum. Circles are outliers. Data are presented separately for each dimorph; gray shaded boxes are macroconchs, white boxes are microconchs. Note that LMAX/HS is not measured on microconchs.

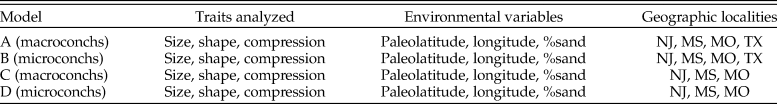
Box-and-whisker plots showing whorl compression ratios of Discoscaphites iris specimens plotted geographically from SW (Missouri) to NE (New Jersey). A, WP/HP, B, WS/HS, C, WH/HH. Box edges represent the first and third quartile, horizontal black line is the median. Whiskers illustrate the minimum and maximum. Circles are outliers. Data are presented separately for each dimorph; gray shaded boxes are macroconchs, white boxes are microconchs. Compression ratios were not measured on specimens from Brazos River, Texas.
The range of intraspecific variation is similar to estimates from other studies of morphological traits in scaphitids (Landman Reference Landman1987; Klein and Landman Reference Klein and Landman2019; Witts et al. Reference Witts, Landman, Hopkins and Myers2020). Values of the CV for shape traits range from 5% to 21% for both dimorphs and show few clear patterns (Fig. 6, Table 3). Most shape traits show CV values of <10%. LMAX generally shows the largest variation in both dimorphs (Fig. 6A,B), while LMAX/HP and LMAX/HS (for macroconchs) are less variable. Whorl compression CV values in macroconchs range from 7% to 23%, with WP/HP (whorl compression at the base of the phragmocone) consistently the most variable (Fig. 6C,D). Microconchs show a similar pattern, with values of CV ranging from 8% to 22%; WP/HP again consistently shows the largest variation and WH/HH (compression of the hook) the least. Interestingly, CV values for all three whorl compression traits from the Owl Creek type section (AMNH loc. 3460)—the locality with the longest stratigraphic time series—show the smallest range, tightly clustered around 14%. No correlation is observed between CV values and either sample size or stratigraphic thickness of any locality (Supplementary Figs. 3, 4).
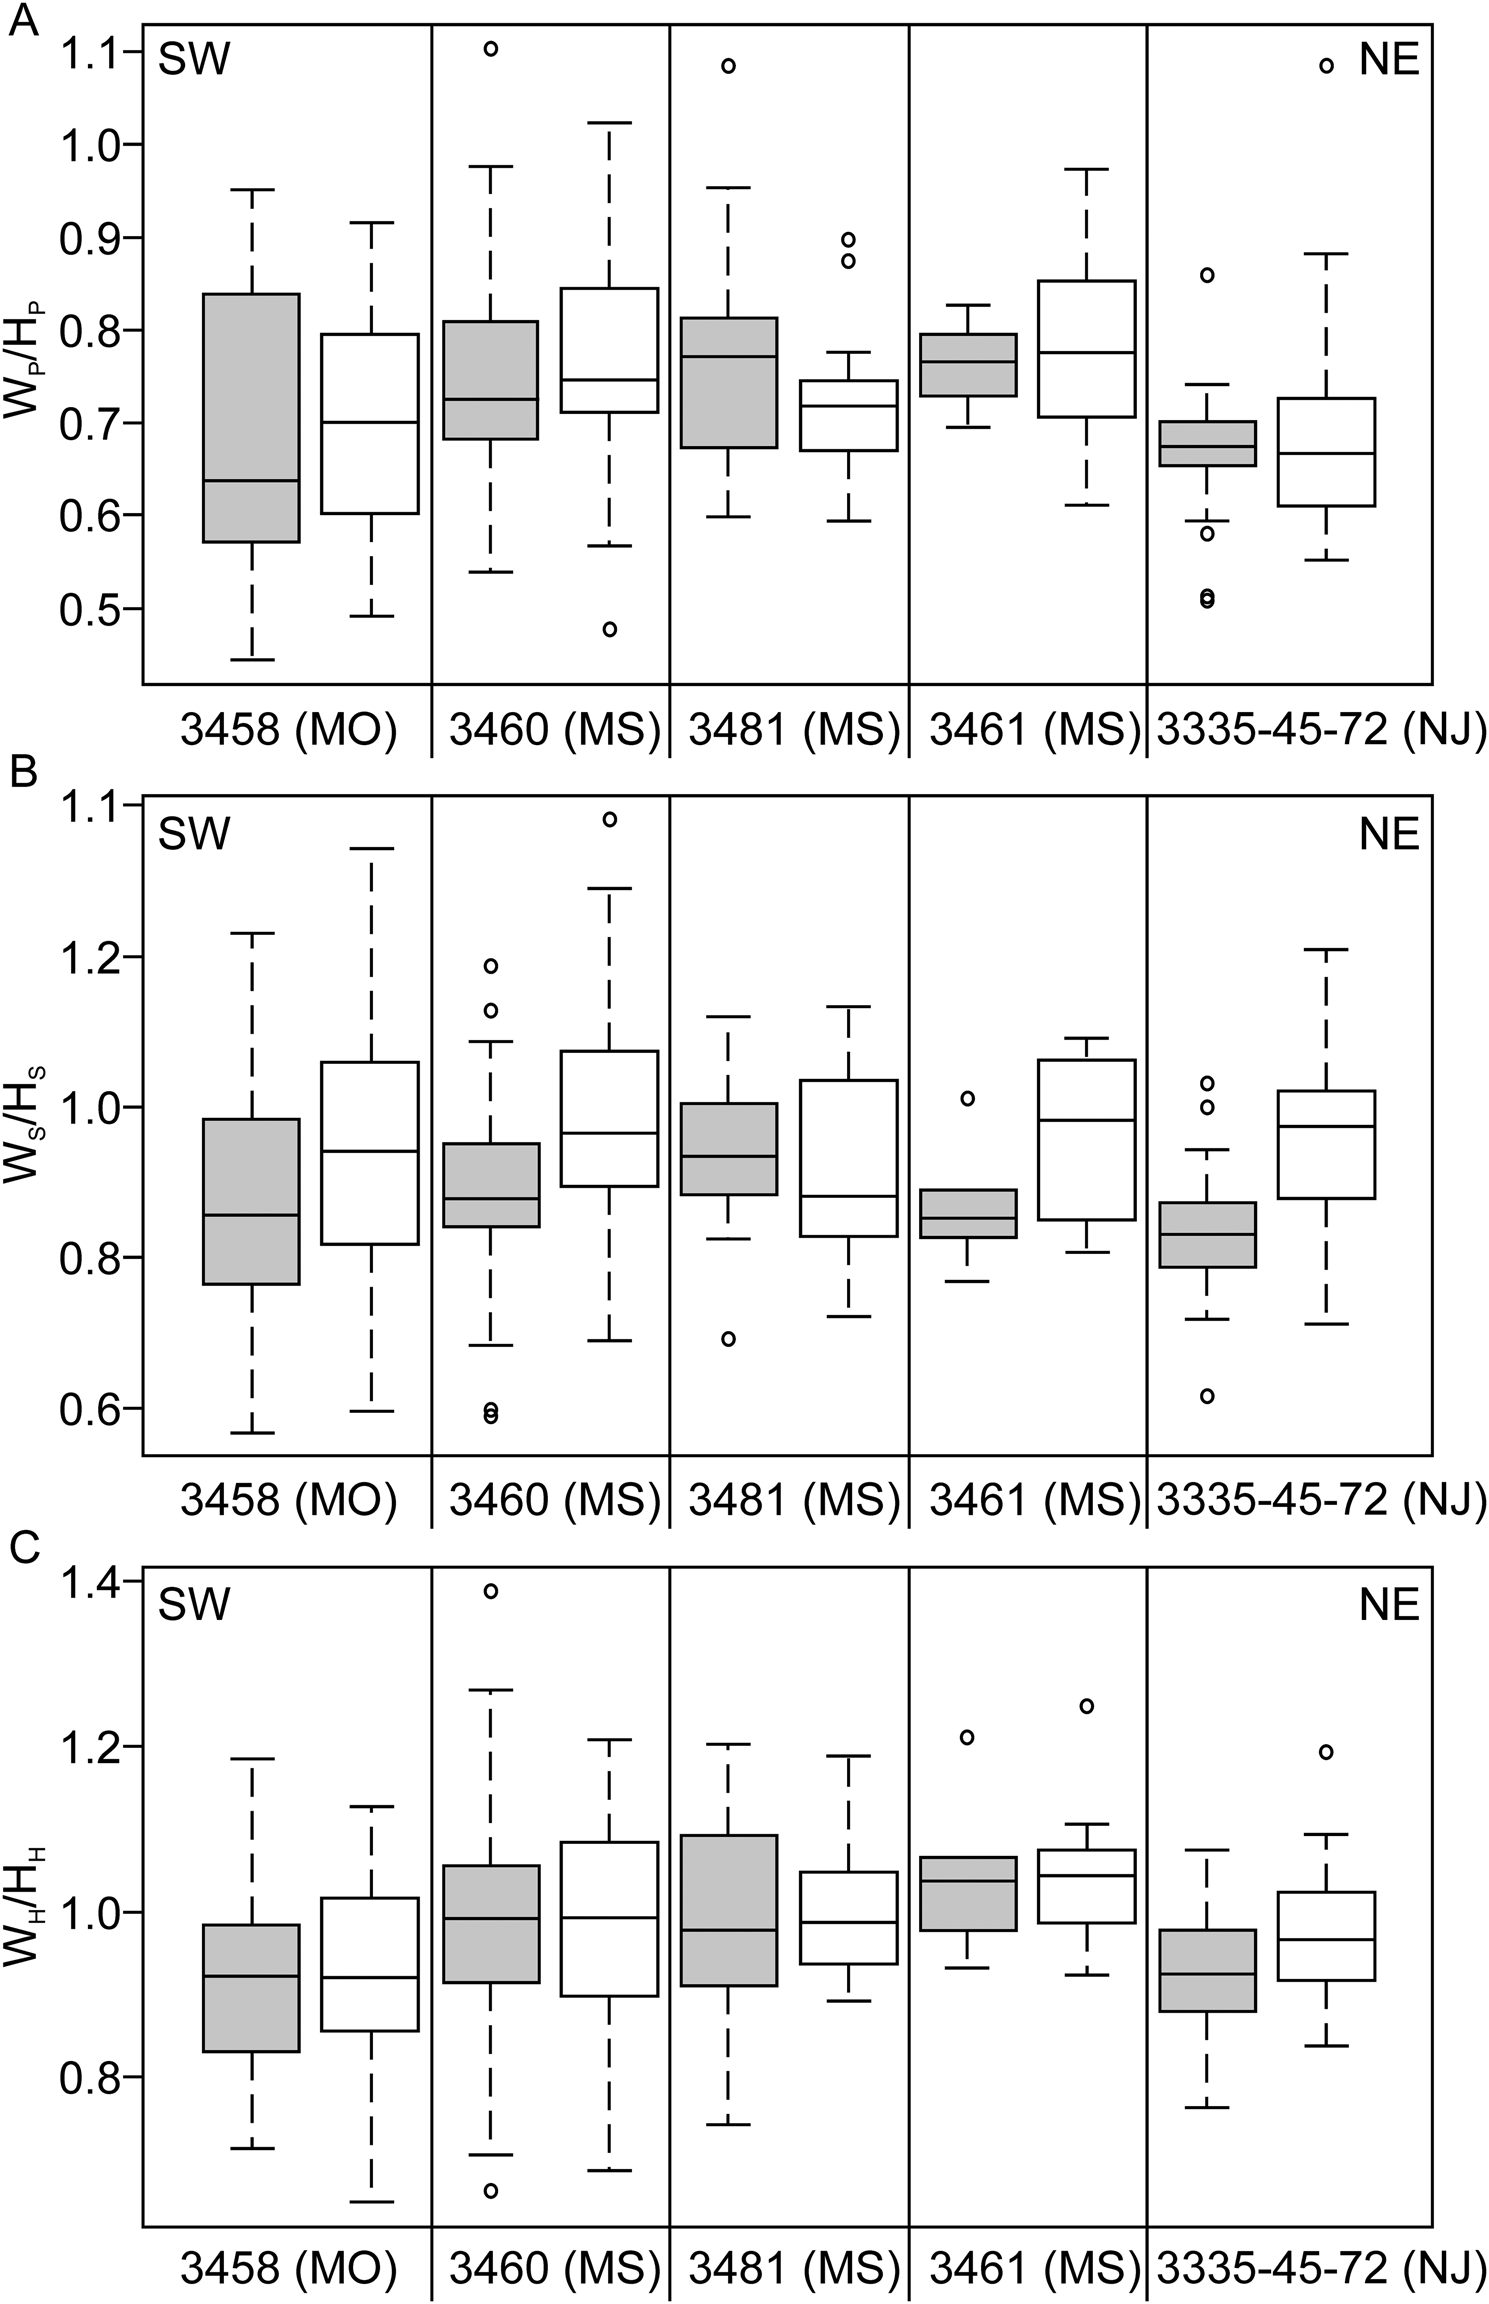
Plots showing coefficient of variation (CV) values for shape traits (A–C) and whorl compression traits (D–F). Data are presented separately for macroconchs (black circles) and microconchs (open circles). BZ, Brazos River (AMNH locs. 3620/3621); CR, Crowley's Ridge (AMNH loc. 3458); OC, Owl Creek (AMNH loc. 3460); FS, “4th St” (AMNH loc. 3481); EP, Ellis Pit (AMNH loc. 3461); NJ, New Jersey localities.
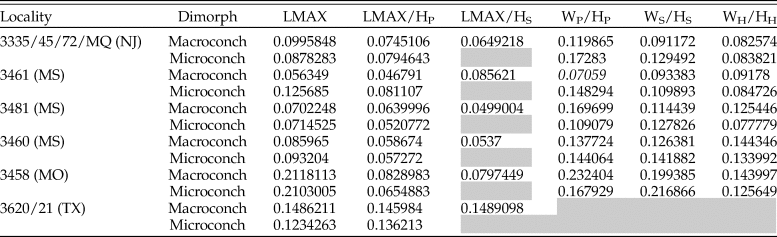
Calculated coefficients of variation (CV) for morphological traits arranged by dimorph and locality. MQ, Manasquan. Gray squares represent no data; LMAX/HS is only measured in macroconchs. Whorl compression ratios are not available for Brazos River localities.
The results of pairwise Mann Whitney U-tests show that significant differences in morphology of both D. iris macro- and microconchs are present between several localities. However, after adjusting p-values for multiple comparisons using three different methods (a Bonferroni correction and attempting to control for the false discovery rate using the methodologies of both Benjamini and Hochberg [1995] and Benjamini and Yekutieli [2001]), only five results were consistently statistically significantly different (Table 4). Maximum length (LMAX)—essentially a proxy for size at maturity—of D. iris macroconchs between AMNH localities 3460 and (1) AMNH localities 3620/3621 (Brazos River), (2) AMNH locality 3481, and (3) New Jersey localities. In two cases (AMNH loc. 3460 and AMNH loc. 3481 vs. New Jersey localities), macroconchs also show a consistently significant difference in whorl compression at midshaft (WS/HS). Five comparisons were statistically significant in three out of four analyses; macroconch LMAX between AMNH locality 3461 and (1) AMNH localities 3481 and (2) 3620/21, (3) macroconch WP/HP between AMNH locality 3460 and New Jersey localities, (4) microconch WP/HP between AMNH locality 3460 and New Jersey localities, and (5) microconch WH/HH between AMNH locality 3461 and AMNH locality 3458. However, comparisons with the conservative Bonferroni correction are statistically significant in none of these cases. All other traits show either no statistically significant differences or a lack of consistency when p-values are corrected for multiple comparisons across the geographic extent of the D. iris Zone. Full results of our statistical analyses are available in Supplementary Datasets 3 and 5–7, and all R code is available as part of the Supplementary Material for this paper.
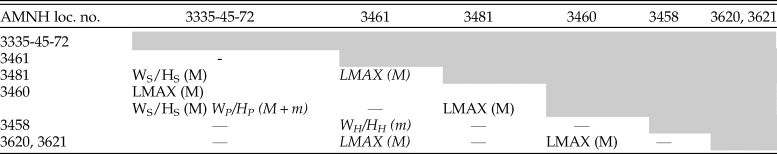
Morphological traits that show consistent statistically significant differences between localities for macroconchs (M) and microconchs (m). Based on four analyses: Mann-Whitney U-test, analysis of p-values using a Bonferroni correction for multiple comparisons, and assessment of the false discovery rate using the methods of Benjamini and Yekutili (Reference Benjamini and Yekutieli2001) and Benjamini and Hochberg (Reference Benjamini and Hochberg1995). Italicized results are those that are statistically significant in only 3/4 analyses.
Linear modeling indicates that grain size shows a statistically significant relationship with macroconch LMAX in all models (models A and C) (Table 5). Microconch LMAX also shows a statistically significant relationship with both present-day longitude and paleolatitude when data for all localities are included (model B), but these relationships are not maintained for longitude when data from the Brazos River localities in Texas (AMNH locs. 3620 and 3621) are excluded (model D). Macroconch LMAX shows a significant relationship with paleolatitude, but in this case only when data from Texas are excluded (model C). LMAX/HP and LMAX/HS show no significant relationships with environmental variables. Whorl compression at the base of the phragmocone (WP/HP) in microconchs shows a statistically significant relationship with paleolatitude and grain size (models B and D). Whorl compression at the hook (WH/HH) in both dimorphs shows a significant relationship with paleolatitude (models A–D). Despite these correlations, however, all linear models, including those producing statistically significant relationships, have very low r 2 values (<0.2/20%) (Table 6). The relationship between macroconch LMAX and grain size shows the highest r 2 values, suggesting that it explains 12%–18% variance in models A and C. Overall, these analyses indicate at best a weak relationship with environmental parameters in some traits, with no single environmental parameter influencing all traits. Model results are illustrated in Supplementary Figures 5–10.
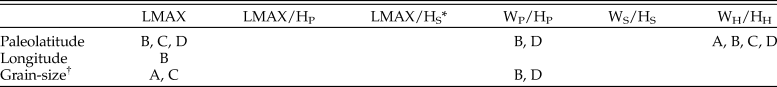
Results table highlighting those models (A–D) that resulted in statistically significant relationships between morphological traits and environmental variables at the 95% confidence level. *LMAX/HS is only measured on macroconchs (models A and C). †%silt/mud and %sand were calculated separately but are here combined into a single grain-size variable based on %sand.
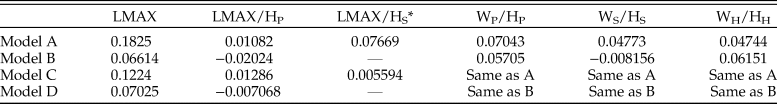
Adjusted r 2 values indicating descriptive power of linear models for each morphological trait examined in this study. *LMAX/HS is only measured on macroconchs, hence not present in models B and D.
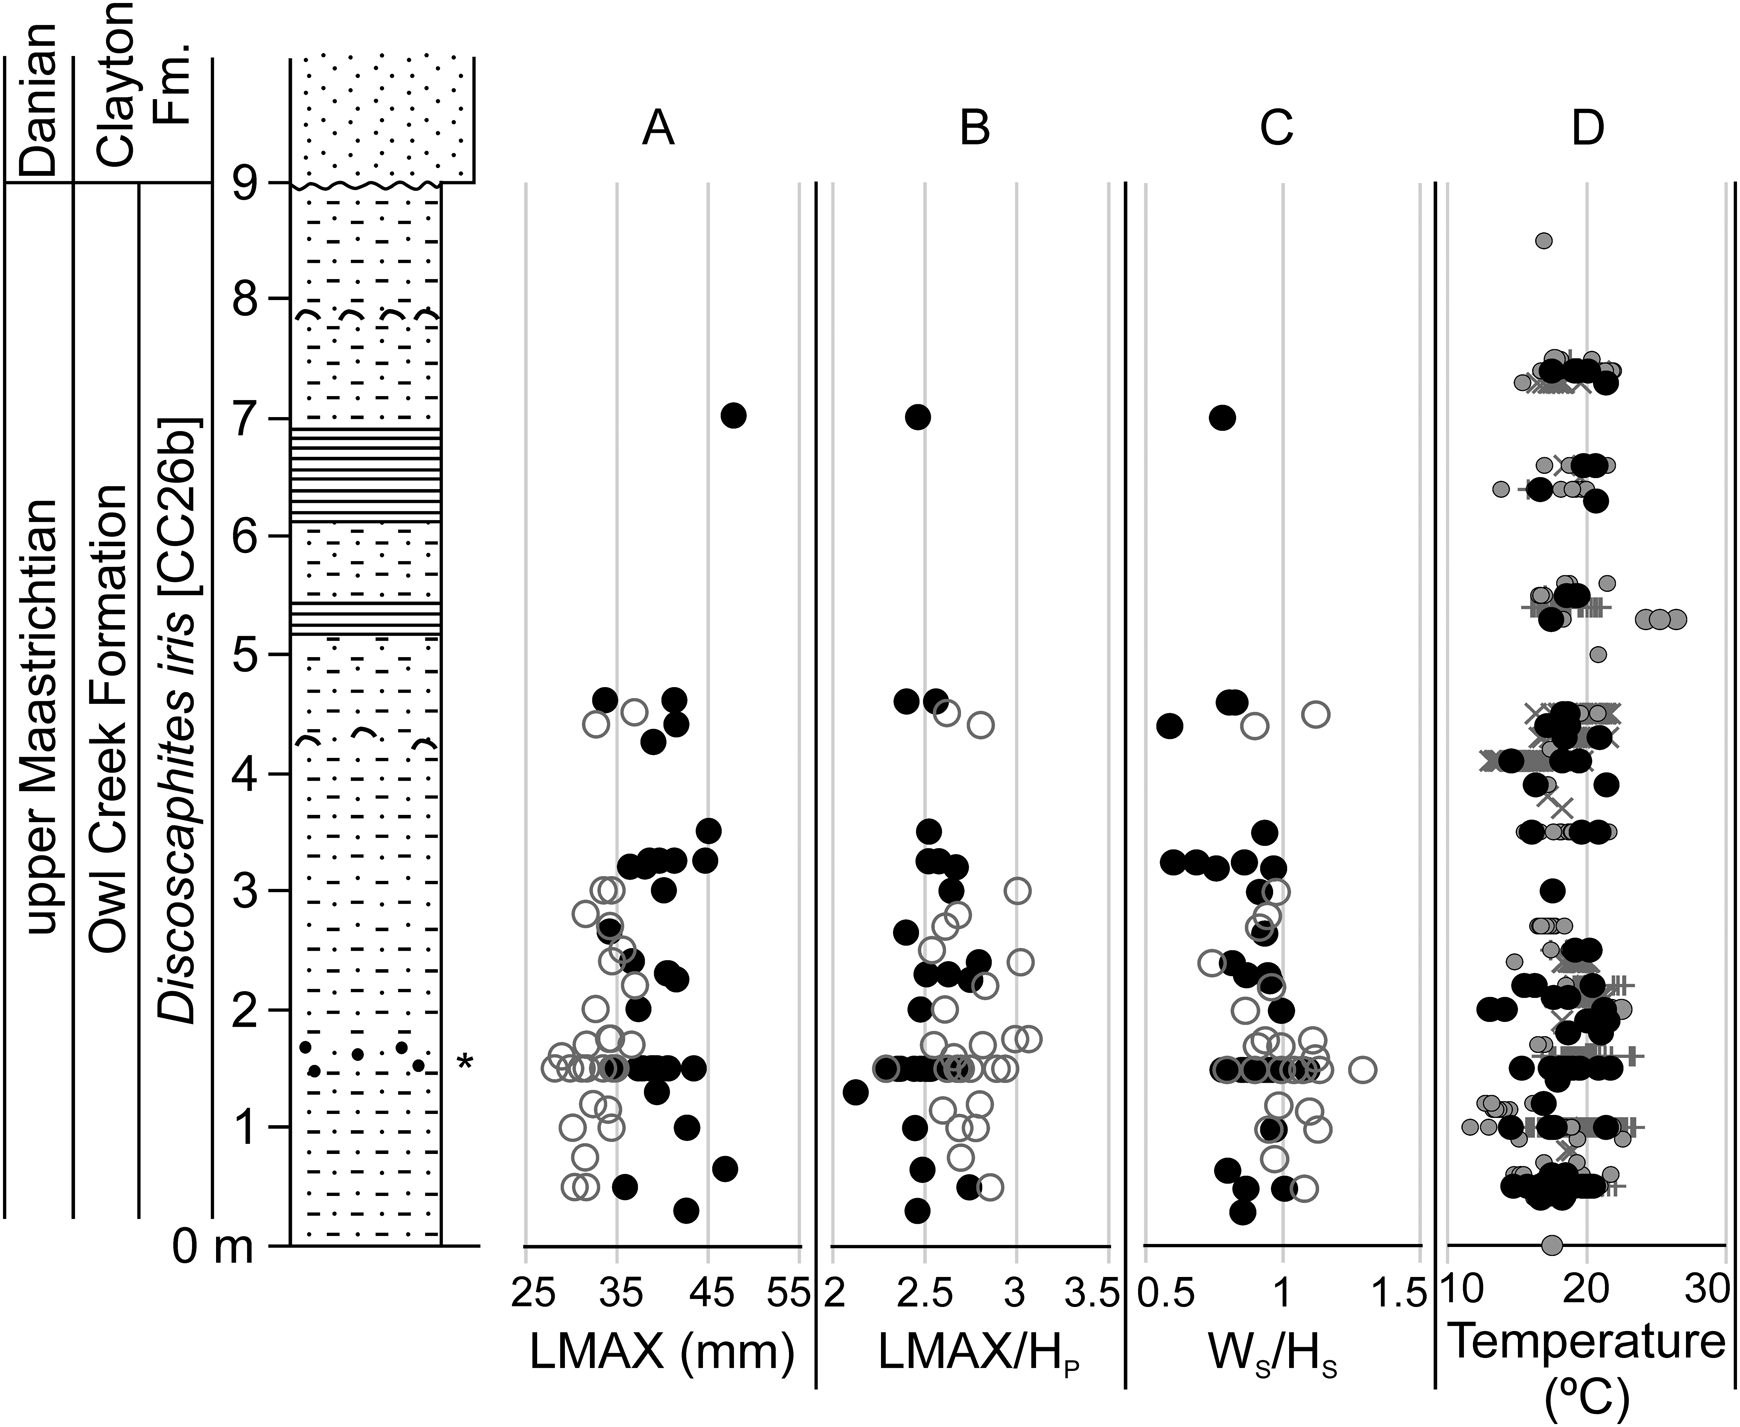
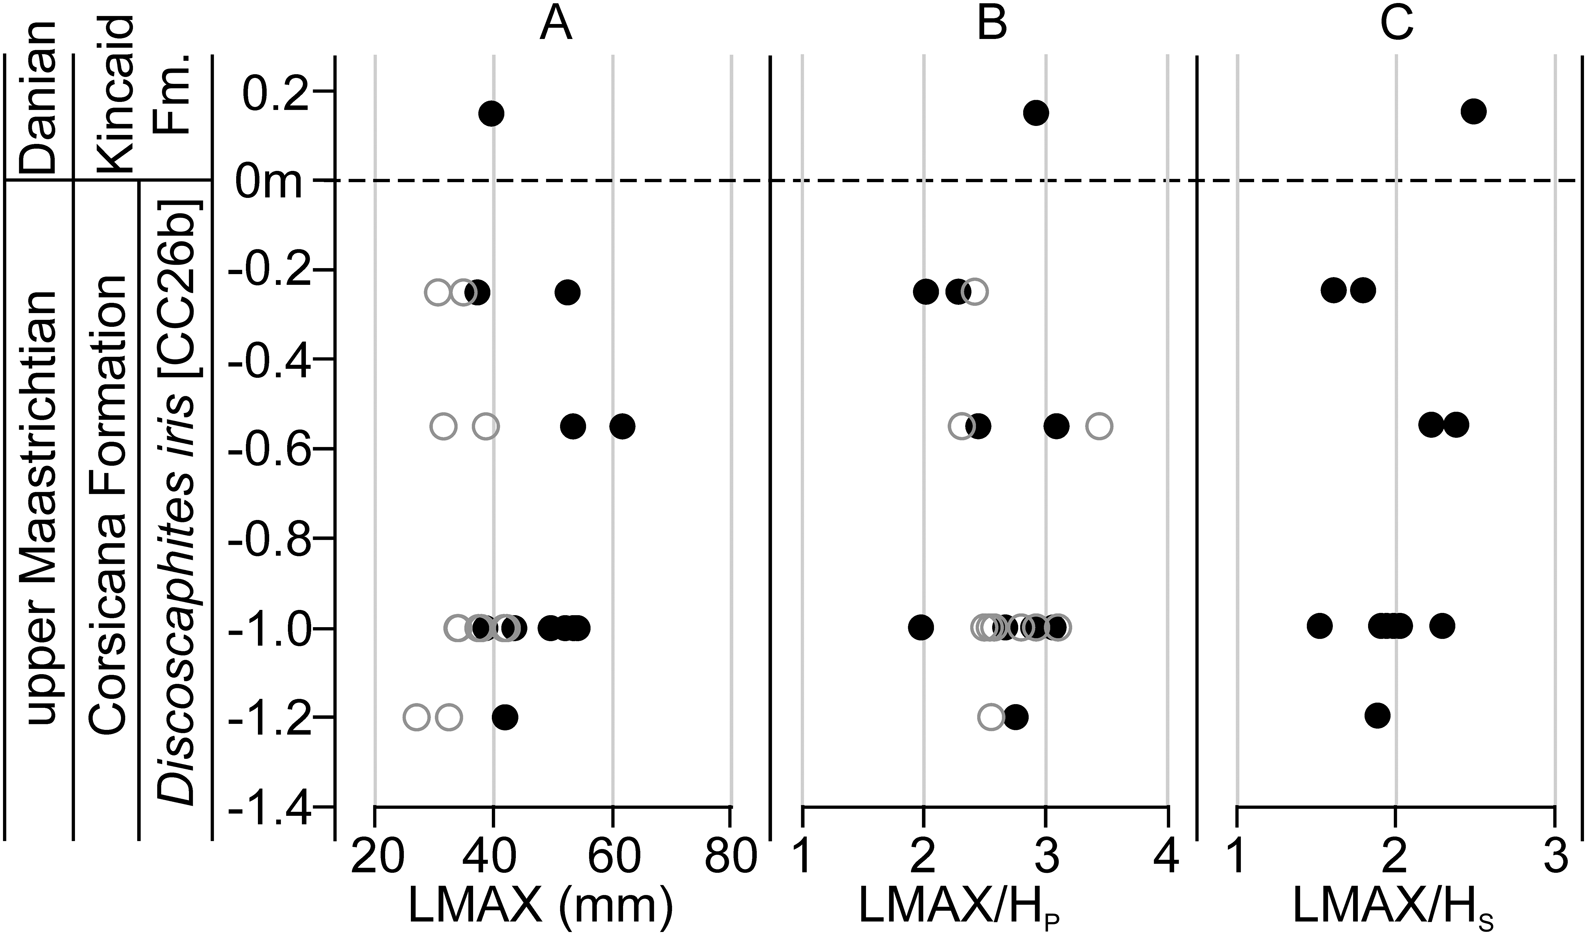
Temporal trends in morphometric data were assessed at AMNH locality 3460 (the Owl Creek type section, Mississippi), which provides the longest continuous stratigraphic record among our localities (Fig. 7) (Sessa et al. Reference Sessa, Larina, Knoll, Garb, Cochran, Huber, MacLeod and Landman2015; Larina et al. Reference Larina, Garb, Landman, Dastas, Thibault, Edwards, Phillips, Rovelli, Myers and Naujokaityte2016). Data from AMNH localities 3620 and 3621 (Brazos River, Texas) were also plotted against stratigraphy (Fig. 8). Here, data from the Corsicana Formation are presented in a composite section relative to the position of the K/Pg boundary at the base of clastic event deposits in the overlying Kincaid Formation (for details, see Witts et al. Reference Witts, Landman, Garb, Irizarry, Larina, Thibault, Razmjooei, Yancey and Myers2021). These data generally support the geographic box-and-whisker plots; in both cases, no clear directional trend is apparent in any morphological characters up-section, but a range of variation is present at any given stratigraphic horizon. Likewise, comparison with published paleotemperature estimates at AMNH locality 3460 (Sessa et al. Reference Sessa, Larina, Knoll, Garb, Cochran, Huber, MacLeod and Landman2015; Ferguson et al. Reference Ferguson, Macleod, Landman and Sessa2019) reveal no trend (Fig. 7D).
Stratigraphic changes in selected Discoscaphites iris morphometric traits and paleotemperature at AMNH locality 3460 (Owl Creek type locality, Mississippi). Section modified from Larina et al. (Reference Larina, Garb, Landman, Dastas, Thibault, Edwards, Phillips, Rovelli, Myers and Naujokaityte2016). A, LMAX; B, LMAX/HP; C, WS/HS. Filled black circles in A–C are macroconchs, open gray circles are microconchs. D, Paleotemperature data derived from oxygen isotope analysis of various groups of macrofossils (Sessa et al. Reference Sessa, Larina, Knoll, Garb, Cochran, Huber, MacLeod and Landman2015; Ferguson et al. Reference Ferguson, Macleod, Landman and Sessa2019), converted to temperature using the equation of Grossman and Ku (Reference Grossman and Ku1986) and assuming a δ18Oseawater value of −1‰). Black circles, scaphitids; gray circles, other ammonoids (baculitids and sphenodiscids); +, infaunal bivalves; ×, epifaunal gastropods and ostreid bivalves.
Stratigraphic changes in Discoscaphites iris morphometric traits below the K/Pg boundary (horizontal dashed line at 0 m) in localities along the Brazos River, Texas. Composite section including data from both AMNH localities 3620 and 3621, with the K/Pg boundary as a datum. See Witts et al. (Reference Witts, Landman, Garb, Irizarry, Larina, Thibault, Razmjooei, Yancey and Myers2021) for more details on the stratigraphy and paleontology of these sites. Filled black circles are macroconchs, open gray circles are microconchs. A, LMAX; B, LMAX/HP; C, LMAX/HS (macroconchs only).
Discussion
Ecophenotypy and Intraspecific Variation
The range of morphometric and CV values at each locality represent varying degrees of intraspecific variation, and together with the occasional significance of paleolatitude and longitude in our linear modeling analysis, suggest that local populations of Discoscaphites iris with slightly differing morphologies developed along the shallow margins of the ACP and GCP during the latest Maastrichtian. Despite low statistical support, other trends in our data may support limited local ecophenotypic (plastic) variation in distinct paleoenvironmental settings. For example, the relationship between grain size and maximum length (LMAX) of macroconchs in linear models (Table 5) suggests that size at maturity in this dimorph of D. iris varied predictably with this parameter, with smaller specimens more common in more sand-rich environments. There are many factors affecting size at maturity in modern cephalopods that were likely also important in ammonoids (see De Baets et al. Reference De Baets, Bert, Hoffmann, Monnet, Yacobucci, Klug, Klug, Korn, De Baets, Kruta and Mapes2015a). Grain size is generally considered a proxy for the energy level in the environment of deposition and a rough proxy for relative water depth or position relative to shore (Jacobs et al. Reference Jacobs, Landman and Chamberlain1994; Klein and Landman Reference Klein and Landman2019), which coincides with changes in turbidity, food/nutrient availability, light levels, and even predation and competition. Because LMAX could also signify the age at maturity, it is possible that individuals living in quieter, offshore environments represented by finer-grained sediments grew larger and reached maturity later than those in more nearshore, sandy settings. Flexibility in developmental timing has been hypothesized as a major driver of rapid evolution in ammonoids (Yacobucci Reference Yacobucci, Allmon and Yacobucci2016), although it is challenging to assess the evolutionary significance of ecophenotypic variations in mollusks (e.g., Grey et al. Reference Grey, Haggart and Smith2008). LMAX is the trait most likely to show statistically significant differences between localities in our study (Table 4). This is consistent with the findings of Hopkins and Lidgard (Reference Hopkins and Lidgard2012), who demonstrated that organismal body size and related traits are particularly labile, with this result consistent across multiple clades.
Previous studies of morphological change in both juvenile and adult scaphitids have noted a consistent pattern of increasing whorl compression in specimens and species from nearshore versus offshore environments—also using grain-size as a proxy (e.g., Jacobs et al. Reference Jacobs, Landman and Chamberlain1994; Klein and Landman Reference Klein and Landman2019; Landman et al. Reference Landman, Kennedy, Grier, Larson, Grier, Linn, Tackett and Jicha2020; Witts et al. Reference Witts, Landman, Hopkins and Myers2020). Hydrodynamics suggest that a streamlined morphology is more suited to higher-energy conditions in shallow, nearshore settings and that whorl compression is a particularly plastic trait in ammonoids. Statistically significant differences in compression of the body chamber (WS/HS) in D. iris macroconchs are present between several localities (Table 4), which are consistent with this hypothesis. The whorl compression trait that shows the largest intraspecific variability in both D. iris dimorphs is typically WP/HP (Fig. 6). CV values for whorl compression traits from stratigraphically expanded AMNH locality 3460 (Owl Creek type locality) are tightly constrained around 14% in both macro- and microconchs (Fig. 6C,D). This suggests lower levels of ecophenotypic variation in a stable environment, supported by the stratigraphically expanded nature and invariant sedimentology of this section, as well as paleotemperature data (Fig. 7). However, whorl compression values do not vary with grain size in our linear models, indicating this general relationship between water depth/shell compression is complex and potentially not fully captured using average grain-size data. This calls into question suggestions of a 1:1 relationship between environment and morphology/ecology, which is sometimes assumed in the literature for ammonoid taxa (Westermann Reference Westermann, Landman, Tanabe and Davis1996; Ritterbush and Bottjer Reference Ritterbush and Bottjer2012).
It has also been suggested that offshore environments may be more permissible to morphological variations in scaphitids, as populations in these areas did not face the same selective pressures for compressed shells as those in more inshore, higher-energy environments where such a shape is hydrodynamically favorable (Landman et al. Reference Landman, Kennedy, Grier, Larson, Grier, Linn, Tackett and Jicha2020; Peterman et al. Reference Peterman, Hebdon, Ciampaglio, Yacobucci, Landman and Linn2020). Water-depth estimates for ACP and GCP localities in this study suggest most sites ranged from 20 to 50 m (Landman et al. Reference Landman, Johnson and Edwards2004b, Reference Landman, Johnson, Garb, Edwards and Kyte2007; Sessa et al. Reference Sessa, Larina, Knoll, Garb, Cochran, Huber, MacLeod and Landman2015; Larina et al. Reference Larina, Garb, Landman, Dastas, Thibault, Edwards, Phillips, Rovelli, Myers and Naujokaityte2016; Witts et al. Reference Witts, Landman, Garb, Boas, Larina, Rovelli, Edwards, Sherrell and Cochran2018). It is possible that the higher CV values in size and shape traits for specimens of both dimorphs of D. iris from Brazos River are an example of this pattern; estimated water depths for these localities are greater than those for other GCP localities (Hart et al. Reference Hart, Yancey, Leighton, Miller, Liu, Smart and Twitchett2012; Witts et al. Reference Witts, Landman, Garb, Irizarry, Larina, Thibault, Razmjooei, Yancey and Myers2021). Unfortunately, whorl compression values from this site are not available for comparison.
Effect of Differential Sampling, Time Averaging, and Facies
It is important to consider the effects of time averaging on these data. Variations in sedimentation/accumulation rates can affect the range of morphological variability within a sample. Hunt (Reference Hunt2004) suggested that greatly inflated variance is expected in samples from condensed intervals that accumulated over several tens of thousands of years or that are “lumped” from multiple horizons. Although all our samples are temporally constrained to within the ~200–500 kyr D. iris Zone and can be taken as a single time slice, it is unlikely that all localities are precisely temporally equivalent. Discoscaphites iris specimens were collected from restricted stratigraphic intervals (Table 1) <2 m thick, and data are binned at this scale (Figs. 4, 5). The exact duration of these intervals is unknown, and sedimentation rates are clearly variable as reflected in lithological changes (Larina et al. Reference Larina, Garb, Landman, Dastas, Thibault, Edwards, Phillips, Rovelli, Myers and Naujokaityte2016). Landman et al. (Reference Landman, Johnson, Garb, Edwards and Kyte2007, Reference Landman, Garb, Rovelli, Ebel and Edwards2012b) and Witts et al. (Reference Witts, Landman, Garb, Boas, Larina, Rovelli, Edwards, Sherrell and Cochran2018) argued that the mode of occurrence of fossils in the “Pinna Layer” in New Jersey (AMNH locs. 3335 and 3372) and the “gray unit” at AMNH locality 3481 (which furnished most material in our study from these localities) indicate autochthonous accumulations that formed over short intervals of time and thus provide robust snapshots of in situ marine communities.
Despite temporal uncertainty, CV values for shape traits from the stratigraphically expanded and lithologically homogenous AMNH locality 3460 align closely with those of other, presumably more condensed, localities and would therefore suggest a similar degree of intraspecific variation despite time averaging (Fig. 4, Fig. 6A,B). Whorl compression traits may differ for other (ecophenotypic) reasons outlined in the previous section. At several localities (e.g., AMNH loc. 3460, AMNH loc. 3458) specimens were commonly found concentrated in fossiliferous pods that may represent hydrodynamic accumulations in seafloor burrow systems (Larina et al. Reference Larina, Garb, Landman, Dastas, Thibault, Edwards, Phillips, Rovelli, Myers and Naujokaityte2016). This, combined with lowered sedimentation rates, could explain the greater range of morphological variability present in samples from AMNH locality 3458.
It should also be noted that our study only contains data from siliciclastic successions across the ACP and GCP. While these sites generally capture the range of environments that D. iris occurs in across its geographic range (Fig. 1), the species also occurs in the more carbonate-rich facies of the Prairie Bluff Chalk in Mississippi and Alabama (Larina et al. Reference Larina, Garb, Landman, Dastas, Thibault, Edwards, Phillips, Rovelli, Myers and Naujokaityte2016; Naujokaitytė et al. Reference Naujokaitytė, Garb, Thibault, Brophy, Landman, Witts, Cochran, Larina, Phillips and Myers2021; Witts et al. Reference Witts, Landman, Garb, Irizarry, Larina, Thibault, Razmjooei, Yancey and Myers2021). Unfortunately, there are currently too few complete specimens from these localities to usefully compare with siliciclastic successions. This is partly a sampling artifact/bias linked to increased preservation potential for complete specimens in clastic successions, but it may also reflect a true environmental preference whereby D. iris is simply more common in siliciclastic environmental settings that tend to represent more nearshore environments. Studies of molluscan occurrence data from the ACP and GCP margins during a comparable latest Maastrichtian time slice (e.g., Sohl and Koch Reference Sohl and Koch1983, Reference Sohl and Koch1984, Reference Sohl and Koch1987) demonstrate lateral changes in the relative abundance of benthic taxa due to shifting paleoenvironments (Fig. 1) (for summaries, see Koch Reference Koch1996). Further work on the occurrence in different facies and preferred habitat of D. iris is needed to test this hypothesis.
“Dynamic Stasis” in Scaphitid Ammonoids: Clues from Modern Cephalopods, Paleoecology, and Phylogeny
Modern cephalopods are well known for exhibiting morphological plasticity (Boyle and Rodhouse Reference Boyle and Rodhouse2005). This is most often related to differing environmental conditions (ecophenotypy) and/or the development of complicated population structures depending on factors such as dispersal or migration ability regulating gene flow (e.g., Boyle and Boletzky Reference Boyle and Boletzky1996; Pérez-Losada et al. Reference Pérez-Losada, Nolte, Crandall and Shaw2007; Zaleski et al. Reference Zaleski, Perez and Gandara-Martins2012; Braga et al. Reference Braga, Crespi-Abril, Van der Molen, Bainy and Ortiz2017). These features also figure prominently in the debate surrounding plausible mechanisms for speciation and morphological stasis in the fossil record (e.g., Eldredge et al. Reference Eldredge, Thompson, Brakefield, Gavrilets, Jablonski, Jackson, Lenski, Lieberman, McPeek and Miller2005; Yacobucci Reference Yacobucci, Allmon and Yacobucci2016). Scaphitids have small embryonic shells suggesting high adult fecundity (Landman Reference Landman1987; De Baets et al. Reference De Baets, Landman, Tanabe, Klug, Korn, De Baets, Kruta and Mapes2015b), and values of oxygen isotopes in earliest ontogeny are consistent with a surface-water habitat immediately following hatching, presumably as part of the plankton (Linzmeier et al. Reference Linzmeier, Landman, Peters, Kozdon, Kitajima and Valley2018). During this phase, passive dispersal via ocean currents is plausible, which in the absence of geographic or oceanographic barriers could lead to development of genetic cohesion among well-connected populations. However, this is strongly dependent on the amount of time juvenile ammonoids spent in the plankton (Landman et al. Reference Landman, Tanabe, Shigeta, Landman, Tanabe and Davis1996; Villanueva et al. Reference Villanueva, Vidal, Fernández-Álvarez and Nabhitabhata2016; Wani Reference Wani2017). There are currently no reliable estimates for growth rates in ammonoids, but rapid growth (reaching maturity in <5 years) is likely (Bucher et al. Reference Bucher, Landman, Klofak, Guex, Landman, Tanabe and Davis1996), which might suggest limited dispersal potential in the plankton. Later-stage juvenile and adult scaphitids were nektobenthic and lived close to the seafloor based on overlap of shell oxygen isotopic data with benthic organisms (Fig. 7) (Sessa et al. Reference Sessa, Larina, Knoll, Garb, Cochran, Huber, MacLeod and Landman2015; Ferguson et al. Reference Ferguson, Macleod, Landman and Sessa2019); Linzmeier et al. (Reference Linzmeier, Landman, Peters, Kozdon, Kitajima and Valley2018) demonstrated the change from a planktonic to nektobenthic mode of life in scaphitids probably occurred relatively early in ontogeny, at approximately one whorl of postembryonic growth.
Analysis of the functional morphology of shells and well-preserved jaws (aptychi) suggest adult scaphitids exploited a low-energy planktivorous lifestyle (Landman et al. Reference Landman, Kennedy, Cobban and Larson2010, Reference Landman, Cobban and Larson2012a). Despite their uncoiled heteromorph shells, scaphitids were capable of active swimming (Peterman et al. Reference Peterman, Hebdon, Ciampaglio, Yacobucci, Landman and Linn2020), but evidence suggests adults did not undergo long-distance migration. For example, Cochran et al. (Reference Cochran, Landman, Turekian, Michard and Schrag2003) found differences in the strontium (Sr) isotopic composition of scaphitid shells from different but laterally equivalent shallow-marine paleoenvironments in the Maastrichtian Fox Hills Formation of the WIS. Yahada and Wani (Reference Yahada and Wani2013) examined morphology through ontogeny in samples of scaphitids from laterally equivalent but geographically separate localities in the Turonian of Japan. They found no statistically significant differences in the size of embryonic shells from the two localities but did observe significant differences in the thickness ratio (shell breadth/width) later in ontogeny. They argued that planktonic hatchlings were transported in surface currents between the two localities, but nektobenthic juveniles and adults did not migrate over long distances and formed distinct populations subject to local (ecophenotypic) selective pressures. Taken together, these studies suggest that scaphitids likely had significant potential for rapid morphological change in conjunction with limited dispersal capacity. This combination could fuel rapid evolutionary change (either punctuated, cladogenetic, or phyletic) in scaphitids responding morphologically to unique local environments and limited gene flow between isolated/semi-isolated populations; if paired with speciation, this is an interpretation that fits expectations of the broader ammonoid clade that demonstrates both high diversity and disparity (Yacobucci Reference Yacobucci2005; Wani Reference Wani2011).
Our results provide empirical support for morphological stasis in the fossil record of D. iris throughout its entire geographic and stratigraphic range, which would suggest a punctuated or cladogenetic mode of evolution in this clade. Preliminary reconstruction of phylogenetic relationships among North American examples of Discoscaphites (Landman et al. Reference Landman, Johnson, Garb, Edwards and Kyte2007) and comparison with stratigraphic ranges support this hypothesis (Fig. 2). These data suggest that the geologically older and younger species comprise two clades; D. iris belongs to the geologically younger “Clade B” (Fig. 2) and co-occurs with Discoscaphites minardi, Discoscaphites sphaeroidalis, and Discoscaphites jerseyensis in the GCP and ACP. The recently described species Discoscaphites mullinaxorum from the upper Maastrichtian of Texas probably also belongs to this clade (Witts et al. Reference Witts, Landman, Garb, Irizarry, Larina, Thibault, Razmjooei, Yancey and Myers2021). Discoscaphites minardi first appears in the GCP and ACP in the middle part of the late Maastrichtian but persists alongside D. iris to the K/Pg boundary in the ACP. “Clade A” contains Discoscaphites conradi, Discoscaphites rossi (which together form a separate clade), and Discoscaphites gulosus. These taxa occur in the ACP, GCP, and WIS in the early late Maastrichtian (Landman and Waage Reference Landman and Waage1993; Landman et al. Reference Landman, Johnson and Edwards2004a; Larina et al. Reference Larina, Garb, Landman, Dastas, Thibault, Edwards, Phillips, Rovelli, Myers and Naujokaityte2016), and D. gulosus ranges to the K/Pg boundary (Landman et al. Reference Landman, Johnson, Garb, Edwards and Kyte2007). Morphological stasis in D. iris, alongside the co-occurrence of ancestor and/or sister species, lends support for a punctuated or cladogenetic pattern and suggests that anagenesis might not be an important contributor to evolutionary trends in this clade.
It is important to note that potentially ecophenotypic or intraspecific changes outlined above, especially with regard to shifting CV values at each locality, reflect population-scale variability that is not at odds with stasis of the species overall (see discussion in Lieberman et al. Reference Lieberman, Brett and Eldredge1995; Lieberman Reference Lieberman, Allmon, Kelley and Ross2009). Despite some statistically significant differences between localities, most morphological traits remain invariant across the geographic extent of the D. iris Zone and do not exhibit any kind of directional trend in terms of size or shape. Some statistically significant differences in trait values do occur, but there is generally no consistent pattern that might support morphological adaption across time or geography at the species level. In addition, morphological traits show only weak relationships with environmental parameters included in the linear models. Although a limited test of the hypothesis of ecophenotypy, these data do not support strong ecophenotypic variation at the species level. Size, shape, and compression traits measured at the population level also appear to exhibit low levels of intraspecific variation. These results suggest that the fossil record of D. iris is consistent with shifting trait values within local populations due to either some limited plastic response to local paleoenvironment or random intrapopulational variation (see discussion De Baets et al. [2015a] for other examples from the ammonoid fossil record), which may simply be compounded by the time-averaging and sampling constraints mentioned earlier.
Despite these caveats, our results clearly support no within-species net accumulation of phyletic evolutionary change across traits or, where temporal data are available, the lifetime of this species. Notably, data from the Owl Creek type locality (AMNH loc. 3460), the most expanded succession in our dataset, reveal a range of trait values comparable to more restricted sections, with no consistent temporal trends (Fig. 7). Any given stratigraphic horizon at this locality captures a range of variation similar to that of the entire dataset. In addition, paleotemperature estimates based on oxygen isotope analysis of macrofossils (Sessa et al. Reference Sessa, Larina, Knoll, Garb, Cochran, Huber, MacLeod and Landman2015; Ferguson et al. Reference Ferguson, Macleod, Landman and Sessa2019) show a similar pattern. Both morphology of D. iris and the overall paleoenvironment at Owl Creek are consistent with fluctuating regimes around a relatively stable mean but no long-term directional trend. Whereas the precise duration of the Owl Creek stratigraphic section is unknown, the calcareous nannofossil Micula prinsii appears at the base of the succession alongside D. iris (Larina et al. Reference Larina, Garb, Landman, Dastas, Thibault, Edwards, Phillips, Rovelli, Myers and Naujokaityte2016); as noted earlier, this taxon is restricted to the latest Maastrichtian. In many successions with well-constrained age models, it first occurs within the ~350 kyr interval corresponding to magnetochron C29R (Fig. 2) (Thibault Reference Thibault2018; Gale et al. Reference Gale, Mutterlose, Batenburg, Gradstein, Agteberg, Ogg, Petrizzio, Gradstein, Ogg, Schmitz and Ogg2020).
Witts et al. (Reference Witts, Landman, Hopkins and Myers2020) demonstrated similar statistical support for evolutionary stasis across the temporal and geographic range of another closely related scaphitid ammonoid species, Hoploscaphites nicolletii, in the Maastrichtian WIS of North America. More specifically, this study suggested that the fossil record of H. nicolletii conforms to the expectations for “dynamic stasis” (e.g., Eldredge et al. Reference Eldredge, Thompson, Brakefield, Gavrilets, Jablonski, Jackson, Lenski, Lieberman, McPeek and Miller2005; Lieberman Reference Lieberman, Allmon, Kelley and Ross2009); although there were statistically significant morphological changes both temporally and spatially, these were reversible, with a wide range of variation and geographic differences among local populations at any given horizon, some of which could be related to specific environmental conditions (i.e., ecophenotypy) (see also Landman et al. Reference Landman, Klofak, Sarg and Harries2008). The exact mechanisms driving patterns of dynamic stasis are still unclear, with both differential selection across paleoenvironments acting in aggregate (Eldredge et al. Reference Eldredge, Thompson, Brakefield, Gavrilets, Jablonski, Jackson, Lenski, Lieberman, McPeek and Miller2005; Estes and Arnold Reference Estes and Arnold2007) or stabilizing selection with a fluctuating optimum associated with shifting environments (Hunt Reference Hunt2007; Hunt and Rabosky Reference Hunt and Rabosky2014) considered plausible by Witts et al. (Reference Witts, Landman, Hopkins and Myers2020); our results are in good accord with this interpretation. Thus, the study by Witts et al. (Reference Witts, Landman, Hopkins and Myers2020) also supports a model of punctuated/cladogenetic evolutionary change in scaphitid ammonoids.
Implications of Temporal Stasis for Pre-K/Pg Paleoenvironmental Change
Size and shape changes documented by other authors in planktonic foraminifera during the latest Maastrichtian, temporally equivalent to the D. iris Zone (Larina et al. Reference Larina, Garb, Landman, Dastas, Thibault, Edwards, Phillips, Rovelli, Myers and Naujokaityte2016; Naujokaitytė et al. Reference Naujokaitytė, Garb, Thibault, Brophy, Landman, Witts, Cochran, Larina, Phillips and Myers2021; Witts et al. Reference Witts, Landman, Garb, Irizarry, Larina, Thibault, Razmjooei, Yancey and Myers2021), have been related to environmental stresses associated with the emplacement of the Deccan Traps LIP, before the Chicxulub impact event and K/Pg mass extinction (Keller and Abramovich Reference Keller and Abramovich2009; Henehan et al. Reference Henehan, Hull, Penman, Rae and Schmidt2016; Gilabert et al. Reference Gilabert, Arenillas, Arz, Batenburg and Robinson2021). Morphological changes have been detected in ammonoids before other mass extinction events linked to episodes of environmental change driven by LIP volcanism: for example, Kiessling et al. (Reference Kiessling, Schobben, Ghaderi, Hairapetian, Leda and Korn2018) documented a reduction in size and morphological complexity in ammonoid assemblages from deep-water limestones correlated to the last 700 kyr of the Permian in Iran, coincident with the onset of Siberian Trap LIP volcanism and disruption to the global carbon cycle, but preceding the main phase of the end-Permian mass extinction. However, morphological variation in response to environmental stressors more broadly is a well-studied feature of the ammonoid fossil record. For example, spectacular morphological changes and evolutionary “jumps” within lineages occur during recoveries from carbon cycle perturbations and extinctions (e.g., Monnet et al. Reference Monnet, Bucher, Brayard and Jenks2013), and morphological changes are commonly seen coincident with sea-level fluctuations and faunal invasions in epeiric seaway basins, particularly within endemic lineages (Yacobucci Reference Yacobucci2003; Klug et al. Reference Klug, Schatz, Korn and Reisdorf2005; Witts et al. Reference Witts, Landman, Hopkins and Myers2020).
Although it is difficult to assign a precise age to many samples of D. iris below the K/Pg boundary, the stratigraphic data from the Owl Creek type locality outlined earlier suggest no significant directional size or shape changes in this species of ammonoid during the latest Maastrichtian before the K/Pg boundary and Chicxulub impact event. Limited stratigraphic data from the Brazos River localities (AMNH locs. 3620 and 3621) are also consistent with temporal patterns from Owl Creek in showing no directional trend through time (Fig. 8). Here, D. iris co-occurs in the uppermost Corsicana Formation below the K/Pg boundary with the index planktonic foraminifera Plummerita hantkeninoides, representing as little as 140 kyr of the latest Maastrichtian (Husson et al. Reference Husson, Galbrun, Gardin and Thibault2014; Gale et al. Reference Gale, Mutterlose, Batenburg, Gradstein, Agteberg, Ogg, Petrizzio, Gradstein, Ogg, Schmitz and Ogg2020). In the Manasquan River basin, New Jersey (AMNH locs. 3335 and 3372), D. iris and eight other species of ammonite occur in the 20-cm-thick unit known as the “Pinna Layer” at the top of the Tinton Formation, associated with a prominent iridium anomaly (Landman et al. Reference Landman, Johnson, Garb, Edwards and Kyte2007). As mentioned earlier, fossils in the “Pinna Layer” likely represent a terminal Cretaceous community immediately before the time of the Chicxulub impact (see discussion in Landman et al. Reference Landman, Johnson, Garb, Edwards and Kyte2007, Reference Landman, Garb, Rovelli, Ebel and Edwards2012b; Miller et al. Reference Miller, Sherrell, Browning, Field, Gallagher, Olsson, Sugarman, Tuorto and Wahyudi2010). Morphology of D. iris from these localities falls within the range of variation seen at other, potentially older, sites (Figs. Fig. 4, 5), again suggesting no differences in size or shape through the duration of the D. iris Zone besides the limited population-scale ecophenotypic variations outlined earlier. These results are inconsistent with the LIP-induced ecophenotypic changes proposed for other groups and suggest that any environmental changes related to Deccan volcanism had a limited effect on the morphology of North American ammonoid faunas before the Chicxulub impact and K/Pg mass extinction event.
Conclusions
Research on modern and ancient cephalopods supports the potential for rapid, ecophenotypic morphological change. Moreover, inferred poor larval and adult dispersal ability of scaphitids (Landman et al. Reference Landman, Cobban and Larson2012a; Yahada and Wani Reference Yahada and Wani2013; Linzmeier et al. Reference Linzmeier, Landman, Peters, Kozdon, Kitajima and Valley2018) increases the likelihood of isolation between populations, which, if combined with morphological change, could promote speciation resulting in high levels of diversity and disparity within the clade. The current paradigm of speciation by some combination of sympatry and micro-allopatry (Wani Reference Wani2011; Yacobucci Reference Yacobucci, Allmon and Yacobucci2016), is consistent with this model and the overall pattern of high diversity and disparity in ammonoids more generally. What has remained less clear is how this combination of traits interacts with evolutionary mode to produce the observed patterns (i.e., evolutionary change primarily through phyletic adaptation vs. more punctuated cladogenesis). The results of this analysis indicate that the latest Cretaceous scaphitid Discoscaphites iris (like its relative Hoploscaphites nicolletii; Witts et al. Reference Witts, Landman, Hopkins and Myers2020) demonstrates morphological stasis across its lifetime at the species level and even limited intraspecific variability at the population level. Moreover, no directional changes in species morphology are observed that could be related to contemporaneous Earth system changes during the latest Cretaceous (e.g., environmental stress driven by emplacement of the Deccan Traps LIP) before the K/Pg boundary and Chicxulub bolide impact. It is possible that evolutionary mode in the Scaphitidae follows the punctuated model of cladogenesis, wherein a dynamic morphological stasis is periodically interrupted by more substantial evolutionary change at speciation events. Preliminary phylogenetic analysis of Discoscaphites supports this claim. Additional studies that focus specifically on abundance and morphological change across the entire geographic and temporal duration of fossil species (especially those that hypothetically represent ancestors and descendants) could further demonstrate empirically whether the cladogenetic evolutionary mode is indeed pervasive in the highly speciose ammonoid clade or a phenomenon unique to scaphitids. Such work is certainly possible given the nature of the ammonoid fossil record and promises to shed further light on the broader mechanisms of speciation within this diverse clade.
Acknowledgments
We are grateful to many colleagues for assistance with fieldwork, useful discussions, and help with measuring specimens. Special thanks to: S. Brophy, C. Campbell, M. Hopkins, R. Johnson, J. Naujokaityte, G. Phillips, R. Rovelli, A. Rowe, D. Ryan, and the late S. Klofak. We acknowledge and thank numerous property owners for providing access to field sites: A. Carrol and B. Carrol, S. Coffey (Owl Creek Type Locality, MS), W. C. Smallwood (“4th St” MS), B. Stinchcomb (Crowley's Ridge, MO), and J. Mullinax and R. Mullinax (Brazos, TX). Thanks to S. Thurston, M. Slovacek, B. Husseini, and M. Conway (AMNH) for assistance with figures, specimen preparation, and facilitating access to AMNH collections. We are grateful to the staff at the Black Hills Institute of Geological Research (Hill City, SD, USA) for access to specimens in their care. Finally, we thank the associate editor (J. Crampton) and two reviewers (W. Allmon and K. De Baets) for their thoughtful comments, which greatly improved the paper. This research was funded by a Lerner-Gray Postdoctoral Research Fellowship at the AMNH and Richard Gilder Graduate School and a Postdoctoral Fellowship at UNM, both awarded to J.D.W. C.E.M. and N.H.L. acknowledge support from U.S. National Science Foundation grant no. 1924807. Additional funding was provided by the N.D. Newell Fund (AMNH).
Data Availability Statement
Data available from the Dryad Digital Repository: https://doi.org/10.5061/dryad.jsxksn0br.


 Open access