



During puberty and maturation, young people undergo a number of hormonal changes, such as augmented testosterone and free testosterone in pubertal boys and elevated estradiol concentrations in pubertal girls( Reference Roemmich and Ragol 1 ). The hormonal changes that occur during puberty have significant effects upon metabolism, and subsequently health, in both sexes( Reference Roemmich and Ragol 1 , Reference Moran, Jacobs and Steinberger 2 ). There is a significant body of evidence to suggest that as a result of these changes, during adolescence there is a transient period of insulin resistance, which begins at the onset of puberty( Reference Moran, Jacobs and Steinberger 2 – Reference Jeffery, Metcalf and Hosking 7 ). Insulin resistance and reduced glucose tolerance are typically implicated in the aetiology of type 2 diabetes, which is becoming more common in adolescents( Reference Ehtisham, Barrett and Shaw 8 ). Furthermore, type 2 diabetes in young people is associated with an increased risk of a number of co-morbidities such as CVD( Reference Kavey, Daniels and Lauer 9 ). Due to the potential concern for metabolic health across the lifespan, it is important to understand the effect that hormonal changes and the transient period of insulin resistance has upon postprandial metabolism in adolescents.
It has been suggested that adolescents exhibit a higher degree of insulin resistance compared with pre-pubertal children and adults( Reference Caprio, Plewe and Diamond 3 ). Furthermore, in a cross-sectional comparison of 10–14-year-old boys and girls, it was found that insulin resistance increases at the onset of puberty, reaches a peak at Tanner stage 3 and then returns to baseline levels post puberty( Reference Moran, Jacobs and Steinberger 2 ). The findings of longitudinal studies, tracking young people as they go through puberty, also supports the notion of a period of transient insulin resistance during adolescence( Reference Hoffman, Vicini and Sivitz 4 – Reference Jeffery, Metcalf and Hosking 7 ). For example, Goran & Gower( Reference Goran and Gower 5 ) documented a 32 % higher insulin resistance at Tanner stage 3 compared with Tanner stage 1 and Hannon et al.( Reference Hannon, Janosky and Arslanian 6 ) reported a 50 % reduction in insulin sensitivity during puberty.
However, a limitation of the research in the area to date is the choice of technique used to assess pubertal insulin resistance. A number of techniques have been employed, including euglycaemic/hyperglycaemic clamp techniques( Reference Moran, Jacobs and Steinberger 2 , Reference Caprio, Plewe and Diamond 3 , Reference Hannon, Janosky and Arslanian 6 ), intravenous glucose tolerance tests( Reference Hoffman, Vicini and Sivitz 4 , Reference Goran and Gower 5 ) and the homoeostatic model assessment (HOMA)( Reference Jeffery, Metcalf and Hosking 7 , Reference Metcalf, Hosking and Henley 10 ). A limitation of each of these techniques is that they lack ecological validity and to date, the glycaemic and insulinaemic responses of boys and girls to everyday mixed meals (those containing a variety of macronutrients) is yet to be reported, but is of clear importance to health in young people.
Typically, studies are in agreement that the degree of insulin resistance experienced during puberty is greater in girls compared with boys( Reference Moran, Jacobs and Steinberger 2 , Reference Hoffman, Vicini and Sivitz 4 , Reference Metcalf, Hosking and Henley 10 ). For example, glucose uptake in response to a euglycaemic clamp was found to be 20 % lower in girls than boys aged 10–14 years, indicative of greater insulin resistance, an effect which was evident across Tanner stages( Reference Moran, Jacobs and Steinberger 2 ). The data of Metcalf et al.( Reference Metcalf, Hosking and Henley 10 ) also demonstrate that insulin resistance is approximately 30 % greater in girls compared with boys, an effect which is evident in both physically active and inactive adolescents. The greater insulin resistance reported in female adolescents is also consistent with findings in adults diagnosed with type 2 diabetes, with more women failing to achieve the glycosylated Hb target of 7 % (a marker of long-term glycaemic control), in comparison with their male counterparts( Reference Penno, Solini and Bonora 11 ).
Recent evidence continues to suggest that young people typically eat a carbohydrate-rich diet and that the carbohydrates consumed are typically moderate-high glycaemic index (GI)( Reference Jones, Barclay and Brand-Miller 12 ). Furthermore, high GI diets are implicated in the aetiology of conditions such as CVD and type 2 diabetes (as well as key risk factors for these conditions), due to the elevated glycaemic and insulinaemic responses seen( Reference Livesey, Taylor and Hulshof 13 ). Given the period of transient insulin resistance during puberty, it is therefore imperative to understand how this affects the glycaemic and insulinaemic responses, of young people, to meals which differ in GI. However, this is yet to be reported in the literature, along with whether the sex differences exist in response to meals differing in GI.
A number of mechanisms have been proposed as causing the transient insulin resistance experienced during puberty. Evidence suggests that during puberty there is less glucose uptake per unit of insulin( Reference Amiel, Sherwin and Simonson 14 ), resulting in lower glucose oxidation and an increase in fatty acid oxidation( Reference Arslanian and Kalhan 15 ). This drop in insulin resistance seems to be compensated for by an increase in insulin secretion( Reference Caprio, Plewe and Diamond 3 , Reference Hannon, Janosky and Arslanian 6 ). A number of studies relate the increase in insulin resistance to an increase in adiposity( Reference Jeffery, Metcalf and Hosking 7 ), which may also help to explain the greater insulin resistance in girls compared with boys, given that girls typically display a higher adiposity during this time( Reference Araujo, Barros and Severo 16 ). However, in the study of Moran et al.( Reference Moran, Jacobs and Steinberger 2 ) girls exhibited a greater insulin resistance than boys even when triceps and subscapular thickness were controlled for, thus suggesting that adiposity does not completely explain the greater insulin resistance in girls. This finding is echoed in a subsequent study using dual energy X-ray absorptiometry to assess body composition, also concluding that adiposity does not explain the transient insulin resistance during puberty( Reference Hannon, Janosky and Arslanian 6 ). Another mechanism believed to affect the transient insulin resistance during puberty is an elevated concentration of growth hormone and insulin-like growth factor 1, with these hormones reported to have a negative effect on insulin sensitivity( Reference Jeffery, Metcalf and Hosking 7 , Reference Amiel, Sherwin and Simonson 14 , Reference Moran, Jacobs and Steinberger 17 ).
Overall, whilst there seems consensus in the literature regarding the presence of a period of insulin resistance during puberty, a limitation of the literature to date is that the methods used to assess insulin resistance lack ecological validity and the responses to everyday meals remain unknown. Furthermore, whether sex differences exist in response to high and low GI meals in adolescents has not been explored. Therefore, the aim of the present study is to examine the sex differences in the glycaemic and insulinaemic responses to standard high and low GI meals in adolescents.
Methods
Study design
This study was conducted according to the guidelines laid down in the Declaration of Helsinki and all procedures involving human subjects/patients were approved by the institution’s ethical advisory committee (approval no. R09-P118). Participants were recruited from two local schools and school-level consent was obtained from head teachers. In addition, written parental informed consent, participant assent and health screen questionnaire forms were completed for each participant. The trial was registered with the International Standard Randomised Controlled Trials Registry (identification no. ISRCTN17903058, available at: www.isrctn.com/ISRCTN17903058).
The study employed an order-balanced, randomised, cross-over design with all participants completing a familiarisation, which preceded the first of three experimental trials by 7 d. All trials took place at the school the children attended and the experimental trials consisted of a high GI, low GI and breakfast omission trial, each separated by 7 d. Therefore, participants acted as their own controls. The findings regarding the effects of breakfast GI on cognitive function have been reported elsewhere( Reference Cooper, Bandelow and Nute 18 ). The present paper examines the glycaemic and insulinaemic response to the high GI and low GI breakfasts and the difference in responses between sexes, data which were not previously reported.
Following an overnight fast participants arrived at school at the normal time and rested in a seated position for 10 min, following which a fasted capillary blood sample was taken. Participants were then given 15 min to consume the breakfast, following which further capillary blood samples were taken at 15, 30, 60 and 120 min from the start of breakfast. A 120 min postprandial monitoring period was chosen based upon previous work suggesting this is a sufficient period of time to examine the different glycaemic response between meals( Reference Cooper, Bandelow and Nute 18 ).
Participants
In total, fifty-two participants aged 12–14 years old were recruited to participate in the study. Eligibility criteria were to be aged 12–14 years old and any participants with health issues or food allergies and intolerances that could affect their participation were excluded from the study. In all, twelve participants did not complete the study (ten were absent from school for one of the experimental trials and two did not follow the dietary requirements). Therefore, forty participants completed the study and were included in the data analysis.
During the familiarisation session, participant anthropometrics were measured. Height was measured using a Leicester Height Measure (Seca), accurate to 0·1 cm and body mass was measured using a Seca 770 digital scale (Seca), accurate to 0·1 kg, to allow the calculation of BMI. Sitting height was also measured to allow calculation of leg length and subsequently maturity offset, using the method of Moore et al.( Reference Moore, McKay and MacDonald 19 ). Waist circumference was also measured, to the nearest 0·1 cm, at the narrowest part of the torso between the xiphoid process of the sternum and the iliac crest. Physiological data for the participants, along with a comparison between males and females, are displayed in Table 1.
Anthropometric characteristics of participants, including a comparison between boys and girls (Mean values and standard deviations)

SDS, standard deviation score; PHV, peak height velocity.
* Calculated using the method described by Moore et al.( Reference Moore, McKay and MacDonald 19 ).
† Conducted using independent samples t test.
Pre-trial control
The evening before each experimental trial, participants were asked to consume the same meal and follow an overnight fast from 22.00 hours. Water was allowed ad libitum at all times. Participants were also asked to avoid any unusually vigorous physical activity for the 24 h preceding each experimental trial. The evening before each experimental trial the research team made a telephone call to participants to remind them of this information and verbal confirmation of compliance was sought upon arrival at school.
Breakfast
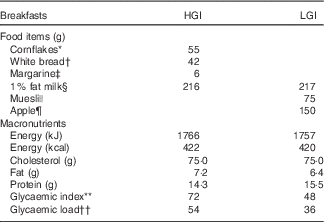
The high and low GI breakfasts each contained 1·5 g/kg body mass carbohydrate and were matched for energy and macronutrient content. The GI of the meals was calculated using previously described methods( Reference Wolever and Jenkins 20 , 21 ) and GI values for each food were taken from internationally available tables( Reference Foster-Powell, Holt and Brand-Miller 22 ). Participants were given 15 min to consume the breakfasts. Furthermore, 150 ml water was provided with the high GI breakfast to ensure matched water intake between trials and 150 ml water was provided at 60 min on both trials to maintain euhydration. Table 2 displays the breakfast composition for a 50 kg participant.
Composition of high glycaemic index (HGI) and low glycaemic index (LGI) breakfasts for a 50 kg participant
* Cornflakes (Kelloggs Ltd).
† Lightly toasted white bread (Kingsmill soft white thick slice).
‡ Margarine (Flora Original).
§ 1 % fat milk (Sainsbury’s Ltd).
|| Muesli (Alpen no added sugar; Weetabix Ltd).
¶ Apple (Braeburn apple).
** Calculated by the method previously described( Reference Wolever and Jenkins 20 , 21 ) with glycaemic index values taken from international tables( Reference Foster-Powell, Holt and Brand-Miller 22 ).
†† Calculated by the method previously described( Reference Foster-Powell, Holt and Brand-Miller 22 ).
Capillary blood samples
Capillary blood samples were preferred to venous samples in the present study because they are more sensitive to glycaemic responses and are more acceptable within the ethical constraints of working with young people( Reference Brouns, Bjorck and Frayn 23 – Reference Wolever 26 ). A fasted capillary blood sample was taken at baseline, followed by subsequent samples 15, 30, 60 and 120 min following the start of breakfast.
Participants’ hands were warmed via submersion in warm water to increase capillary blood flow. A Unistik single use lancet (Unistik Extra, 21G gauge, 2·0 mm depth; Owen Mumford Ltd) was used and the blood collected into two 300 µl EDTA coated microvettes (Sarstedt Ltd). Two 25 µl whole blood samples were removed using plain pre-calibrated glass pipettes (Hawksley Ltd), immediately deproteinised in 250 µl of 2·5 % ice cooled perchloric acid in 1·5 ml plastic vials and centrifuged at 7000 rpm for 4 min (Eppendorph 5415C). The remaining whole blood was also centrifuged at 7000 rpm for 4 min (Eppendorph 5415C) and the plasma removed and placed into 500 µl plastic vials. All samples were frozen at −20°C until analysis.
All bloods samples were analysed in duplicate for blood glucose and plasma insulin concentration. Blood glucose concentrations were determined using a commercially available kit (GOD-PAP method, GL 2610; Randox) and were analysed spectrophotometrically (Cecil CE393 digital grating spectrophotometer; Cecil Instruments Ltd), with an inter-assay CV of 2·3 % and an intra-assay CV of 1·2 %. Plasma insulin concentrations were determined using an ELISA (Mercodia Ltd), with an inter-assay CV of 3·2 % and an intra-assay CV of 1·9 %. Incremental AUC (IAUC) for blood glucose and plasma insulin was calculated using previously described methods( Reference Wolever and Jenkins 20 ). Insulin resistance was assessed using the HOMA method( Reference Matthews, Hosker and Rudenski 27 ). The HOMA calculation requires fasting blood glucose and plasma insulin concentrations and the data presented here are the mean HOMA values upon arrival for the high and low GI trials each child.
Statistical analysis
A power calculation was performed to determine the appropriate sample size, based on the previously reported effects in young people( Reference Moran, Jacobs and Steinberger 17 ). Based on an estimated effect size of 0·8 (and two-tailed significance), the power analysis yielded a required total sample size of forty (twenty girls and twenty boys).
All data analyses were performed in SPSS (version 23; SPSS Inc.). The primary outcome variables of interest were blood glucose and plasma insulin concentrations, whilst the secondary outcome variable was HOMA. Blood glucose and plasma insulin concentration data were analysed using a three-way (breakfast×time×sex) mixed methods ANOVA, with repeated measures for breakfast and time. IAUC data were analysed using a two-way (breakfast×sex) mixed methods ANOVA. All pairwise comparisons between boys and girls were performed using independent samples t tests and correlations were performed using Pearson’s correlation. Effect sizes are reported as Hedges’ g. Statistical significance was accepted as P<0·05 and all data are presented as mean values and standard deviations, unless stated otherwise.
Results
Blood glucose
Blood glucose concentration
Fasted blood glucose concentration was not different between the high and low GI trials (P=0·415). Blood glucose concentration was greater on the high GI trial when compared with the low GI trial (main effect of trial, F 1,37=47·9, P<0·0005) and increased following both breakfasts (main effect of time, F 1,37=47·9, P<0·0005) but there was no overall difference in blood glucose concentration between the sexes (main effect of sex, P=0·353). There was a significant breakfast×time interaction (F 4,148=6·759, P<0·0005) whereby blood glucose concentration reached a higher peak and remained higher following the high GI breakfast. However, no interactions were seen between breakfast and sex (P=0·084) or time and sex (P=0·520). There was a significant three-way breakfast×time×sex interaction (F 4,148=3·0, P=0·019) whereby boys exhibited a greater difference in response between the high and low GI trials when compared with girls (Fig. 1). There was no difference in the peak blood glucose concentration (at 30 min) between the boys and girls following the high GI (P=0·131) or low GI breakfasts (P=0·682) breakfasts.
Blood glucose concentration following the high glycaemic index (HGI) and low glycaemic index (LGI) breakfasts in boys (B) and girls (G). Values are means with their standard errors. Breakfast×time×sex interaction, P=0·019.  , HGI-B;
  , LGI-B;
  , HGI-G;
  , LGI-G.

Incremental AUC
Blood glucose IAUC was greater following the high GI breakfast when compared with the low GI breakfast (high GI: 121 mmol/l×120 min, low GI: 80·3 mmol/l×120 min, main effect of trial, F 1,37=40·2, P<0·0005). Blood glucose IAUC was not different between sexes (main effect of sex, P=0·361) nor was there a sex difference in blood glucose IAUC between the high and low GI trials (breakfast×sex interaction, P=0·108). Furthermore, blood glucose IAUC was not different between the sexes following the high GI (P=0·187) or low GI (P=0·895) breakfasts.
Plasma insulin
Plasma insulin concentration
Fasted plasma insulin concentration was not different between the high and low GI trials (P=0·190). Overall, there was no difference in plasma insulin concentration between the high GI and low GI trials (main effect of breakfast, P=0·094), but plasma insulin concentration was elevated following both breakfasts (main effect of time, F 4,152=67·8, P<0·0005). In addition, overall plasma insulin concentrations were higher in girls compared with boys (main effect of sex, F 1,38=5·5, P=0·025). The pattern in change of plasma insulin concentration was not different between the high and low GI trials (breakfast×time interaction, P=0·739), nor was there a breakfast×sex interaction (P=0·755). Plasma insulin concentrations exhibited a significant time×sex interaction (F 4,38=4·2, P=0·003), whereby girls exhibited a greater plasma insulin concentration than boys at all time points following breakfast (Fig. 2). However, this effect was not different between the high and low GI trials (breakfast×time×sex interaction, P=0·686). Plasma insulin concentration reached a higher peak (at 30 min) in girls compared with boys following both the high GI (girls: 839 (sd 488) pmol/l, boys: 551 (sd 353) pmol/l; t 1,38=2·1, P=0·043, g=0·69) and low GI (girls: 831 (sd 438) pmol/l, boys: 501 (sd 309) pmol/l; t 1,38=2·7, P=0·010, g=0·84) breakfasts.
Plasma insulin concentration following the high glycaemic index (HGI) and low glycaemic index (LGI) breakfasts in boys (B) and girls (G). Values are means with their standard errors. Time×sex interaction, P=0·003; a HGI-G>HGI-B, P=0·043; b LGI-G>LGI-B, P=0·010. , HGI-B; , LGI-B; , HGI-G; , LGI-G.

Incremental AUC
Plasma insulin IAUC was greater following the high GI breakfast when compared with the low GI breakfast (high GI: 36·2 nmol/l×120 min, low GI: 31·0 nmol/l×120 min, main effect of breakfast, F 1,38=6·593, P=0·014) and was also greater in girls compared with boys (girls: 41·1 nmol/l×120 min, boys: 26·1 nmol/l×120 min, main effect of sex, F 1,38=4·8, P=0·034). However, there was no sex difference in plasma insulin IAUC between the high and low GI trials (breakfast×sex interaction, P=0·491). Girls exhibited a higher plasma insulin IAUC following both the high GI (girls: 44·5 (sd 27·4) nmol/l×120 min, boys: 28·0 (sd 20·4) nmol/l×120 min, t 1,38=2·1, P=0·041, g=0·66; Fig. 3) and low GI (girls: 37·8 (sd 19·8) nmol/l×120 min, boys: 24·2 (sd 20·7) nmol/l×120 min, t 1,38=2·1, P=0·041, g=0·66; Fig. 3) breakfasts, when compared with boys.
Plasma insulin incremental AUC (IAUC) following the high (HGI) and low glycaemic index (LGI) breakfasts in boys ( ) and girls (
 ). Values are means with their standard errors. a HGI-girls>HGI-boys, P=0·041; b LGI-girls>LGI-boys, P=0·041.

Homoeostatic model assessment
There was a tendency for HOMA to be higher in females (1·63 (sd 0·86) AU) than boys (1·22 (sd 0·49) AU), but this did not reach statistical significance (P=0·082). Interestingly, there were strong positive correlations observed between HOMA and plasma insulin IAUC following both the high GI (r 0·873, P<0·0005) and low GI (r 0·674, P<0·0005) breakfasts and between HOMA and peak plasma insulin concentration following both the high GI (r 0·886, P<0·0005) and low GI breakfasts (r 0·605, P<0·0005). No significant correlations were observed between HOMA and blood glucose IAUC (high GI: r 0·076, P=0·644; low GI: r 0·185, P=0·259) or peak blood glucose concentration (high GI: r 0·013, P=0·938; low GI: r 0·018, P=0·912) following either the high or low GI breakfasts. There was also a weak but statistically significant positive correlation observed between HOMA and maturity offset (r 0·332, P=0·037), with more mature individuals exhibiting a greater HOMA.
Discussion
The main finding of the present study is that during puberty, there are marked sex differences in the insulinaemic response to standard high and low GI meals, when comparing boys and girls of similar chronological ages. Girls exhibit a greater insulinaemic response than boys, with a 30–40 % higher peak plasma insulin concentration and IAUC following both the high and low GI breakfasts when compared with the boys. However, the glycaemic response was similar between the sexes. The findings of the present study also suggest that maturation affects the degree of insulin resistance experienced, partly accounting for the sex differences observed in the insulinaemic response to the meals in the present study given that the girls were more mature than boys despite their similar chronological ages. The findings of the present study are novel because they demonstrate the glycaemic and insulinaemic responses to everyday meals and also demonstrate that girls exhibit a greater insulinaemic response following both the high and low GI breakfasts when compared with boys. Therefore, the ecologically valid findings of the present study have important implications in young people.
The findings of the present study suggest that the girls demonstrate a greater insulinaemic response than boys to both the high and low GI breakfasts. Specifically, peak plasma insulin concentration following the high and low GI breakfasts is greater in girls compared with boys (high GI: 34 %; low GI: 40 %), and also that the plasma insulin IAUC is greater in girls following both the high and low GI breakfasts, when compared with boys (high GI: 37 %; low GI: 36 %). The present study administered matched glucose loads in the form of the high and low GI breakfasts and despite similar glycaemic responses between boys and girls (peak blood glucose concentration and IAUC), the girls demonstrated the greater insulinaemic responses, indicative of a greater degree of insulin resistance. The degree of sex difference in insulin resistance demonstrated in the present study is slightly greater than the 20–30 % reported in the literature to date( Reference Moran, Jacobs and Steinberger 2 , Reference Hoffman, Vicini and Sivitz 4 , Reference Metcalf, Hosking and Henley 10 ). However, the findings of the present study are novel because they demonstrate that the sex differences exist in response to everyday mixed meals (in addition to the clamp techniques used in previous studies).
The findings of the present study also suggest that girls exhibit a greater insulinaemic response, compared with boys, when both high and low GI breakfasts are consumed, which has not previously been examined. It is interesting to note that young people in Western societies typically consume a carbohydrate-rich diet and more specifically, a diet with a high GI( Reference Jones, Barclay and Brand-Miller 12 ). This is of concern because evidence also links a high GI diet with non-communicable diseases such as CVD and type 2 diabetes (as well as key risk factors for these conditions), due to the elevated glycaemic and insulinaemic responses seen( Reference Kavey, Daniels and Lauer 9 , Reference Livesey, Taylor and Hulshof 13 ). The findings of the present study demonstrate a lower glycaemic and insulinaemic response to the low GI compared with high GI breakfast in both boys and girls, therefore suggesting that young people should aim to consume carbohydrates with a lower GI, especially during this period of pubertal insulin resistance.
When comparing boys and girls of similar chronological ages, the findings of the present study suggest that girls exhibit a much greater insulinaemic response to high and low GI breakfasts than boys at age 11–14 years, whilst the responses in adults are similar between sexes( Reference Stevenson, Williams and Nute 28 , Reference Stevenson, Williams and Mash 29 ). It is important to compare boys and girls of the same chronological age because this is how they are grouped in everyday life, such as at school. However, when examining the period of transient pubertal insulin resistance it is also important to consider the effect of maturity upon this, with several studies to date demonstrating that the transient pubertal insulin resistance peaks around tanner stage 3( Reference Moran, Jacobs and Steinberger 2 , Reference Goran and Gower 5 ). However, not all studies agree with this and other authors suggest that the degree of pubertal insulin resistance does not differ across Tanner stages( Reference Hoffman, Vicini and Sivitz 4 ).
In the present study the estimation of years from peak height velocity was made using the leg length calculations of Moore et al.( Reference Moore, McKay and MacDonald 19 ). This method was chosen as a non-invasive and valid measure which is replicable on a large scale. Other possible techniques to assess maturity have several limitations associated with them, such as: skeletal wrist X-rays which carry ethical concerns and are not replicable on a large scale; age of menarche which cannot be used for between sex comparisons; Tanner stages which are a more invasive measure and evidence suggests they should not be used for between sex comparisons( Reference Sherar, Baxter-Jones and Mirwald 30 ); and the Khamis–Roche equation which requires biological parent height which may not always be possible and may cause a sensitive issue where young people do not live with their biological parents.
The data using the Moore et al. method( Reference Moore, McKay and MacDonald 19 ) unsurprisingly demonstrated that the girls (0·9 years post peak height velocity) were more mature than boys (1·1 years pre peak height velocity) given their similar chronological ages. Interestingly, there was also a weak but statistically significant correlation between the calculated maturity offset and HOMA. Therefore, the findings of the present study add weight to the argument that the degree of pubertal insulin resistance increases in the more mature individuals, but given the cross-sectional nature of this study we cannot comment specifically on the time-course of these effects. Unfortunately, the present study did not yield sufficiently sensitive data to allow comparisons between boys and girls matched for maturation (because the young people were recruited to the study based on their school year and thus there was insufficient overlap in maturity between the boys and girls). However, this is something that could be examined in future research to further explore the mediating effect of maturation on sex differences in insulin resistance. It may also be of interest to examine the effects of the menstrual cycle on the glycaemic and insulinaemic responses in girls following menarche, given the potential for the menstrual cycle to affect substrate utilisation( Reference Ruby and Robergs 31 ).
There are several suggestions in the literature to date that the pubertal insulin resistance is compensated for by an increase in insulin secretion( Reference Caprio, Plewe and Diamond 3 , Reference Hannon, Janosky and Arslanian 6 ). The findings of the present study suggest that this is also the case in response to both high and low GI meals whereby, although girls exhibit a much greater insulinaemic response, the glycaemic responses are similar between boys and girls. It is also important to note that the breakfasts provided in the present study contained 1·5 g/kg body mass of carbohydrate and given there were no differences in body mass between the boys and girls, a similar carbohydrate load was provided to both. However, during pubertal development boys typically exhibit an increase in metabolically active tissue whilst adiposity increases in girls, although there were no differences in waist circumference (a marker of central adiposity) between the boys and girls in the present study. Furthermore, several studies to date have concluded that adiposity does not explain the transient insulin resistance during adolescence( Reference Moran, Jacobs and Steinberger 2 , Reference Hannon, Janosky and Arslanian 6 ). In future research meals which contain a set amount of carbohydrate per unit of lean body mass could be provided to continue to examine the effect of adiposity on pubertal insulin resistance and further improve the experimental control.
Conclusions
Overall, the findings of the present study suggest that there are marked sex differences in the insulinaemic response to high and low GI meals in adolescents, whereby despite similar glycaemic responses girls exhibit a 30–40 % greater insulinaemic response. These findings are important because the present study is the first to document the responses to everyday mixed meals and also demonstrate that the sex differences are evident following both high and low GI breakfasts. Thus, the present study provides further evidence for the current recommendation that adolescents should consume a low GI carbohydrates to optimise their cardio-metabolic health.
Acknowledgements
S. B. C., J. G. M. and M. E. N. designed the research; S. B. C., M. L. N. and J. G. M. conducted the research; S. B. C., B. E. W. C. and K. J. D. analysed the data and S. B. C., K. J. D., B. E. W. C. and M. E. N. had primary responsibility for writing the paper. All authors read and approved the final manuscript.
The authors declare that there are no conflicts of interest.



