


Non-technical Summary
The evolutionary model of punctuated equilibria indicates that species display a lack of change, stasis, following episodes of abrupt change associated with species splitting. The concept of coordinated stasis suggests that groups of coexisting species display stasis over the same long intervals of geologic time (hundreds of thousands to a few million years). These intervals of stability, like “dynasties” in human history, are termed “ecological–evolutionary subunits” (EESUs). They are separated from one another by shorter episodes, lasting perhaps as little as a few thousands of years, of rapid changes including local extinction, migrations, and evolution of new species. The result is a pattern of coincident evolutionary stasis and relative ecological stability followed by abrupt change.
We address connections among environment, evolution, and ecology by documenting patterns of stability, geographic extent, and synchronous turnover of marine invertebrate animal fossil assemblages from the Middle Devonian (~390 to 379 million years ago) in the eastern United States and compare them with patterns observed in the large Late Ordovician mass extinction interval (~444 million years), which also appears to involve two pulses of faunal overturn separating longer times of relative stability. We discuss geographic extent and stability of fossil assemblages in eastern North America and attempt to determine where these species originated and where many retreated to during times of climatic stress. Stable assemblages of species are widespread within broad, semi-isolated regions (provinces) and border on comparably stable faunas in adjacent provinces, sometimes displaying rapid, nearly synchronous shifts involving local extirpation/extinction and coordinated migration over very long distances. Evidence for origin of new species in small, isolated populations along the margins of provinces, during short times of stressed conditions, at the boundaries of EESUs, emphasizes the role of environment and geography in driving punctuated evolutionary change.
Introduction
In the years since the publication of Eldredge and Gould (Reference Eldredge, Gould and Schopf1972), it has become clear—at least to paleontologists—that many, perhaps even most, animal species exhibit net morphological stasis over the duration of their existences and that the geological record is perhaps not as incomplete as had been argued as far back as Darwin (Reference Darwin1859). If punctuated equilibria edges out phyletic gradualism in the relative frequency argument, questions about how stasis is maintained in the face of natural selection in a Red Queen (Van Valen Reference Van Valen1973) and escalatory (Vermeij Reference Vermeij1995) world, or whether special explanation is needed at all (e.g., Voje et al. Reference Voje, Di Martino and Porto2020), become increasingly important to address. The circumstances that enable or facilitate allopatry and cladogenesis (or punctuated anagenesis via bottlenecks) have received less attention, as they are generally presumed to be regional environmental/ecological adjustments pertinent only to the lineage in question and its unique requirements. Elisabeth Vrba (Reference Vrba1985) highlighted the potential for large-magnitude environmental change to drive synchronous evolutionary response in multiple stable lineages in her “turnover pulse hypothesis.” Working in a completely different system, Brett and Baird (Reference Brett, Baird, Erwin and Anstey1995) independently argued that when taxa are considered in the context of their regional ecosystems, it often becomes apparent that not only do individual lineages tend to exhibit a punctuated equilibria pattern in their evolution, but their ecological associations also exhibit relative stasis, and that the timing of turnover across co-occurring lineages representing widely divergent taxonomic groups is nearly synchronous. They called this pattern “coordinated stasis.” The ensuing dialogue encouraged researchers to cross the traditional divides between paleoecology and macroevolution and consider the ecological and environmental context of morphological data more closely. If coordinated stasis applies, the problem of within-lineage stasis associated with punctuated equilibria still very much remains, independent of any significance ascribed to stasis in ecological associations. Beyond that, it raises the question of how a “coordinated” turnover “pulse” of a large proportion of a fauna arrayed across multiple facies in a depositional basin can be brought about, and what happens to those stable faunas during turnovers.
Here, we first recap the fundamental elements of coordinated stasis and reflect on how the concept has fared over the intervening three decades. Then, for the well-documented instances of coordinated stasis in the Middle Devonian Appalachian Basin, we expand the spatial scope of analysis of blocks of relative stability—ecological–evolutionary subunits (EESUs)—to consider the broader biogeographic extent of these faunas and where taxa go during turnovers. For the early Middle Devonian Appalachian Basin and its equivalents and new examples from the Late Ordovician midcontinent, we show that not only do patterns of taxonomic stasis hold over broad biogeographic regions, but turnovers are coincident with those documented in other biogeographic provinces in distant parts of the world. Hence, turnovers and the EESUs they bound are likely to be correlative over great distances, despite fundamental differences in taxonomic compositions and ecological associations. Finally, we focus our analysis on the mechanisms for and implications of fauna-wide turnover and echo Eldredge’s (Reference Eldredge, Crutchfield and Schuster2003) “sloshing bucket” model to argue that the degree to which turnover is coordinated across the whole fauna reflects the magnitude and extent of the environmental change underlying it. If it becomes apparent, as these cases suggest, that most time in most regions is characterized by taxa exhibiting net stasis, then most evolutionary change must be happening at the spatial boundaries of regionally deployed faunas and at the temporal boundaries of EESUs. Chances for isolation in marginal populations may be increased during times of widespread, rapid habitat degradation, a model more consistent with punctuated equilibria than phyletic gradualism.
Coordinated Stasis and EESUs
Patterns in the Mid-Paleozoic Appalachian Basin
The pattern of “coordinated stasis,” or perhaps the more technically accurate “coincident relative stability” (Miller Reference Miller1997), entails relative taxonomic and ecologic stability in basin-wide faunas over extended intervals of geologic time (105 to 106 yr) based on examples from the Silurian–Devonian marine faunas of the Appalachian Basin in eastern North America, in particular the Middle Devonian Hamilton Group of New York (Brett and Baird Reference Brett, Baird, Erwin and Anstey1995; Brett et al. Reference Brett, Ivany and Schopf1996; Brett Reference Brett and Talent2012). Taxonomic stasis entails a similar species list throughout, with a majority of genera, named species, and even recognized morphospecies persisting from the lowest to the highest samples within an EESU. The stratigraphic distribution of taxon occurrences in the “diverse brachiopod” biofacies (Brett et al. Reference Brett, Bartholomew and Baird2007a) across 13 horizons in the Hamilton Group is consistent with that expected from incomplete sampling of a constant species list (Fig. 1), and analysis of simulated mirror datasets suggests that the actual data can accommodate no more than 6% turnover within the unit (Ivany et al. Reference Ivany, Brett, Baugh, Wall and Handley2009). Model-ranking approaches find the best model to be one in which all studied horizons form a single natural group, with no change points (Ivany et al. Reference Ivany, Brett, Baugh, Wall and Handley2009). Taxonomic stability also implies morphological stability—competent systematists over the years have recognized many dozens of discrete morphospecies that persist throughout the unit, virtually necessitating limited evolutionary change within those lineages. Detailed morphometric studies support this, confirming stasis or at most random walk patterns (sensu Hunt Reference Hunt2007) and no evidence of persistent directional change in most corals (Oliver Reference Oliver1992; Oliver and Sorauf Reference Oliver and Sorauf2002), brachiopods (Lieberman et al. Reference Lieberman, Brett and Eldredge1995), trilobites (Eldredge Reference Eldredge1972; Lieberman Reference Lieberman1994; Lieberman and Kloc Reference Lieberman and Kloc1997), and bivalves (Nagel-Myers et al. Reference Nagel-Myers, McRoberts and LaPoint2018). Rare taxa with sufficient sample recovery throughout (e.g., Lieberman [Reference Lieberman1994] for trilobites) appear no more likely to exhibit evolutionary change than common ones.
The stratigraphic range described by the first and last appearance of a taxon, measured in number of stratigraphic horizons out of a possible 13, plotted against the number of taxa with that stratigraphic range. Hamilton Group data are diamonds; standard deviation (SD) envelope for the expected distribution assuming all taxa span all 13 horizons (i.e., coordinated stasis) is in gray. From Ivany et al. (Reference Ivany, Brett, Baugh, Wall and Handley2009).

In addition to taxonomic/morphological stasis, EESUs also display a strong degree of ecological stasis (Brett et al. Reference Brett, Zaffos, Miller, Eldredge, Pievani, Serrelli and Temkin2016). Biofacies (faunal assemblages) and gradients of faunal distribution are relatively stable, and richness, dominance patterns, approximate rank ordering, and guild structure remain generally similar throughout. Biofacies in the Hamilton Group, as defined by taxon lists, abundance proxy data, or trophic and functional groups, are no more variable between stratigraphic horizons than they are within horizons (Ivany et al. Reference Ivany, Brett, Baugh, Wall and Handley2009). Stability persists despite geographic shifts of many hundreds of kilometers and significant changes in areal extent of faunal associations during ~104 to 105 yr cycles of relative sea-level change and shoreline migration (Scarponi and Kowalewski Reference Scarponi and Kowalewski2004; Brett et al. Reference Brett, Hendy, Bartholomew, Bonelli and McLaughlin2007b, Reference Brett, Baird, Zambito, Bartholomew, Ver Straeten, Over and Woodrow2023). Devonian high-diversity coral-rich biofacies adapted to shallow, clear-water environments repeatedly contract along depositional strike during times of regression and sediment progradation to a small fraction (less than one-fourth) of their most expansive distribution, a phenomenon termed “habitat tracking” or “faunal tracking” (Brett et al. Reference Brett, Bartholomew and Baird2007a,Reference Brett, Hendy, Bartholomew, Bonelli and McLaughlinb; Fig. 2), yet there is minimal change in the ecological properties of the biofacies.
Model of habitat tracking of species represented by bell curves showing depth distributions of individual taxa during cycles of sea level rise and fall. Habitat tracking provides an important mechanism for maintaining stasis. Adapted from Patzkowsky and Holland (Reference Patzkowsky and Holland2012).

Although incumbent species appear to have an advantage during EESUs, invasion by limited numbers of immigrant taxa is still possible (see Lieberman and Kloc Reference Lieberman and Kloc1997), and in many cases, this takes the form of widespread and even facies cross-cutting distributions of single (or a small number of) immigrant taxa, a phenomenon referred to as “epiboles” (Brett and Baird Reference Brett, Baird, Brett and Baird1997). In the Appalachian Basin, these incursions are short-lived and ultimately unsuccessful, probably lasting no more than centuries to a few thousand years, as they occur in centimeter-scale beds or intervals of no more than a few meters. In other cases, as in the Richmondian invasion of the Late Ordovician in the North American midcontinent discussed later, coordinated invasions of up to tens of species take place over very brief time intervals, during parts of meter-scale, sixth-order cycles, and these do become a part of the permanent local community gradients (Holland and Patzkowsky Reference Holland and Patzkowsky2007; Stigall Reference Stigall2023). However, periods of invader dominance alternated with longer intervals showing a return to incumbent dominance, and the near absence of invaders suggests an important physical driver, perhaps associated with subtle alternations in climate that permitted alternating incursion and retrenchment of warmer-water taxa (Little Reference Little2023).
The complements to intervals of protracted taxonomic and ecologic stasis are the coordinated turnovers that separate them. As originally recognized by Brett and Baird (Reference Brett, Baird, Erwin and Anstey1995), EESUs in the Silurian and Devonian of the Appalachian Basin show persistence of 60% to 80% of taxonomic or morphospecies within, and their boundaries show major turnovers with only ~20% to 40% of species carrying over to the next EESU. Coordinated faunal turnovers include extinction, migration, speciation, and ecological reorganization, and they may be characterized by rapid shifts of biogeographic boundaries, as in Vrba’s (Reference Vrba1985) turnover pulse model (Fig. 3). In many cases, changes in the Appalachian Basin as well as the Ordovician of the Cincinnati Arch region can be constrained to occur within intervals on the scale of only 103 to 104 yr, one to two orders of magnitude shorter than those of the EESUs they bound (e.g., Brett et al. Reference Brett, Ivany, Bartholomew, DeSantis and Baird2009). This estimate is based upon documentation of occurrences within small-scale cycles, in nearly conformable successions, that appear to represent precession-driven Milankovitch climatic/sea-level cycles (Ellwood et al. Reference Ellwood, Tomkin, El Hassani, Bultynck, Brett, Schindler, Feist and Bartholomew2011, Reference Ellwood, Brett, Tomkin, MacDonald, Herrero-Bervera and Jovane2013). Thus, we argue that events of coordinated immigration and turnover in some cases can be constrained to portions of ~20 kyr cycles.
Idealized pattern of the turnover pulse hypothesis of Vrba (Reference Vrba1985) integrated with the concept of ecological–evolutionary subunits (EESUs). Figure adapted from Digital Atlas of Ancient Life (https://www.digitalatlasofancientlife.org/).

Net stasis is the norm for a majority of lineages within EESUs of the Appalachian Basin. Minor climatic and sea-level oscillations are mainly accommodated by within-basin habitat tracking, with little to no compositional turnover within biofacies. The prime mover of evolution and new ecological restructuring (EE subunit turnovers) must therefore be environmental perturbation that is of a magnitude too rapid or too large to be accommodated simply by within-basin tracking (cf. sloshing bucket model of Eldredge [Reference Eldredge, Crutchfield and Schuster2003]). This brings about large-scale coordinated migrations, extinction, and accelerated evolution. As we expand upon later, a major outstanding question with implications for evolutionary theory is how broadly distributed the taxa (and faunas) are outside of a given basin during EESUs, and what happens to them when they disappear from a basin.
Beyond the Original Example
Blocks of comparative taxonomic and ecologic stability punctuated by abrupt turnovers appear to be a common motif in the history of life on a range of scales (Foote Reference Foote2005, Reference Foote2007; Roopnarine and Banker Reference Roopnarine and Banker2021; Fig. 4). Sepkoski’s (Reference Sepkoski1981) three fundamentally different evolutionary faunas within the Phanerozoic are subdivided into the nine ecological–evolutionary units (EEUs) of Boucot (Reference Boucot1983, Reference Boucot1990a, Reference Boucot1996) and Sheehan (Reference Sheehan1996). The persistent regional communities of EESUs represent the next level of subdivision in the ecological–evolutionary hierarchy (Roopnarine and Banker Reference Roopnarine and Banker2021; Fig. 4). At each level, much more change can be demonstrated between stable intervals in comparison to that within intervals.
Hierarchy of stable intervals of differing temporal scales. Relatively stable biotic associations bounded by abrupt changes. These include from large to small scale: A, the Cambrian, Paleozoic, and Modern evolutionary faunas of Sepkoski (Reference Sepkoski1981), B, evolutionary units recognized by Boucot (Reference Boucot1990a) and Sheehan (Reference Sheehan1996), and C, ecological–evolutionary subunits (EESUs) originally based on Silurian–Devonian faunas of the Appalachian Basin from Brett and Baird (Reference Brett, Baird, Erwin and Anstey1995) and modified by Brett et al. (Reference Brett, Ivany, Bartholomew, DeSantis and Baird2009). Black bar indicates a large unconformity. Adapted from figure of Roopnarine and Banker (Reference Roopnarine and Banker2021).

Following the initial observations of coordinated stasis, a series of studies has continued to explore aspects of faunal stability and turnover and their theoretical underpinnings in a range of settings and time periods. Not surprisingly, diverse outcomes have been reported. Much of this work has already been summarized elsewhere (see papers in Ivany and Schopf Reference Ivany and Schopf1996; Miller Reference Miller1997; Pfefferkorn et al. Reference Pfefferkorn, Gastaldo, DiMichele, Gastaldo and DiMichele2000; DiMichele et al. Reference Di Michele, Behrensmeyer, Olszewski, Labandeira, Pandolfi and Bobe2004; Brett Reference Brett and Talent2012).
More recent contributions describing patterns broadly or explicitly akin to coordinated stasis include those examining assemblages of fossil tetrapods (Sherratt et al. Reference Sherratt, del Rosario Castañeda, Garwood, Mahler, Sanger, Herrel, De Queiroz and Losos2015; Roopnarine et al. Reference Roopnarine, Angielczyk, Weik and Dineen2019; Blanco et al. Reference Blanco, Calatayud, Martín-Perea, Domingo, Menéndez, Müller, Fernández and Cantalapiedra2021; van Dam et al. Reference van Dam, Mein, Garcés, van Balen, Furió and Alcalá2023), benthic marine invertebrates (Bonelli and Patzkowsky Reference Bonelli and Patzkowsky2008; Zuschin et al. Reference Zuschin, Harzhauser, Hengst, Mandic and Roetze2014; Spiridonov et al. Reference Spiridonov, Stankevič, Gečas, Šilinskas, Brazauskas, Meidla, Ainsaar, Musteikis and Radzevičius2017; Rivadeneira and Nielsen Reference Rivadeneira and Nielsen2022; Carobene et al. Reference Carobene, Bussert, Struck, Reddin and Aberhan2023), planktonic (Buzas et al. Reference Buzas, Hayek and Huber2020) and benthic (Reymond et al. Reference Reymond, Bode, Renema and Pandolfi2011) foraminifera, and conodonts (Spiridonov et al. Reference Spiridonov, Stankevič, Gečas, Šilinskas, Brazauskas, Meidla, Ainsaar, Musteikis and Radzevičius2017). It is notable that this same structure, with blocks of relative stability up to a few million years in duration, is even present during major evolutionary radiations, for example, the Cambrian explosion (Landing Reference Landing, Lipps and Signor1992; Landing and Kouchinsky Reference Landing and Kouchinsky2016), and during at least some mass extinctions, notably the Late Ordovician extinctions (LOME; Rong et al. Reference Rong, Harper, Huang, Li, Zhang and Chen2020; see “EESUs in Major Bioevents: Late Ordovician EESUs during the LOME”).
Some authors have argued convincingly for relative ecological stability but find less evidence for compositional stability (e.g., Strotz and Lieberman Reference Strotz and Lieberman2021). Studies specifically of Hamilton Group faunas have since documented net morphological stasis in additional lineages (Nagel-Myers et al. Reference Nagel-Myers, McRoberts and LaPoint2018), stasis in some assemblages (Newton et al. Reference Newton, Newman, Brower, Avary, Hasson, Richard and Diecchio2020), strong niche conservatism among constituent taxa (Brett et al. Reference Brett, Zaffos, Miller, Eldredge, Pievani, Serrelli and Temkin2016), and relative stability in body size and predator–prey relationships (Nagel-Myers et al. Reference Nagel-Myers, Dietl, Handley and Brett2013), while finding less support for stability in abundance structure (Bonelli et al. Reference Bonelli, Brett, Miller and Bennington2006; Nagel-Myers et al. Reference Nagel-Myers, Dietl, Handley and Brett2013; Newton et al. Reference Newton, Newman, Brower, Avary, Hasson, Richard and Diecchio2020).
Not all sections studied have been shown to exhibit coordinated stasis in the restricted sense originally defined. Some studies show lower persistence and higher rates of speciation (e.g., Bennington and Bambach Reference Bennington and Bambach1996; Westrop Reference Westrop1996; Patzkowsky and Holland Reference Patzkowsky and Holland1997, Reference Patzkowsky and Holland1999; Holland and Patzkowsky Reference Holland and Patzkowsky2004). Still others show more continual flux in morphology and/or composition (e.g., Tang and Bottjer Reference Tang and Bottjer1996; Stanton and Dodd Reference Stanton and Dodd1997; see review by DiMichele et al. 2006). Most recently, Roopnarine (Reference Roopnarine2025) has suggested that, owing to ecological functional networks, communities have resilience against environmental perturbations and that ecological stasis may transcend changes in species composition.
Coordinated stasis is one, perhaps extreme, endmember condition in which a majority of lineages (>60% in the original study of Brett and Baird [Reference Brett, Baird, Erwin and Anstey1995]) persist in near-complete morphological stasis. Many studies of faunas over time, however, including those that do not find pronounced stability, include specific mention of intervals of comparatively abrupt and major changes in the composition and ecological associations of those faunas (Westrop Reference Westrop1996; Patzkowsky and Holland Reference Patzkowsky and Holland1997). The coordinated turnover pattern is also consistent with patterns of turnover found in global databases (Foote Reference Foote2005, Reference Foote2007). In this respect, the turnovers themselves might not be surprising, but it is striking that, in some cases, including those discussed herein, they bound intervals exhibiting so little turnover within.
EESUs and Their Boundaries in Time and Space
Early reports of coordinated stasis emphasized the magnitude of turnovers between EESUs, with low numbers of taxa that are held over from the prior subunit or carry over to the next (Brett and Baird Reference Brett, Baird, Erwin and Anstey1995; Brett et al. Reference Brett, Ivany and Schopf1996, Reference Brett, Ivany, Bartholomew, DeSantis and Baird2009). Hence, the temporal or stratigraphic boundaries of EE subunit “dynasties” (Fig. 5) were defined locally, but the lateral, geographic boundaries were not fully investigated. Regional disappearance of faunas during EE subunit boundary intervals must result from some combination of true extinction of lineages and emigration, while appearances represent immigration and speciation, but the degree to which each is true, and the provenance and destination of migrating taxa, were unclear without a better understanding of faunas outside an individual basin. How geographically extensive are the faunas that characterize particular EESUs, how do they interface with adjacent faunas, and are these blocks of relative stability restricted to individual provinces, or can their boundaries transcend biogeographic boundaries?
Schematic of Middle Devonian bioevents and ecological–evolutionary subunits (EESUs) with common brachiopods and other representative taxa. EESU numbers from Brett et al. (Reference Brett, Ivany, Bartholomew, DeSantis and Baird2009); red lines show boundaries of EESUs; dotted lines denote minor bioevents associated locally with incoming of black shale facies (gray tone). Onondaga Fauna (EESU D-5). A, coral Enallophrentis prolifica; brachiopods: B–D, Pentagonia unisulcata; E, F , Paraspirifer acuminatus; G, Meristella nasuta; H, I, Acrospirifer duodenarius; J, Spinatrypa spinosa; K, Strophodonta demissa; L, Amphigenia; M, N, Megastrophia hemispherica. Stony Hollow Fauna (EESU D-6): O, Variatrypa arctica; P, Carinatina dysmorphostrota. Hamilton Fauna (EESU D-7) and recurrent Hamilton (in upper Tully Formation; EESU D-9): Q, trilobite Eldredgeops rana; R, Pseudoatrypa devoniana; S, Tropidoleptus carinatus; T, Eumetabolotoechia multicostatum; U, Mucrospirifer mucronatus; V, Mediospirifer audaculus; W, Ambocoelia umbonata. Lower Tully Fauna (EESU D-8): X, Tullypothyridina venustula; Y, Ryssochonetes aurora. Figures O and P from Ehlers and Kesling Reference Ehlers and Kesling1970; all others from Linsley (Reference Linsley1994) after illustrations in Hall (Reference Hall1867).

More recent and ongoing work seeks to clarify the nature of the turnovers and the broader biogeographic patterns with which they are associated. In some cases, newly arriving taxa can be tied to a known source area (e.g., Koch and Day Reference Koch, Day, Copper and Jin1996; Zambito et al. Reference Zambito, Brett, Baird and Talent2012a,Reference Zambito, Brett, Baird, Kolbe and Millerb). It is now becoming apparent that, in many cases, EE subunit boundaries represent not only local extirpations but also large-scale coordinated migrations (sensu Stigall Reference Stigall2019) of groups of taxa (“faunas”) into and out of a basin.
In this paper, we discuss the conditions associated with EE subunit turnovers in the Middle Devonian and during the LOME that separate blocks of relative stability and regional dispersal of taxonomic species. As such, we point to similarities of pattern in minor to intermediate (third- and second-order events of Becker et al. [Reference Becker, Königshof, Brett, Becker, Königshof and Brett2016]) bioevents and major (first-order) biocrises. In all cases, regional turnover corresponds with evidence for major environmental/climatic change. This may or may not be marked by local changes in lithology but is nearly always correlated with variations in geochemical proxies that significantly exceed those seen within the subunits and that indicate major regional-to-global changes in environment.
A variety of datasets allow comparison of biogeographic patterns to the magnitudes of both faunal changes and environmental perturbations. As we will show, improved correlations demonstrate that local/regional turnovers originally recognized in the Middle Devonian of the Appalachian Basin (Brett and Baird Reference Brett, Baird, Erwin and Anstey1995) coincide with recognized global bioevents (Walliser Reference Walliser1984, Reference Walliser and Walliser1986, Reference Walliser and Walliser1996; Boucot Reference Boucot, Kauffman and Walliser1990b; Becker et al. Reference Becker, Königshof, Brett, Becker, Königshof and Brett2016, Reference Becker, Marshall, Da Silva, Agterberg, Gradstein, Ogg, Gradstein, Ogg, Schmitz and Ogg2020; Algeo and Shen Reference Algeo and Shen2023). If intervening faunas also show relative stability, then EESUs characterized by different faunas and recognized by workers in different provinces may in fact be correlative and therefore represent global intervals of relative faunal stability. This would then constrain the times—brief and near-synchronous global biocrises—and places—between broadly recognized biogeographic provinces—during which much speciation must be happening. It then becomes more difficult to argue that gradual phyletic change could be happening “somewhere else” to produce the new set of taxa that appear at local EESU boundaries. Rapid evolution of small, isolated populations of otherwise stable species on the margins of their biogeographic ranges and during times of rapidly changing environment, a.k.a. turnover pulse (Vrba Reference Vrba1985), is more consistent with punctuated equilibria than with phyletic change. Therefore, the degree to which EESUs and their intervening turnovers are discernible in time and space speaks to the degree to which punctuated equilibria is likely to characterize the evolutionary process.
Middle Devonian EE Subunits
We focus first on the synchroneity, internal consistency, and boundaries of the well-studied Middle Devonian record from the Appalachian Basin—the type example of EESUs. These include late Eifelian Stage EESU boundaries associated with third-order bioevents of Becker et al. (Reference Becker, Königshof, Brett, Becker, Königshof and Brett2016) and those associated with the mid–late Givetian Stage second-order Taghanic Biocrisis. In the following sections, we present brief summaries of data on the EESUs in eastern North America, pertinent to five key issues related to the EE subunit pattern and its implications for evolution: (1) the synchroneity of EESUs, (2) the geographic extent of faunas within EESUs, (3) regional magnitudes of turnover, (4) the provenance and refugia of surviving migrants during turnovers, and (5) implications for stasis and speciation.
Synchroneity of EESUs
The near synchroneity of Devonian Appalachian turnovers with global bioevents is well documented based on conodont and goniatite biostratigraphy and carbon isotope chemostratigraphy (Koch and Day Reference Koch, Day, Copper and Jin1996; Brett et al. Reference Brett, Ivany, Bartholomew, DeSantis and Baird2009, Reference Brett, Bartholomew, DeSantis, Baird and Ver Straeten2011, Reference Brett, Zambito, McLaughlin and Emsbo2020; DeSantis and Brett Reference DeSantis, Brett, Becker and Kirchgasser2007, Reference DeSantis and Brett2011; Becker et al. Reference Becker, Gradstein, Hammer, Gradstein, Ogg, Schmitz and Ogg2012, Reference Becker, Marshall, Da Silva, Agterberg, Gradstein, Ogg, Gradstein, Ogg, Schmitz and Ogg2020). Late Eifelian turnovers are recognized in many parts of the world and in several biogeographic regions, including the Eastern Americas Realm (EAR) and Old World Realm (OWR; Europe, North Africa, Perigondwana, North American Cordillera, and Malvinoxhosen [formerly Malvinokaffric], i.e., high-latitude Gondwana) (originally defined by Boucot et al. [Reference Boucot, Johnson and Talent1969] and Boucot [Reference Boucot1975, Reference Boucot1988] and recently modified by Dowding and Ebach [Reference Dowding and Ebach2019] and Penn-Clarke and Harper [Reference Penn-Clarke and Harper2021]). These are collectively termed the Kačák or otomari Event (Walliser Reference Walliser1984; House Reference House1985; Chlupác and Kukal Reference Chlupác, Kukal and Walliser1986), named initially for taxonomic changes in pelagic organisms including ammonoids and nowakiids in the OWR Rhenish-Bohemian Province of Czechia and Germany. Recently, Allaire et al. (Reference Allaire, Korn, Balseiro, Monnet and Cronier2025) have identified this interval as one of five major turnovers in ammonoid evolutionary faunas in Morocco. This biocrisis is timed with significant changes in the high-latitude Gondwana region that led to the extinction of much of the cool water–adapted Malvinoxhosen Realm fauna. Boucot (Reference Boucot1988) therefore proposed that the event involved warming, or at least a lowering of the global climatic gradient. As now understood in Laurentia, Spain, and elsewhere, the Kačák is a two-phased event. In the Appalachian Basin, the first pulse (eiflius to kockelianus conodont Zone) is associated with temporary loss or displacement and apparent extinction of some of the long-ranging warm-temperate Onondaga Fauna and its replacement for 1.5 to 2 Myr by presumably warmer-water taxa from the lower-latitude OWR Cordilleran Province (Koch and Boucot Reference Koch and Boucot1982; Koch and Day Reference Koch, Day, Copper and Jin1996; DeSantis and Brett Reference DeSantis and Brett2011; Fig. 6). The second pulse (sometimes termed “Kačák proper”) involved an equally abrupt loss of this short-lived Stony Hollow Fauna and incursion of the diverse Hamilton Fauna, which included reappearance of many genera and species common to the older Onondaga Fauna (Figs. 5, 6) as well as a series of new genera mainly derived from the OWR Rhenish-Bohemian fauna (see Ver Straeten et al. Reference Ver Straeten, Brett, Baird, Bartholomew, Over, Ver Straeten, Over and Woodrow2023). The similarities of the Hamilton with the older Onondaga Fauna suggest a return to warm-temperate conditions comparable to those of the early–middle Eifelian. The two pulses of the Kačák event coincide with a globally recognized pattern of two positive carbon isotopic excursions (van Geldern et al. Reference van Geldern, Joachimski, Day, Jansen, Alvarez, Yolkin and Ma2006; Becker et al. Reference Becker, Marshall, Da Silva, Agterberg, Gradstein, Ogg, Gradstein, Ogg, Schmitz and Ogg2020; Zambito et al. Reference Zambito, Joachimski, Brett, Baird, Aboussalam, Becker, Königshof and Brett2016; Fig. 6).
Late Eifelian–Givetian bioevents, inferred climate change, and carbon isotopic change. Conodont zones are listed in second column; abbreviations: Pol. = Polygnathus; Pol. c. costatus = Polygnathus costatus costatus Zone; T. = Tortodus. Carbon isotope curve adapted from van Geldern et al. (Reference van Geldern, Joachimski, Day, Jansen, Alvarez, Yolkin and Ma2006). Sea-level curve with T-R (transgressive–regressive) cycles adapted from Johnson et al. (Reference Johnson, Klapper and Sandberg1985); Dev. Seq. = Devonian third-order sequences; abbreviations: Eif = Eifelian Stage; Giv = Givetian Stage; Eif-Giv sequence crosses Eifelian/Givetian boundary; sequence designations follow Brett et al. (Reference Brett, Bartholomew, DeSantis, Baird and Ver Straeten2011). Figure reprinted from Brett et al. (Reference Brett, Zambito, Welych-Flanagan, Baird and Bartholomew2025: fig. 9).

The late Givetian bioevents, collectively referred to as the Taghanic biocrisis, were identified based on ammonoid turnovers (Johnson Reference Johnson1970; House Reference House1985; Walliser Reference Walliser and Walliser1986; Allaire et al. Reference Allaire, Korn, Balseiro, Monnet and Cronier2025) and, like the Kačák, involve multiple phases in a relatively short interval, perhaps of about 400 kyr duration (Ellwood et al. Reference Ellwood, Tomkin, El Hassani, Bultynck, Brett, Schindler, Feist and Bartholomew2011; Figs. 5, 7). In eastern Laurentia, there is evidence of an initial abrupt loss of the long-ranging Hamilton Fauna and replacement by an incursion of probably warmer-water taxa in the lower Tully Formation (Tully Fauna), followed by an abrupt and short-lived return of many of the Hamilton taxa, and finally a strong pulse of extinction associated with hypoxic conditions and possible warming (Baird and Brett Reference Baird and Brett2003, Reference Baird and Brett2008; Zambito et al. Reference Zambito, Joachimski, Brett, Baird, Aboussalam, Becker, Königshof and Brett2016). These bioevents are more broadly constrained biostratigraphically by three well-correlated conodont zones (upper Polygnathus ansatus, “Ozarkodina” semiaternans, and the Schmidtognathus hermanni zones) and the incoming of the goniatite Pharciceras amplexum (House Reference House, Oliver and Klapper1981, Reference House1985, Reference House2002), and again carbon isotope extremes coincide with the turnovers (van Geldern et al. Reference van Geldern, Joachimski, Day, Jansen, Alvarez, Yolkin and Ma2006; Zambito et al. Reference Zambito, Brett, Baird and Talent2012a, Reference Zambito, Joachimski, Brett, Baird, Aboussalam, Becker, Königshof and Brett2016; Fig. 7).
Late Givetian Taghanic bioevents (Taghanic biocrisis) recorded in the Tully–Genesee formation interval in central New York. First column, schematic showing the abrupt incoming of the lower Tully Fauna (lower Tully Event), the equally abrupt shift back to recurrent Hamilton Fauna (upper Tully Event), and the low-diversity cosmopolitan Genesee fauna above the main Taghanic extinction (Geneseo Event). The next columns give chronostratigraphic stages, conodont zones (Cono), and lithostratigraphic formations (Fm), members (Mbr), and submembers (Smbr); * = Smyrna condensed bed; B = Bellona coral Bed; wavy lines denote sharp discontinuities, inferred to be minor sequence boundaries. Core log of δ13C carbonate of bulk limestone (micrite) and calcareous mudstone samples, annotated with significant bioevents and inferred climatic trends. δ13C values show a minor negative excursion coinciding with the incoming of the Tully Old World Realm (OWR) fauna and a strong positive excursion, associated with the shift back to the recurrent Hamilton Fauna. Composite δ18O data based on conodont apatite suggest a period of warming associated with the lower Tully Fauna followed by cooling; adapted from figures in Zambito et al. (Reference Zambito, Brett, Baird, Joachimski and Over2013, Reference Zambito, Joachimski, Brett, Baird, Aboussalam, Becker, Königshof and Brett2016) and Baird et al. (Reference Baird, Zambito, Brett, Ver Straeten, Over and Woodrow2023).

The existence of coeval relatively stable faunas separated by major bioevents in different biogeographic areas is strongly suggested for the Middle Devonian EE subunits. DeSantis and Brett (Reference DeSantis and Brett2011) detail the basic similarity of the pattern of facies change and the three late Eifelian bioevents, with similar proportions of faunal turnover (~60%) in local faunas of Spain, the Eifel and Sauerland regions of Germany, the Czech Republic, and Morocco, thus encompassing the Avalonian shelf of Europe, peri-Gondwana, and northern Gondwana Basins. Moreover, recent study of Malvinoxhosan faunas in South Africa indicates the presence of major turnovers within the late Eifelian and late Givetian (Penn-Clarke and Harper Reference Penn-Clarke and Harper2023). Although biostratigraphic correlations are thus far approximate and based upon palynology and megafaunas in the absence of conodonts, the sequence stratigraphic framework shows similar patterns. The coincidence of these turnovers in this same time interval suggests that they record the same bioevents. Indeed, through the Lower to Middle Devonian interval, there are similar numbers of approximately correlative intervals of faunal stability in the high-latitude faunas of South Africa and in the faunas of eastern Laurentia.
Individual faunas that were originally used to define EESUs (Brett et al. Reference Brett, Ivany and Schopf1996, Reference Brett, Ivany, Bartholomew, DeSantis and Baird2009) are widespread within eastern Laurentia (North America) but must have abutted distinctive faunas in adjacent biogeographic provinces. The fact that a large proportion of previously endemic lineages, at least at the generic level, and to lesser extent at the species level, may return in later EESUs indicates that the disappearance of these forms represents regional extirpation by emigration (coordinated migrations of Stigall [Reference Stigall2019]) rather than true extinction of the lineages.
This evidence indicates that the definition of EESUs requires reconsideration; rather than defining them by faunas in a particular basin or province, EESUs, like EEUs, should instead be defined as prolonged time intervals (105 to 106 yr scale) of relative taxonomic and ecological stability, bounded by near-synchronous boundaries at which major local faunal turnovers take place and biogeographic boundaries may be strongly displaced. In this sense, the EESU boundaries may be represented as near-synchronous faunal turnovers in different biogeographic regions, even though the specific taxa involved vary from region to region.
Geographic Extent of Faunas within EESUs
An issue repeatedly raised with respect to the “type” EESUs of the middle Paleozoic Appalachian Basin is how broadly the characteristic faunal assemblages are distributed (e.g., see Miller Reference Miller1997). Are they restricted to the Appalachian Basin of New York, or do they extend over larger areas?
In the case of the Middle Devonian, an ongoing survey of well-correlated, biostratigraphically equivalent strata indicates that many species and genera were very broadly distributed during periods of stability. Data spanning major studied regions during the early Middle Devonian (Eifelian Stage Polygnathus costatus costatus conodont Zone) and early–middle Givetian indicate highly similar assemblages of genera and species in local faunas across eastern Laurentia (Fig. 8A,B, Table 1). Arguably, the best data are for rhynchonelliform brachiopods, which as a group have been reviewed over the whole region by a few specialists (Dutro Reference Dutro, Oliver and Klapper1981; Koch and Day Reference Koch, Day, Copper and Jin1996; see Appendix A, Supplementary Material, https://doi.org/10.5281/zenodo.15185174), so we confine our discussion to them here. We use the diverse assemblages of western New York as a reference, as they are the most completely known from dozens of studies of several hundred outcrops (Brett et al. Reference Brett, Baird, Zambito, Bartholomew, Ver Straeten, Over and Woodrow2023) and have been comprehensively compiled and updated by Linsley (Reference Linsley1994).
Paleoenvironmental and facies map of eastern North America and the Eastern Americas Realm (EAR); approximate orientation of paleolatitude lines is indicated (based on Blakey Reference Blakey2013). Numbered locations are approximate locations of stratigraphic sections from which brachiopod lists were compiled for comparisons with the reference section in western New York. See Table 1 for details on stratigraphic units; references to data sources listed in Appendix A (Supplementary Material, https://doi.org/10.5281/zenodo.15185174), and numbers of brachiopod genera and species and percentages common to the New York reference sections. A, Eifelian Stage: locations include: (1) west-central New York (standard of comparison); (2) Lake Memphremagog, QC; (3) central Ohio; (4) Falls of the Ohio region, KY/IN; and (5) Mississippi River valley, Illinois–Missouri. B, Middle Givetian Stage: locations of samples include (1) western New York (standard of comparison); (2) central New York; (3) northeastern Pennsylvania; (4) central Pennsylvania; (5) Arkona, ONT; (6) Alpena, MI; (7) Sandusky, OH; (8A) Sylvania, OH; (8B) Woodburn, IN; (9) Louisville, KY/Jeffersonville, IN; (10) central Kentucky; (11) southern Illinois; (12) Ragland, AL. Abbreviations: AL, Alabama; AR, Arkansas; CN, Connecticut; DE, Delaware; GA, Georgia; IA, Iowa; IL, Illinois; IN, Indiana; KY, Kentucky; MA, Massachusetts; ME, Maine; MD, Maryland; MI, Michigan; MN, Minnesota; MO, Missouri; MS, Mississippi; NH, New Hampshire; NC, North Carolina; NJ, New Jersey; NY, New York; OH, Ohio; ONT, Ontario, Canada; PA, Pennsylvania; QC, Quebec, Canada; RI, Rhode island; SC, South Carolina; TN, Tennessee; VA, Virginia; VT, Vermont; WV, West Virginia.

Brachiopod generic and specific richness values and % overlap of various local faunas with the best-known compilation from western New York State, the standard of comparison (SOC); Fm = Formation; Mbr = Member. General locations for each numbered fauna are shown for the Eifelian in Fig. 8A and for middle Givetian in Fig. 8B, using the same numbering scheme as the leftmost column; see Appendix A (Supplemental Material, https://doi.org/10.5281/zenodo.15185174) for references giving sources of data on local faunas and comments on sources of data; * = general synopsis of faunal data for Devonian of New York rather than a primary reference.

Presence/absence data were tallied from 5 major geographic areas in the early–middle Eifelian ranging from Quebec to Missouri, and from 12 different areas spanning 9 states and southern Ontario during the lower Givetian Stage (Appendix A, Supplementary Material, https://doi.org/10.5281/zenodo.15185174). Numbers of species and genera were tallied and compared with faunas of the Onondaga Formation and Hamilton Group in western New York State (Fig. 8A,B, Table 1). In the Eifelian, regional collections share between 60% and 97% of species and 93% and100% of genera with the Onondaga Fauna of New York. Givetian proportions exclusive of the Michigan Basin show 48–94% species and 88–100% genera in common. Samples as distal as Mississippi River Valley and Alabama still show strong similarity to the New York Appalachian Basin Hamilton lists. Samples from the Givetian of the Michigan Basin and related Minnesota stand out as exceptions. While the percentage of genera common to the New York Hamilton is still relatively high (77% and 71%, respectively), indicating close connections, species overlap here is small (15%). The Michigan Basin is recognized as a different province or subprovince relative to the Appalachian and Illinois Basins and was partially isolated from the latter regions at some times (Boucot Reference Boucot1975, Reference Boucot1988).
This compilation indicates that faunas typical of EESUs originally documented in the Appalachian Basin of New York ranged widely across eastern Laurentia at the time, with high degrees of faunal similarity across the entire region, at least in terms of presence of species and genera. While detailed morphometric studies would be required to fully test the identity of these “taxonomic species,” this pattern suggests that, over the bulk of the biogeographic range of many taxa, morphology is similar enough to warrant designation as the same species by brachiopod specialists. Existing data are inadequate to test whether the community structures or gradients would be similar. A next step, presently underway, will be to document the relative/rank abundance of species and gradients of species composition in each of these disparate areas and compare them with those of the better studied Appalachian Basin in New York.
Regional Magnitudes of Turnovers
The numbers and proportions of species that are held over from the previous EESU and those that carry over to the next speak to the severity of change at EESU boundaries (Brett et al. Reference Brett, Ivany, Bartholomew, DeSantis and Baird2009). The magnitudes of nearly synchronous turnovers in the local faunas of eastern North America during the Middle Devonian are similar over much of the area, even in the Michigan Basin (Fig. 9).
Map of eastern United States showing several well-studied fossiliferous successions in which the proportions of carryover, holdover, and recurrence among three successive rhynchonelliform brachiopod faunas are compared. ME, middle Eifelian (Pol. costatus costatus Zone), EESU D-5, Onondaga Fauna; LE, late Eifelian (upper T. kockelianus–Pol. eiflius Zones), EESU D-6, Stony Hollow Fauna; MG, middle Givetian (Pol. timorensis to Pol. ansatus (lower) zones), EESU D-7, Hamilton Fauna. Numbers in boxes give total numbers of brachiopod genera reported from each stratigraphic interval, numbers in parentheses indicate number of genera shared with the next younger association, number associated with crescentic line indicates number of genera from oldest (Onondaga) fauna that appear in the youngest (Hamilton) fauna (including carryover and recurrence). Regional faunas indicated by color: red, west central New York State, Onondaga–Marcellus subgroup–upper Hamilton subgroup; green, north-central Ohio, Columbus–Delaware–Plum Brook Prout Formations; purple, Falls of the Ohio area of Kentucky and Indiana, Jeffersonville–Speed–North Vernon (especially Beechwood Member); blue, northern Michigan: Detroit River/Dundee–Rogers City Fm–Traverse Group; orange, southern Illinois–Missouri, Grand Tower (lower) –Grand Tower (upper) –Beauvais Sandstone–Lingle Formation. Colored stars indicate the approximate positions of samples. For sources of data, see Appendix A (Supplementary Material, https://doi.org/10.5281/zenodo.15185174).

Interestingly, the number of species shared with the immediately preceding EE subunit may be significantly lower than that of two subunits prior. This has important implications for the processes at subunit boundaries. In these cases, successive EESU boundaries may record coherent shifts in biogeographic boundaries that are reversed in a subsequent turnover.Although some lineages do not reappear and have probably been exterminated in the events, more than half of genera and even up to a third of species evidently did survive and returned after an outage of several million years.
These empirical observations indicate that at EESU boundaries, whole suites of taxa were temporarily displaced to another presumably adjacent region, and with varying degrees of modification, similar faunas were capable of reinvading en masse after intervals of hundreds of thousands to a few millions of years. Similar patterns of faunal turnover and later return of many genera, seemingly related to climatic shifts, have been documented in the Middle and Upper Ordovician of Laurentia (Patzkowsky and Holland Reference Patzkowsky and Holland1997; Wright and Stigall Reference Wright and Stigall2013; Bauer and Stigall Reference Bauer and Stigall2014; Lam and Stigall Reference Lam and Stigall2015); and for the Late Devonian in eastern North America (Stigall Reference Stigall2010). Remarkably, the occurrence of distinctive suites of taxa in similar biofacies before and after the mass outages indicates that even the approximate faunal gradients and/or communities could be conserved during these intervals of mass migration (Brett et al. Reference Brett, Bartholomew and Baird2007a). It appears that there are analogous communities in different EESUs, and in some cases, such as the recurrent Hamilton Fauna of the upper Tully Formation (EESU D-9), the faunal gradient after an outage of several hundred thousand years is nearly identical to that which existed in the older Hamilton Fauna of EESU D-7 (Brett et al. Reference Brett, Bartholomew and Baird2007a, Reference Brett, Ivany, Bartholomew, DeSantis and Baird2009; Ivany et al. Reference Ivany, Brett, Baugh, Wall and Handley2009). This would seem to imply that faunal gradients could remain nearly intact despite mass emigration of thousands of kilometers.
In most cases, there is little direct evidence of the exact areas to which the faunas retreated. Presumably, this implies comparatively geographically restricted refugia or areas that subsequently underwent erosion. Because most immigrations occur during intervals of relatively high sea level (and coincident warming) when physio- and biogeographic barriers are breached, it is possible that refugia occur on newly submerged areas that are subject to erosion during subsequent sea-level fall. However, there are some cases in which the provenance of new faunas can be suggested.
Provenance and Refugia of Surviving Migrants during Turnovers
The boundaries of the well-defined EESUs of the Early and Middle Devonian Appalachian Basin in part record immigrations and emigrations at subunit boundaries for which sources and destinations have become clearer. A majority of immigrants in the case of the short-lived Stony Hollow and lower Tully Faunas were clearly derived from the western Canadian Cordilleran (OWR); Koch and Day (Reference Koch, Day, Copper and Jin1996) indicate the some 33 of 45 (75%) brachiopod species represented in the overall late Eifelian faunas of eastern North America were either derived from the OWR Cordilleran Province, typified by Variatrypa arctica, or were cosmopolitan forms with few of the previous Appalachian Basin (Appohimchi Province) Onondaga Fauna.
Likewise, the short-lived lower Tully Fauna includes some 15 OWR taxa (e.g., Tullypothyridina) but again a surprisingly low proportion (30%) of the typical forms from the immediately underlying Hamilton Group. Rather, most of those Appohimchi taxa, aside from a few eurytopic forms, were completely absent from the known outcrop area of eastern North America during the lower Tully interval (EESU D-9), indicating extreme restriction or elimination of these taxa in local basins.
Hence, large-scale extirpation (emigration as well as probable extinction) coincides with subunit boundaries. There is no evidence that competition with invaders contributed to the elimination of incumbents, many of which evidently persisted elsewhere and staged a later recurrence. Instead, in both cases, turnover patterns suggest that a change in the climate gradient forced temperate faunas out of the Appalachian Basin as more tropical forms appeared. Each of these incursions of OWR taxa and emigrations of Appohimchi taxa affected a broad area and are clearly interbasinal. Stony Hollow Fauna elements, for example, are seen in the Iowa, Michigan, Elk Point (Ontario), and Moose River Basins, as well as the Appalachian Basin from New York to Alabama and the southern Illinois Basin in Illinois and Missouri (Koch and Day Reference Koch, Day, Copper and Jin1996).
What became of the previous occupants of eastern North America during this time of occupancy by OWR faunas? Some taxa became extinct. Among brachiopod species, some 50 of 89 species (59%) from the diverse Onondaga Fauna, and 15 of 64 genera (16%), fail to return during the later Hamilton Fauna recurrence in the upper Tully Formation, although two species appear ephemerally in the lowermost beds of Hamilton Group and then are seen no more (Bartholomew and Schramm Reference Bartholomew and Schramm2013). A smaller number of Hamilton faunal elements do not appear in known upper Tully assemblages, but this number may in part reflect the small sample size and incomplete knowledge of eastern clastic-dominated facies of the Tully (Baird et al. Reference Baird, Zambito, Brett, Ver Straeten, Over and Woodrow2023).
On the other hand, in both cases, the supposedly warm-water fauna is abruptly displaced or extirpated from the Appalachian Basin and replaced by a fauna that has strong affinities with the older Appohimchi taxa. For example, in the diverse Hamilton Group of western New York, 37 of 54 genera (68%) of Hamilton rhynchonelliform brachiopods are shared with the older Onondaga assemblage; and similar numbers apply in other local faunas (Fig. 9). In the case of the Taghanic bioevent, nearly all the diverse upper Tully (recurrent Hamilton Fauna) brachiopods (45 of 53 species and 46 of 47 genera) are shared with the older Hamilton Fauna, while only 9 carry through from the immediately subjacent lower Tully, and even these are also shared with the Hamilton Fauna.
The fact that such a high proportion of species and genera can recur after outages of hundreds of thousands to a few million years demonstrates prolonged relative stability within many lineages that transcends EE subunit boundaries and, evidently, implies long-distance climate-driven migrations. It also points to the existence of refugia in which many lineages were able to persist during displacement from their original provenance, but determining the site of residence of the Appohimchi fauna during times of its general absence in the eastern Laurentia is more difficult. Given that a vast region from the basin northward into the tropics is occupied by a warmer-water fauna, and that the southeastern side of the basin was cut off by the Acadian orogen, the regions for persistence lie generally beyond Laurentia itself and most probably in a southerly (higher-latitude) direction (Fig. 10). Brachiopods with EAR affinities are reported in parts of northern South America and northwestern Africa (see Penn-Clarke and Harper [Reference Penn-Clarke and Harper2021] for a summary). A particularly promising possible refugium is in or near to the Colombia–Venezuela province in the Llanos Basin of northern South America and its extension into southern Peru, which then faced southeastern Laurentia across a narrowing Rheic Ocean (Fig. 10). The Floresta Formation, a highly fossiliferous siliciclastic-dominated succession in the Colombian Andes of Eifelian to early Givetian age (approximately correlative to the Onondaga and lower Hamilton), may be a potential refugium for Appalachian Basin taxa. Studies of the fauna by Caster (Reference Caster1939), recently updated by Morzadec et al. (Reference Morzadec, Villarroel, Janvier and Racheboeuf2015), reveal strong affinities with the late Eifelian–Givetian of the Appalachian Basin. Of 24 reported genera of brachiopods, 20 (83%) and 6 species, are shared with both Onondaga and Hamilton Faunas of eastern Laurentia, and only two are typical of cool-water Gondwana (Malvinoxhosen) faunas. In addition, the eurythermal Tropidoleptus carinatus, Rhipidothyris, and Pustulatia (Penn-Clarke and Harper Reference Penn-Clarke and Harper2021) occur mixed with Eifelian taxa, as in the Hamilton Fauna. Venezuelan faunas also show close parallels with 80% of 25 brachiopod genera, and 4 species in common with the Appalachian Basin Eifelian fauna (Weisbord Reference Weisbord1967); species are also almost entirely different from those identified in Colombia.
Middle Devonian paleogeography and biogeography with biogeographic provinces indicated. A, Global paleogeography with biogeographic provinces indicated; abbreviations: EAR, Eastern Americas Realm; Mal., Malvinoxhosen (formerly Malvinokaffric) Realm; OWR, Old World Realm; OWR Cor., Cordilleran Province (NW Laurentia); OWR R-B, Rhenish–Bohemian Province (Avalonia, Perigondwana); general climatic regime indicated by colors of acronyms. Modified from figure by Penn-Clarke and Harper (Reference Penn-Clarke and Harper2021). B, Paleogeographic reconstruction of Laurentia showing proximity to northern South America and the Llanos Basin; note series of microcontinental platforms intervening in the Rheic Ocean separating the EAR from the Llanos Basin. Modified from Blakey (Reference Blakey2016).

Implications for Stasis and Speciation
Although most lineages appear to persist within EESUs of the Devonian in eastern North America, with only minor and non-directional changes (Lieberman et al. Reference Lieberman, Brett and Eldredge1995), there are instances of very minor but discrete morphological changes in some lineages, which appear abruptly and are widespread in particular stratigraphic intervals. There is some evidence that these speciation events may record restriction of ranges during strong regressions and fixation of minor morphological changes, presumably in small populations followed by re-expansion. It is notable that the iconic case of punctuated equilibria may involve this process (Eldredge and Gould Reference Eldredge, Gould and Schopf1972). Eldredge (Reference Eldredge1972) documented two abrupt (subspecies level?) changes in the number of vertical rows or files of lenses in the trilobite Phacops rana Green sensu lato (now assigned to Eldredgeops). Although this presumably was driven by allopatric speciation or cladogenesis, there is little evidence of coexistence of earlier species with their presumed descendants, suggesting that this process may have involved bottlenecking, elimination of previously widespread populations, and re-expansion of altered morphotypes. The first transition from 18 file Eldredgeops milleri (Stewart, 1927) to 17 file E. rana rana (Green, 1834) follows a major lowstand before the lower Givetian Mottville sequence boundary (Brett et al. Reference Brett, Bartholomew, DeSantis, Baird and Ver Straeten2011; G. Kloc personal communication 2024). The second transition from 17 file-eyed Eldredgeops rana rana to 15 file E. rana norwoodensis (Stumm, 1953) is associated with the recurrent Hamilton Fauna in the upper Tully Formation following at least two short-lived lowstands (marked by sequence boundaries). Similarly, Lieberman and Kloc (Reference Lieberman and Kloc1997) suggest that the appearance of four different species of Greenops make nearly complete replacements (no transitional forms and no mixing at particular stratigraphic levels). As these come in after widespread, probably eustatic lowstands, there may be a stratigraphic bias such that the portion of the record during the transition may be absent nearly everywhere, as predicted in the models of Holland (Reference Holland1995, Reference Holland1996, Reference Holland2000), but these are not associated with major faunal turnovers. Although more detailed study is needed, we suggest that these new slightly different species record reinvasions from marginalized populations following isolation episodes during which most of the populations were exterminated. Such cases could represent a form of punctuated anagenesis via bottlenecking rather than cladogenesis, as there is no evidence of overlap of presumed ancestral and descendant species. It is particularly interesting that Greenops grabaui Lieberman and Kloc, Reference Lieberman and Kloc1997 has recently been reported from the lower Givetian Floresta Formation in Colombia (Morzadec et al. Reference Morzadec, Villarroel, Janvier and Racheboeuf2015), suggesting a possible source area for its abrupt appearance in the middle Givetian of the Appalachian Basin.
There does appear to be enhanced speciation during times of EESU turnovers. A high proportion of genera return (~50% of brachiopods and corals), but many are represented by new species (about 70% to 80% of brachiopods and corals), and new genera closely related to those in older assemblages appear abruptly at turnovers. Across provinces there can also be a moderately high return of older genera. Similar patterns of genus-level recurrence occur across the middle Eifelian, late Eifelian, and middle Givetian in the Michigan Basin and Appalachian Basin, including New York (Fig. 9). For example, during EESU D-7 there is a relatively high amount of genus-level overlap (77%) between the New York and Michigan faunas; those remaining are presumably warm-water atrypid, productid, and gypidulid genera that show the influence of the OWR tropical biotas (Koch and Boucot Reference Koch and Boucot1982). However, during the same interval, species show relatively low overlap (~15%) with the very widespread Appohimchi faunal province (Table 1). This discrepancy could be partly an artifact of differences in taxonomic practice. The brachiopods of this region were studied in detail by Imbrie (Reference Imbrie1959), who created many new species, in some cases restricting them to single formations. Updated phylogenetic studies are clearly needed. The result is not only the observed minimal overlap with other areas but also anomalously short ranges of species relative to other parts of the study area. However, for at least some of the documented species, difference is probably the result of genuine faunal differences between the Michigan Basin and Appohimchi Province assemblages. Presumably, the large numbers of distinct species in the Michigan Basin that are congeneric with the widespread species in the Appalachian and Illinois Basins may indicate partial isolation of marginal populations along a “soft” border area between the Appohimchi and Michigan Basin Provinces, which facilitated allopatric speciation during periods of stress, perhaps associated with sea-level lowstands. Once isolation broke down during sea-level highstands, further rapid differentiation of Michigan Basin isolates with overlapping large populations of congeneric species may have been driven by character displacement, as discussed for phacopid trilobites in the Michigan Basin periphery by Eldredge (Reference Eldredge1974).
There are interesting parallels between the northwestern interface of the Appohimchi Province (Appalachian Basin) with the Michigan Basin Province and the southern interface of the Appohimchi with northern South America during late Eifelian–Givetian time. Most brachiopod genera are represented by different species than those in the Appalachian Basin, but there is again a need for thorough review and update of systematics. Caster (Reference Caster1939) and Weisbord (Reference Weisbord1967) likely expected to identify species different from those in eastern North America given the paleogeographic distances to Colombia and Venezuela (respectively), especially as was then understood in a pre–plate tectonic framework. Thus, as with the Michigan Basin, some of the species-level differences may be an artifact of taxonomy. But again, at least some of these species are likely real, and there may be genuine parallels if, as speculated for Appohimchi Province/Michigan Basin Province transition, there was local isolation in fringing populations, facing different paleoecological conditions, as well as potential interaction with species derived from another, in this case cooler-water, province.
We surmise that the border areas and mixing zones between broadly deployed faunas during times of displacement from their wider source area in eastern Laurentia (EESU boundaries) may have offered opportunities for isolation and cladogenesis. If temporal relationships can be further refined and systematics updated, it may be possible to test for true cladogenesis in these cases, as it appears that these suites of congeneric species were coeval with probable ancestral stocks, which persisted and reinvaded the eastern Laurentian region at a slightly later time. Coexistence of ancestor and descendant species provides strong evidence for punctuated equilibria over phyletic gradualism.
EESUs in Major Bioevents: Late Ordovician EESUs during the LOME
In this section, we briefly review a larger-scale biocrisis—the LOME—and examine parallels with the smaller bioevents discussed earlier and suggest that this interval can also be subdivided into phases corresponding to EESUs (Fig. 11).
Faunal succession of brachiopods, trilobites, corals, reefs, and sponges through the Ordovician and Silurian transition, highlighting the late Katian, early Hirnantian, and latest Hirnantian–Silurian blocks of global Katian, Hirnantia, and Edgewood–Cathay faunas, which closely resemble Silurian–Devonian ecological–evolutionary subunits (EESUs) in terms of duration and abrupt bounding turnovers. Faunas are equated with EESUs in this figure on an informal and illustrative basis; S-1 is Silurian fauna I of Brett and Baird (Reference Brett, Baird, Erwin and Anstey1995). E-C, Edgewood–Cathay Fauna; F, Foliomena fauna; H, Hirnantia Fauna; K, Katian Faunas; M, Manosia Community. Modified from Rong et al. (Reference Rong, Harper, Huang, Li, Zhang and Chen2020) with permission of Rong Jiayu.

The Late Ordovician (Hirnantian) extinctions were among the most severe in the Phanerozoic with estimates of an overall loss of 72–85% species and 43–52% of generic diversity (Raup and Sepkoski Reference Raup and Sepkoski1982; Sepkoski Reference Sepkoski and Walliser1996; Bambach et al. Reference Bambach, Knoll and Wang2004; Harper et al. Reference Harper, Hammarlund and Rasmussen2014; Stanley Reference Stanley2016; Bond and Grasby Reference Bond and Grasby2017, Reference Bond and Grasby2020; Harper Reference Harper2023). The biocrisis appears to encompass a two-part mass extinction, with the most severe occurring in the early Hirnantian associated with the onset of glaciation in Gondwana and the rising limb of the Hirnantian isotope carbon excursion (HICE) and the second associated with deglaciation at/near the Ordovician/Silurian boundary and the falling limb of the HICE (Melchin et al. Reference Melchin, Mitchell, Holmden and Štorch2013; Rong et al. Reference Rong, Harper, Huang, Li, Zhang and Chen2020). Holland and Patzkowsky (Reference Holland and Patzkowsky2015) suggested that the pattern of two extinction pulses could be produced as an artifact of missing time at unconformities. However, the detailed and global studies of Rong et al. (Reference Rong, Harper, Huang, Li, Zhang and Chen2020) provide strong evidence for the existence of distinct, stable, and widespread faunas following each of the two major unconformities. While work is still in progress, strong similarity with EESUs in the Devonian suggests that a similar set of phenomena was at play. The earlier and most severe extinction phase of the LOME resulted in the abrupt loss of a high proportion of Katian taxa, including very abundant and widespread genera such as the brachiopods Rafinesquina and Hebertella, trilobites such as Isotelus, and a majority of pelagic taxa, including most diplograptids. Typical Katian assemblages were abruptly replaced by the cosmopolitan cool-water Hirnantia Fauna (Fig. 11), reported from more than 100 localities globally, including sections showing near conformity across the Katian/Hirnantian boundary. This fauna was characterized by a moderate diversity of brachiopods, especially Hirnantia, Eostropheodonta, Plectothyrella, and Hindella, and the trilobite Mucronaspis (Rong et al. Reference Rong, Harper, Huang, Li, Zhang and Chen2020). The Hirnantia fauna persisted only briefly in geologic terms, perhaps less than 1 Myr (see Rong et al. Reference Rong, Harper, Huang, Li, Zhang and Chen2020 and references therein), in the early to mid-Hirnantian (Metabolograptus extraordinarius Zone to early Metabolograptus persculptus Zone), but in that time was present over a vast region of more than 20 paleocontinents (Rong et al. Reference Rong, Harper, Huang, Li, Zhang and Chen2020). This Hirnantian interval was characterized by a nearly global outage of warm-water clonal and reef-forming taxa, including most colonial rugose and tabulate corals and stromatoporoids, yet these lineages, including many genera, evidently persisted in localized warm-water refugia, as they were rapidly reestablished as a Lazarus fauna in the latest Hirnantian. At present, the majority of these refugia environments have yet to be identified, as the widespread Hirnantia fauna occupied much of shallow to mid-shelf areas globally, but a detailed analysis by Rasmussen and Harper (Reference Rasmussen and Harper2011) suggests that Baltica, peri-Laurentian terranes, and Kazakhstania may have been shallow-water refuges, while South China may have provided habitats for deeper-shelf biotas.
The Hirnantia fauna was largely extinguished or strongly diminished in the second, later extinction pulse of the LOME biocrisis and abruptly replaced by the more diverse Edgewood–Cathay Fauna (Fig. 11), which also appears to have been widespread, at least in tropical to subtropical regions. This fauna has been extensively reviewed by Rong et al. (Reference Rong, Harper, Huang, Li, Zhang and Chen2020) and Jin and Harper (Reference Jin and Harper2024). In eastern North America, the Edgewood fauna was diverse and included an abundance of corals, stromatoporoids, brachiopods, and other invertebrates, including many families and genera (although very few species) that appear to be held over from the Katian. Once established in a few tens of thousands of years near the Ordovician/Silurian boundary, most genera of the Edgewood fauna persisted for the next ~3 Myr of the early Silurian Rhuddanian Stage, establishing Silurian EESU 1, at least in the Appalachian Basin and surrounding shallow seas (Brett and Baird Reference Brett, Baird, Erwin and Anstey1995; Farnam and Brett Reference Farnam and Brett2024).
The end-Ordovician Hirnantian biocrisis represents a much larger-scale extinction and restructuring than the Devonian EESU bioevents discussed earlier; nevertheless, strong parallels are apparent. The Hirnantia and Edgewood faunas represent parts of very widespread, possibly global, EESU, and their boundary even represents an EEU boundary. The Hirnantia fauna, or first Hirnantian EESU, was derived from cool-water, presumably high-latitude biotas, and its arrival is coincident with the strong positive HICE δ13Ccarb excursion together with strong glaciation and global cooling (Melchin et al. Reference Melchin, Mitchell, Holmden and Štorch2013). The Edgewood fauna (or second Hirnantian EESU in part) was reassembled rapidly following abrupt warming and sea-level rise associated with deglaciation, all coincident with a negative δ13Ccarb excursion (Melchin et al. Reference Melchin, Mitchell, Holmden and Štorch2013). However, recent study of newly discovered outcrops showing the first two major cycles of the latest Hirnantian indicate that even this “recovery” was pulsed, with sparse holdover Hirnantia fauna in an early phase being abruptly replaced by the diverse Edgewood forms (Farnam Reference Farnam2024). Considering that most genera persist upward into the early Silurian Rhuddanian Stage, this fauna approximates Brett and Baird’s (Reference Brett, Baird, Erwin and Anstey1995) early Silurian EESU S-1. Hence, recovery from the great LOME was not slow and gradual but pulsed and involved semi-stable early phases, and once established, most elements of that fauna persisted for several million years.
Moving Forward: Unresolved Issues and Further Studies Needed
Several unresolved questions regarding apparent coordinated faunal stability and turnover will guide further research. These include: (1) whether the pattern is a real biological phenomenon or an artifact of stratigraphic architecture, (2) the precise timing and causes of turnover, (3) the extent to which specific and generic stability exists within intervals bounded by turnover events, and finally, (4) the processes that underlie observed patterns.
Is It an Artifact?
The time averaging ubiquitous in the fossil record can enhance or even, as some suggest, produce de novo a pattern of community-level stability (Tomašových and Kidwell Reference Tomašových and Kidwell2010). Even more, the pattern of pulsed turnover could emerge as an artifact of gaps associated with disconformities, facies changes, or condensed intervals in stratigraphic sequences (Holland Reference Holland1996, Reference Holland2000, Reference Holland2020). Because the coordinated stasis pattern is based on the stability of faunal associations and on clusters of first occurrences, it is critical to raise these alternative models as null hypotheses, and necessary to reject them before a pattern of stasis and/or pulsed origination and extinction can be considered further. As emphasized in the conceptual framework of stratigraphic paleobiology (Holland Reference Holland1996, Reference Holland2020; Patzkowsky and Holland Reference Patzkowsky and Holland2012), the interaction of stratigraphic architecture with species ecology can produce clusters of first and last occurrences at disconformities or condensed sections marked by facies changes even when turnover is constant. Thus, the apparent rapidity of turnovers can be enhanced by stratigraphic architecture, appearing pulsed in the stratigraphic record even when they represent protracted intervals of slower extinction (Holland Reference Holland2020). A closer approximation of true first and last occurrences in time also requires knowledge of fossil associations up and down depositional dip, as tested in studies of the Quaternary fossil record of the Po Delta Plain, Italy (Scarponi and Kowalewski Reference Scarponi and Kowalewski2007; Scarponi et al. Reference Scarponi, Kaufman, Amorosi and Kowalewski2013; Nawrot et al. Reference Nawrot, Scarponi, Azzarone, Dexter, Kusnerik, Wittmer, Amorosi and Kowalewski2018). In addition, both regional and temporal comparisons of faunas should include an assessment of environmental gradients, including depth and sedimentological gradients. In this way faunas across a region and through time can be compared more fairly, in the context of similar environments (e.g., see Brett et al. Reference Brett, Bartholomew and Baird2007a; Patzkowsky and Holland Reference Patzkowsky and Holland2012).
Detailed studies of the classic Silurian–Devonian EESUs of the Appalachian Basin in a high-resolution sequence stratigraphic framework show that turnover is nearly as abrupt in the highly expanded, more nearly conformable successions as in condensed sections and, conversely, that many significant sequence boundaries are not associated with commensurate faunal change (Brett Reference Brett1995; Brett et al. Reference Brett, Bartholomew and Baird2007a, Reference Brett, Bartholomew, DeSantis, Baird and Ver Straeten2011). Moreover, the faunal change is not associated with major lithofacies change. Hence, in these cases, we argue that the pattern records a real biological effect rather than stratigraphic artifact. We emphasize the need to trace EESU boundaries into the thickest most nearly conformable sections and to examine the patterns around known unconformities and condensed intervals. If the pattern can be shown to be more than a stratigraphic artifact, the most fundamental question still to be adequately addressed is: how widespread is it in space and time? To evaluate this, more detailed studies of fossil occurrences within a sequence stratigraphic framework across basins are very much needed.
What Is the Temporal Scope of EESUs and What Might That Tell Us?
The temporal scope of EESUs needs more attention. In the original example, we observed blocks of stability of a few million years duration, but what is the relevant temporal scale over which stability is expressed? Other studies recognized intervals of similar duration bounded by major turnovers, but with more species-level changes in the EE subunit, they did not fit the pattern of coordinated stasis (Westrop Reference Westrop1996; Patzkowsky and Holland Reference Patzkowsky and Holland1997). One possibility is that these apparently more continuous changes arise from broad temporal binning. For example, the species turnover observed by Westrop (Reference Westrop1996) within Cambrian biomeres may, if dissected at finer scale, resolve to a series of shorter blocks of stability more closely resembling coordinated stasis. There is some preliminary evidence that, in the late Cambrian and Early Ordovician of the Great Basin, several sharply bounded, shorter (~400 kyr) blocks of coordinated stasis across many lineages of trilobites might exist between the more major turnovers (Adrain and Westrop Reference Adrain and Westrop2024). Where possible, cyclostratigraphic analysis can determine whether Milankovitch band periodicities are present, and then the timings of faunal turnovers separating intervals of stability can be established within this semiquantitative temporal framework.
What Factors Favor Coordinated Patterns?
What aspects of geography and environment might predispose some associations of taxa to exhibit a pattern of coordinated stasis and pulsed turnover, as in the mid-Paleozoic of the Appalachian Basin, while others show more continual flux (e.g., Tang and Bottjer Reference Tang and Bottjer1996; Stanton and Dodd Reference Stanton and Dodd1997)? A factor favoring stronger expression of coordinated stasis might derive from the availability of broad swaths of habitat (e.g., epicontinental seas) oriented roughly parallel to environmental gradients, affording easy migration routes during a fluctuating climate (Brett Reference Brett and Talent2012). Conversely, environments that promote mosaic habitats or environmental gradients that occur at high angles to zonal belts of climate (e.g., the Neogene of coastal California in the case of Stanton and Dodd [Reference Stanton and Dodd1997]) may not permit tracking and could promote a pattern of more continuous, asynchronous turnover of species. Comparative studies and/or modeling of different paleogeographic configurations are needed to sort out these factors.
It is also apparent that there may be differences between marine benthic communities, which are the focus of the present study, and pelagic ecosystems. Recent work by Allaire et al. (Reference Allaire, Korn, Balseiro, Monnet and Cronier2025) identified six “evolutionary faunas” in Devonian ammonoids, which share coincidence of turnover times with the EESUs at global bioevents. However, they display neither the same degree of internal specific/generic composition over prolonged periods nor, at least in some cases, the abruptness of change. The authors suggest that these differences may reflect different evolutionary dynamics and biogeographic distribution of nektonic organisms as opposed to benthic taxa.
Is there any secular trend in the tendency of communities to show bimodal modulated patterns of stasis and change as opposed to more continuous turnover? Recent studies in the mid-Paleozoic indicate that there are intervals of low environmental volatility that alternate with intervals of comparable duration that feature many episodic changes, most of them associated with EE subunit boundaries (Brett et al. Reference Brett, Zambito, McLaughlin and Emsbo2020). A systematic review of case studies through time is needed to determine whether there are particular times or situations that favor coincident relative stability as opposed to more continuous change.
Is Disturbance Enough, or Is Biology Needed?
Does an observed pattern of coordinated stasis require a special biological process to maintain that stability, or is a quasi-bimodal disturbance regime sufficient to give rise to the pattern (Ivany Reference Ivany1996)? Net morphologic stasis (and punctuated equilibria) in individual taxa must still involve some form of stabilizing selection (e.g., Estes and Arnold Reference Estes and Arnold2007), but concurrent taxonomic and ecologic stasis across a fauna might require no more than a persistent and shared effective environment, as implied by habitat tracking (Fig. 2).
Coordinated stasis and turnovers, then, could reflect the disturbance regime alone, with rates and/or magnitudes of environmental change during intervals of coincident relative stability being significantly lower than those associated with turnovers. A bimodal distribution of disturbance intensity would give rise to a bimodal pattern of faunal response (Ivany Reference Ivany1996).
Disturbance regime is relevant to morphological stasis as well, as intervals characterized by frequent but low-level fluctuations might themselves facilitate morphologic stasis and punctuated equilibria (Lieberman et al. Reference Lieberman, Miller and Eldredge2007). Faunas inhabiting environments with minimal disturbance, however, where taxa are freer to respond to biotic selection pressures or experience genetic drift, might be more likely to exhibit uncoordinated phyletic change in lineages over time (e.g., Sheldon’s [Reference Sheldon1996] “Plus ça change” model).
Instances of coordinated stasis could also suggest that sources of constraint beyond those unique to individual taxa act at the level of ecosystems (Eldredge et al. Reference Eldredge, Thompson, Brakefield, Gavrilets, Jablonski, Jackson, Lenski, Lieberman, McPeek and Miller2005, Reference Eldredge, Pievani, Serrelli and Tëmkin2016) and/or that stable communities (or their ecological functional networks) themselves act as agents of selection for taxa with longer (hence overlapping) durations (Roopnarine and Angielczyk Reference Roopnarine, Angielczyk, Eldredge, Pievani, Serrelli and Tëmkin2016; Roopnarine Reference Roopnarine2025). The degree to which abundance structure persists and/or that invading taxa fail to establish, indicating that biogeographic interchange is possible but not successful, needs to be carefully assessed. If such stability is documented, this leaves open the possibility that forces arising from the ecosystem itself could play a role in maintaining overall stability (e.g., hierarchically organized ecosystems [Morris et al. Reference Morris, Ivany, Schopf and Brett1995], incumbency [Ivany Reference Ivany1999], trophic/guild structure [Roopnarine and Angielczyk Reference Roopnarine, Angielczyk, Eldredge, Pievani, Serrelli and Tëmkin2016]). These ideas are as compelling and interesting as they are difficult to address. They also illustrate an intellectual parting of the ways for two the architects of punctuated equilibria, one of whom sees the ecosystem as a crucial component of evolution (Eldredge et al. Reference Eldredge, Thompson, Brakefield, Gavrilets, Jablonski, Jackson, Lenski, Lieberman, McPeek and Miller2005, Reference Eldredge, Pievani, Serrelli and Tëmkin2016) and one of whom rarely saw the value of ecology in the macroevolutionary process (e.g., Gould Reference Gould1985; see Allmon et al. Reference Allmon, Morris, Ivany, Allmon, Kelley and Ross2009).
Synthesis and Implications for Species Evolution
During both minor and major bioevents, turnovers led not only to extinction, but also to speciation. Large-scale faunal migration and range restriction facilitate the formation of local isolates, and presumably population bottlenecks as well, offering a crucible for evolutionary change and speciation during times of pronounced environmental change, as predicted in the sloshing bucket model of Eldredge (Reference Eldredge, Crutchfield and Schuster2003). When subsequent climate change returns regions to more favorable habitat, old lineages with new incipient species and genera return via dispersal, particularly during times of strong transgression (as in the end-Hirnantian and all Devonian examples), and repopulate areas now vacated by members of the prior EESU fauna.
Elimination of taxa from an earlier fauna provides opportunities for (re)expansion of the next. In this sense, the fluctuating conditions associated with EESU boundaries might serve as a pump to facilitate isolation and rapid evolution and to allow for dispersal of taxa “waiting in the wings” immediately following decimation of earlier widespread organisms. To the degree that climate is the main variable influencing change, the alternation is between the taxa of warm- and cool-adapted faunas. Equally important is that once these widespread organisms and their communities are established, most may show relative stasis in morphology and ecology for their duration.
These and earlier observations in the mid-Paleozoic Appalachian Basin and beyond together suggest the following statements, each of which requires further investigation: Much of the fossil record is characterized by prolonged intervals of relative taxonomic and ecological stability termed “ecological–evolutionary subunits,” or EESUs (Brett and Baird Reference Brett, Baird, Erwin and Anstey1995; Brett et al. Reference Brett, Ivany, Bartholomew, DeSantis and Baird2009). Like the EEUs of Boucot (Reference Boucot1990a) and Sheehan (Reference Sheehan1996), but of a smaller magnitude, these are time intervals bounded by abrupt and largely global bioevents, and do not equate simply to the local/regional faunas that are contained within them. EESU faunas can characterize the broad extents of biogeographic provinces with high degrees of internal similarity. Little substantive taxonomic change may occur from the bottom to the top of the EESU. Few successful invasions occur during the duration of an EESU, and those that do can often be linked to minor environmental shifts that permit dispersion of planktonic larvae of one or a few species into a basin.
The times of so-called coordinated stasis are punctuated by comparatively brief intervals of volatility—extirpation and extinction, coordinated migrations and speciation (Brett et al. Reference Brett, Zambito, McLaughlin and Emsbo2020). Turnovers may be associated with large or exceptionally rapid changes in temperature, the carbon cycle, sea level, and/or widespread hypoxia. In some cases, faunas and even their component biofacies are evidently able to migrate relatively intact in response to the changing climate, existing in another area until suitable conditions return to the basin. Environmental disruption and rapid migration, and the spatially fragmented edges between faunas, offer opportunities for isolation and allopatric speciation, while extinction knocks out some incumbents, opening niche space and providing new evolutionary opportunities. Settings most prone to exhibiting such patterns may be those where evident migratory pathways exist and during times characterized by a measure of bimodality in the magnitude of environmental changes. The degree to which these statements apply more generally is currently unclear, but specifically similar phenomena are reported elsewhere. Intervals encompassing comparatively little net change in taxonomic and/or ecologic properties of faunas relative to change occurring at interval boundaries are frequently described in the literature at a range of scales (Roopnarine and Banker Reference Roopnarine and Banker2021; Muscente et al. Reference Muscente, Martindale, Prabhu, Ma, Fox, Hazen and Knoll2022).
It is logical to suppose that during the time of dominance of a particular fauna, many of the previous occupants of a local basin could be found in an adjacent region. In this sense, at least some regional EE subunit boundaries can be seen to mark abrupt shifts in the positions of environmentally controlled, climatic “soft” boundaries between biogeographic provinces, suggesting a form of large-scale Waltherian tracking of faunas and biofacies. Evidence suggests that these shifts were largely triggered by changes in climate, so effects are potentially global and effectively synchronous. To the degree that climate change (or the response to it; Botero et al. Reference Botero, Weissing, Wright and Rubenstein2015) was abrupt, major turnovers in different biogeographic areas (and the intervals of stability they subtend) should be approximately coeval, hence our suggestion that EESUs are best defined as time intervals rather than the stable faunas within, which will differ from one biogeographic region to another. Biogeographic shifts are at least partly involved in EE subunit boundary events. In many cases, the new fauna in a particular region may also show affinities to those characterizing the preceding stable fauna (EESU) in adjacent regions, with evidence for displacement associated with environmental shifts.
In the cases summarized herein, there is also evidence for return or partial return of earlier biotas into basins they once occupied, in association with a return of appropriate environmental conditions. These observations indicate that taxa persisted in peripheral regions and were able to stage a return.
A fossil record dominated by the empirical pattern of taxonomic/morphological stasis in EESUs is consistent with the postulates of punctuated equilibria. The evolutionary significance of stasis in individual lineages has been argued for some time, using a logic as follows: In the fossil record of marine benthos at least, most taxa and taxonomic traits exhibit net stasis or at most random walks over their durations; cumulative directional change is rare (Eldredge and Gould Reference Eldredge, Gould and Schopf1972; Hunt Reference Hunt2007; Hopkins and Lidgard Reference Hopkins and Lidgard2012; Hunt et al. Reference Hunt, Hopkins and Lidgard2015). Morphospecies, as recognized by taxonomists, correspond to real, genetically distinct groups in the best-constrained recent cases (Jackson and Cheetham Reference Jackson and Cheetham1990, Reference Jackson and Cheetham1994, Reference Jackson and Cheetham1999), and hence morphospecies in the deep fossil record are by and large likely to reflect real genetic species as well (Jackson and Cheetham Reference Jackson and Cheetham1999; Eldredge et al. Reference Eldredge, Pievani, Serrelli and Tëmkin2016). Net stasis in morphology, and hence genetic makeup, over the duration of most species therefore requires that most evolutionary change of any consequence (i.e., producing novel morphologies) must be occurring at the time of speciation (Jackson and Cheetham Reference Jackson and Cheetham1994, Reference Jackson and Cheetham1999), consistent with the prevalence of punctuated equilibria over phyletic gradualism. A fossil record characterized by coordinated taxonomic stasis amplifies claims based on individual species case studies—stasis is the norm, not only within individual lineages, but across suites of coexisting lineages. Suites of stable lineages are deployed across large swaths of provinces, and the boundaries between them are comparatively distinct in space and time. If most lineages exhibit net stasis across the bulk of their spatiotemporal distributions, directional phyletic change must therefore be negligible, as there are few places and times left when it could be happening.
The prevalence of coordinated patterns in the fossil record, if ultimately supported, further emphasizes the concentration of much evolutionary (and ecological) turnover taking place (1) within the same relatively brief and synchronous windows of time for co-occurring taxa and (2) necessarily at the margins of large depositional systems otherwise characterized by persistent suites of stable taxa deployed over broad biogeographic regions. If EESUs are shown to be widespread and characteristic of more than just an individual basin at a particular time interval, as suggested herein, then the phenomenon of stasis is also widespread, further limiting the places and times during which evolution can happen. Turnovers that are coordinated across a fauna virtually require an extrinsic driver, a short-lived climatic or oceanographic shift or perturbation that affords opportunities for immigration, extinction, and, as in the turnover pulse hypothesis of Vrba (Reference Vrba1985), geographic isolation that drives speciation. The degree of turnover is likely to reflect the magnitude and extent of the environmental change underlying it (Eldredge Reference Eldredge, Crutchfield and Schuster2003). Understanding more about the circumstances and geographic extent of turnovers that separate EESUs, and how they scale in comparison to disturbance within the EESU, will shed light on the drivers of speciation and where it is most likely to happen.
The degree to which speciation happens during the comparatively brief shared intervals between EESUs, rather than within them, likely points to the relative importance of the physical environment in driving evolutionary change. Debate about the relative importance of biotic versus abiotic drivers of evolutionary change has gone on at least since Darwin (Reference Darwin1859; see the review in Voje et al. Reference Voje, Holen, Liow and Stenseth2015). While acknowledging that “a plant on the edge of the desert is said to struggle for life against the drought” (Reference Darwin1859: p. 62), Darwin preferred the primacy of biotic interactions to drive gradual (and often ultimately progressive) phyletic change via natural selection. To be sure, there is evidence that biotic innovations, perhaps acting in concert with abiotic changes, have also revolutionized the biosphere, for example, the pre-Cambrian/Cambrian transition, the Ordovician diversification event, and the mid-Mesozoic predator revolution. But these were especially important during times of vacant ecological niche space, and even these changes may have been stepwise, with periods of abrupt intensification separating intervals in which ecological interactions stabilized as suggested by a pattern of stable blocks even within the Cambrian and Ordovician radiations and extinctions.
The proposals of punctuated equilibria (Eldredge and Gould Reference Eldredge, Gould and Schopf1972) and then mass extinction (Raup and Sepkoski Reference Raup and Sepkoski1982) questioned the influence of biotic interactions on the major trajectory of life’s evolution (Gould Reference Gould1985), but less so on species-level change itself. If most speciation happens during coordinated turnovers, however, then the physical environment—the Court Jester (Barnosky Reference Barnosky2001)—prevails. Volatile times may have allowed for the large-scale changes that punctuate and dominate the history of life.
Acknowledgments
We thank J. Handley for helping us to develop rigorous numerical approaches with which to quantitatively describe patterns of coordinated stasis; A. Miller for pushing us, over many years, to think about these patterns in faunal data and what their significance might be; and W. Allmon for much support and thoughtful cajoling. Many current and former students have helped collect, compile, and analyze field-based data, including especially A. Bartholomew, J. Bonelli, M. DeSantis, P. McLaughlin, J. Sessa, C. Ver Straeten, and P. Wall. We thank N. Eldredge and S. Gould for inspiration and encouragement. We also thank Patricia Kelley, James Crampton, and the entire editorial team at Paleobiology for their valuable feedback and assistance with the editorial process. Finally, we greatly appreciate the thoughtful reviews and many helpful suggestions for improvement of this paper by reviewers M. Patzkowsky and P. Roopnarine. Grant support comes from NSF EAR 921807 to C.E.B. and N. Eldredge.
Competing Interests
The authors declare no competing interests.
Data Availability Statement
Supplementary Appendix A is available from the Zenodo Digital Repository: https://doi.org/10.5281/zenodo.15185174.
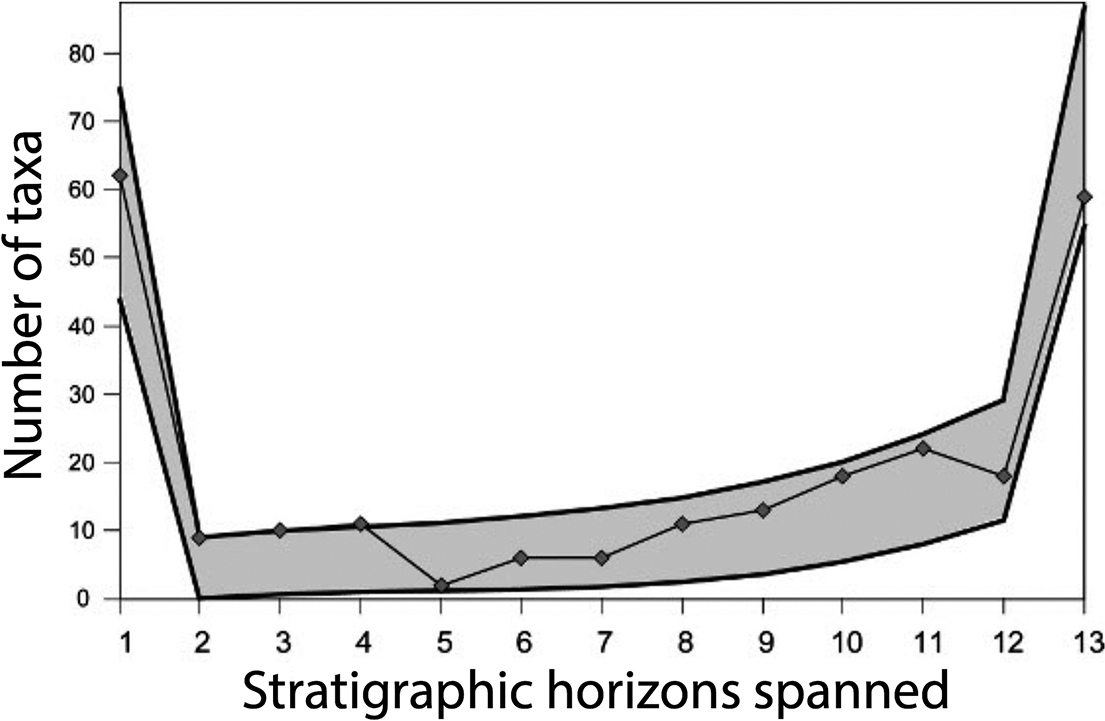
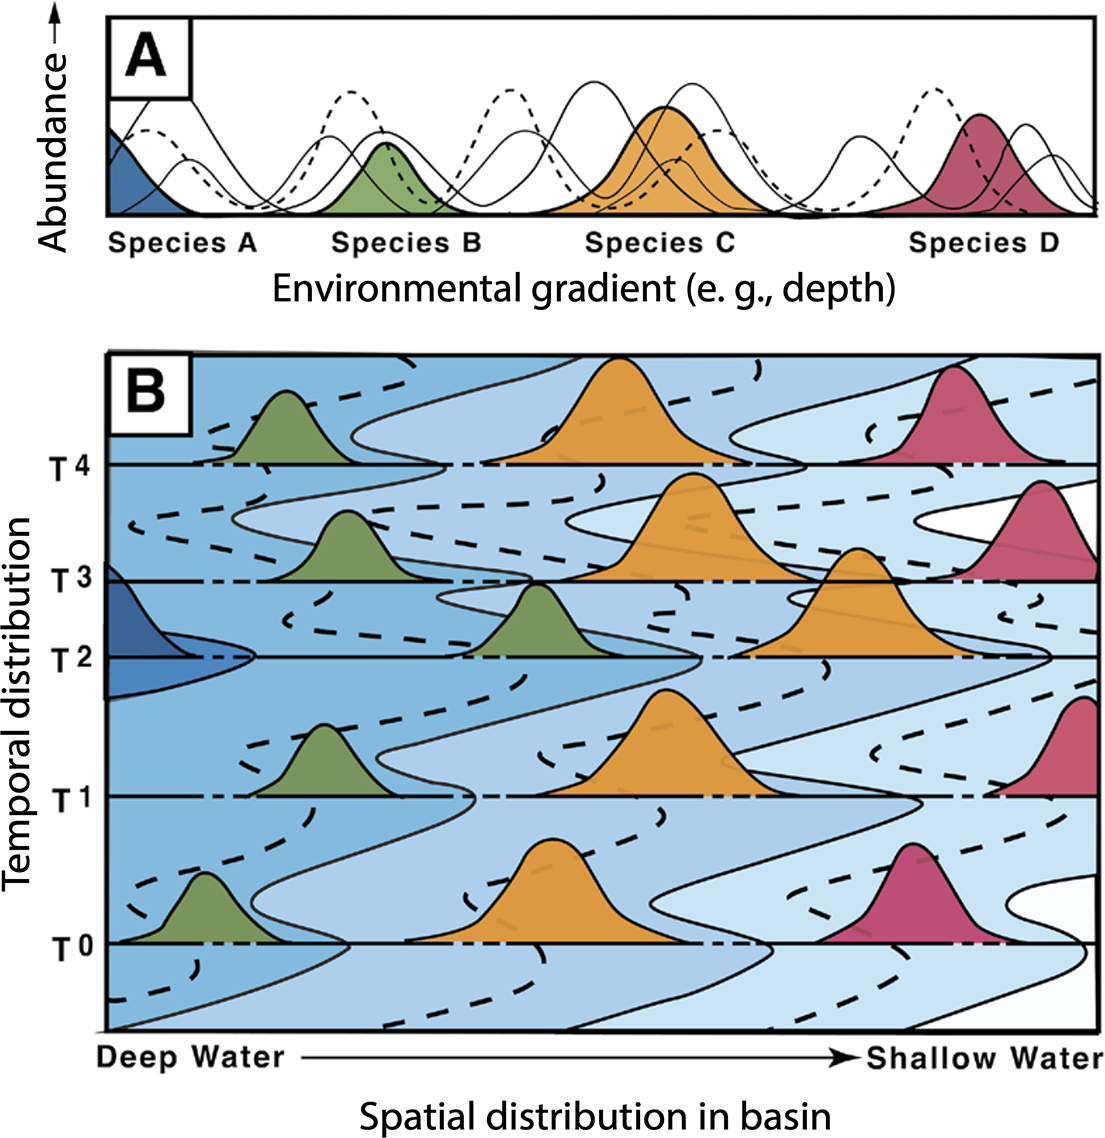
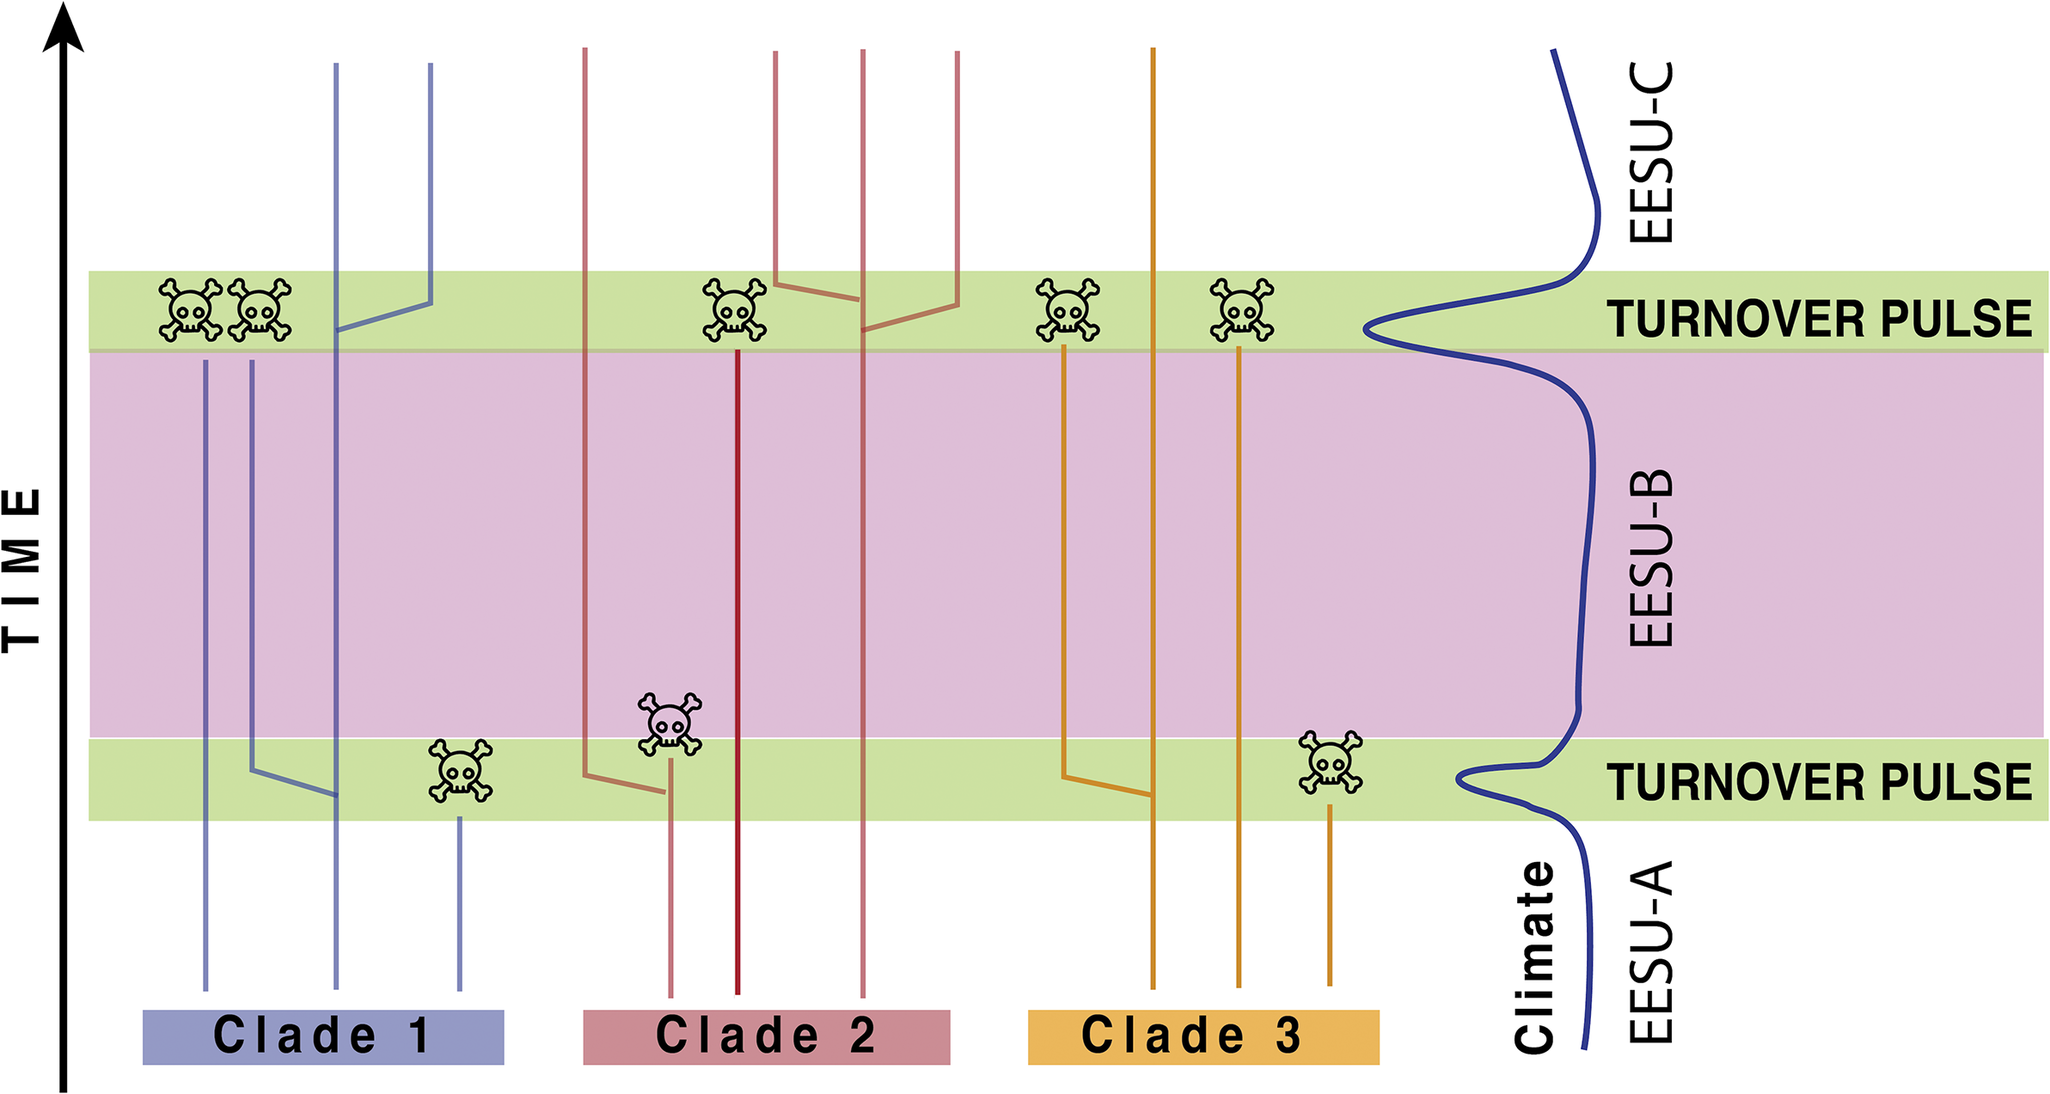
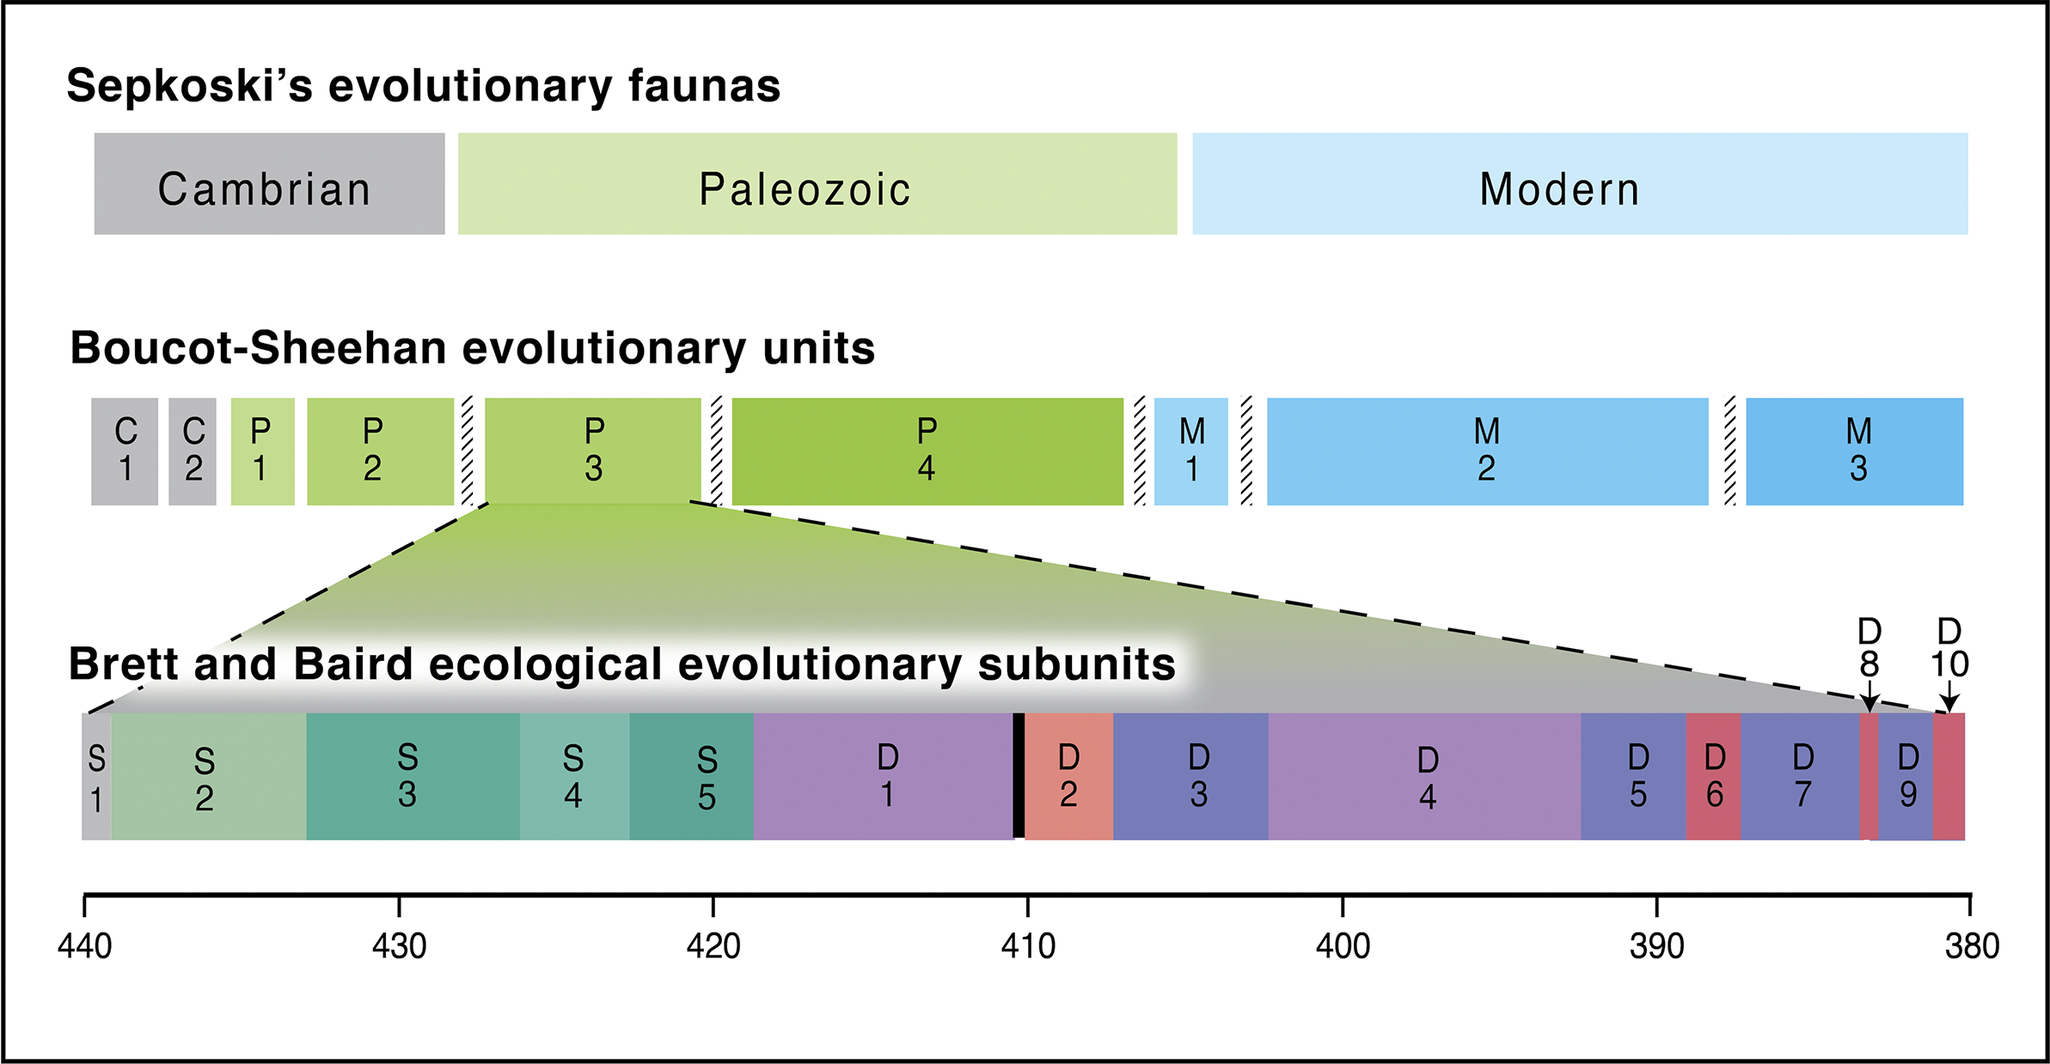
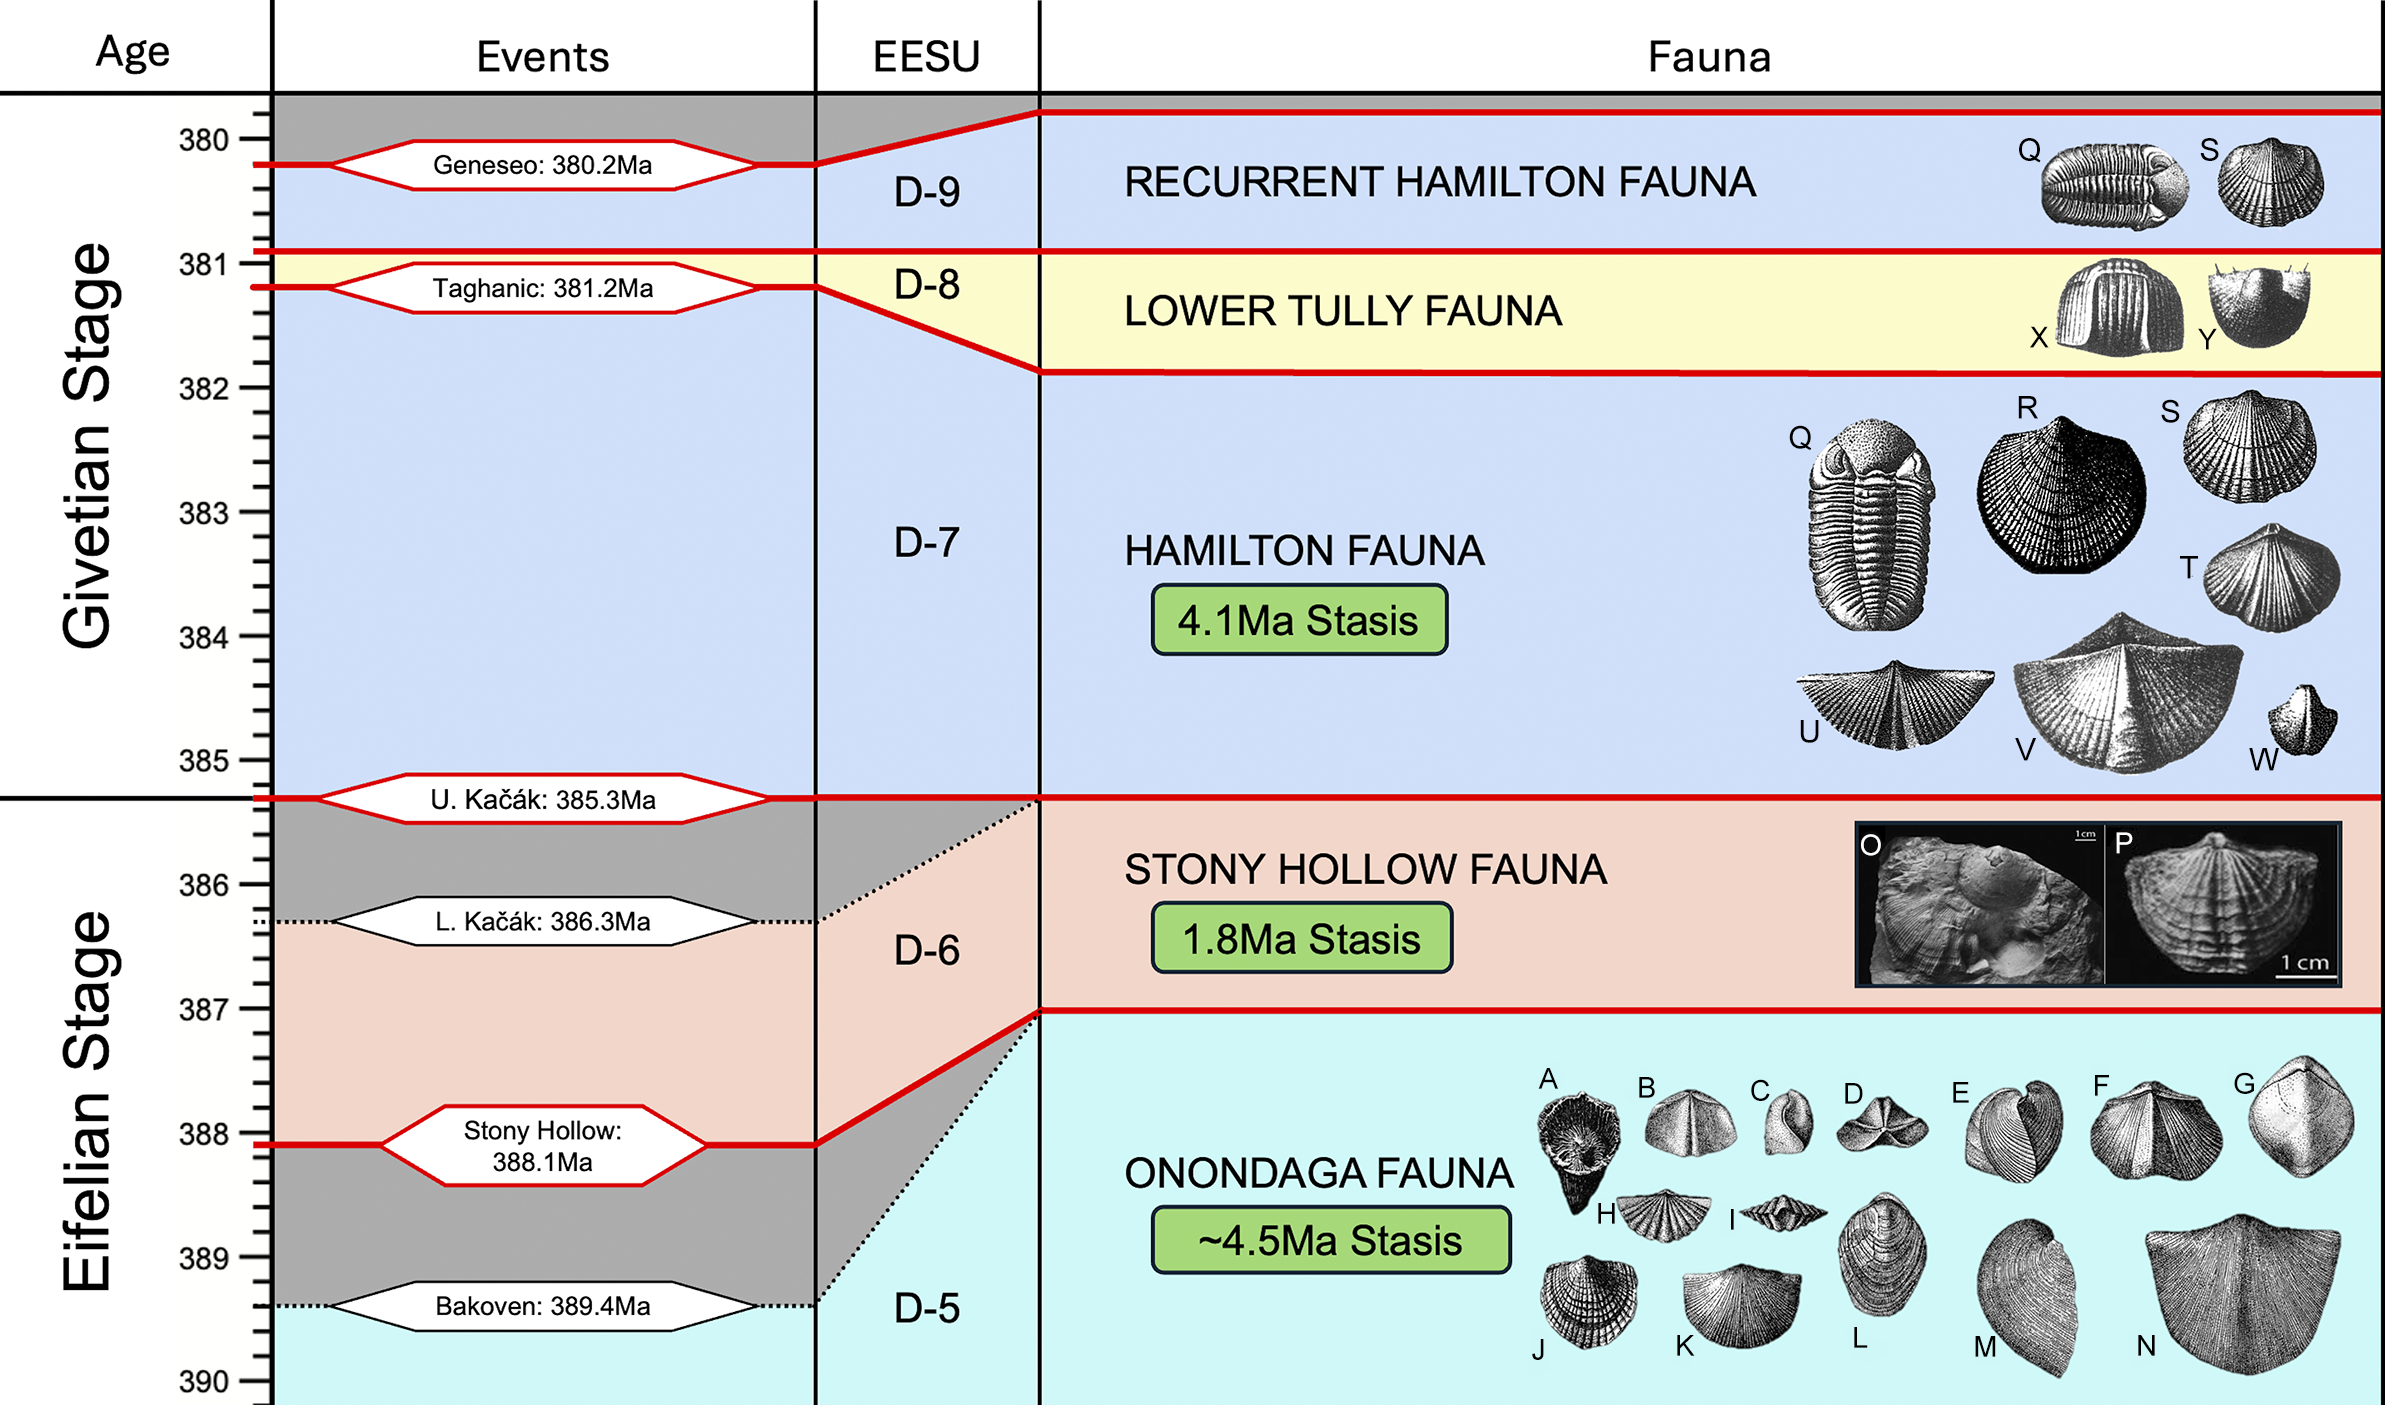
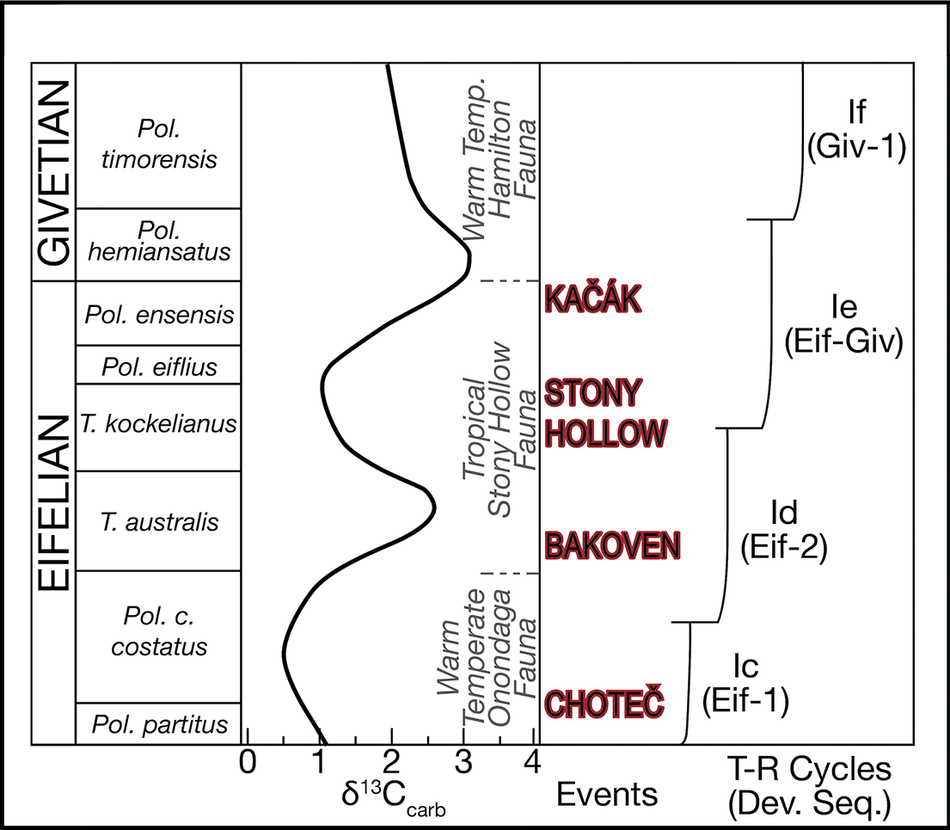
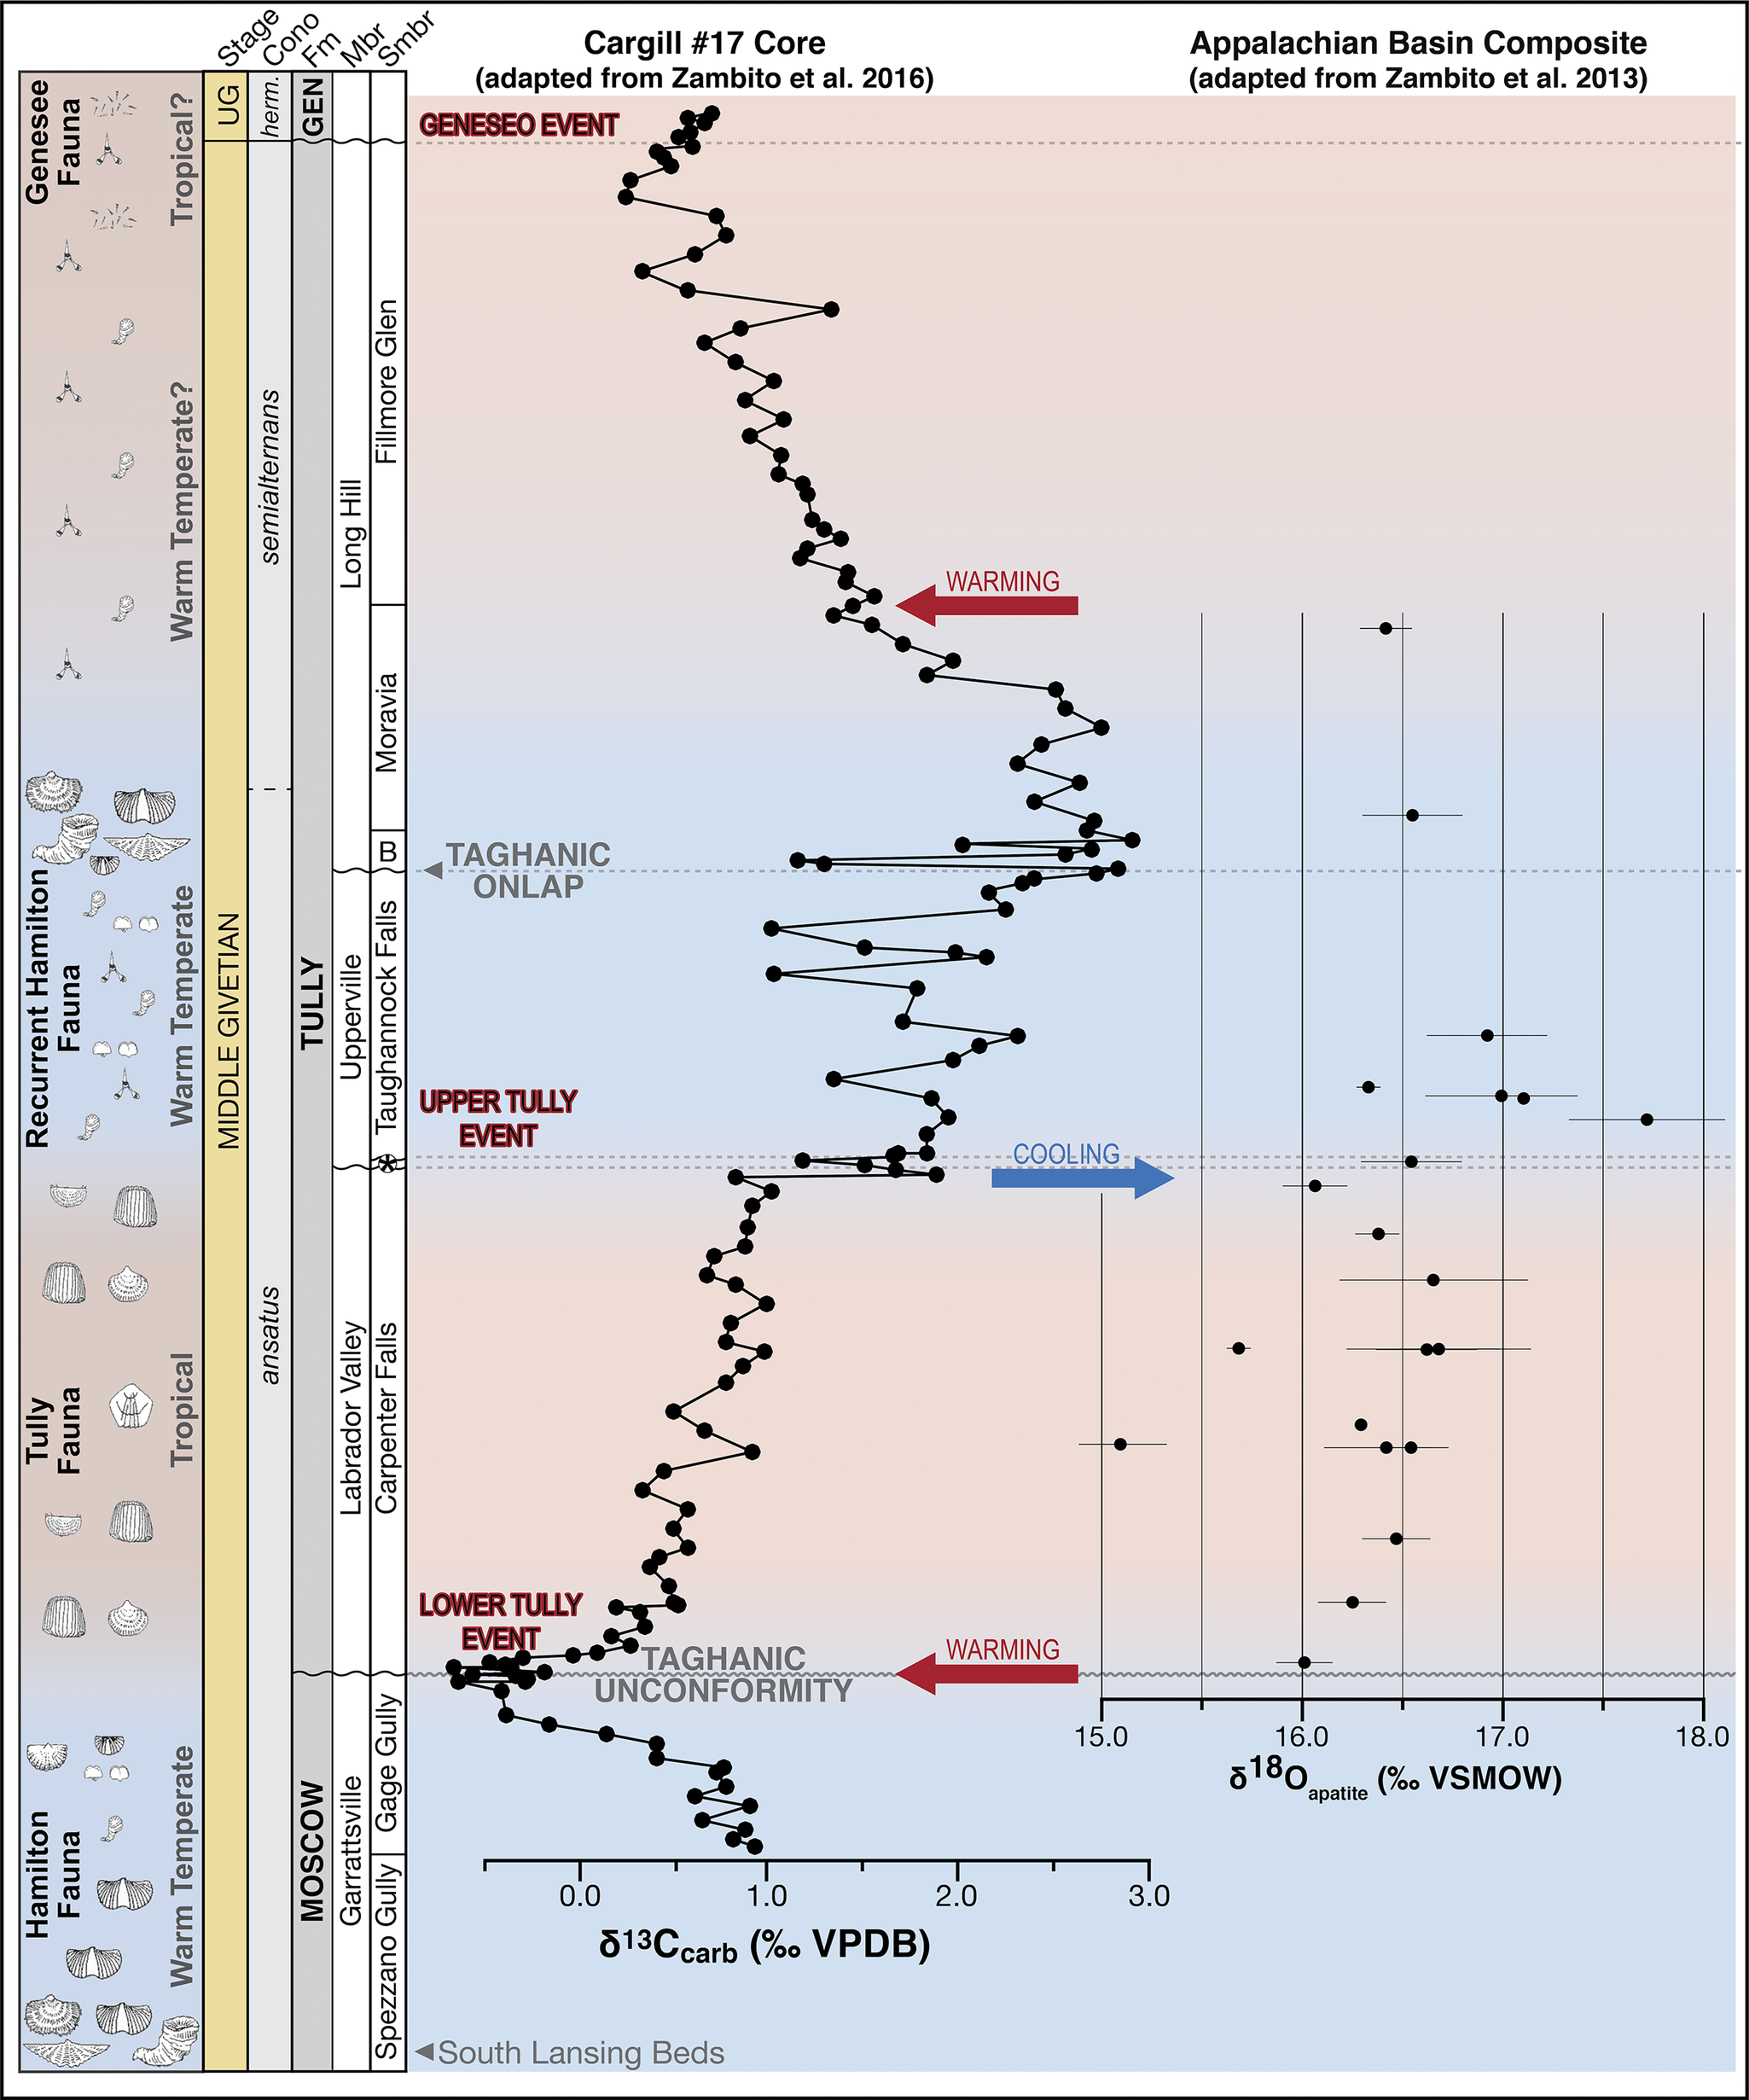
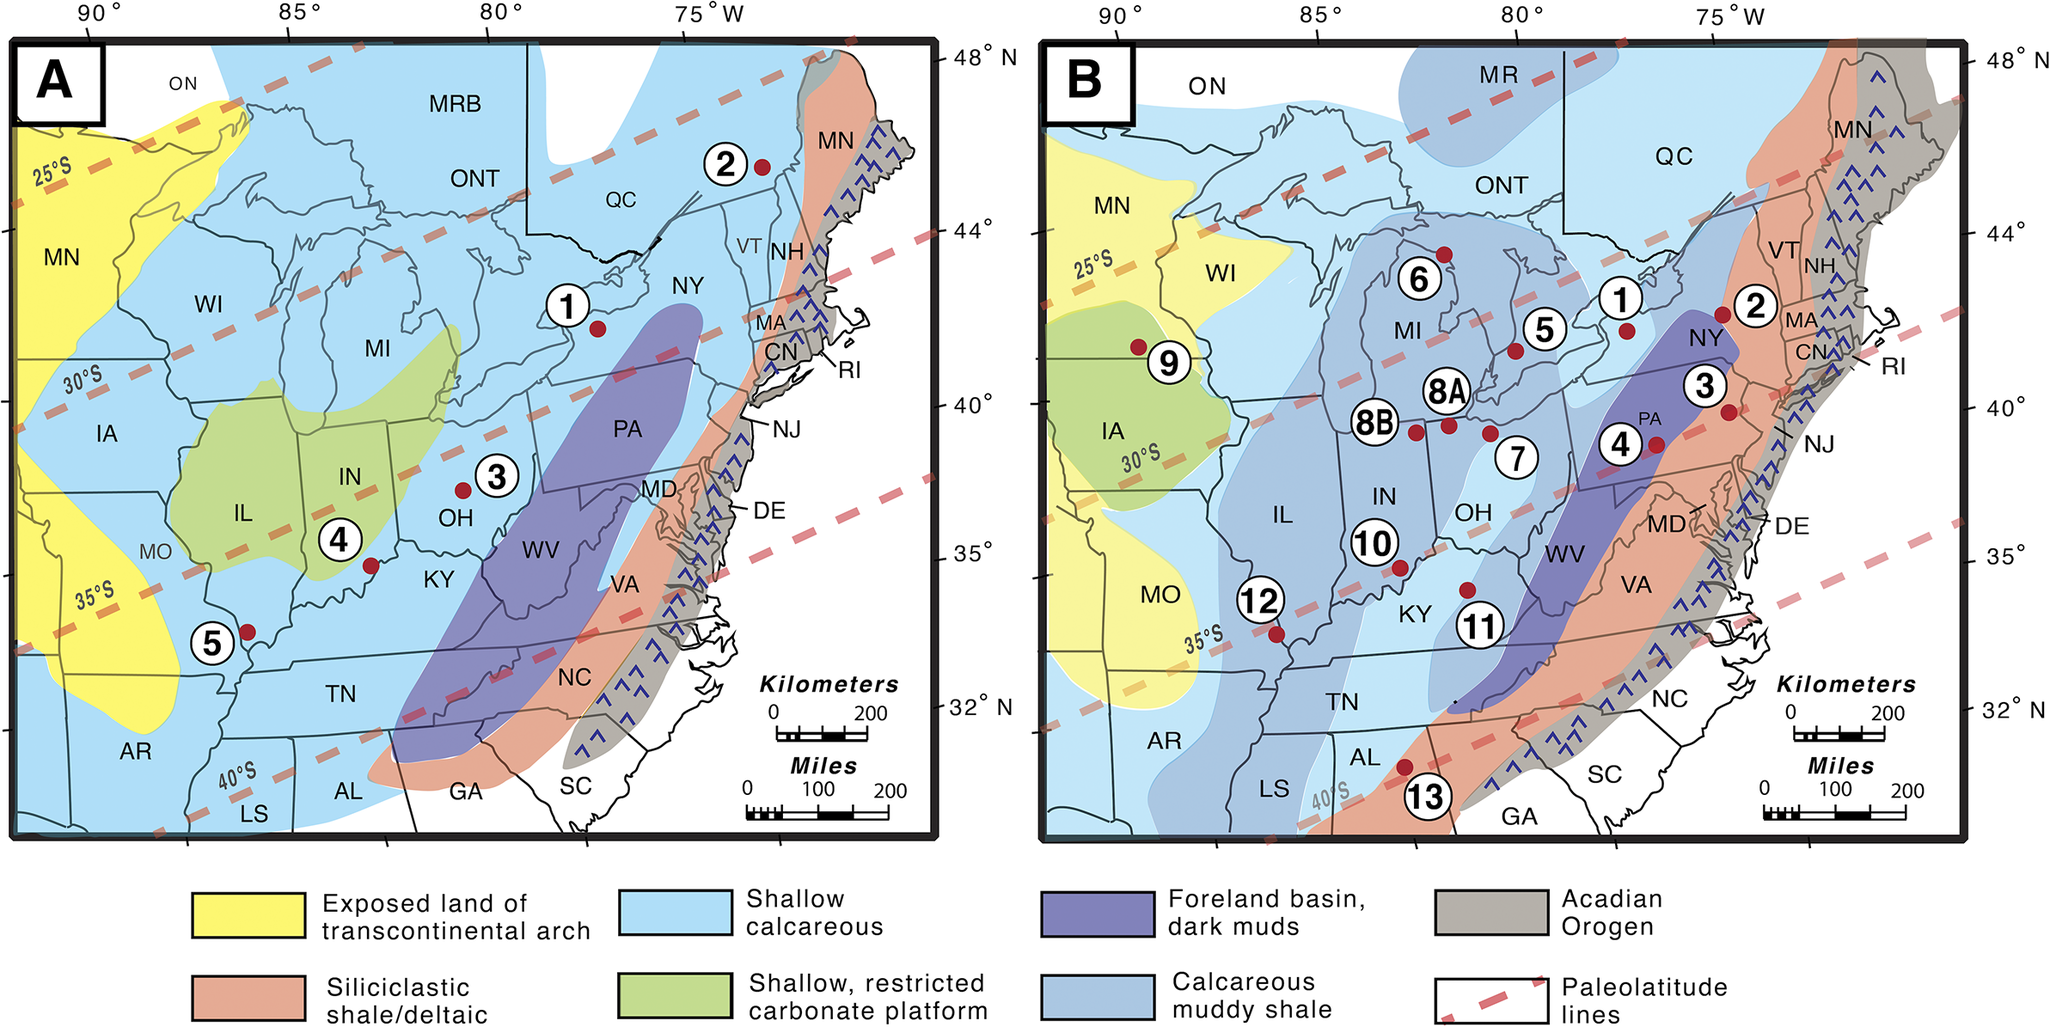
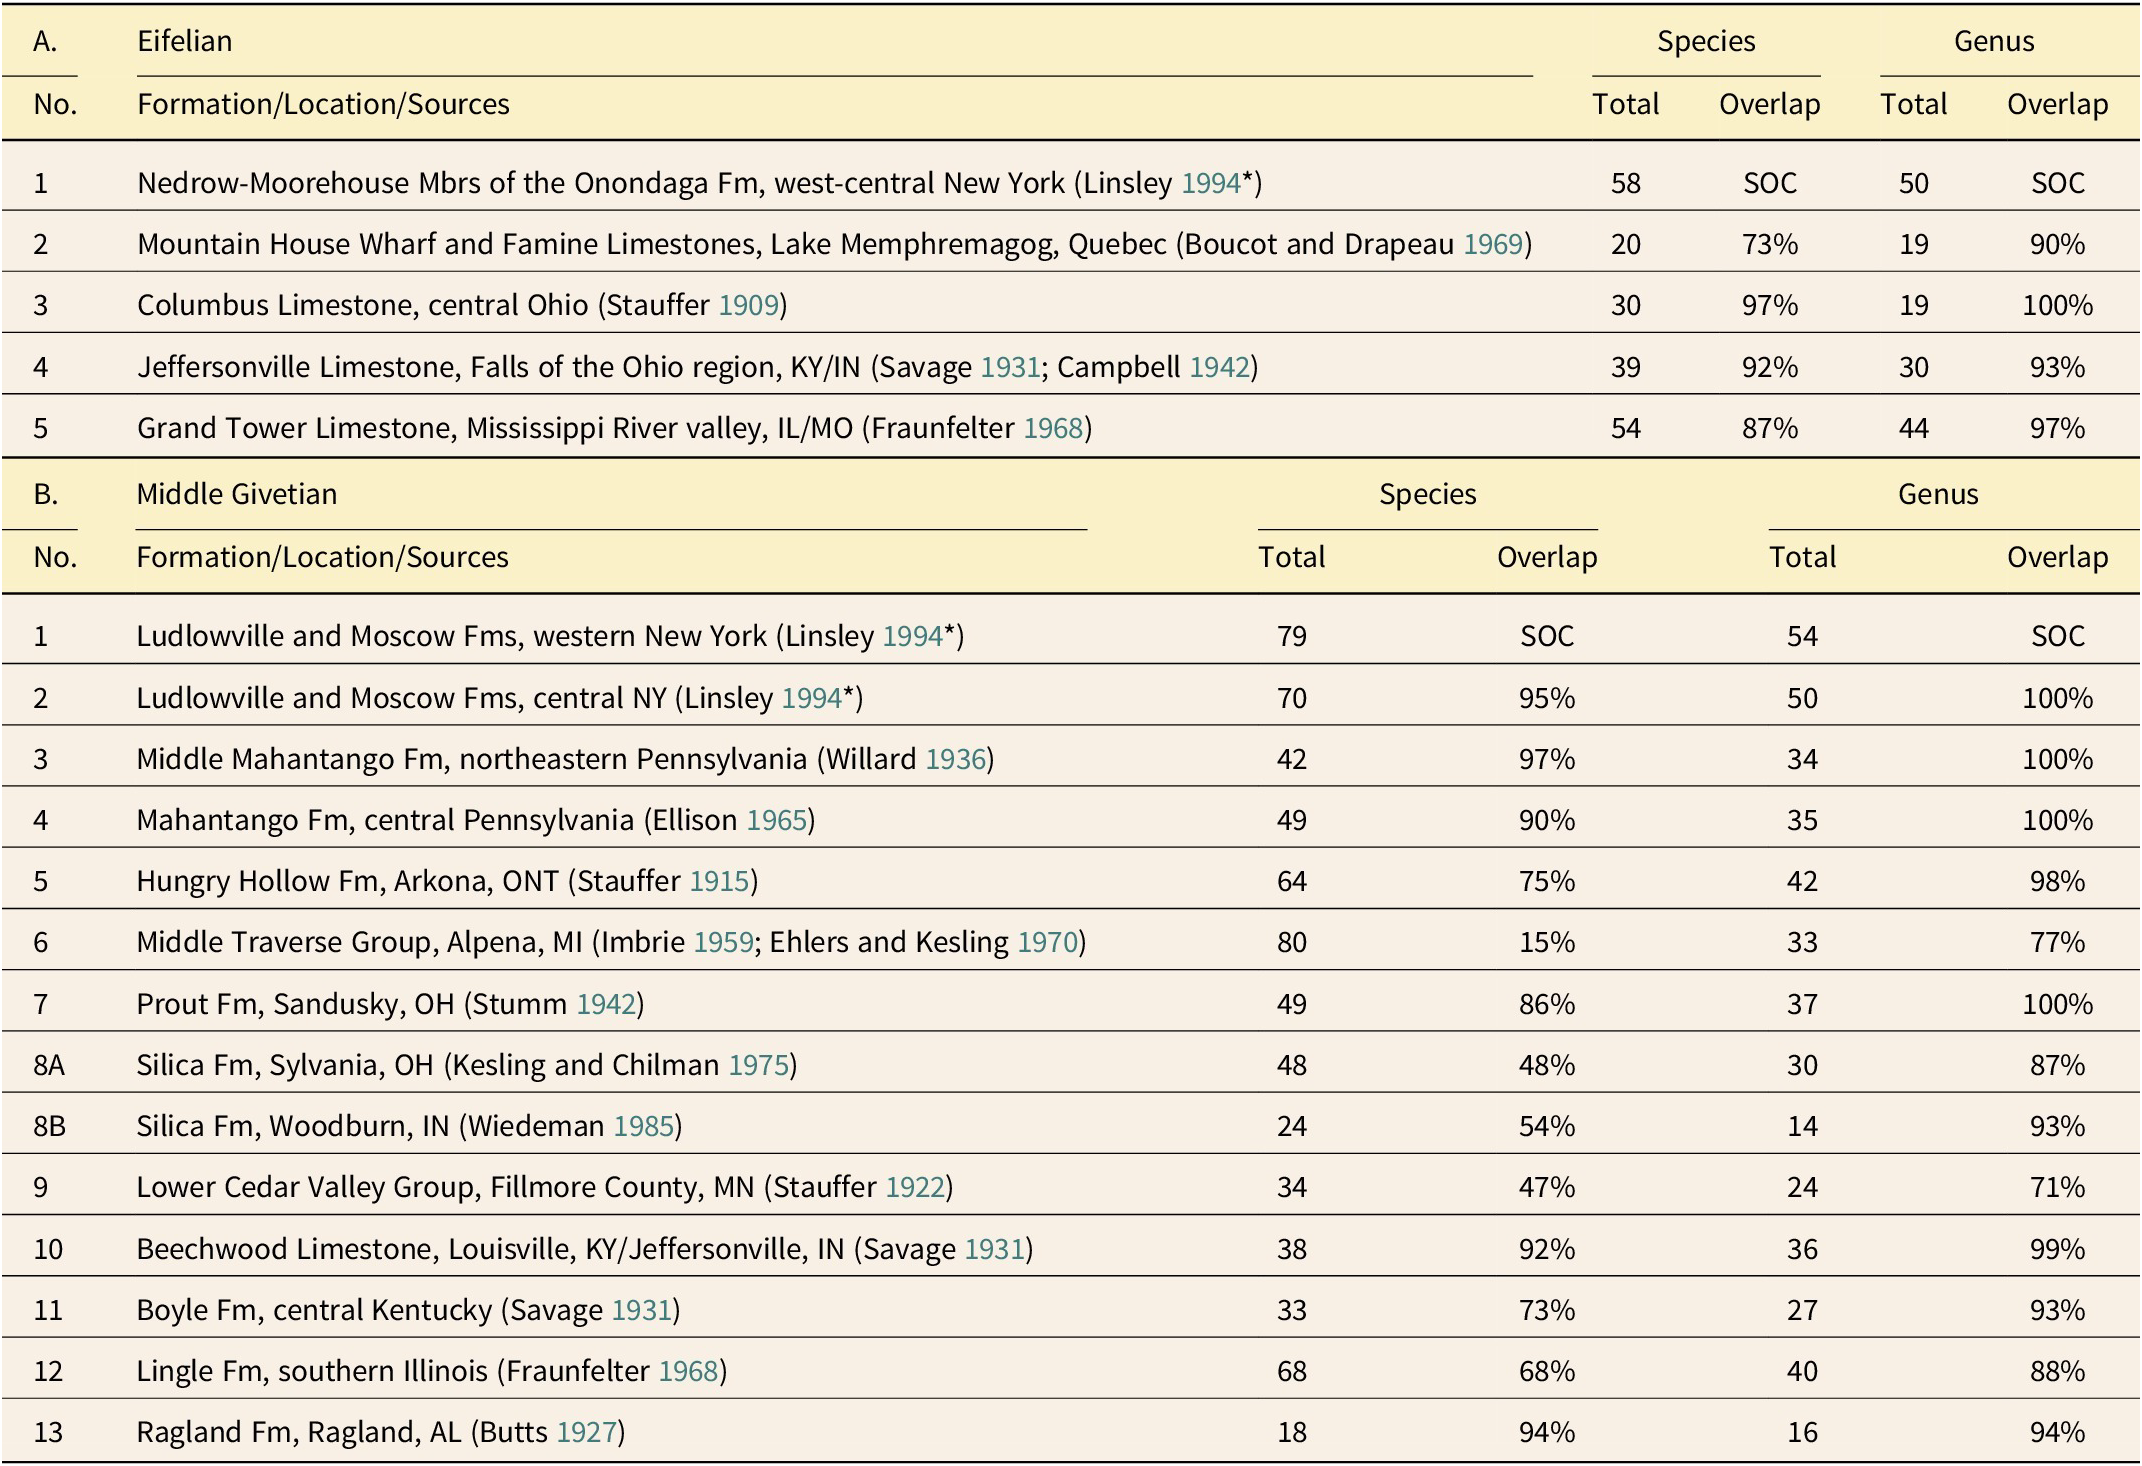
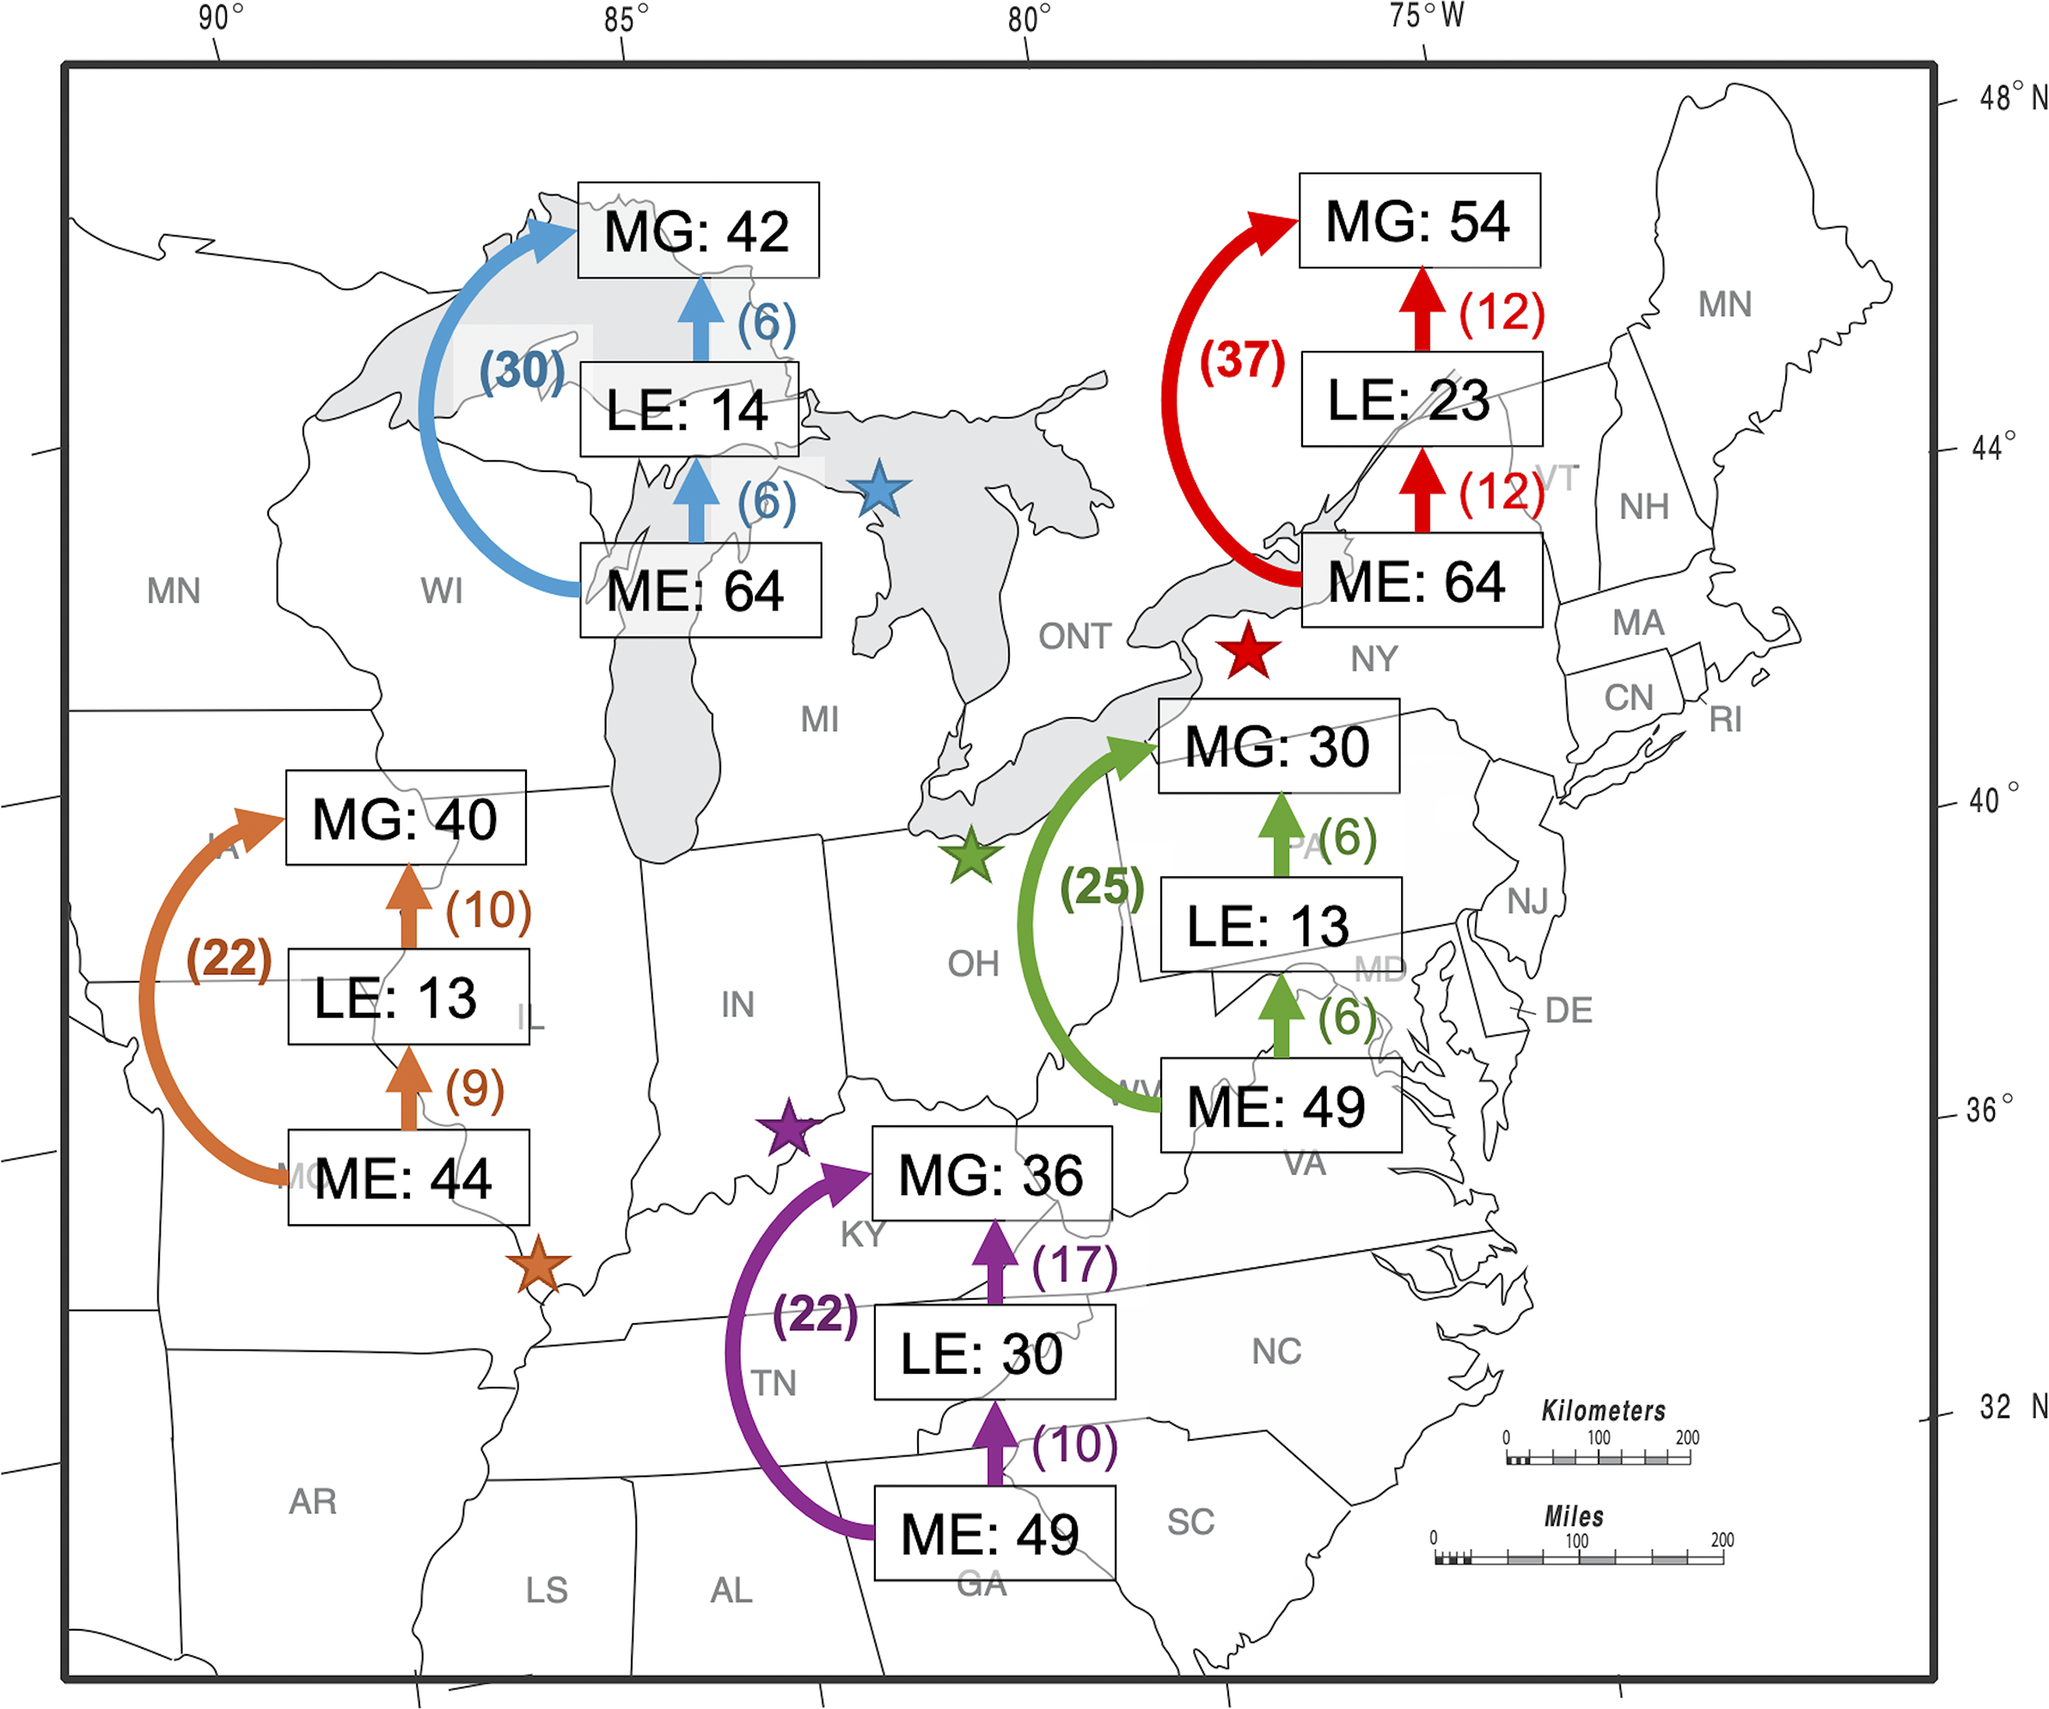
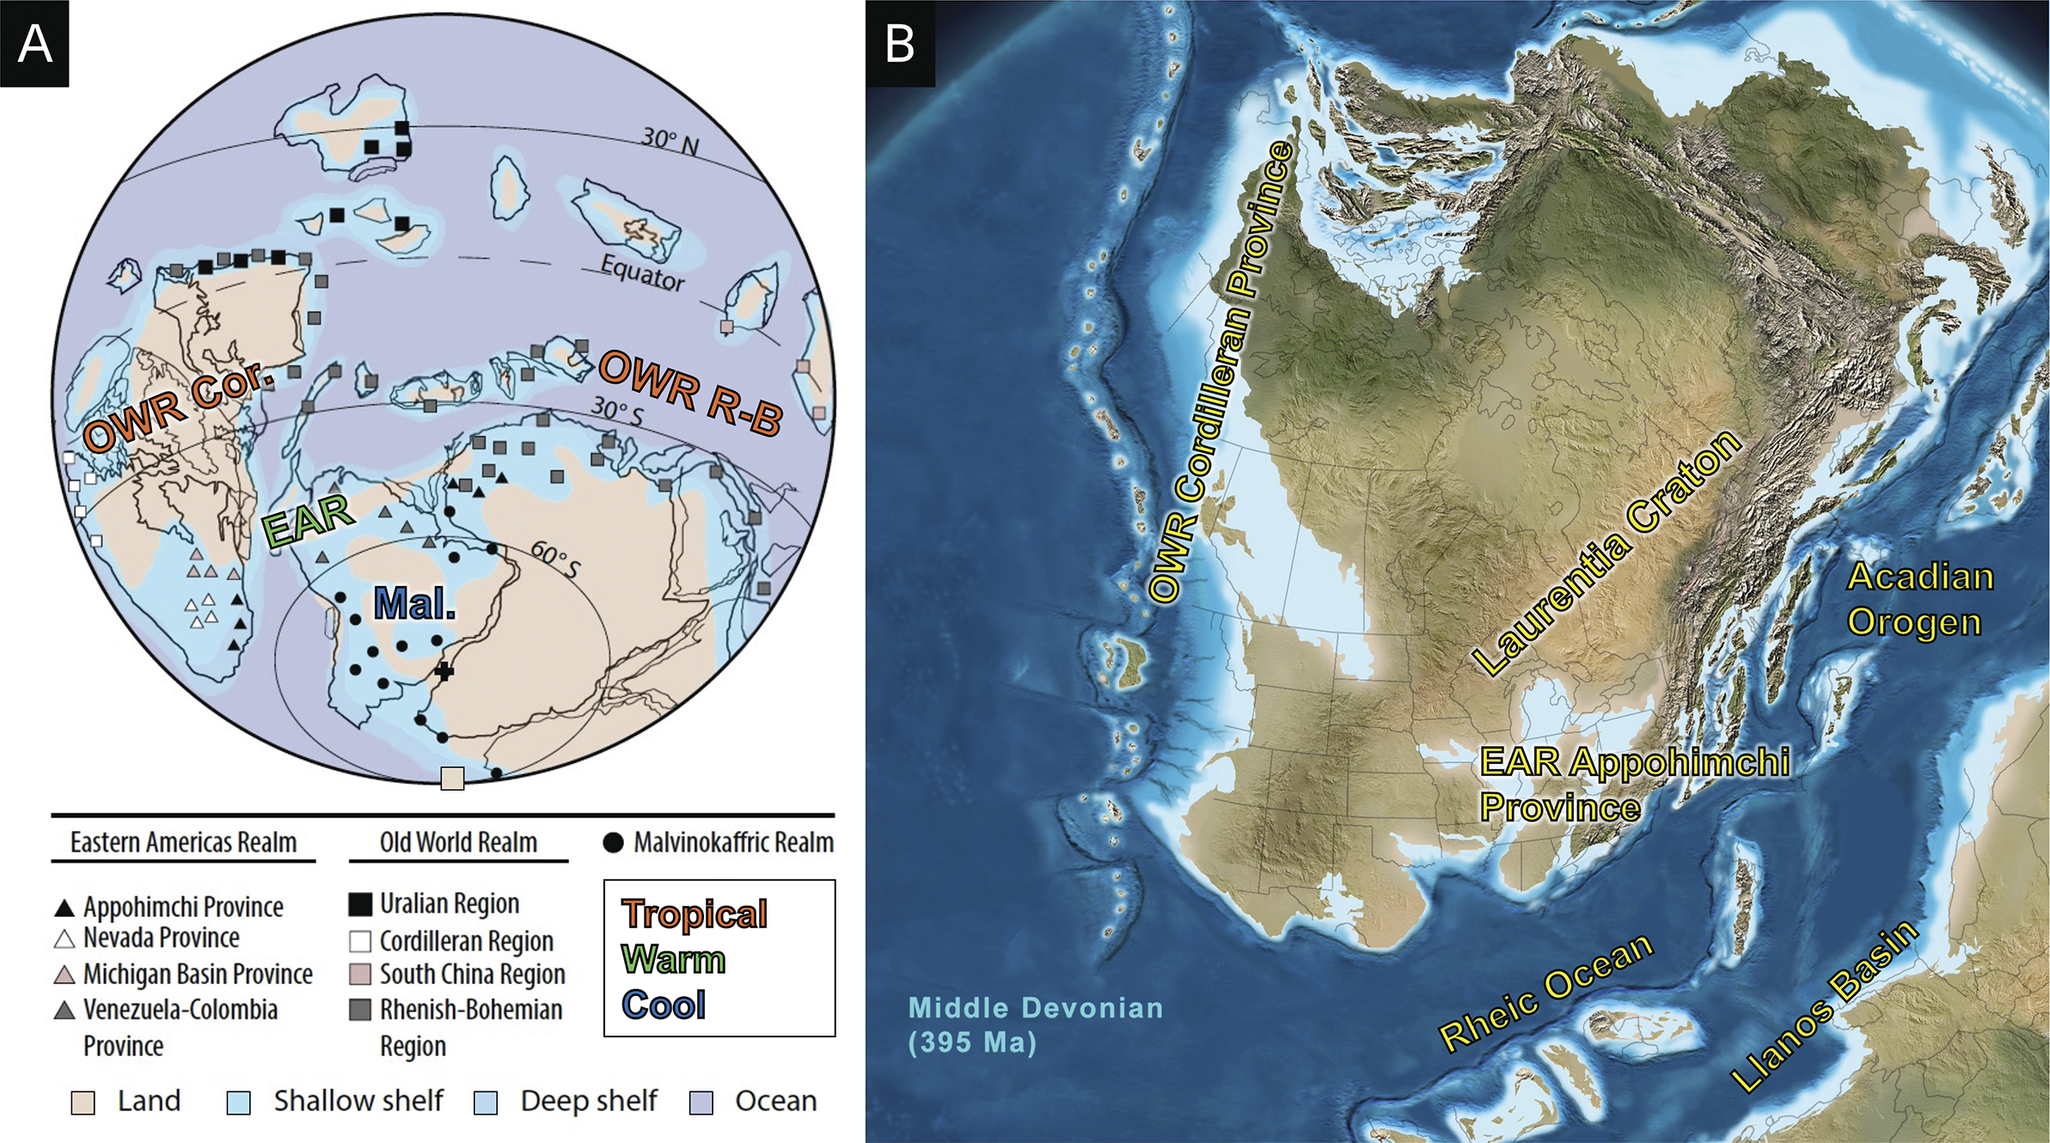
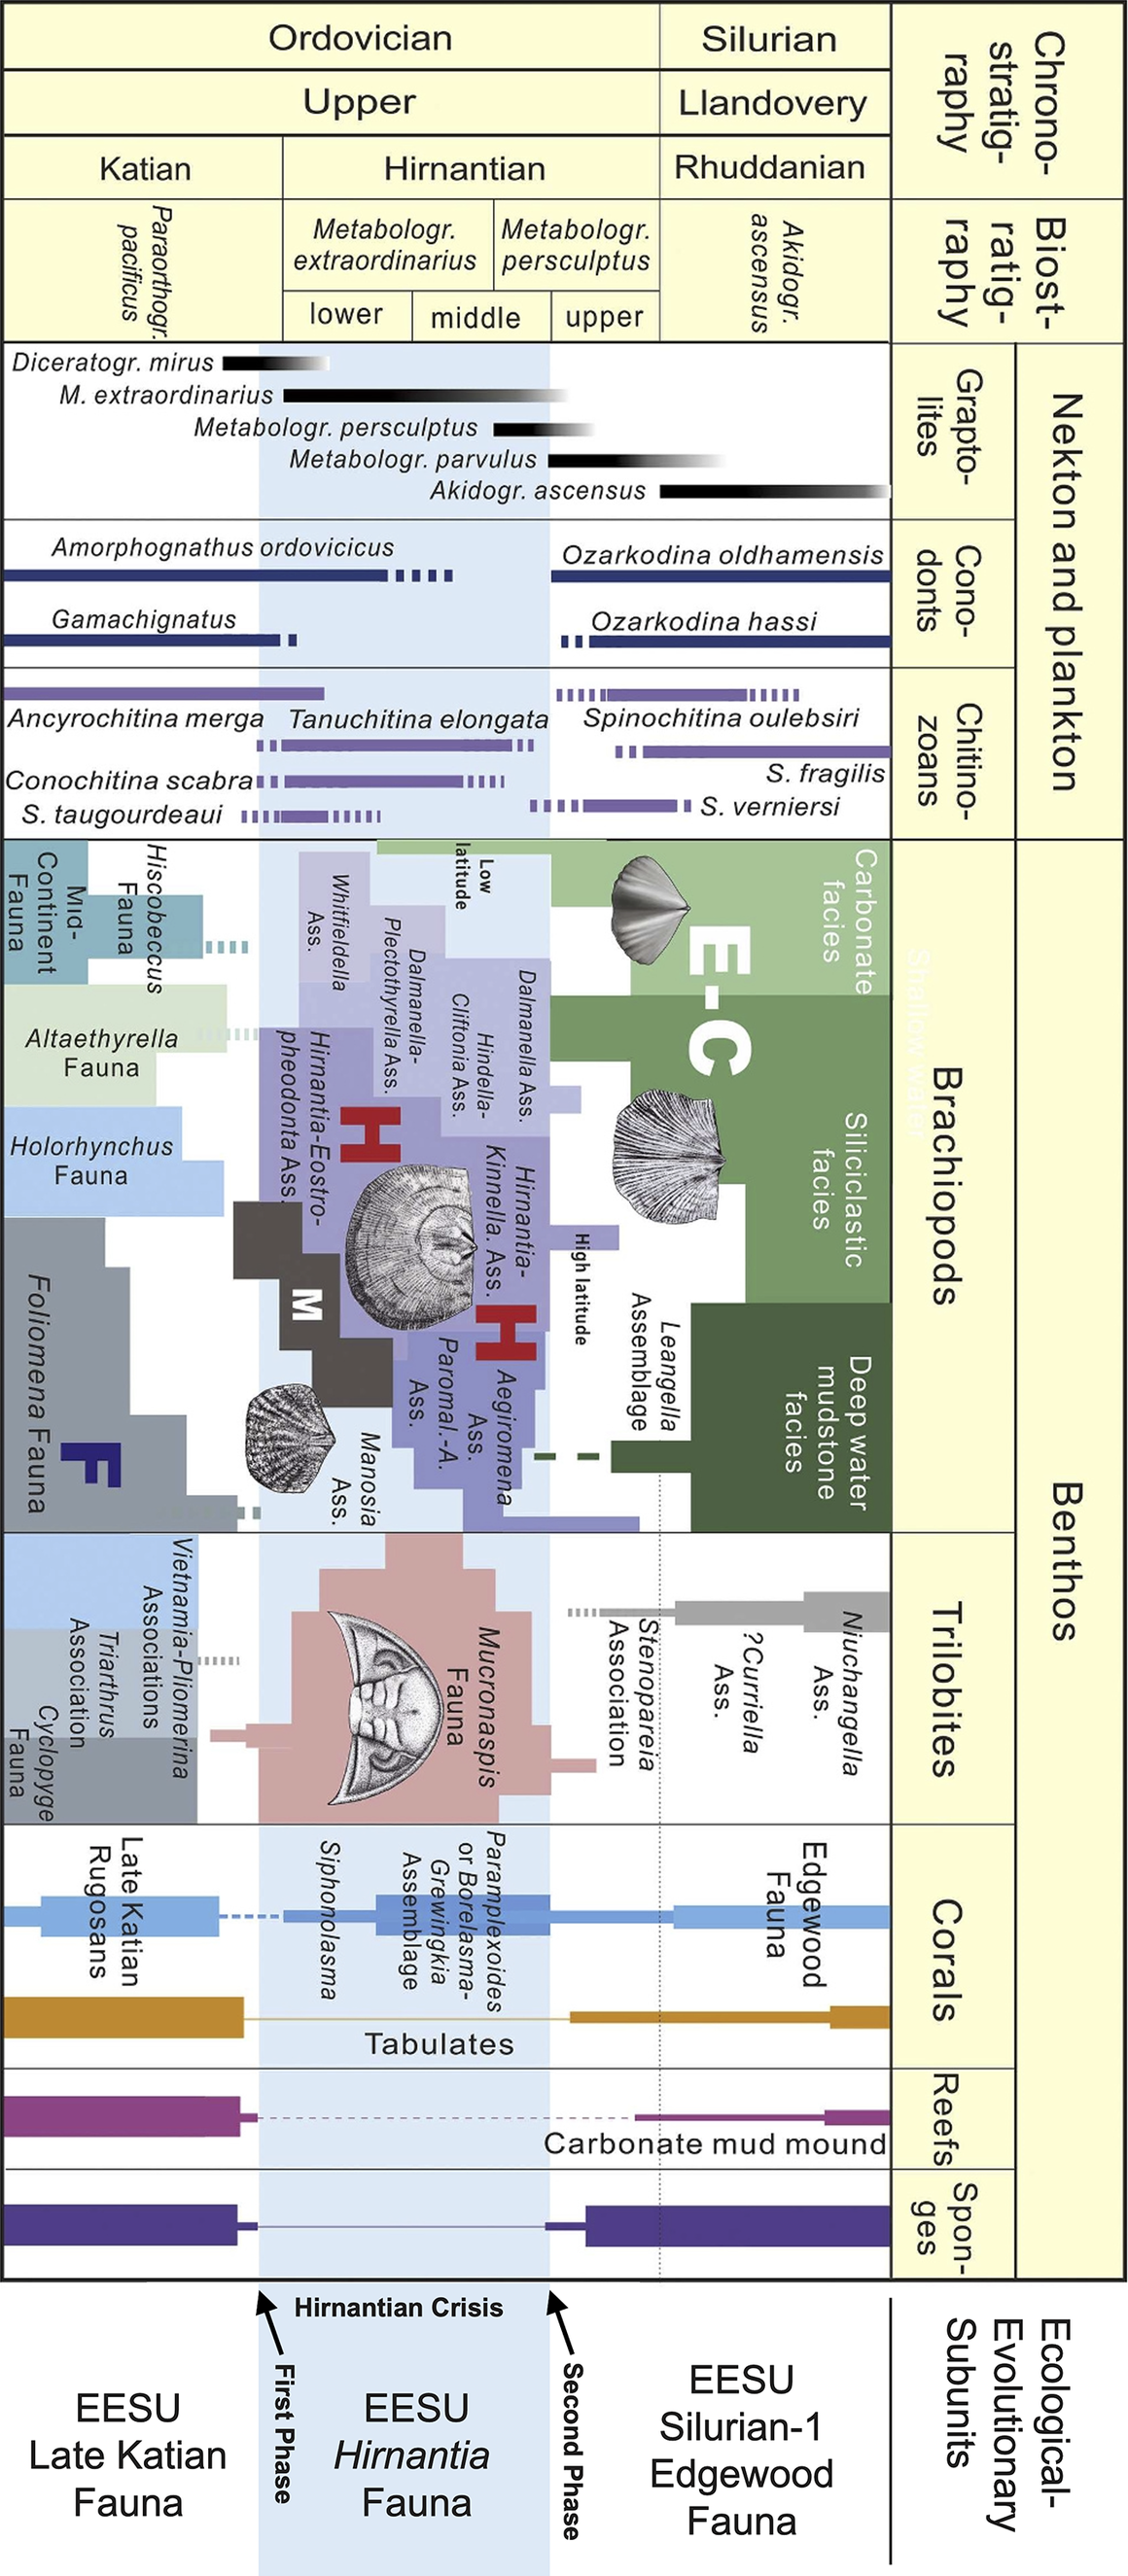

 Open access