


Introduction
Behavioral finance is a field of study that has gained significant importance in recent years as it investigates the sophisticated relationship between human behavior and financial markets. While traditional finance theories assume that market participants always act rationally (Kamoune and Ibenrissoul, Reference Kamoune and Ibenrissoul2022), behavioral finance refers to emotions, cognitive biases and psychological factors which often play a substantial role in shaping financial decisions and market outcomes (Shahani and Ahmed, Reference Shahani and Ahmed2022). The understanding of human behavior in the context of the stock market is crucial because it sheds light on why markets can sometimes exhibit extreme volatility, speculative bubbles and unexpected price movements. By examining the psychological aspects of investors, such as fear, greed, overconfidence and herding behavior, behavioral finance offers valuable insights into the factors that drive stock market fluctuations and can help market participants make more informed and resilient investment decisions.
According to traditional finance, specifically the efficient market hypothesis (EMH), financial markets perfectly reflect all available information and asset prices always reflect their intrinsic values. Market participants act rationally and make decisions based on all available information (Spulbar et al., Reference Spulbar, Birau and Spulbar2021). However, the real-world behavior of financial markets often contradicts this theory because human behavior is often influenced by emotions, cognitive biases and heuristics, which can lead to irrational decision-making and contribute to market inefficiencies (Dhankar, Reference Dhankar2019). Price bubbles, market crashes and the persistent existence of anomalies reveal the impacts of behavioral finance on the financial markets.
Market anomalies are deviations or irregularities in the behavior of financial markets that contradict the predictions and assumptions of traditional finance theories, such as the EMH (Comlekci and Ozer, Reference Comlekci and Ozer2018). Market anomalies can take various forms, including unusual patterns in asset prices, abnormal returns or recurring trends that challenge the concept of market efficiency (Woo et al., Reference Woo, Mai, McAleer and Wong2020). For instance, the momentum effect is where stocks that have performed well in the recent past tend to continue their winning streak (Dhankar and Maheshwari, Reference Dhankar and Maheshwari2016). Another anomaly is the value effect, which challenges the EMH by demonstrating that stocks with lower price-to-earnings ratios can consistently outperform their higher-priced counterparts (Sharma and Kumar, Reference Sharma and Kumar2019). The small-cap effect is where smaller companies frequently outshine their larger counterparts over time, challenging traditional wisdom about stability and efficiency (Latif et al., Reference Latif, Arshad, Fatima and Farooq2011). The post-earnings announcement drift shows that stock prices often continue to move in the direction of earnings news even after it becomes public, contradicting the EMH's assertion of immediate price adjustments (Fink, Reference Fink2021).
Understanding market anomalies is particularly critical when investigating the US stock market, with a specific focus on the S&P 500, for several crucial reasons. Firstly, the S&P 500 is a leading indicator of the US economy and encompasses a diversified array of sectors and industries (Dovolil, Reference Dovolil2016). Secondly, the S&P 500 serves as a cornerstone for many investment portfolios, retirement funds and institutional investments globally. Its movements can directly impact the wealth and financial well-being of millions of investors (Novick et al., Reference Novick, Edkins, Garvey, Madhavan, Matthews and Sethi2017)). Moreover, the S&P 500 acts as a benchmark for evaluating the performance of various asset classes and investment strategies. Investors often use it as a point of reference to measure the success of their investment decisions (Das and Rao, Reference Das and Rao2013). Furthermore, the US stock market with the S&P 500 influence on global financial markets. Its pure size and liquidity make it a significant driver of international investment flows and market sentiment (Chen et al., Reference Chen, Mantegna, Pantelous and Zuev2018). Therefore, investigating market anomalies within the US stock market, especially the S&P 500, is important due to its centrality in the global financial system, its role as an economic indicator, its influence on diverse investment portfolios, and its significance as a benchmark for evaluating investment performance. Understanding these anomalies contributes not only to informed investment decisions but also to a deeper comprehension of the complicated relationship between human behavior and financial markets on a global scale.
While behavioral finance has made significant progress in order to explain the relationship between human behavior and financial markets, there remain critical research gaps that need to be explored. The existing literature primarily accepts the influence of emotions, cognitive biases and psychological factors on investor decisions and market anomalies (Sharma and Kumar, Reference Sharma and Kumar2019; Kamoune and Ibenrissoul, Reference Kamoune and Ibenrissoul2022; Shahani and Ahmed, Reference Shahani and Ahmed2022). However, a deeper exploration is required to understand the nuances of these behavioral aspects within the context of market volatalities. For instance, a comprehensive investigation into how specific emotions, such as fear, greed or overconfidence impact investor behavior during periods of extreme volatility, speculative bubbles and unexpected price movements can provide a more refined understanding. Additionally, given that traditional finance theories, such as the EMH, have been challenged by the persistence of market anomalies (Comlekci and Ozer, Reference Comlekci and Ozer2018; Woo et al., Reference Woo, Mai, McAleer and Wong2020), there is a need to investigate how behavioral factors contribute to the emergence and persistence of anomalies within the US stock market, particularly within the S&P 500. Furthermore, time-series analysis over a more extended period can offer insights into how the impact of behavioral finance on market anomalies evolves over time, considering changing market conditions and investor sentiments.
This study makes a significant contribution to the literature by offering a comprehensive exploration of the complicated relationship between human behavior and financial markets, with a specific focus on the US stock market and the S&P 500. It advances our understanding of how emotions, cognitive biases and psychological factors influence investor decisions during periods of market anomalies, adding depth and nuance to existing knowledge. Furthermore, the research bridges the gap between behavioral finance and market anomalies, shedding light on how behavioral factors contribute to the emergence and persistence of irregularities, especially within the context of the S&P 500. Additionally, the longitudinal perspective provided by the time-series analysis offers valuable insights into the evolving dynamics of market anomalies over an extended period, considering the changing market conditions and investor sentiments.
The primary aim of this study is to comprehensively investigate the relationship between behavioral factors and the US stock market with a specific focus on the S&P 500. To achieve this aim, the study has the following objectives:
• To analyze the relationship between real interest rates (RR) and stock market performance (S&P 500) in terms of behavioral finance.
• To examine how the consumer confidence index (CCI) influences stock market movements and investor behavior.
• To explore the impact of market volatility (VIX) on stock market dynamics from a behavioral perspective.
• To assess the relationship between credit default swaps (CDS) and stock market values and the role of behavioral biases in this relationship.
This study addresses the following research questions:
– How do real interest rates influence stock market performance, and what behavioral factors may explain this relationship?
– What is the impact of the consumer confidence index on stock market movements, and how do behavioral biases play a role in shaping this impact?
– How does market volatility affect stock market dynamics, and what behavioral mechanisms may contribute to this effect?
– What is the relationship between CDS and stock market values, and how do behavioral biases influence this relationship?
By addressing these research questions, this study aims to provide a comprehensive understanding of the behavioral aspects related to financial market interactions.
Literature review
Behavioral finance has emerged as a significant field of study that challenges traditional finance theories by incorporating insights from psychology and human behavior into the understanding of financial markets. The exploration of behavioral finance, particularly within the context of market anomalies in the US stock market, has led to valuable insights that shed light on why financial markets often exhibit irrational behavior, unexpected price movements and deviations from traditional finance assumptions.
One of the fundamental aspects of behavioral finance is the recognition of behavioral biases that influence investor decisions. Behavioral biases, such as loss aversion, overconfidence and herding behavior, play a substantial role in shaping market anomalies. Research by Merkle (Reference Merkle2020) and Greene (Reference Greene2011) highlights the impact of loss aversion on investor decision-making, where individuals tend to fear losses more than they value equivalent gains. Loss aversion can lead to risk-averse behavior during periods of market volatility, contributing to market anomalies.
Overconfidence, as another predominant cognitive bias, may significantly affect investor decisions and contribute to market anomalies. Research in this area, such as that conducted by Kansal and Singh (Reference Kansal and Singh2018), has demonstrated that individuals often overestimate their own knowledge and abilities. In the context of financial markets, overconfident investors may trade excessively, believing they possess superior information or skills. This overtrading can result in increased transaction costs and suboptimal portfolio performance, thereby contributing to anomalies like the disposition effect, where investors tend to hold on to losing investments for too long in the hope of a rebound.
Another remarkable behavioral bias is herding behavior, which refers to the tendency of investors to follow the crowd rather than making independent decisions. Herding can exacerbate market anomalies by amplifying trends and magnifying market movements. When a large number of investors herd into a particular asset class or investment strategy, it can lead to price bubbles or crashes that deviate significantly from fundamentals. Empirical studies, such as that by Tan et al. (Reference Tan, Chiang, Mason and Nelling2008) and Spyrou (Reference Spyrou2013), have provided insights into the impact of herding behavior on market dynamics, highlighting how this behavioral bias can contribute to market inefficiencies and anomalies.
Investor sentiment and its influence on market anomalies provide another layer of complexity to the field of behavioral finance. Schneider (Reference Schneider2014) highlights the idea that a multitude of factors, including weather, mood and external events, can significantly impact investor sentiment, consequently affecting market behavior. This dynamic relationship between sentiment and market anomalies is multifaceted.
High levels of consumer confidence, as explored by Gormus and Gunes (Reference Gormus and Gunes2010), often lead to a sense of optimism among investors. When consumers are confident about the economy and their financial well-being, they are more likely to invest in the stock market. This influx of positive sentiment can have a cascading effect on the market, driving up prices and contributing to bullish market anomalies (Sruthi and Shijin, Reference Sruthi and Shijin2017). In such situations, investors may become less risk-averse, leading to increased trading activity and potentially the emergence of bubbles in certain asset classes.
Conversely, low consumer confidence can trigger risk aversion and a shift away from equities (Chen, Reference Chen2011). During times of economic uncertainty or external shocks, such as financial crises or geopolitical events, investors tend to become more cautious. They may liquidate their equity holdings in favor of safer assets like bonds or cash, leading to bearish market anomalies. The collective sentiment of fear and pessimism can create a self-fulfilling foresight, where market participants expect downturns, and these expectations are obvious in actual market declines.
Behavioral finance has illuminated a fascinating array of specific market anomalies within the US stock market, each shedding light on the complicated interaction between investor behavior and market dynamics. The momentum effect, as explained by Dhankar and Maheshwari in 2016, reveals how psychological biases can drive market anomalies. This phenomenon contradicts the notion of strict market efficiency theorized by the EMH. It shows that stocks that have performed well in the recent past tend to continue performing well, often challenging rational expectations. The persistence of this anomaly implies how investor sentiment and the propensity to generalize recent trends can overpower fundamental valuation metrics.
Conversely, the value effect, precisely explored by Sharma and Kumar in 2019, challenges traditional market wisdom. This anomaly reveals that stocks with lower price-to-earnings (P/E) ratios can outperform those with higher P/E ratios, contrary to the EMH's assumption that stock prices fully reflect all available information. Investors’ tendency to undervalue stocks with lower P/E ratios due to their perceptions or behavioral biases can trigger market anomalies where these ‘value’ stocks outperform their ‘growth’ counterparts.
The small-cap effect, discussed by Latif et al. (Reference Latif, Arshad, Fatima and Farooq2011), adds another layer to the market anomalies. It demonstrates how smaller companies can outperform their larger counterparts, defying traditional risk-return expectations. This anomaly is often attributed to investor preferences and behavioral biases, where investors may overlook smaller stocks due to their perceived risk, creating opportunities for intelligent investors who recognize this bias.
Several studies, including those by Chang et al. (Reference Chang, Hsieh and McAleer2016) and Wang (Reference Wang2019), have revealed a negative correlation between market volatility and stock market performance. This correlation implies that as market volatility rises, investors tend to become more risk-averse. Such heightened risk aversion can lead to erratic market behavior, potentially amplifying market anomalies. Investors may become overly cautious, leading to under-pricing or overpricing of assets, depending on the direction of volatility. This insight highlights how fluctuations in investor sentiment, triggered by increased volatility, can contribute to the emergence of market anomalies.
CDS, as examined by Bystrom (Reference Bystrom2005) and Mateev and Marinova (Reference Mateev and Marinova2019), offers another intriguing perspective on the interaction between financial derivatives and market anomalies. It is essentially an insurance contract against the default of a particular debt instrument, such as a bond. These instruments are associated with risk aversion and loss aversion due to their nature. When investors purchase CDS, they are essentially betting on the possibility of a default event, indicating a preference for safety over risk-taking. This risk-averse behavior is intertwined with loss aversion, as investors are more concerned about the potential loss from default than the gains from the insurance premium. As a result, there exists a negative relationship between the prevalence of CDS trading and the performance of the stock market. When investors become more inclined to use CDS, it often signifies a heightened sense of caution and fear, potentially contributing to market anomalies as risk perception intensifies.
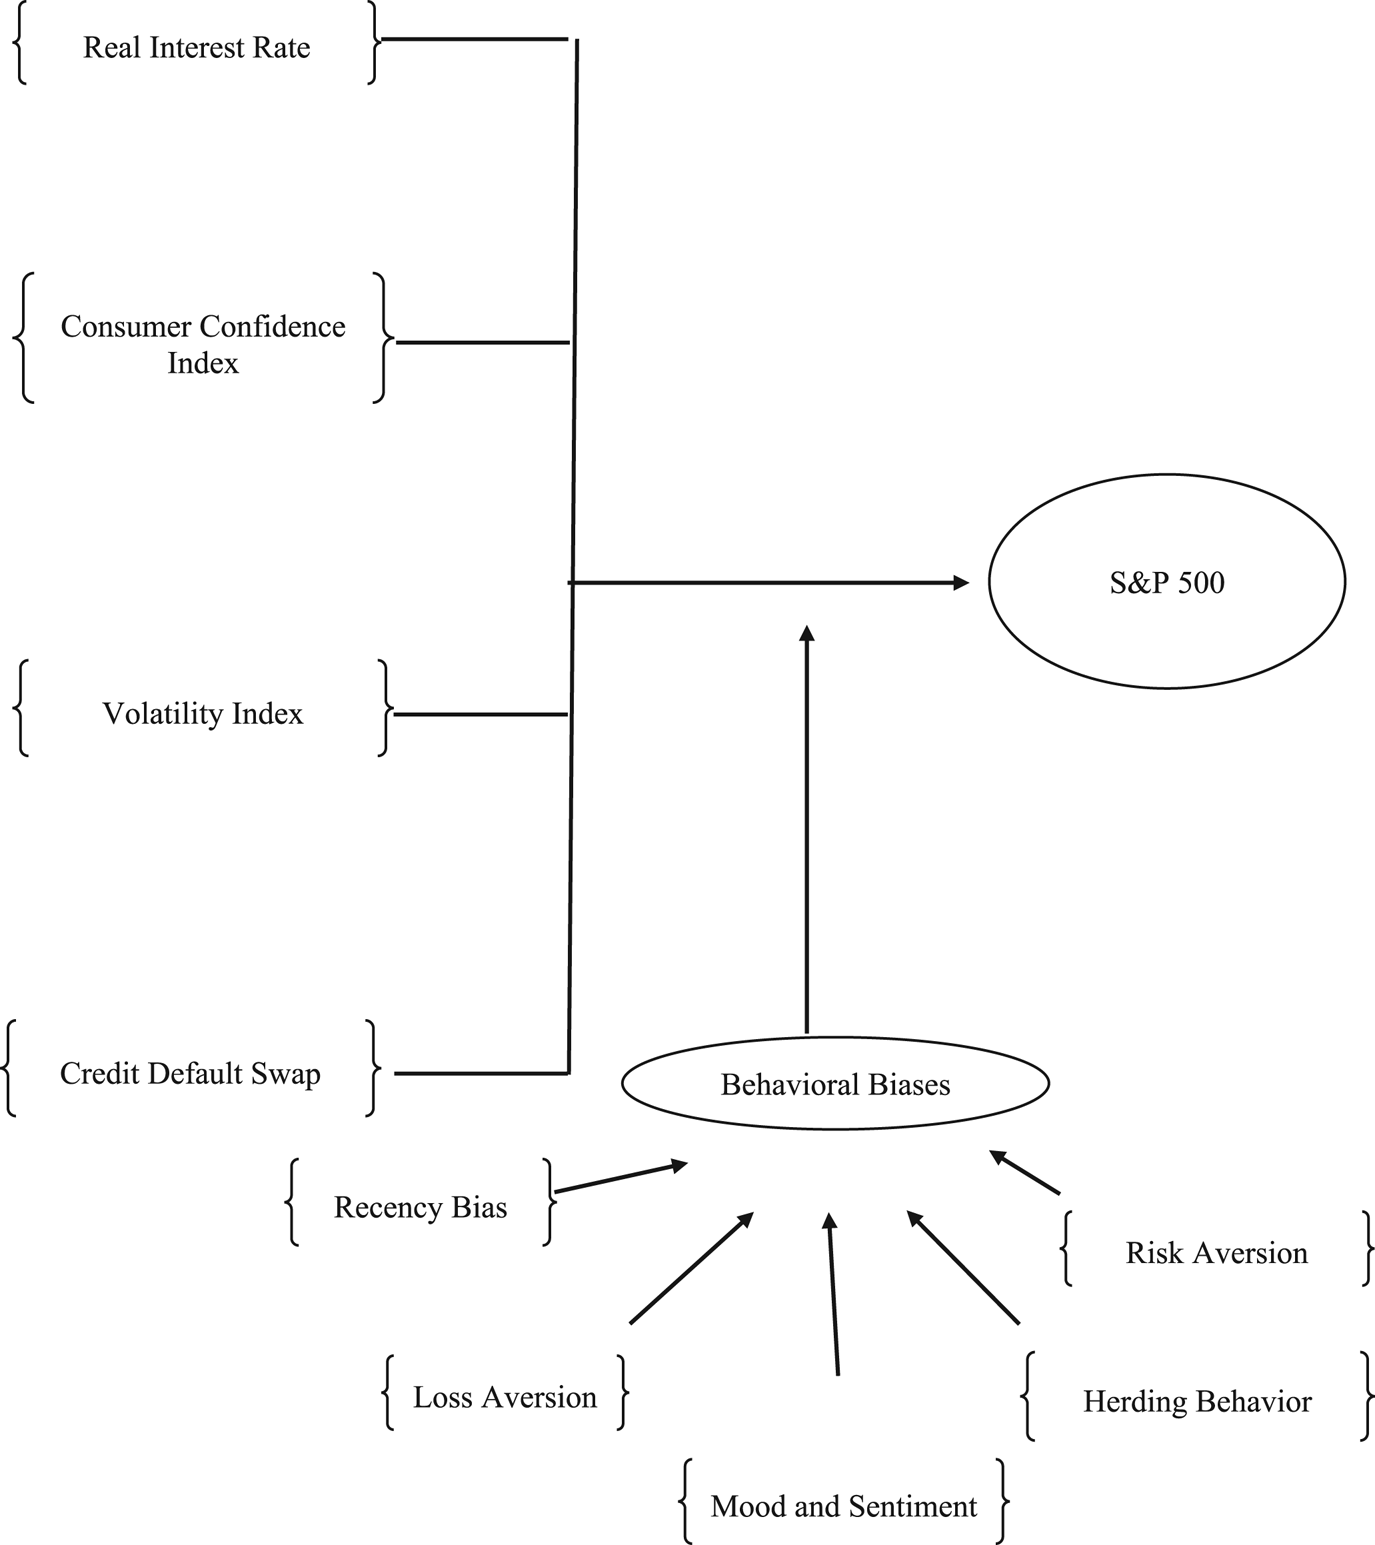
Figure 1 shows the conceptual framework of this study.
The conceptual framework. Source: Isik Akin and Meryem Akin.

Trend of variables over a 10-year period. Source: Isik Akin and Meryem Akin.

Methodology
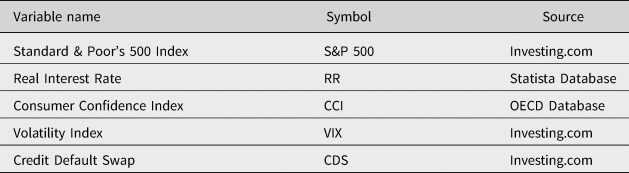
This study aimed to investigate the impact of behavioral finance on the performance of the S&P 500. To achieve this, several financial indicators, including the real interest rate (RR), consumer confidence index (CCI), volatility index (VIX) and CDS, were employed as independent variables, with the S&P 500 serving as the dependent variable. The effects of RR, CCI, VIX and CDS on the S&P 500 were analyzed using time-series analysis, specifically the least squares method, within the context of behavioral bias. Data spanning a period of 10 years (2013–2023) for each of the variables were collected from sources such as investing.com, the Statista Database and the OECD Database.
Table 1 presents the variable name, symbol and their source in detail.
Variable information

Source: Isik Akin and Meryem Akin.
S&P 500
It is officially known as the Standard & Poor's 500 Index and holds a central role in the area of financial markets and investing. This index, made up of the 500 largest U.S. publicly traded companies, serves as a key indicator for the American stock market. It serves as an essential yardstick, reflecting not only the performance of these influential corporations but also the broader economic climate (Frino and Gallagher, Reference Frino and Gallagher2001). One distinctive feature of the S&P 500 is its market capitalization weighting, which means that larger companies have a more significant impact on the index's value. This design reflects how these giant corporations greatly impact the U.S. economy. Moreover, the S&P 500 is highly regarded for its sector diversification. The index encompasses a broad spectrum of industries, including technology, healthcare, financials, consumer discretionary and more. This diversification contributes to mitigating sector-specific risks, making it an attractive benchmark for portfolio evaluation. As such, it has become a cornerstone of investment strategy, guiding not only individual investors but also institutional players in their decision-making processes (Das and Rao, Reference Das and Rao2013). Additionally, investors and fund managers employ various strategies built around the S&P 500. Passive investment approaches, such as index fund investing, seek to replicate the index's performance, providing investors with exposure to a broad swath of the market. Active fund managers, on the other hand, frequently benchmark their performance against the S&P 500, striving to outperform it (Novick et al., Reference Novick, Edkins, Garvey, Madhavan, Matthews and Sethi2017)). Beyond its national borders, the S&P 500's influence extends globally, affecting international financial markets due to its connection with a substantial portion of the world's largest economy.
Real interest rate
The real interest rate (RR) is essentially the nominal interest rate minus the inflation rate. It represents the actual purchasing power of the interest earned or paid on an investment or loan. In simpler terms, it's the interest rate adjusted for the eroding effects of inflation (Neiss and Nelson, Reference Neiss and Nelson2003). For example, if you have a savings account that earns 3% interest annually, and the inflation rate is 2%, the real interest rate is 1% (3–2%). This means that your money is growing in real terms by 1% after accounting for the rising cost of goods and services due to inflation. Real interest rates are crucial in finance and economics because they affect various aspects of investment decisions, borrowing and economic growth. When real interest rates are high, it can encourage saving and discourage borrowing and spending, which may slow down economic growth. Conversely, when real interest rates are low, it can stimulate borrowing and spending, potentially boosting economic activity. Central banks often adjust nominal interest rates to influence real interest rates as part of their monetary policy. By controlling interest rates, they can impact borrowing costs, inflation and overall economic conditions (Rapach and Wohar, Reference Rapach and Wohar2005).
Consumer confidence index
CCI holds a pivotal role in the area of economics and finance, serving as a key indicator of consumer sentiment. It acts as a barometer of how confident consumers feel about their financial situation and the overall state of the economy (Ferrer et al., Reference Ferrer, Salaber and Zalewska2016). This metric is instrumental in forecasting economic trends, as shifts in consumer sentiment often reveal changes in economic conditions. When CCI is positive, indicating high consumer confidence, it tends to stimulate economic activity, leading to increased spending, investment and overall growth. Conversely, low CCI can signal caution among consumers, potentially resulting in reduced spending and economic slowdowns. As such, CCI data are closely monitored by investors, policymakers and economists for its implications on financial markets and government policy decisions. Additionally, the index's regional variations highlight the diverse factors influencing consumer sentiment across different areas, making it a valuable tool for understanding economic dynamics on a local and national scale (Chen, Reference Chen2011).
The volatility index
The Volatility Index, often referred to as the VIX, is a widely tracked financial gauge that measures market volatility and investor sentiment. Commonly known as the ‘fear index,’ the VIX reflects the market's expectations of future volatility in the stock market. It is calculated using options prices on the S&P 500, specifically the implied volatility of these options (Chang et al., Reference Chang, Hsieh and McAleer2016). A high VIX value typically indicates that investors expect significant market turbulence or uncertainty in the near future. This can be associated with events such as economic downturns, geopolitical tensions or unexpected news. On the other hand, a low VIX suggests that investors anticipate relative stability in the market. Investors and traders use the VIX as a tool to estimate market risk and make decisions about their portfolios (Wang, Reference Wang2019).
Credit default swap
A CDS is a financial instrument used in the world of finance and investing. It functions as a contract between two parties, typically an investor (protection buyer) and a financial institution (protection seller) (Bystrom, Reference Bystrom2005). The purpose of a CDS is to provide protection against the risk of a credit event, such as a bond issuer failing to meet its debt payment obligations. The protection buyer pays premiums to the protection seller in exchange for this coverage. If a credit event occurs, where the issuer defaults, the protection seller compensates the protection buyer for the resulting losses. CDS contracts serve two main purposes: risk management and speculation (Mateev and Marinova, Reference Mateev and Marinova2019). Investors holding bonds may use CDS contracts to hedge against default risk, while others, like hedge funds, may use them for speculative purposes, betting on the creditworthiness of issuers. Despite past controversies and regulatory changes, CDS contracts remain a significant tool for managing credit risk in financial markets.
Least squares method
The least squares method aims to find the best-fitting linear relationship between a dependent variable Y and one or more independent variables X 1, X 2, … , X k. Let's consider the case of simple linear regression, where there is only one independent variable X. The goal is to find the line Y = β 0 + β 1X that minimizes the sum of the squared differences between the observed values of Y and the values predicted by the model.
The linear regression model is represented as follows (Miller, Reference Miller2006):

where Y is the observed dependent variable, X is the observed independent variable, β 0 is the intercept, representing the value of Y when X is zero, β 1 is the slope, representing the change in Y for a one-unit change in X, ε is the error term, representing the random variability in Y not explained by the model.
Minimization of squared residuals
The least squares method seeks to minimize the sum of the squared residuals (the vertical distances between each observed Y and the corresponding predicted value):

where n is the number of data points, $\varepsilon _i$ is the difference between the observed Y i and the predicted Y i for the i-th data point:

Least squares estimators
To find the best-fitting line, we differentiate the sum of squared residuals with respect to the parameters β 0 and β 1 and set the derivatives equal to zero. This leads to the following equations:


Solving these equations results in the least squares estimators:


where $\bar{X}$ and $\bar{Y}$
 are the sample means of X and Y, respectively.
These estimators $\widehat{{\beta _0}}$ and $\widehat{{\beta _1}}$
 are unbiased and have minimum variance under certain assumptions about the errors, such as independence, constant variance (homoscedasticity) and normality.
Findings
In this section, the findings of the time-series analysis are presented.
The S&P 500 exhibits a generally upward trend. It started at around 1,200 in the year 2013, it steadily increased and reached a value of around 4,800 in the year 2023. This indicates a positive performance of the stock market over the given period. In essence, the overall value of the stocks in the index has increased which reflects the growth and profitability of the companies represented in the index.
The RR fluctuates between −0.4% and 2.0% over the years. It began at around −0.5% in the year 2013 and remained relatively stable until 2020. It stayed negative from the beginning of 2020 to the beginning of 2022. This indicates that low and negative interest rates provided a favorable borrowing and investment climate as it allowed businesses and individuals to access credit at relatively low costs. It encouraged productive economic activity until the beginning of the year 2022. However, the RR started to increase from the beginning of the year 2022 to 2.06%. This conversely discourages borrowing and investment as the cost of borrowing becomes more expensive.
CCI exhibits a gradual increase until 2022. It exceeded 100 basis points after 2014 which means that consumers were more optimistic about economic conditions and their financial prospects. This shows that consumers were more likely to make major purchases, invest and contribute to overall economic activity during this period. However, CCI decreased to under 100 basis points by the year 2022. It typically indicates a decline in consumer confidence. This could be influenced by various factors such as economic challenges, rising inflation, job market concerns or geopolitical uncertainties. A drop in consumer confidence can lead to decreased consumer spending and a more cautious approach to personal finances.
The VIX shows a gradual increase over the years. When the VIX increases, it suggests that investors are becoming more uncertain or anxious about future market movements. It started around 15 in the year 2013, it increased and reached a value of around 53 in the year 2022. This substantial increase in the VIX indicates that market participants perceived increasing levels of uncertainty and potential for price fluctuations during this period. The VIX returned to 15 in the year 2023. This suggests a decrease in market volatility and potentially a calmer market environment.
CDS shows a decreasing trend until 2022. It began at around 38 in the year 2013, it gradually decreased to 9.95. This decline implied a diminishing perception of credit risk and increased confidence in borrowers’ creditworthiness during that period. It started to rise after 2022 and reached 70 in the year 2023. This indicates a growing level of credit risk in the market. The increasing CDS suggests that investors are becoming more concerned about the creditworthiness of borrowers and are demanding higher compensation for taking on credit risk.
Table 2 presents the descriptive statistics for the variables.
Descriptive statistics

Source: Isik Akin and Meryem Akin.
The S&P 500 has an average level of around 2838.72, but a slightly lower median at 2688.85 implies potential right-skewness. It spreads a wide range from 1514.68 to 4766.18 which indicates significant volatility. Positive skewness (0.54) and moderate leptokurtosis (kurtosis 2.03) suggest a right-skewed distribution with heavier tails.
RR shows a positive real return with a mean of about 0.5834. The median of 0.5450 implies potential right-skewness, while a standard deviation of 0.5042 indicates moderate variability. Positive skewness (0.4142) and moderate leptokurtosis (kurtosis 3.1854) further suggest a right-skewed distribution with moderately heavy tails.
CCI has an average level of approximately 99.84, with a median of about 100.46, indicating potential left-skewness. It exhibits limited variability within a narrow range of 96.13 to 101.64. Negative skewness (−0.77) and moderate leptokurtosis (kurtosis 2.49) suggest a left-skewed distribution with moderately heavy tails.
VIX represents an average market volatility level (mean 18.21). The slightly lower median (16.25) suggests potential right-skewness. It spreads a wide range from 9.51 to 53.54 which reveals significant volatility. Positive skewness (1.87) and high leptokurtosis (kurtosis 7.99) indicate a right-skewed distribution with heavy tails and significant fluctuations.
CDS indicates an average credit default risk level (mean 20.69). The median (18.70) suggests potential right-skewness, and it spreads from 9.95 to 70.42. This reflects significant credit risk volatility. Positive skewness (2.52) and high leptokurtosis (kurtosis 14.38) imply a right-skewed distribution with extremely heavy tails and extreme fluctuations.
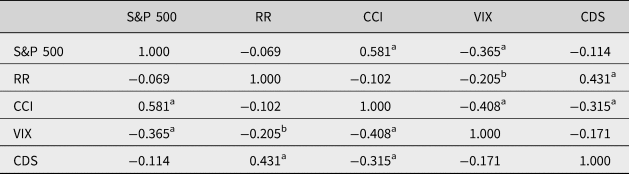
The correlation matrix presented in Table 3 reveals the relationships among the S&P 500, RR, CCI, VIX and CDS. First of all, there is a strong positive correlation (0.581) between the S&P 500 and CCI (Gormus and Gunes, Reference Gormus and Gunes2010). It highlights the significance of consumer sentiment in influencing stock market movements. When consumers are optimistic about economic conditions and their financial prospects, it tends to move with an upward trend in the S&P 500, reflecting increased confidence in investing and spending (Nofsinger, Reference Nofsinger2005; Hadi and Ahmad, Reference Hadi and Ahmad2021). Conversely, the moderate negative correlation (−0.365) between the S&P 500 and VIX points to the impact of market volatility on stock prices (Wang, Reference Wang2019). As the VIX, an indicator of market uncertainty, rises, the S&P 500 tends to dip, highlighting investors’ heightened risk aversion during turbulent periods (Chang et al., Reference Chang, Hsieh and McAleer2016). Regarding RR, a weak negative correlation (−0.069) suggests a nuanced relationship between real interest rates and the S&P 500 (Amarasinghe, Reference Amarasinghse2015). However, the correlation is not statistically significant. Lastly, the moderately strong negative correlation (−0.114) between the S&P 500 and CDS indicates that credit default risk plays a role in stock market movements (Bystrom, Reference Bystrom2005). This correlation is not statistically significant.
Pearson correlation matrix

a Correlation is significant at the 0.01 level (two-tailed).
b Correlation is significant at the 0.05 level (two-tailed).
Source: Isik Akin and Meryem Akin.
At its original level, the S&P 500 demonstrates a non-stationary behavior with a t-statistic of −0.375495 and a high probability of 0.9087. However, when differenced once (transformed into first differences), the t-statistic significantly drops to −13.5816, and the probability becomes 0.0000, strongly indicating stationarity. RR is non-stationary with a t-statistic of −1.612079 and a probability of 0.4734 at level. Yet, when differenced once, the t-statistic becomes −13.94129 with a probability of 0.0000, providing strong evidence of stationarity. The original CCI data are non-stationary with a t-statistic of −1.107561 and a probability of 0.7114. However, when transformed into first differences, the t-statistic becomes −5.289103 with a probability of 0.0000, indicating stationarity. The VIX data, in its original form, show strong evidence of stationarity with a t-statistic of −4.859170 and a very low probability of 0.0001. CDS is stationary with a t-statistic of −3.843517 and a probability of 0.0112 at the level. Thus, no differencing is required for VIX and CDS.
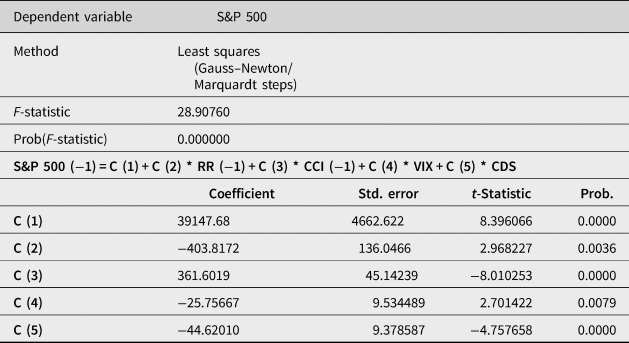
The F-statistic tests the overall significance of the regression model. In this case, the F-statistic is 28.91, with an extremely low p-value (Prob(F-statistic) = 0.0000). This indicates that the model is statistically significant and that at least one of the independent variables has a significant impact on the S&P 500.
The coefficient for RR (−1) (−403.8172) indicates that a one-unit increase in the lagged real interest rate is associated with an approximate 403-point decrease in the S&P 500, holding other variables constant. The negative coefficient suggests a negative relationship between RR and the S&P 500. This finding is supported by Alam and Uddin (Reference Alam and Uddin2009) and Amarasinghe (Reference Amarasinghse2015).
The coefficient for CCI (−1) (361.6019) indicates that a one-unit increase in the lagged CCI is associated with an approximate 361-point increase in the S&P 500, holding other variables constant. The positive coefficient implies a positive relationship between CCI and the S&P 500. It is similar findings with Gormus and Gunes (Reference Gormus and Gunes2010) and Hadi and Ahmad (Reference Hadi and Ahmad2021).
The coefficient for VIX (−25.75667) suggests that a one-unit increase in the VIX is associated with an approximate 25.76-point decline in the S&P 500, assuming other variables remain constant. This negative relationship implies that as market volatility increases, the S&P 500 tends to decline. This result is supported by Chang et al. (Reference Chang, Hsieh and McAleer2016) and Wang (Reference Wang2019).
The coefficient for CDS (−44.62010) implies that a one-unit increase in the CDS is associated with an approximate 44.62-point decrease in the S&P 500, controlling for other variables. This negative coefficient suggests an inverse relationship between CDS and the S&P 500, indicating that higher credit default risk is associated with lower stock market values. This is supported by Bystrom (Reference Bystrom2005) and Mateev and Marinova (Reference Mateev and Marinova2019).
The Jarque–Bera test is a statistical test used to assess the normality of the residuals or errors in a regression model. It tests whether the distribution of the residuals follows a normal (Gaussian) distribution, which is one of the key assumptions of linear regression (Thadewald and Buning, Reference Thadewald and Buning2007). In Table 6, the Jarque–Bera test statistic is 1.847818, and the associated probability (p-value) is 0.396964. There is no strong evidence to conclude that the residuals in the regression model significantly deviate from a normal distribution. This suggests that the normality assumption for the residuals appears to be reasonably met, which is a positive aspect of the model's statistical validity.
Augmented Dickey–Fuller test statistics at level and first differences

Source: Isik Akin and Meryem Akin.
The results of the least squares regression model using the Gauss–Newton/Marquardt steps method

Source: Isik Akin and Meryem Akin.
Normality test

Source: Isik Akin and Meryem Akin.
Breusch–Godfrey serial correlation LM test

Source: Isik Akin and Meryem Akin.
Heteroskedasticity test – ARCH

Source: Isik Akin and Meryem Akin.
The F-statistic is 0.692, and its associated probability (Prob) is 0.670. There is no significant serial correlation in the residuals of the regression model. Both the F-statistic and the associated p-value provide strong evidence against the presence of serial correlation.
The F-statistic for the ARCH test is 4.579, and its associated probability (Prob) is 0.175. The ARCH Heteroskedasticity Test results indicate no strong evidence of heteroskedasticity in the regression model's residuals. This suggests that the assumption of constant variance of residuals is reasonable for the analysis.
Discussions
In this section, empirical findings are discussed in terms of behavioral finance.
S&P 500 – RR
The relationship between the S&P 500 and RR is negative and statistically significant. This aligns with previous research conducted by Alam and Uddin (Reference Alam and Uddin2009) and Amarasinghe (Reference Amarasinghse2015). This negative relationship suggests that as real interest rates increase, there is a corresponding decrease in the S&P 500. Loss aversion (Greene, Reference Greene2011; Merkle, Reference Merkle2020), mood and sentiment (Schneider, Reference Schneider2014) and herding behavior (Tan et al., Reference Tan, Chiang, Mason and Nelling2008; Spyrou, Reference Spyrou2013) may provide insights into why real interest rates and the S&P 500 may exhibit a negative relationship.
Loss aversion
Loss aversion is a noticeable behavioral bias that can have a deep effect on investment outcomes. When interest rates rise and bond yields become more appealing, some investors may experience a fear of incurring losses in the stock market. Consequently, they may shift their investments to less risky assets, even if the potential gains in stocks remain favorable. This aversion to losses can result in a decrease in stock prices. Emsbo and Gold (Reference Emsbo-Mattingly and Gold2013) emphasize the role of loss aversion in influencing investment decisions, particularly in relation to the shift toward less risky assets. This result is further supported by Lim and Kim (Reference Lim and Kim2019), who find that individuals experiencing anxiety are more hesitant to participate in the stock market.
Mood and sentiment
The mood and sentiment of investors also play a significant role in market movements. The rise in interest rates can have a psychological impact on investors by leading to shifts in sentiment. If investors become pessimistic about the economic consequences of higher rates, it can result in selling pressure on stocks (Kurov, Reference Kurov2010). The influence of investor sentiment on stock returns varies across different markets, with both stock characteristics and country-specific factors contributing to this variation (Corredor et al., Reference Corredor, Ferrer and Santamaria2013).
Herding behavior
Another behavioral bias that may contribute to a negative relationship is herding behavior. Investors often exhibit herding behavior, where they follow the actions of others and make investment decisions based on the crowd's behavior. In a low-interest rate environment, if a significant number of investors perceive stocks as the only viable option for returns, they may all rush into the stock market simultaneously, leading to increased demand and driving up stock prices. Chen (Reference Chen2013) discovered that herding behavior is a global phenomenon, with significant effects in both developed and emerging markets. Nair and Yermal (Reference Nair and Yermal2017) identified demographic factors and information sources as key influencers of herding behavior among Indian stock investors. Chang and Lin (Reference Chang and Lin2015) further explored the role of national culture and behavioral pitfalls in international stock markets, establishing a correlation between certain cultural indexes and herding behavior. These studies collectively highlight the extensive nature of herding behavior and its impact on investment decisions and the dynamics of the stock market.
S&P 500 – CCI
The positive relationship between the CCI and the S&P 500 is evidenced by the coefficient (361.6019) and supported by research such as Gormus and Gunes, (Reference Gormus and Gunes2010) and Hadi and Ahmad (Reference Hadi and Ahmad2021). Herding behavior (Tan et al., Reference Tan, Chiang, Mason and Nelling2008; Spyrou, Reference Spyrou2013), loss aversion (Greene, Reference Greene2011; Merkle, Reference Merkle2020) and sentiment (Schneider, Reference Schneider2014) and market mood might be potential factors which have an impact on this relationship.
Herding behavior
Behavioral finance suggests that during periods of low consumer confidence, indicating economic uncertainty, investors become more risk-averse. As a result, there is a collective shift away from equities, such as the S&P 500, toward safer assets like bonds or cash. The negative coefficient observed between CCI and the stock market reflects the positive correlation between herding behavior and the stock market. Numerous studies in behavioral finance have consistently found evidence of herding behavior among investors, particularly during times of market volatility and economic uncertainty (Tan et al., Reference Tan, Chiang, Mason and Nelling2008; Spyrou, Reference Spyrou2013). This behavior is driven by a desire to reduce risk and can lead to a collective shift away from equities toward safer assets (Merkle, Reference Merkle2020). The occurrence of herding behavior has been observed in various stock markets, including China's A and B markets (Yao et al., Reference Yao, Ma and He2014). These findings suggest that herding behavior significantly impacts stock market dynamics and contributes to excess volatility and mispricing.
Loss aversion
Loss aversion is another concept introduced in behavioral finance, which states that individuals tend to feel the pain of losses more intensely than the pleasure of equivalent gains. When consumer confidence declines, investors become more sensitive to potential economic downturns and prioritize protecting their existing wealth over seeking stock market gains. This aversion to potential losses drives them away from equities, leading to the inverse relationship. Emsbo and Gold (Reference Emsbo-Mattingly and Gold2013) suggest that this aversion to potential losses may lead investors to prioritize wealth protection over stock market gains. Godoi et al. (Reference Godoi, Marcon and Barbosa daSilva2005) emphasize the subjective nature of loss aversion and its influence on investor decision-making. Liu (Reference Liu2023) highlights the evolutionary basis of this bias by emphasizing its role as a survival mechanism.
Mood and sentiment
Investor sentiment, influenced by consumer confidence, plays a significant role in market behavior. Low consumer confidence leads to negative sentiment about the economy and the stock market. This negative mood perpetuates a bearish market environment, with investors selling stocks and exerting downward pressure on prices. Schneider (Reference Schneider2014) highlights the influence of investor sentiment, which can be influenced by various factors, including individual investors’ sentiment, temporarily affecting stock prices (Chan and Fong, Reference Chan and Fong2004). Monetary policy decisions also have a significant effect on investor sentiment, particularly during bear market periods (Kurov, Reference Kurov2010). Real-world emotions, such as anxiety and worry, impact stock market prices, with increases in these emotions predicting downward pressure on the market (Gilbert and Karahalios, Reference Gilbert and Karahalios2010).
S&P 500 – the VIX
There is a negative and statistically significant relationship between the VIX and the S&P 500, as indicated by the coefficient (−25.75667) and supported by previous research such as Chang et al. (Reference Chang, Hsieh and McAleer2016) and Wang (Reference Wang2019). Risk aversion (Michailova et al., Reference Michailova, Maciulis and Tvaronaviciene2017), recency bias (Rabbani et al., Reference Rabbani, Grable, O'Neill, Lawrence and Yao2020), herding behavior (Tan et al., Reference Tan, Chiang, Mason and Nelling2008; Spyrou, Reference Spyrou2013) and loss aversion (Greene, Reference Greene2011; Merkle, Reference Merkle2020) might be the possible behavioral biases which play an important role in this relationship.
Risk aversion
Risk aversion is a prominent behavioral bias that influences the relationship between the VIX and the S&P 500. The VIX serves as an indicator of market volatility and uncertainty, and when it increases, risk-averse investors tend to respond by selling stocks and seeking safer assets such as bonds or cash. This behavior can result in a decline in the S&P 500, as evidenced by the negative relationship observed. Hibbert et al. (Reference Hibbert, Daigler and Dupoyet2008) and Fernandes et al. (Reference Fernandes, Medeiros and Scharth2014) both support this negative relationship, highlighting that risk-averse investors react to increased uncertainty by adjusting their investment portfolios. However, Saltari and Ticchi (Reference Saltari and Ticchi2007) argue that the effect of increased uncertainty on investment also depends on the intertemporal elasticity of substitution, while Greene (Reference Greene2011) suggests that risk aversion may not necessarily imply excess volatility in stock prices.
Recency bias
Recency bias is another behavioral bias exhibited by investors, characterized by giving more weight to recent market events and volatility. When the VIX surges, it often reflects recent market turbulence or negative news. Investors influenced by recency bias may overreact to this recent spike in volatility, leading to selling their stocks and contributing to the negative correlation. Recent research, such as the study conducted by Piccoli and Chaudhury (Reference Piccoli and Chaudhury2018), has shed light on the role of recency bias in investor behavior, particularly in response to extreme market events and volatility. They found evidence of stock overreaction to these events, with the intensity of overreaction being more pronounced when investor sentiment is low. Yu and Yuan (Reference Yu and Yuan2011) also found that investor sentiment influences the market's mean–variance tradeoff, especially during periods of low sentiment. Together, these findings suggest that recency bias can lead to overreactions to recent market events, potentially contributing to negative correlations.
Herding behavior
Herding behavior is another factor that can be triggered by the VIX, where investors tend to follow the crowd in response to heightened volatility. If a significant number of investors decide to exit the stock market simultaneously due to VIX spikes, it can lead to a rapid decline in stock prices, amplifying the negative relationship. Wang and Wang (Reference Wang and Wang2018) and Fei and Liu (Reference Fei and Liu2021) both emphasize the role of herding behavior in influencing market volatility. Wang and Wang (Reference Wang and Wang2018) highlight the impact of influential figures, known as gurus, while Fei and Liu (Reference Fei and Liu2021) focus on the asymmetric effect of positive and adverse herding. Bernales et al. (Reference Bernales, Verousis and Voukelatos2020) and Schmitt and Westerhoff (Reference Schmitt and Westerhoff2017) further explore the relationship between herding behavior and market volatility. Bernales et al. (Reference Bernales, Verousis and Voukelatos2020) find that herding is more prevalent during periods of high market volatility risk, while Schmitt and Westerhoff (Reference Schmitt and Westerhoff2017) propose a model in which herding behavior leads to volatility clustering. Collectively, these studies suggest that herding behavior, triggered by factors such as VIX spikes, can significantly impact market volatility.
Loss aversion
Loss aversion also plays a role in the relationship between the VIX and the S&P 500. High levels of the VIX are often associated with market downturns or corrections. Fearing potential losses, investors may choose to sell their holdings to prevent further declines in their portfolios, resulting in a decrease in the S&P 500. Hwang and Satchell (Reference Hwang and Satchell2010) and Merkle (Reference Merkle2020) both highlight the heightened sensitivity to losses, with Hwang and Satchell (Reference Hwang and Satchell2010) noting that this aversion intensifies during bull markets. This aversion can lead to increased trading volume, as observed in initial public offerings (IPOs) with negative initial returns. Furthermore, Berkelaar and Kouwenberg (Reference Berkelaar and Kouwenberg2009) demonstrate how loss aversion can contribute to asset price surges and increased volatility, followed by sharp declines. These findings collectively underscore the significant impact of loss aversion on market downturns and corrections.
S&P 500 – CDS
There is a negative and statistically significant relationship between the CDS and the S&P 500, as indicated by the coefficient (−44.62010) and supported by research such as Bystrom (Reference Bystrom2005) and Mateev and Marinova (Reference Mateev and Marinova2019). Risk aversion (Michailova et al., Reference Michailova, Maciulis and Tvaronaviciene2017), loss aversion (Greene, Reference Greene2011; Merkle, Reference Merkle2020), herding behavior (Tan et al., Reference Tan, Chiang, Mason and Nelling2008; Spyrou, Reference Spyrou2013) and recency bias (Rabbani et al., Reference Rabbani, Grable, O'Neill, Lawrence and Yao2020) might be potential reasons which underline this relationship.
Risk aversion
Risk aversion is a common characteristic among investors when making financial decisions. The presence of higher CDS rates indicates an increased credit default risk, which is perceived as a risky prospect. In response to this heightened risk, risk-averse investors may choose to sell their stock holdings and shift their investments to safer assets. This behavior contributes to the inverse relationship observed between CDS rates and the S&P 500 index. Previous research has confirmed that risk-averse investors tend to respond to elevated credit default risk by adjusting their investment portfolios, thereby influencing the relationship between CDS rates and the S&P 500 index. However, it is important to note that the utilization of CDSs may also lead to risk-shifting, potentially increasing the likelihood of default (Campello and Matta, Reference Campello and Matta2012). Additionally, studies have shown that investors in financial markets exhibit greater loss aversion than initially assumed, particularly during bullish market conditions (Hwang and Satchell, Reference Hwang and Satchell2010).
Loss aversion
Loss aversion refers to the tendency of investors to be more concerned about potential losses than potential gains. When CDS rates rise, it can signal growing apprehension regarding the creditworthiness of borrowers or the possibility of defaults. Motivated by loss aversion, investors may opt to exit the stock market to avoid potential losses in the event of a credit crisis, leading to a decline in the S&P 500 index. Research has indicated that fluctuations in CDS indexes can serve as early warning signals of financial distress in the stock market (Castellano and Scaccia, Reference Castellano and Scaccia2014). These fluctuations are influenced by both fundamental macroeconomic factors and technical market factors. Moreover, during bullish market conditions, investors in financial markets exhibit greater loss aversion, which can contribute to a decrease in the S&P 500 index when CDS rates rise (Hwang and Satchell, Reference Hwang and Satchell2010). The CDS market also has the ability to indicate future negative rating events, suggesting a potential decline in creditworthiness (Castellano and Scaccia, Reference Castellano and Scaccia2014).
Herding behavior
Herding behavior is a phenomenon commonly observed among investors, particularly during periods of uncertainty. A surge in CDS rates can trigger herding behavior, wherein investors collectively decide to reduce their exposure to stocks due to the perception that others are doing the same. This herding behavior can result in a rapid decline in stock prices. Studies on herding behavior in stock markets, particularly in Central and East European markets, have demonstrated its prevalence and its susceptibility to market conditions (Filip et al., Reference Filip, Pochea and Pece2015; Pochea et al., Reference Pochea, Filip and Pece2017). This behavior is more pronounced in declining markets and is stronger for certain types of stocks, such as growth stocks (Yao et al., Reference Yao, Ma and He2014). Furthermore, the herding tendency of institutional investors and margin traders is influenced by market conditions and their own past trades (Lin and Lin, Reference Lin and Lin2014). These findings highlight the significance of herding behavior in shaping stock market dynamics, especially during periods of uncertainty.
Recency bias
Recency bias, which refers to the tendency of investors to assign greater importance to recent events, can also come into play. If there has been a recent spike in CDS rates due to specific events or news, investors influenced by recency bias may react strongly and sell stocks, thereby negatively impacting the S&P 500 index. Zhang (Reference Zhang2009) found that the stock market often reveals information about negative credit events before the CDS market, suggesting that investors may be influenced by recency bias. This is supported by Gandre (Reference Gandre2020), who demonstrated that recency-biased learning can significantly affect stock prices, potentially leading to overreactions. Furthermore, Du (Reference Du2017) highlighted that the CDS market's response to restatement announcements can be influenced by factors such as fraud and credit ratings, which may exacerbate the impact of recency bias.
Conclusion
Firstly, the negative relationship between the S&P 500 and RR suggests that as interest rates rise, the stock market tends to decline. This can be attributed to behavioral biases such as loss aversion, where investors become risk-averse and move to safer assets when interest rates increase. Mood and sentiment also play a significant role, as pessimism about the economic implications of higher rates can lead to selling pressure on stocks. Conversely, herding behavior in a low-interest rate environment may contribute to a negative relationship, as investors flock to stocks for returns.
Secondly, the positive relationship between the S&P 500 and the CCI is influenced by herding behavior, loss aversion and sentiment. When consumer confidence is high, investors tend to exhibit more optimism, resulting in a positive impact on the stock market. Conversely, low consumer confidence can lead to risk aversion and a shift away from equities.
Thirdly, the negative relationship between the S&P 500 and the VIX reflects behavioral biases like risk aversion, recency bias, herding behavior and loss aversion. Rising volatility signals uncertainty, prompting risk-averse investors to sell stocks. Recency bias may lead to overreactions to recent market events while herding behavior can amplify the impact of the VIX on stock prices.
Lastly, the negative relationship between the S&P 500 and CDS is influenced by risk aversion, loss aversion, herding behavior and recency bias. Higher CDS rates signify increased credit risk, prompting risk-averse investors to exit the stock market to avoid potential losses.
These empirical findings make a valuable contribution to the field of behavioral finance by providing insights into the intricate interaction between behavioral biases and financial markets. This understanding is crucial for investors and policymakers in making well-informed decisions. The analysis emphasizes the significance of behavioral finance in explaining market anomalies and offers valuable insights for both investors and policymakers operating in dynamic financial environments.
For investors, recognizing the impact of behavioral biases on market dynamics emphasizes the importance of maintaining a diversified portfolio and adopting a long-term investment perspective. By clarifying how factors such as loss aversion, herding behavior and recency bias can influence decision-making, investors can navigate market fluctuations more effectively and avoid succumbing to irrational exuberance or panic-selling during volatile periods. Furthermore, awareness of these biases can prompt investors to conduct more thorough research and due diligence when evaluating investment opportunities, leading to more informed and rational investment decisions.
Policymakers can utilize insights from behavioral finance to design more effective regulatory frameworks and interventions aimed at promoting market stability and protecting investors. By understanding how behavioral biases can amplify systemic risks and contribute to market inefficiencies, policymakers can implement measures to mitigate these risks and enhance market transparency. Additionally, policymakers can employ behavioral insights to develop targeted interventions addressing specific market anomalies or investor behaviors that may pose systemic risks to financial stability.
Financial institutions can integrate behavioral finance principles into their risk management practices and investment strategies to better assess and mitigate risks driven by behavioral factors. By incorporating behavioral insights into risk modeling and decision-making processes, financial institutions can improve their ability to anticipate and respond to market dynamics influenced by investor sentiment and behavior. Moreover, financial institutions can leverage behavioral finance techniques to design personalized and effective financial products and services tailored to meet the unique needs and preferences of individual investors.
Future research should explore the dynamic nature of the relationship between the S&P 500 and interest rates, particularly during distinct economic phases such as expansion and contraction. Understanding how this relationship varies across different market environments could provide nuanced insights into investor behavior and market dynamics, guiding more informed decision-making for both investors and policymakers. Additionally, longitudinal studies tracking changes in investor sentiment over time in response to interest rate fluctuations could offer deeper insights into the psychological factors driving market movements. By examining sentiment evolution throughout interest rate cycles, researchers can develop more accurate predictive models and sentiment indicators, enhancing our understanding of the influence of market sentiment on stock market performance.
Competing interest
The authors report there are no competing interests to declare.






 Open access

