





1. Introduction
In a tokamak, the scrape-off layer (SOL) and the divertor region comprise the boundary plasma, where magnetic field lines transition from closed confinement to intersecting material surfaces. The SOL is outside the last closed flux surface (LCFS), where plasma flux flows towards the divertor target following open magnetic field lines. This region is important for determining the overall performance and lifetime of magnetically confined fusion devices. Cross-field transport in the SOL driven by collisional processes and intermittent turbulence, which enhance the power decay length ( $\lambda _{{q}}$
) of the SOL, critically affects the heat and particle fluxes incident on the plasma-facing components (PFCs) (Stangeby Reference Stangeby2000). Downstream of the SOL, the divertor operates as the power exhaust system of the device. It is designed to remove particles, mitigate heat loads and control impurity penetration into the core plasma. The complex plasma–material interaction (PMI) occurring in this region critically affects device lifetime and operational stability, which makes extensive understanding of SOL and divertor physics essential for stable operation of future fusion power plants. Although SOL and divertor physics have been investigated in tokamaks such as DIII-D (Rudakov Reference Rudakov2005), ASDEX-U (Sun Reference Sun2017), EAST (Guo Reference Guo2011) and KSTAR (Park Reference Park2018), integrated tokamak experiments have several practical disadvantages when investigating the related physics in detail. For example, diagnostic accessibility in the divertor region is restricted by complex geometry and harsh plasma conditions. Also, experimental campaigns are costly and operational time is limited, which reduces flexibility for systematic parameter scans.
$\lambda _{{q}}$
) of the SOL, critically affects the heat and particle fluxes incident on the plasma-facing components (PFCs) (Stangeby Reference Stangeby2000). Downstream of the SOL, the divertor operates as the power exhaust system of the device. It is designed to remove particles, mitigate heat loads and control impurity penetration into the core plasma. The complex plasma–material interaction (PMI) occurring in this region critically affects device lifetime and operational stability, which makes extensive understanding of SOL and divertor physics essential for stable operation of future fusion power plants. Although SOL and divertor physics have been investigated in tokamaks such as DIII-D (Rudakov Reference Rudakov2005), ASDEX-U (Sun Reference Sun2017), EAST (Guo Reference Guo2011) and KSTAR (Park Reference Park2018), integrated tokamak experiments have several practical disadvantages when investigating the related physics in detail. For example, diagnostic accessibility in the divertor region is restricted by complex geometry and harsh plasma conditions. Also, experimental campaigns are costly and operational time is limited, which reduces flexibility for systematic parameter scans.
For these reasons, linear plasma devices have been developed as dedicated SOL/divertor plasma simulators under open magnetic field configurations (Ohno Reference Ohno2017). Unlike integrated tokamak experiments, linear devices provide well-controlled experimental conditions to isolate specific divertor-relevant physics, but even the linear device cannot reproduce effects from core plasma dynamics and edge magnetohydrodynamic (MHD) activity. Additionally, the simple cylindrical geometry offers improved diagnostic accessibility, enabling direct measurements close to the plasma, which result in enhanced spatial resolution. In addition, the linear device is comparatively cost-effective and suitable for flexible modification of experiment conditions. Various linear devices, including PISCES-RF (Baldwin Reference Baldwin2023), MAGNUM-PSI (Van Eck Reference Van Eck2019), NAGDIS-II (Ohno Reference Ohno2001), TPD-sheet IV (Takimoto et al. Reference Takimoto, Endo, Tonegawa and Sato2019) and GAMMA 10/PDX (Takahashi Reference Takahashi2025), have been used to simulate divertor-relevant conditions. Their simplified configuration enables focused investigation into specific physical processes, particularly radiative power dissipation (Van Eden Reference Van Eden2018), plasma detachment (Ohno Reference Ohno2019) and PMI (Baldwin et al. Reference Baldwin, Doerner, Nishijima, Patino, Simmonds, Tynan, Yu and Založnik2019).
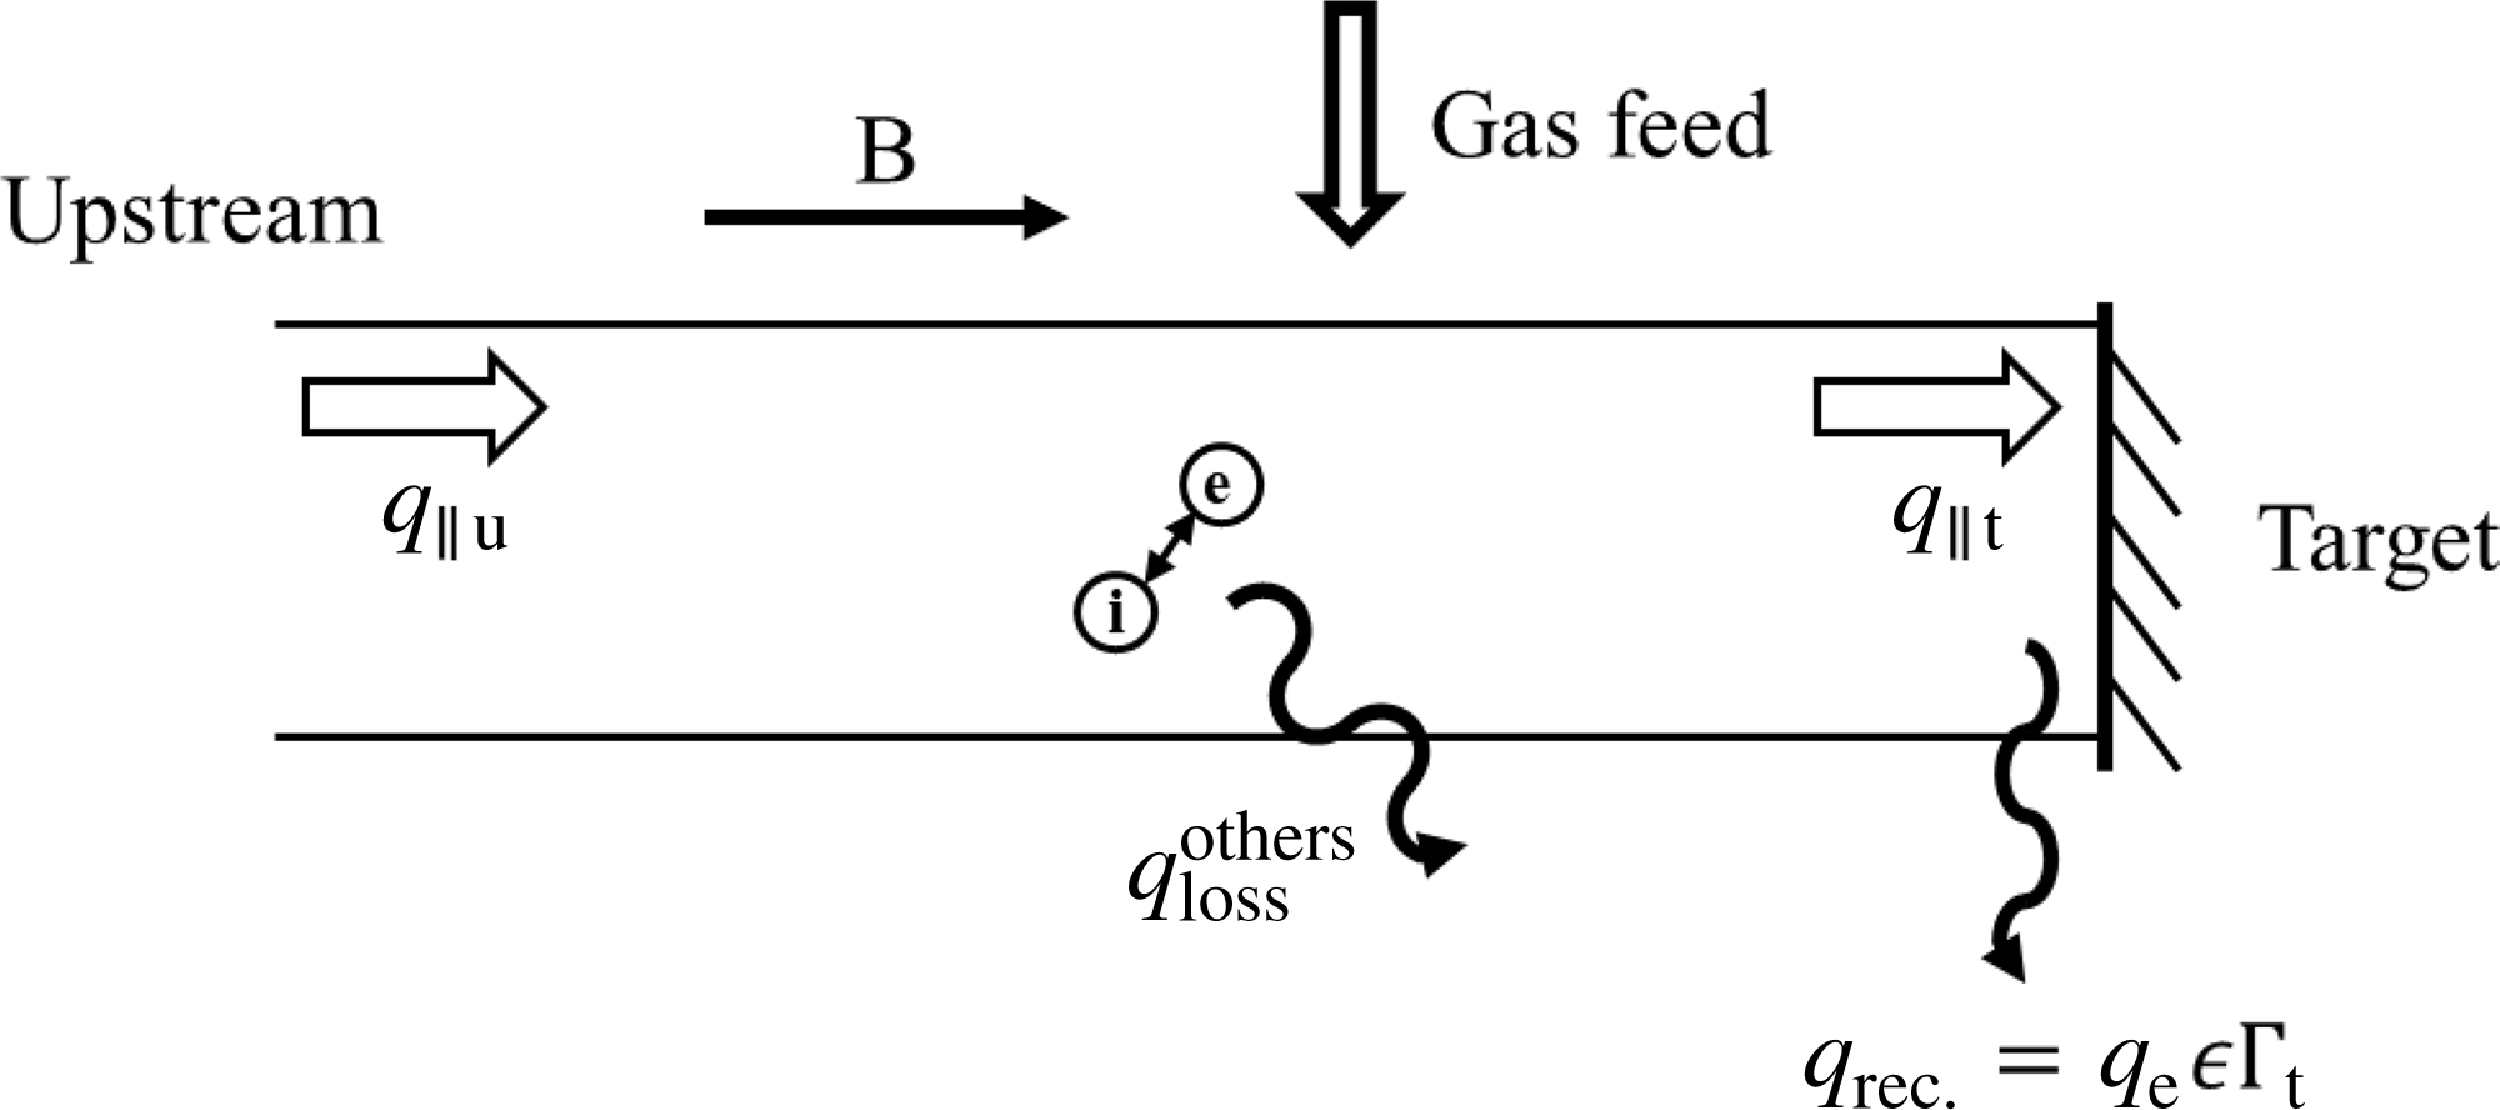
In such simulations, one particular area concerns the high heat load on the divertor target and related mitigation strategies. Heat loads of ∼10 MW m−2 under steady state, as well as transient peak energy fluence 10–30 MJ m−2 during events such as edge-localised modes, corresponding to heat fluxes of 10–30 GW m−2 over a duration of 1 ms, are expected at the strike zone of the divertor during the operation of ITER (Pitts Reference Pitts2013; Eich Reference Eich2017). Therefore, constraining the divertor heat flux under the thermo-engineering limit of the materials is essential. In magnetic confinement fusion devices, one promising method to mitigate the heat and particle loads on PFCs is to use a radiative divertor. In the radiative divertor configuration, additional neutral gas or impurities are injected into the divertor target region to dissipate momentum and power fluxes from upstream plasma through enhanced plasma–neutral interactions and plasma radiation loss (Petrie Reference Petrie1997). Figure 1 presents a basic schematic of the radiative divertor concept. The additional gas feed near the target increases the neutral density, which causes momentum loss and a decrease in the plasma energy. This in turn results in a reduced electron temperature (T e ) and plasma detachment from the target plate. Consequently, the particle and heat fluxes can be significantly mitigated as the neutral pressure increases, ultimately leading to the detached regime, in which the plasma no longer directly contacts the divertor target with large heat flux. Instead, most of the heat and particle fluxes are dissipated volumetrically through radiation and collisional processes upstream of the target, and as a result, the particle flux, T e, and heat flux at the target are substantially reduced. Increasing neutral pressure facilitates this transition and sustains detachment. This concept to control divertor heat and particle fluxes was first demonstrated in linear devices (Hsu et al. Reference Hsu, Yamada and Barrett1982) and closed-field-line fusion devices (Petrie Reference Petrie1997), and has subsequently been implemented in several tokamaks (Soukhanovskii Reference Soukhanovskii2017; Eldon Reference Eldon2021) and stellarators (Miyazawa Reference Miyazawa2006; Zhang Reference Zhang2019).
Schematics of a radiative divertor system ( $q_{| | {u/t}}$
= upstream/target heat flux,
$q_{| | {u/t}}$
= upstream/target heat flux, ${q}_{{loss}}^{{others}}$
= volumetric power loss due to radiation, ionisation and other processes,
${q}_{{loss}}^{{others}}$
= volumetric power loss due to radiation, ionisation and other processes, $q_{{rec.}}$
= recycling power flux,
$q_{{rec.}}$
= recycling power flux, $q_{{e}}$
= electric charge,
$q_{{e}}$
= electric charge, $\epsilon$
= ionisation energy,
$\epsilon$
= ionisation energy, $\Gamma _{{t}}$
= particle flux to the target).
$\Gamma _{{t}}$
= particle flux to the target).

For these reasons, understanding physics in radiative divertor is essential for controlling heat and particle flux in future fusion devices. Since radiative dissipation and detachment are primarily governed by plasma–neutral interactions, it is advantageous to study these processes in devices where such interactions can be examined independently of core plasma dynamics. In integrated tokamak experiments, the strong coupling between the core, SOL and divertor often complicates the interpretation of divertor physics. In contrast, linear divertor simulators operating under open magnetic field configurations provide a simplified environment in which plasma–neutral interaction processes can be investigated. Precise control of experimental parameters is crucial, especially for neutral pressure in the simulation. Neutral pressure directly determines the momentum loss, radiative power dissipation and the onset of plasma detachment, making it a fundamental control parameter in radiative divertor studies.
In this study, we developed a radiative divertor simulator using a magnetic mirror device, KAIMIR (KAIst MIRror) (Oh et al. Reference Oh, Choe, Baek, Kim, Jung, Chung, Kourakis and Sung2024). To realise divertor-relevant plasma conditions suitable for radiative dissipation and detachment studies, modifications of the KAIMIR system were first performed. These include upgrades to the gas feed system and implementation of a differential pumping system, enabling enhanced target particle flux and independent control of neutral pressure in the downstream region, while maintaining stable plasma conditions in the upstream region. Following these upgrades, we conducted simulations using the system to explore the effects of plasma–neutral interactions and flux mitigation in the radiative divertor.
Section 2 introduces the KAIMIR device including its structure, operation method and diagnostics system. Section 3 describes the upgraded gas feed system and its effects on the particle flux in the downstream region, and § 4 presents the implementation of the differential pumping system, which enables independent control of neutral pressure in each chamber. Section 5 reports the initial experimental results of the divertor simulation including the performance of the differential pumping system and the variation of plasma parameters with changes in neutral pressure. The dependence of these trends on source power is also discussed. Finally, § 6 summarises the results of the KAIMIR upgrades and highlights the capability of the system as a radiative divertor simulator for future edge plasma physics and detachment studies.
2. KAIMIR device
The magnetic mirror device KAIMIR has been employed to simulate divertor-relevant plasma conditions. It consists of three large chambers, namely a source chamber, center chamber and expander chamber, and two mirror nozzles installed at each end of the center chamber. The overall system is evacuated by two turbomolecular pumps installed at the bottom of the source and expander chambers, each with a nominal pumping speed of 2000 l s–1. The expander-side pump is located downstream of the skimmer, enabling independent control of the neutral pressure in the expander chamber and supporting differential pumping between the chambers. A plasma gun source (Park et al. Reference Park, An, Jung, Lee, Lee, Chung, Na and Hwang2015) is installed in the source chamber, which operates based on an arc discharge between the cathode and anode that generates a plasma column along the axis. To initiate the arc discharge, pulsed gas feed is supplied with a piezo-electric valve or solenoid valve in the source chamber. Seed electrons produced by electric breakdown subsequently ionise the background neutrals to sustain the discharge. In this system, the applied bias (pulse forming network (PFN) voltage) is used to sustain the discharge and control the source power. The influence of this bias on plasma conditions and detachment behaviour are further examined in § 5. However, it should be noted that the presence of an applied bias distinguishes this system from tokamak divertor plasmas, where plasma flows along open field lines without externally imposed bias. This difference may influence the ion energy at the target and plasma–material interaction, and should be considered when interpreting the results in the context of tokamak divertor plasmas. In this study, helium gas was used as a working gas. Molecular-activated recombination (MAR) is largely suppressed in helium plasmas because helium does not form stable molecules, unlike hydrogen plasmas in which molecular species such as H2 and H2
+ play an important role in recombination processes. As a result, recombination in helium plasmas is dominated by electron–ion recombination (EIR) processes. Through the gun operation, KAIMIR generates high-density plasma with an electron density up to ∼1020 m−3 and typical electron temperatures of 5–10 eV within a plasma column of approximately 100 mm diameter. These plasma parameters fall within the typical range of SOL and divertor plasmas, where electron temperature is of the order of 1–100 eV and electron density is within $10^{19-21}\,\mathrm{m}^{-3}$
(Loarte Reference Loarte2007). The device can offer a wide range of possible upstream electron densities (1018–20 m−3) by adjusting the source power and magnetic field configurations (|B
Centre|
$10^{19-21}\,\mathrm{m}^{-3}$
(Loarte Reference Loarte2007). The device can offer a wide range of possible upstream electron densities (1018–20 m−3) by adjusting the source power and magnetic field configurations (|B
Centre| $\leq$
0.1 T, |B
Mirror|
$\leq$
0.1 T, |B
Mirror| $\leq$
0.4 T) for divertor simulation experiments.
$\leq$
0.4 T) for divertor simulation experiments.
Quarter-section computer aided model (CAD) of the KAIMIR device showing the differential pumping configuration and installed diagnostics. LP, Langmuir probe; DL, diamagnetic loop; MI, microwave interferometer; TMP, turbomolecular pump.

For divertor simulation experiments, we considered the center and expander chambers in KAIMIR as the upstream and downstream regions of the SOL, respectively. The plasma gun generates the source plasma in the source chamber and the plasma propagates along the magnetic field towards the collector, a tungsten plate, in the expander chamber. The collector acts as the divertor target in divertor simulations. The axial coordinate Z is defined along the on-axis magnetic field direction, with Z = 0 m referenced at the centre of the center chamber. The plasma gun is located at Z = −1.0 m and the collector is positioned at Z = 1.2 m.
Various diagnostics were applied in this study; their locations are shown in figure 2. To measure the temporal evolution of neutral pressure, fast capacitance manometre gauges (CDG 045Dhs, Inficon.) with a response time of 2 ms for pressure below 100 mTorr (10 % of the full scale of the gauge) were installed on the center and expander chambers. In the center chamber, a Langmuir probe was installed at Z = 0.06 m to measure ion saturation current ( $I_{{sat}}$
), and electron temperature and density. The ion particle flux,
$I_{{sat}}$
), and electron temperature and density. The ion particle flux, $\Gamma _{\mathrm{i}}$
, was estimated from the ion saturation current using
$\Gamma _{\mathrm{i}}$
, was estimated from the ion saturation current using $\Gamma _{\mathrm{i}}=I_{{sat}}/(q_{{e}}A_{{P}})$
, where
$\Gamma _{\mathrm{i}}=I_{{sat}}/(q_{{e}}A_{{P}})$
, where $q_{{e}}$
is the elementary charge and
$q_{{e}}$
is the elementary charge and $A_{{P}}$
is the probe collection area. Under the assumption of Bohm sheath conditions, this corresponds to
$A_{{P}}$
is the probe collection area. Under the assumption of Bohm sheath conditions, this corresponds to $\Gamma _{\mathrm{i}}\sim n_{{e}}c_{{s}}$
, where
$\Gamma _{\mathrm{i}}\sim n_{{e}}c_{{s}}$
, where $c_{{s}}$
is the ion sound speed. The stored energy per unit length (W/L) in the center chamber was measured with a diamagnetic loop (Choe et al. Reference Choe, Oh, Bak, Baek and Sung2024) located at Z = 0.14 m. The stored energy per unit length represents the plasma energy per unit axial length, obtained from the diamagnetic signal, which is proportional to the cross-sectional integral of the plasma pressure, following the method described by Choe et al. (Reference Choe, Oh, Bak, Baek and Sung2024). In the expander chamber, a microwave interferometer was employed to measure the line-integrated density (
$c_{{s}}$
is the ion sound speed. The stored energy per unit length (W/L) in the center chamber was measured with a diamagnetic loop (Choe et al. Reference Choe, Oh, Bak, Baek and Sung2024) located at Z = 0.14 m. The stored energy per unit length represents the plasma energy per unit axial length, obtained from the diamagnetic signal, which is proportional to the cross-sectional integral of the plasma pressure, following the method described by Choe et al. (Reference Choe, Oh, Bak, Baek and Sung2024). In the expander chamber, a microwave interferometer was employed to measure the line-integrated density ( $\overline{n}_{{e}}$
) at Z = 0.90 m. The measurement validity was verified using a dielectric material with a known refractive index (acrylic plate). The interferometer signal was measured along a radial line of sight and the corresponding diagnostic geometry is indicated in figure 2. Further details of the interferometer system will be reported in a separate publication. An additional Langmuir probe was also installed at Z = 0.895 m. By varying the experimental conditions including upstream density and downstream neutral pressure, diverse plasma parameters could be monitored simultaneously. However, the electron temperature at the downstream region, which is one of the key parameters in divertor plasma, cannot be directly quantified due to limitations of Langmuir probe measurements in the detached regime. It has been reported that conventional Langmuir probe measurements are strongly distorted under detached conditions, making it difficult to acquire reliable IV characteristic curves and thus determine the electron temperature (Ohno et al. Reference Ohno, Tanaka, Ezumi, Nishijima and Takamura2001). Therefore, the electron temperature was not measured directly in this study. Consequently, the contribution of excitation and recombination processes were not evaluated quantitatively, since the corresponding reaction rates strongly depend on the electron temperature. In addition, spectrally resolved measurements of the emission light were not performed in this study. Instead, we adopted a fast camera to monitor visible emissions in the expander, from which we estimated the electron temperature qualitatively. Nevertheless, the observed emission patterns still provide qualitative insight into the detachment behaviour in the expander region.
$\overline{n}_{{e}}$
) at Z = 0.90 m. The measurement validity was verified using a dielectric material with a known refractive index (acrylic plate). The interferometer signal was measured along a radial line of sight and the corresponding diagnostic geometry is indicated in figure 2. Further details of the interferometer system will be reported in a separate publication. An additional Langmuir probe was also installed at Z = 0.895 m. By varying the experimental conditions including upstream density and downstream neutral pressure, diverse plasma parameters could be monitored simultaneously. However, the electron temperature at the downstream region, which is one of the key parameters in divertor plasma, cannot be directly quantified due to limitations of Langmuir probe measurements in the detached regime. It has been reported that conventional Langmuir probe measurements are strongly distorted under detached conditions, making it difficult to acquire reliable IV characteristic curves and thus determine the electron temperature (Ohno et al. Reference Ohno, Tanaka, Ezumi, Nishijima and Takamura2001). Therefore, the electron temperature was not measured directly in this study. Consequently, the contribution of excitation and recombination processes were not evaluated quantitatively, since the corresponding reaction rates strongly depend on the electron temperature. In addition, spectrally resolved measurements of the emission light were not performed in this study. Instead, we adopted a fast camera to monitor visible emissions in the expander, from which we estimated the electron temperature qualitatively. Nevertheless, the observed emission patterns still provide qualitative insight into the detachment behaviour in the expander region.
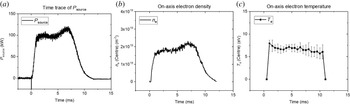
Waveforms of the plasma parameters under a typical discharge condition are shown in figure 3. For this discharge, the PFN voltage was set to 0.5 kV, while the magnetic field intensity was 0.088 T at the centre and 0.35 T at the mirror nozzle. Source gas was fed from $t_{{feed}}=-20\ {\rm to}\ 15\text{ ms}$
with a valve flow rate of 43.3 slm. Referencing t = 0 ms as the discharge trigger timing, the source power increased until 1.5 ms. The plasma then entered a relatively stable phase, during which the plasma parameters remained within approximately 10 % variation over the period from 1.5 to 7.5 ms. Based on this behaviour, the time window from 4 to 7 ms was selected for data analysis as a representative period with limited variation. After 7.5 ms, the source power decreased exponentially and the plasma was fully extinguished at approximately 12 ms. During the relatively steady phase, the typical plasma parameters were
$t_{{feed}}=-20\ {\rm to}\ 15\text{ ms}$
with a valve flow rate of 43.3 slm. Referencing t = 0 ms as the discharge trigger timing, the source power increased until 1.5 ms. The plasma then entered a relatively stable phase, during which the plasma parameters remained within approximately 10 % variation over the period from 1.5 to 7.5 ms. Based on this behaviour, the time window from 4 to 7 ms was selected for data analysis as a representative period with limited variation. After 7.5 ms, the source power decreased exponentially and the plasma was fully extinguished at approximately 12 ms. During the relatively steady phase, the typical plasma parameters were $P_{\textit{source}}\sim 102\text{ kW}$
,
$P_{\textit{source}}\sim 102\text{ kW}$
, $n_{{e}}\sim 2.0\times 10^{19}\;\mathrm{m}^{-3}$
and
$n_{{e}}\sim 2.0\times 10^{19}\;\mathrm{m}^{-3}$
and $T_{{e}}\sim 6.9\text{ eV}$
. The shot-to-shot variation under identical experimental conditions was below approximately 10 %, confirming the reproducibility of the discharge.
$T_{{e}}\sim 6.9\text{ eV}$
. The shot-to-shot variation under identical experimental conditions was below approximately 10 %, confirming the reproducibility of the discharge.
Time trace of (a) source power ( $\boldsymbol{P}_{{\boldsymbol{source}}}$
), (b) on-axis electron density and (c) electron temperature at the centre in typical discharge condition.
$\boldsymbol{P}_{{\boldsymbol{source}}}$
), (b) on-axis electron density and (c) electron temperature at the centre in typical discharge condition.

Figure 3. Long description
Panel A: A line graph shows the time trace of source power (P_source) in kilowatts (kW) over time in milliseconds (ms). The graph starts with a low power level, rises sharply to a peak around 50 kW, maintains this level for a few milliseconds, and then gradually decreases back to the initial low level. Panel B: A line graph displays the on-axis electron density (n_e) in meters cubed (m^-3) over time in milliseconds (ms). The electron density starts at a low value, increases rapidly to a peak around 3 x 10^19 m^-3, and then gradually decreases. Panel C: A line graph illustrates the on-axis electron temperature (T_e) in electron volts (eV) over time in milliseconds (ms). The electron temperature starts at a low value, rises to a peak around 10 eV, and then gradually decreases, with some fluctuations around the peak.
Since the plasma is in a nearly steady state in this period and the plasma is unstable at initial state when the gas is fed at the expander, data in this study were measured in 4–7 ms. Considering these parameters, the neutral residence time ( $\tau _{{n}}\sim ({L}/{v_{{n}})},\text{ where }L\;\text{is the system length},\;v_{{n}}=\text{neutral particle speed}$
) was estimated to be of the order of 0.1 ms. In addition, the ion–neutral collision time was estimated to be ∼0.03 ms, both of which are significantly shorter than the characteristic time of the discharge duration. These estimates suggest that the injected neutrals are uniformly distributed throughout each chamber and the local plasma–neutral interactions can approach a quasi-equilibrium state during the discharge. However, the characteristic time for neutral pressure recycling time is estimated to
$\tau _{{n}}\sim ({L}/{v_{{n}})},\text{ where }L\;\text{is the system length},\;v_{{n}}=\text{neutral particle speed}$
) was estimated to be of the order of 0.1 ms. In addition, the ion–neutral collision time was estimated to be ∼0.03 ms, both of which are significantly shorter than the characteristic time of the discharge duration. These estimates suggest that the injected neutrals are uniformly distributed throughout each chamber and the local plasma–neutral interactions can approach a quasi-equilibrium state during the discharge. However, the characteristic time for neutral pressure recycling time is estimated to $({V}/{S_{{pump}}})\sim 100\;\mathrm{ms}$
, which is much longer than the discharge duration. This indicates that global neutral recycling behaviour and plasma-wall neutral dynamics relevant to the tokamak divertor system cannot be fully reproduced in the present experiment.
$({V}/{S_{{pump}}})\sim 100\;\mathrm{ms}$
, which is much longer than the discharge duration. This indicates that global neutral recycling behaviour and plasma-wall neutral dynamics relevant to the tokamak divertor system cannot be fully reproduced in the present experiment.
3. Upgrades to the gas feed system
The typical particle flux in the downstream region of tokamaks is of the order of $10^{22-24}\,\mathrm{m}^{-2}\,\mathrm{s}^{-1}$
(Eich Reference Eich2013). In KAIMIR, the achievable particle flux level in the center chamber is
$10^{22-24}\,\mathrm{m}^{-2}\,\mathrm{s}^{-1}$
(Eich Reference Eich2013). In KAIMIR, the achievable particle flux level in the center chamber is ${\sim}4.0\times 10^{23}\;\mathrm{m}^{-2}\;\mathrm{s}^{-1}$
, while the level in the expander region was previously
${\sim}4.0\times 10^{23}\;\mathrm{m}^{-2}\;\mathrm{s}^{-1}$
, while the level in the expander region was previously ${\sim}0.3\times 10^{22}\;\mathrm{m}^{-2}\;\mathrm{s}^{-1}$
, lower than the typical flux range near the divertor plate, critical for divertor plasma studies. The limitation was mainly due to significant density reduction along the axial direction between the center and expander chambers, which can be caused by plasma–neutral interactions including momentum exchange or recombination. We observed that the particle flux decreases with increasing operating pressure, indicating that enhanced plasma–neutral collisions significantly degrade the axial particle transport. To mitigate this reduction, it was necessary to minimise the background neutral pressure during plasma initiation. This was achieved by optimising the source gas feed timing by reducing the time delay between the initiation of the gas feed and trigger of the plasma discharge (referenced as
${\sim}0.3\times 10^{22}\;\mathrm{m}^{-2}\;\mathrm{s}^{-1}$
, lower than the typical flux range near the divertor plate, critical for divertor plasma studies. The limitation was mainly due to significant density reduction along the axial direction between the center and expander chambers, which can be caused by plasma–neutral interactions including momentum exchange or recombination. We observed that the particle flux decreases with increasing operating pressure, indicating that enhanced plasma–neutral collisions significantly degrade the axial particle transport. To mitigate this reduction, it was necessary to minimise the background neutral pressure during plasma initiation. This was achieved by optimising the source gas feed timing by reducing the time delay between the initiation of the gas feed and trigger of the plasma discharge (referenced as $t=0$
ms). Shortening the delay suppresses excessive neutral diffusion from the source chamber into the centre region prior to plasma formation, thereby maintaining a lower operating pressure. In addition, increasing the flow rate capability of the valve allows the required pressure to be delivered within a shorter gas feed duration, which enables further reduction of the gas diffusion in the chamber before the discharge. Accordingly, the gas feeding system was modified to improve fuelling efficiency and enhance the particle flux in the expander region, enabling the achievement of divertor-relevant plasma conditions.
$t=0$
ms). Shortening the delay suppresses excessive neutral diffusion from the source chamber into the centre region prior to plasma formation, thereby maintaining a lower operating pressure. In addition, increasing the flow rate capability of the valve allows the required pressure to be delivered within a shorter gas feed duration, which enables further reduction of the gas diffusion in the chamber before the discharge. Accordingly, the gas feeding system was modified to improve fuelling efficiency and enhance the particle flux in the expander region, enabling the achievement of divertor-relevant plasma conditions.
To satisfy the breakdown condition of the plasma gun discharge, neutral gas needs to be fed prior to the initiation of the plasma. Minimising the delay of the gas feed is important especially in pulsed plasma discharge because fuel gas diffuses throughout the vacuum chamber during this delay, which increases the operation pressure and thus affects the plasma characteristics. To reduce the delay, a solenoid valve with a higher gas flow capacity than the piezo-electric valve used in previous experiments was newly installed to feed neutral gas. The solenoid valve can deliver a maximum flow rate of ∼100 slm at an inlet pressure of 10 bar, in contrast to the piezo-electric valve that can provide a maximum flow rate of approximately 13 slm. In this study, the typical flow rate of the solenoid valve was ∼43 slm with an inlet pressure of 4 bar. In addition, we improved the vacuum conductance of the gas feedline by shortening the length of the 1/4-inch Teflon tube between the gas feed valve and the gun from 2.0 m to 0.5 m. With this modification, the vacuum conductance was improved from 37 l s−1 to 170 l s−1. Increasing vacuum conductance enabled a more rapid pressure response to valve operation and minimised the delay of the gas feed. With the upgraded gas feed system, the start timing of the gas feed was shifted from −100 ms to −20 ms, and the gas feed duration was reduced from 100 ms to 5 ms under typical experimental conditions. As a result, the operation pressure in the center chamber was reduced from ∼9 mTorr to below 1 mTorr, which can significantly suppress undesired neutral interactions in the center chamber and enhance the particle flux.
The modification of the gas feed system, together with optimisation of the gas feed timing, significantly enhanced the particle flux at the downstream region, as shown in figure 4. The neutral pressure in the center chamber varied from 0.3 to 30 mTorr by adjusting the gas feed timing at the source, and the on-axis (R = 0 mm) particle fluxes in the centre and expander regions were compared for the piezo-electric and solenoid valves. As shown in figure 4(a), for the piezo-electric valve, the downstream particle flux was maximised around $P_{{n}}(\text{Centre})\;\approx\;4\,\text{mTorr}$
, which corresponds to a gas feed timing of
$P_{{n}}(\text{Centre})\;\approx\;4\,\text{mTorr}$
, which corresponds to a gas feed timing of $t_{{feed}}=-50\;{\rm to}\;0$
ms. For the solenoid valve, the flux was maximised around
$t_{{feed}}=-50\;{\rm to}\;0$
ms. For the solenoid valve, the flux was maximised around $P_{{n}}(\text{Centre})\;\approx 1.5\text{ mTorr}$
, corresponding to
$P_{{n}}(\text{Centre})\;\approx 1.5\text{ mTorr}$
, corresponding to $t_{{feed}}=-20\;{\rm to}\;10$
ms. With insufficient fuel gas, plasma gun operation cannot be maintained, resulting in a reduced particle flux in the centre region when
$t_{{feed}}=-20\;{\rm to}\;10$
ms. With insufficient fuel gas, plasma gun operation cannot be maintained, resulting in a reduced particle flux in the centre region when $P_{{n}}(\text{Centre})$
is too low. Once gun operation is maintained with an increased neutral pressure above a certain level, ∼1 mTorr for the solenoid valve and ∼4 mTorr for piezo-electric valve, the particle flux tends to decrease with neutral pressure in both center and expander chambers, as in figures 4(a) and 4(b). This reduction is attributed to enhanced plasma–neutral interactions such as ionisation, recombination and charge-exchange processes, which lead to particle and momentum losses during axial transport. The reduction is more significant in the expander region, as a gradual decrease in the flux ratio is observed with increasing neutral pressure in figure 4(c). This trend indicates stronger attenuation of the particle flux during axial transport towards the divertor target.
$P_{{n}}(\text{Centre})$
is too low. Once gun operation is maintained with an increased neutral pressure above a certain level, ∼1 mTorr for the solenoid valve and ∼4 mTorr for piezo-electric valve, the particle flux tends to decrease with neutral pressure in both center and expander chambers, as in figures 4(a) and 4(b). This reduction is attributed to enhanced plasma–neutral interactions such as ionisation, recombination and charge-exchange processes, which lead to particle and momentum losses during axial transport. The reduction is more significant in the expander region, as a gradual decrease in the flux ratio is observed with increasing neutral pressure in figure 4(c). This trend indicates stronger attenuation of the particle flux during axial transport towards the divertor target.
Particle flux (a) at the centre, (b) at the expander and (c) its ratio for varying neutral pressure at the centre with different gas feed valves.

In this experiment, we can quantify the effect of gas feed timing and valve type on the particle flux in the expander region. The reference condition using the piezo-electric valve corresponds to a gas feeding timing of $t_{{feed}}=-100\;{\rm to}\;0$
ms. Under this condition, the particle flux measured in the expander region was
$t_{{feed}}=-100\;{\rm to}\;0$
ms. Under this condition, the particle flux measured in the expander region was $0.32\times 10^{22}\;\mathrm{m}^{-2}\;\mathrm{s}^{-1}$
. By optimising the gas feed timing to
$0.32\times 10^{22}\;\mathrm{m}^{-2}\;\mathrm{s}^{-1}$
. By optimising the gas feed timing to $t_{{feed}}=-50\;{\rm to}\;0$
ms with the piezo-electric valve, the particle flux increased to approximately
$t_{{feed}}=-50\;{\rm to}\;0$
ms with the piezo-electric valve, the particle flux increased to approximately $1.2\times 10^{22}\;\mathrm{m}^{-2}\;\mathrm{s}^{-1}$
. Subsequently, replacing the piezo-electric valve with a solenoid valve further increased the particle flux to
$1.2\times 10^{22}\;\mathrm{m}^{-2}\;\mathrm{s}^{-1}$
. Subsequently, replacing the piezo-electric valve with a solenoid valve further increased the particle flux to $2.5\times 10^{22}\;\mathrm{m}^{-2}\;\mathrm{s}^{-1}$
under comparable pressure conditions. Although the neutral pressure at the measurement location was similar, the different gas injection schemes can lead to variations in the effective neutral density distribution and collisional environment along the plasma path. This may contribute to the observed difference in particle flux, as the solenoid valve provides more localised fuelling near the plasma gun region and thereby improves upstream fuelling efficiency. Together, optimisation of the gas feed timing combined with the modification of the valve resulted in an approximately eightfold increase in particle flux. These modifications allowed the achievable particle flux in the expander chamber to reach the range relevant to divertor plasma simulations (∼
$2.5\times 10^{22}\;\mathrm{m}^{-2}\;\mathrm{s}^{-1}$
under comparable pressure conditions. Although the neutral pressure at the measurement location was similar, the different gas injection schemes can lead to variations in the effective neutral density distribution and collisional environment along the plasma path. This may contribute to the observed difference in particle flux, as the solenoid valve provides more localised fuelling near the plasma gun region and thereby improves upstream fuelling efficiency. Together, optimisation of the gas feed timing combined with the modification of the valve resulted in an approximately eightfold increase in particle flux. These modifications allowed the achievable particle flux in the expander chamber to reach the range relevant to divertor plasma simulations (∼ $10^{22-24}\,\mathrm{m}^{-2}\,\mathrm{s}^{-1}$
) (Eich Reference Eich2013).
$10^{22-24}\,\mathrm{m}^{-2}\,\mathrm{s}^{-1}$
) (Eich Reference Eich2013).
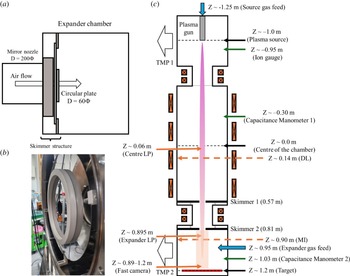
(a) Schematic and (b) image of the skimmer structure. (c) Schematic cross-sectional view of the KAIMIR device including the skimmer structure. LP, Langmuir probe; DL, diamagnetic loop; MI, microwave interferometer; TMP, turbomolecular pump.

Figure 5. Long description
Panel A: A schematic diagram of the skimmer structure, showing the expander chamber, mirror nozzle, circular plate, and air flow direction. Panel B: An image of the skimmer structure, displaying the physical setup and components. Panel C: A schematic cross-sectional view of the KAIMIR device, including the skimmer structure. The diagram labels various components such as the plasma gun, ion gauge, capacitance manometer, skimmers, Langmuir probe, diamagnetic loop, microwave interferometer, and turbomolecular pump. The positions of these components are indicated along the Z-axis, with specific distances marked for each component.
4. Implementation of a differential pumping system
4.1. Fabrication of the differential pumping system
In a linear divertor simulator, the impact of neutral leakage can have a stronger influence on the upstream region compared with that in tokamak experiments. For example, the parallel connection length from the outer midplane to the divertor target plate in typical tokamak devices is of the order of several tens of metres (10–50 m) (Eich Reference Eich2013), whereas in KAIMIR, it is approximately 1.2 m. As a result, neutrals introduced in the downstream (expander) region can propagate upstream and modify the source plasma conditions. If the upstream plasma is substantially affected by downstream gas injection, the observed power dissipation may reflect degradation of the source plasma rather than intrinsic radiative divertor physics. Moreover, uncontrolled neutral leakage restricts the accessible operation range in both the centre and expander regions, making it difficult to independently control both upstream and target conditions and to reproduce divertor-relevant plasma conditions. Therefore, independent control of neutral pressure in the center and expander chambers is essential to minimise upstream perturbations and to clearly observe the physical mechanisms associated with the radiative divertor.
To implement independent control of the neutral pressure between the centre and expander regions, two skimmer structures were installed to effectively block the neutral gas flow between the chambers (van Eck et al. Reference van Eck, Hansen, Kleyn, van der Meiden, Schram and Zeijlmans van Emmichoven2011), as shown in figure 5. The skimmer, consisting of an annular metal plate has geometry with an inner diameter of 60 mm and an outer diameter of 400 mm. The PEEK (polyetheretherketone) ring is installed between the skimmer and the mirror nozzle chamber to block small peripheral gaps and further suppress neutral leakage. PEEK is a vacuum-compatible polymer with low outgassing and excellent electrical insulation properties (Murari & Barzon Reference Murari and Barzon2004). By reducing leakage through the gaps between the skimmer and the surrounding chamber structures, the ring improves the differential pumping efficiency and helps maintain a higher neutral pressure in the expander chamber. Without the skimmer, the vacuum conductance from the source to the expander chamber was estimated to be ∼12 800 l s−1, whereas it was reduced to ∼480 l s−1 after installation of the skimmers. These values were obtained from an analytical model based on simplified geometric assumptions and molecular flow conditions. The estimated reduction in vacuum conductance suggests that neutral gas transport between the chambers can be significantly suppressed. In particular, the reduced conductance is expected to delay the propagation of pressure changes from the gas-fed chamber to the non-gas-fed chamber, thereby helping to maintain pressure separation during the ∼12 ms plasma discharge. However, this analytical estimate does not fully capture the actual conductance due to simplified assumptions, including the molecular flow approximation and geometric simplifications. Therefore, experimental validation of the conductance and the associated neutral equilibration dynamics is required and discussed in § 4.2. This reduction will demonstrate effective suppression of neutral gas transport between the chambers. In addition, a turbomolecular pump and a gas feed valve, identical to those used in the source chamber, were installed in the expander chamber. Here, ‘identical’ refers to the use of the same hardware components, whereas the installation geometry and function differ between the two locations. In the source chamber, the gas feed line is directly connected to the plasma gun, providing axial fuelling at R = 0. In contrast, in the expander chamber, gas is injected radially from the chamber wall to independently control the neutral pressure in the expander chamber.
Schematic cross-sectional view of the experimental condition of vacuum conductance estimation and temporal evolution of neutral pressure at the centre and expander.

4.2. Performance of the differential pumping system
The change in vacuum conductance due to the installation of the skimmer was experimentally evaluated, together with the associated neutral equilibration. Without operating the pumping system, gas was injected into the expander chamber, and the temporal evolution of the neutral pressure in both the expander and center chambers was measured to determine the equilibration process. The pressure difference between the chambers was observed to decay approximately exponentially and the vacuum conductance was estimated from the decay time using the following relations.
 \begin{equation} \frac{{\rm d}\!\left({P}_{\text{n},\text{Centre}}\right)}{{\rm d}t}=\frac{C\!\left({P}_{\text{n},\text{Expander}}-{P}_{\text{n},\text{Centre}}\right)}{V_{{Centre}}}=\frac{C{\unicode[Arial]{x0394}} P_{{n}}}{V_{{Centre}}} \end{equation}
 \begin{equation} \frac{\textrm{d}\!\left(\mathrm{P}_{\text{n},\text{Expander}}\right)}{{\rm d}t}=-\frac{C{\unicode[Arial]{x0394}} P_{{n}}}{V_{{Expander}}}\rightarrow \frac{{\rm d}{\unicode[Arial]{x0394}} P_{{n}}}{{\rm d}t}=C{\unicode[Arial]{x0394}} P_{{n}}\!\left(\frac{1}{V_{{Centre}}}+\frac{1}{V_{{Expander}}}\right)\!. \end{equation}
Thus, the conductance can be expressed as
 \begin{equation} C=\frac{1}{\tau _{{decay}}}\;\left(\frac{1}{V_{{Centre}}}+\frac{1}{V_{{Expander}}}\right)\!. \end{equation}
Using this method, the vacuum conductance was estimated to be 3647 $\mathrm{l}\,\mathrm{s}^{-1}$
without the skimmer and decreased to 1083
$\mathrm{l}\,\mathrm{s}^{-1}$
without the skimmer and decreased to 1083 $\mathrm{l\,s}^{-1}$
with the skimmer. These values differ from the analytically estimated conductance, which is attributed to simplified assumptions in the analytical model, including the molecular flow approximation and geometric simplifications. More importantly, the estimated equilibrium time was found to be of the order of several tens of milliseconds when the skimmer is installed. This time scale is significantly longer than the discharge duration (∼12 ms), indicating that full pressure equilibration cannot be achieved during the discharge. As a result, the reduced vacuum conductance effectively delays the propagation of pressure changes between the chambers and maintains pressure separation throughout the discharge period.
$\mathrm{l\,s}^{-1}$
with the skimmer. These values differ from the analytically estimated conductance, which is attributed to simplified assumptions in the analytical model, including the molecular flow approximation and geometric simplifications. More importantly, the estimated equilibrium time was found to be of the order of several tens of milliseconds when the skimmer is installed. This time scale is significantly longer than the discharge duration (∼12 ms), indicating that full pressure equilibration cannot be achieved during the discharge. As a result, the reduced vacuum conductance effectively delays the propagation of pressure changes between the chambers and maintains pressure separation throughout the discharge period.
The temporal evolution of the neutral pressure was measured with and without the skimmer when gas was fed either at the source or at the expander to evaluate the performance of the skimmer. The results for gas fed at the source using a piezo-electric valve ( $t_{{feed}}$
= −100 to 0 ms) are shown in figure 7. High-frequency oscillations observed in the pressure traces for the case without the skimmers were identified as electrical noise arising from grounding issues in the measurement system. This noise does not reflect the physical behaviour of the neutral pressure and does not affect the interpretation of the results. Without the skimmer, gas injection into the source chamber resulted in nearly identical pressure evolution in the source, center and expander chambers, indicating fast diffusion of neutrals throughout the chambers. In contrast, when the skimmer was installed, the pressure rise in the source and centre was significantly faster than that in the expander chamber for approximately 20 ms. This difference indicates that the skimmer can reduce the gas diffusion speed and make pressure rise above the measurable range (
$t_{{feed}}$
= −100 to 0 ms) are shown in figure 7. High-frequency oscillations observed in the pressure traces for the case without the skimmers were identified as electrical noise arising from grounding issues in the measurement system. This noise does not reflect the physical behaviour of the neutral pressure and does not affect the interpretation of the results. Without the skimmer, gas injection into the source chamber resulted in nearly identical pressure evolution in the source, center and expander chambers, indicating fast diffusion of neutrals throughout the chambers. In contrast, when the skimmer was installed, the pressure rise in the source and centre was significantly faster than that in the expander chamber for approximately 20 ms. This difference indicates that the skimmer can reduce the gas diffusion speed and make pressure rise above the measurable range ( $\gt$
1 mTorr) of the capacitance manometer slower in the expander region.
$\gt$
1 mTorr) of the capacitance manometer slower in the expander region.
Temporal evolution of neutral pressure in the source, center and expander chamber when gas was fed into the source chamber from −100 to 0 ms using a piezo-electric valve (a) without the skimmer and (b) with the skimmer. The shaded region indicates the gas feed timing.

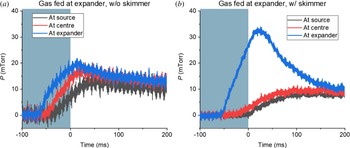
Temporal evolution of neutral pressure in the source, center and expander chamber when gas was fed into the expander chamber from −100 to 0 ms using a piezo-electric valve (a) without the skimmer and (b) with the skimmer. The shaded region indicates the gas feed timing.

Figure 8 shows the temporal evolution of the neutral pressure in each chamber when gas was injected into the expander chamber. The identical piezo-electric valve employed in figure 7 ( $t_{feed}$
= −100 to 0 ms) was also applied in figure 8. Without the skimmer, the pressure rise in the source, center and expander chambers has 10 ms delay, indicating fast diffusion of neutrals through the chambers. However, the pressure in the expander increased rapidly, while the pressure rise in the source and center chambers was delayed by approximately 60 ms with the skimmer. This difference indicates that the differential pumping system effectively suppressed neutral leakage from the expander chamber to the upstream region and enabled more independent control of the neutral pressure between the chambers during plasma discharge, which lasts ∼12 ms. Additionally, due to the reduced neutral leakage towards the upstream region, neutral gas was retained more effectively in the expander region, allowing the maximum neutral pressure to increase from 20 mTorr to 33 mTorr during the discharge under identical gas feed conditions.
$t_{feed}$
= −100 to 0 ms) was also applied in figure 8. Without the skimmer, the pressure rise in the source, center and expander chambers has 10 ms delay, indicating fast diffusion of neutrals through the chambers. However, the pressure in the expander increased rapidly, while the pressure rise in the source and center chambers was delayed by approximately 60 ms with the skimmer. This difference indicates that the differential pumping system effectively suppressed neutral leakage from the expander chamber to the upstream region and enabled more independent control of the neutral pressure between the chambers during plasma discharge, which lasts ∼12 ms. Additionally, due to the reduced neutral leakage towards the upstream region, neutral gas was retained more effectively in the expander region, allowing the maximum neutral pressure to increase from 20 mTorr to 33 mTorr during the discharge under identical gas feed conditions.
We also investigated the changes in the upstream plasma with gas feed at the expander depending on skimmer installation. Figure 9 shows the neutral pressure, ion saturation current (I sat ) and stored energy per unit length (W/L) in the center chamber, averaged over t = 4–7 ms during the discharge, where t = 0 corresponds to the discharge initiation time. The error bars represent the standard deviation over this time interval in this study, and possible systematic and calibration errors were not explicitly included in this study. However, these errors are not expected to significantly affect the overall trends and conclusions presented in this study. We first confirmed that the neutral pressures in the center and expander chambers could be independently controlled when the skimmer was installed, as shown in figure 9(a). Without the skimmer, I sat decreased by approximately 80 %, and the stored energy per unit length decreased by approximately 75 % as the expander neutral pressure increased to 25 mTorr. In contrast, with the skimmer installed, the reductions in I sat and stored energy per unit length in the center chamber were limited to approximately 20 %–25 % over the same pressure range. These results indicate that neutral leakage into the center chamber directly contributed to reductions in the particle flux and plasma energy in the upstream region. This extends the accessible neutral pressure range in the expander region while minimising perturbations to the upstream plasma. It should be noted that the remaining variation can still influence plasma behaviour in the expander region and therefore should be considered when interpreting trends in divertor-simulating plasma.
(a) Neutral pressure at the centre region, (b) ion saturation current (I sat) at the centre and (c) stored energy per length for varying neutral pressure at the expander region (dataset averaged 4–7 ms; error bars indicate standard deviation over this interval).

Figure 9. Long description
Panel A: A scatter plot depicts the change in neutral pressure at the center region as a function of neutral pressure at the expander. The x-axis represents the neutral pressure at the expander in millitorr (mTorr), and the y-axis represents the neutral pressure at the center in millitorr (mTorr). Two datasets are shown: one with a skimmer (black squares) and one without a skimmer (red circles). The data points indicate varying pressures, with error bars representing standard deviation. Panel B: A scatter plot shows the ion saturation current at the center as a function of neutral pressure at the expander. The x-axis represents the neutral pressure at the expander in millitorr (mTorr), and the y-axis represents the ion saturation current in amperes (A). Two datasets are shown: one with a skimmer (black squares) and one without a skimmer (red circles). The data points indicate varying currents, with error bars representing standard deviation. Panel C: A scatter plot depicts the stored energy per length as a function of neutral pressure at the expander. The x-axis represents the neutral pressure at the expander in millitorr (mTorr), and the y-axis represents the stored energy per length in joules per meter (J/m). Two datasets are shown: one with a skimmer (black squares) and one without a skimmer (red circles). The data points indicate varying stored energies, with error bars representing standard deviation.
5. Divertor simulation experiments
Following the upgrades made to the KAIMIR device, experiments were conducted to observe power dissipation in the downstream region of the radiative divertor and simulate plasma detachment. In the experiments, helium was used both for plasma discharge and for additional gas feeding into the expander chamber. To investigate changes in the expander plasma, the line-integrated electron density ( $\overline{n}_{{e}}$
) and
$\overline{n}_{{e}}$
) and $I_{sat}$
at the expander were measured while varying the neutral pressure by adjusting the gas feed timing. Similar to figure 9, the error bars for I
sat
and
$I_{sat}$
at the expander were measured while varying the neutral pressure by adjusting the gas feed timing. Similar to figure 9, the error bars for I
sat
and $\overline{n}_{{e}}$
were calculated from the standard deviation over the averaging time interval. As shown in figure 10, both the line-integrated density and I
sat exhibited a clear non-monotonic dependence on the neutral pressure in the expander chamber. This rollover behaviour is consistent with the increased volumetric power loss and recombination processes expected during plasma detachment (Krasheninnikov et al. Reference Krasheninnikov, Kukushkin and Pshenov2016), which has also been observed in other linear plasma devices (Ohno Reference Ohno2001; Hayashi Reference Hayashi2025). Both
$\overline{n}_{{e}}$
were calculated from the standard deviation over the averaging time interval. As shown in figure 10, both the line-integrated density and I
sat exhibited a clear non-monotonic dependence on the neutral pressure in the expander chamber. This rollover behaviour is consistent with the increased volumetric power loss and recombination processes expected during plasma detachment (Krasheninnikov et al. Reference Krasheninnikov, Kukushkin and Pshenov2016), which has also been observed in other linear plasma devices (Ohno Reference Ohno2001; Hayashi Reference Hayashi2025). Both $\overline{n}_{{e}}$
and
$\overline{n}_{{e}}$
and $I_{sat}$
increased and reached maximum values at P
n
= 5–10 mTorr, which is attributed to an enhanced ionisation rate,
$I_{sat}$
increased and reached maximum values at P
n
= 5–10 mTorr, which is attributed to an enhanced ionisation rate, $R_{ion}\propto n_{{e}}n_{{n}}\langle \sigma v\rangle$
, resulting from the increase in neutral density. Similar results were observed in the previous study in NAGDIS-II and Magnum-PSI, showing that the electron density reached a maximum near 6 and 15 mTorr, respectively, and decreased at higher pressures. As the neutral pressure increased further to 10–20 mTorr, the electron density gradually decreased, followed by a more rapid drop in the range of 25–30 mTorr. This behaviour suggests enhanced radiative power dissipation associated with recombination-dominated plasma, which is consistent with the fundamental mechanisms of a radiative divertor. At pressures above 30 mTorr, the electron density approached nearly zero, suggesting the onset of plasma detachment. In this regime, the rate of density reduction becomes smaller compared with that in the 25–30 mTorr range, implying that additional gas feeding becomes less effective at higher pressures. These distinct slope changes across different pressure ranges indicate a transition from an attached plasma state to a partially detached and ultimately fully detached regime.
$R_{ion}\propto n_{{e}}n_{{n}}\langle \sigma v\rangle$
, resulting from the increase in neutral density. Similar results were observed in the previous study in NAGDIS-II and Magnum-PSI, showing that the electron density reached a maximum near 6 and 15 mTorr, respectively, and decreased at higher pressures. As the neutral pressure increased further to 10–20 mTorr, the electron density gradually decreased, followed by a more rapid drop in the range of 25–30 mTorr. This behaviour suggests enhanced radiative power dissipation associated with recombination-dominated plasma, which is consistent with the fundamental mechanisms of a radiative divertor. At pressures above 30 mTorr, the electron density approached nearly zero, suggesting the onset of plasma detachment. In this regime, the rate of density reduction becomes smaller compared with that in the 25–30 mTorr range, implying that additional gas feeding becomes less effective at higher pressures. These distinct slope changes across different pressure ranges indicate a transition from an attached plasma state to a partially detached and ultimately fully detached regime.
(a) Line-integrated density ( $\overline{\boldsymbol{n}}_{\boldsymbol{e}}$
) and (b) ion saturation current (I
sat) measured at the expander for varying neutral pressure at the expander (dataset averaged for 4–7 ms; error bars indicate standard deviation over this interval).
$\overline{\boldsymbol{n}}_{\boldsymbol{e}}$
) and (b) ion saturation current (I
sat) measured at the expander for varying neutral pressure at the expander (dataset averaged for 4–7 ms; error bars indicate standard deviation over this interval).

Visible light emission in the expander chamber was monitored using a fast camera (Chronos 2.1 HD) sensitive to wavelengths in the 350–1100 nm range without an infrared filter. The camera employs an RGB sensor with wavelength-dependent sensitivity across the measured wavelength range, which introduces spectral weighting in the measured emission. To capture the global emission structure, images were recorded at a frame rate of 1 kHz at a spatial resolution of 1920 × 1080 pixels. The local spatial scale of the images was 0.125 mm pixel−1. The exposure time was set to 100 $\unicode{x03BC}s$
for each frame, corresponding to 10 % of the frame interval. The analogue gain was set to 6 dB, while the digital gain was set to 0 dB. Background subtraction or sensitivity calibration was not applied in this study. Therefore, the measured signal represents a broadband, line-integrated emission that may include contributions from multiple spectral components as well as stray light, including reflections from internal structures such as probes and skimmers. Accordingly, the images are used for qualitative interpretation of the emission structure and its evolution with neutral pressure. Nevertheless, these effects did not influence the key features in the findings discussed in this study, such as changes in overall emission profiles. Significant changes in the emission profile were observed as neutral pressure increased, as shown in figure 11(a–d). Only quiescent background light was observed without gas feeding at P
n
$\unicode{x03BC}s$
for each frame, corresponding to 10 % of the frame interval. The analogue gain was set to 6 dB, while the digital gain was set to 0 dB. Background subtraction or sensitivity calibration was not applied in this study. Therefore, the measured signal represents a broadband, line-integrated emission that may include contributions from multiple spectral components as well as stray light, including reflections from internal structures such as probes and skimmers. Accordingly, the images are used for qualitative interpretation of the emission structure and its evolution with neutral pressure. Nevertheless, these effects did not influence the key features in the findings discussed in this study, such as changes in overall emission profiles. Significant changes in the emission profile were observed as neutral pressure increased, as shown in figure 11(a–d). Only quiescent background light was observed without gas feeding at P
n $\approx$
0.4 mTorr shown as figure 11(a). Following gas feed into the expander, the pressure increased to P
n
$\approx$
0.4 mTorr shown as figure 11(a). Following gas feed into the expander, the pressure increased to P
n $\approx$
5.0 mTorr, which is the case shown in figure 11(b), and the plasma column became clearly visible, indicating enhanced plasma–neutral interaction. As the pressure increases further, figures 11(c) and 11(d) show that the emission intensity became weaker at P
n
$\approx$
5.0 mTorr, which is the case shown in figure 11(b), and the plasma column became clearly visible, indicating enhanced plasma–neutral interaction. As the pressure increases further, figures 11(c) and 11(d) show that the emission intensity became weaker at P
n $\approx$
26 mTorr and further diminished near the target at 32 mTorr, respectively. This reduction suggests strong plasma cooling and onset of detachment-like conditions due to significant energy losses from the radiation in the target region. This behaviour demonstrates that the system can simulate the characteristics of a radiative divertor.
$\approx$
26 mTorr and further diminished near the target at 32 mTorr, respectively. This reduction suggests strong plasma cooling and onset of detachment-like conditions due to significant energy losses from the radiation in the target region. This behaviour demonstrates that the system can simulate the characteristics of a radiative divertor.
(a–d) Fast camera images and (e) axial profile of emission intensity for varying neutral pressure.

Figure 11. Long description
Panel A: A fast camera image showing a plasma flow with labels indicating the probe, skimmer, and target. The neutral pressure in the expander is approximately 0.4 mTorr. Panel B: Another fast camera image with a visible plasma flow and a label indicating the neutral pressure in the expander is approximately 5 mTorr. Panel C: A fast camera image showing plasma flow with the neutral pressure in the expander at approximately 26 mTorr. Panel D: A fast camera image with the neutral pressure in the expander at approximately 32 mTorr. Panel E: A line graph showing the axial profile of emission intensity for varying neutral pressures. The x-axis represents the distance (Z) in meters, and the y-axis represents the intensity in arbitrary units (a.u.). The graph includes four lines representing different neutral pressures: 0.4 mTorr (black), 5.0 mTorr (red), 26 mTorr (blue), and 32 mTorr (green). The probe and skimmer positions are marked on the graph. The intensity peaks near the probe and decreases along the distance for all pressures, with higher pressures showing lower peak intensities.
For quantitative analysis, the RGB values of the pixels were summed to obtain the total visible emission intensity. Then data within the radial range of R = 421–460 pixels (corresponding to R = ±5 mm) were averaged to evaluate the on-axis emission intensity. The resulting axial intensity profiles shown in figure 11(e) clearly demonstrate the pressure-dependent axial profile of the plasma radiation.
As the neutral pressure increased, the maximum emission intensity initially rose by a factor of 3.5 from P
n $\approx$
0.4 mTorr to 5 mTorr. With further increase in neutral pressure, the axial emission intensity maximised at P
n
$\approx$
0.4 mTorr to 5 mTorr. With further increase in neutral pressure, the axial emission intensity maximised at P
n $\approx$
26 mTorr. At P
n
$\approx$
26 mTorr. At P
n $\approx$
32 mTorr, the intensity was reduced to nearly half, which also indicates a substantial loss of plasma energy and supports the onset of detachment-like behaviour close to the divertor plate. Here, the outward shift of the emission peak observed at P
n
$\approx$
32 mTorr, the intensity was reduced to nearly half, which also indicates a substantial loss of plasma energy and supports the onset of detachment-like behaviour close to the divertor plate. Here, the outward shift of the emission peak observed at P
n $\approx$
26 mTorr may be partially affected by stray light reflection from the skimmer under high emission conditions. Also, the slopes of the axial emission profiles changed as the neutral pressure increased. The axial emission profile became steeper at neutral pressure above 26 mTorr. In particular, at P
n
$\approx$
26 mTorr may be partially affected by stray light reflection from the skimmer under high emission conditions. Also, the slopes of the axial emission profiles changed as the neutral pressure increased. The axial emission profile became steeper at neutral pressure above 26 mTorr. In particular, at P
n $\approx$
26 and 32 mTorr, the emission intensity at Z = 1.08 m decreased by 35 % and 50 %, respectively, compared with the level at Z = 0.9 m. In contrast, only a 12 % and 18 % reduction was observed at P
n
$\approx$
26 and 32 mTorr, the emission intensity at Z = 1.08 m decreased by 35 % and 50 %, respectively, compared with the level at Z = 0.9 m. In contrast, only a 12 % and 18 % reduction was observed at P
n $\approx$
0.4 and 5 mTorr, respectively. This enhanced axial reduction in the intensity suggests a transition toward plasma detachment near the target region. Because the viewing geometry did not allow simultaneous observation of the target plate, additional fast-camera measurements were performed during separate discharges to examine the emission behaviour closer to the divertor plate.
$\approx$
0.4 and 5 mTorr, respectively. This enhanced axial reduction in the intensity suggests a transition toward plasma detachment near the target region. Because the viewing geometry did not allow simultaneous observation of the target plate, additional fast-camera measurements were performed during separate discharges to examine the emission behaviour closer to the divertor plate.
The emission profile near the divertor plate also varied significantly with changes in neutral pressure, as shown in figure 12. The emission intensity increased notably after gas injection, but decreased at higher pressures, consistent with the results in figure 11. At P
n $\approx$
2 mTorr, the emission intensity was uniform along the axis. In contrast, a gradual decrease in intensity was observed near the plate at P
n
$\approx$
2 mTorr, the emission intensity was uniform along the axis. In contrast, a gradual decrease in intensity was observed near the plate at P
n $\approx$
26 mTorr. At higher pressure (P
n
$\approx$
26 mTorr. At higher pressure (P
n $\approx$
35 mTorr), the emission intensity along the axis became very low and bluish light was generated at the target, which was not generated at lower pressures.
$\approx$
35 mTorr), the emission intensity along the axis became very low and bluish light was generated at the target, which was not generated at lower pressures.
Visible light emission profiles at the target region (Z ∼ 1.0–1.2 m) for varying neutral pressure to (a) 0.4 mTorr, (b) 2 mTorr, (c) 26 mTorr and (d) 35 mTorr.

Axial intensity profiles of (a) red and (b) blue channels obtained from the fast camera (R = ±5 mm pixels were used, dataset averaged for 4–7 ms).

This change in colour can be attributed to the transition of the dominant reaction process in the plasma column from the attached to the detached regime. Since the spectral range of the fast camera is 350–1100 nm without an infrared filter, changes in emission colour can be distinguished. To quantify this change, the intensities of the red and blue channels were compared within the R = ±5 mm, as shown in figure 13. The red channel has high quantum efficiency in the wavelength of 550–800 nm, and the blue channel is sensitive to 360–500 nm. As the neutral pressure increases, the emission near the target region exhibits a clear enhancement in the blue channel relative to the red channel, indicating a localised change in emission characteristics. In the attached regime, plasma recycling near the target is dominated by excitation and ionisation processes, resulting in emission primarily in the long-wavelength range (600–800 nm). Plasma recycling was active near the target in the attached regime, where excitation and ionisation processes were still dominant similar to the upstream region. As the neutral pressure in the expander chamber increases, enhanced plasma–neutral interactions may reduce the electron temperature and can lead to the onset of detachment. Under these conditions, volumetric recombination processes become significant, shifting the emission towards shorter wavelengths in the blue spectral region (∼400 nm) (Griener Reference Griener2017). These observations provide supporting evidence for the onset of plasma detachment near the target region with increasing neutral pressure.
In figure 14, the upstream electron density varied by adjusting the source power from 30 to 160 kW, and the transition behaviour varying expander neutral pressure was monitored. The transition pressure to the detachment-like regime was found to be largely independent of the upstream electron density. As the neutral pressure in the expander chamber increased, the ion saturation current in the center chamber decreased only slightly, whereas a clear rollover of the ion saturation current was consistently observed in the expander chamber over the entire source power range. Moreover, the ratio of the particle flux reaching the expander relative to the centre remained within the experimental uncertainty for different source powers. The ratio was approximately 0.1 up to 20 mTorr, followed by a steep drop in the range 25–35 mTorr and a levelling off at approximately 0.01 at higher pressures. These results indicate that the observed regime transition is largely independent of the source power or upstream electron density. Since the source power is controlled by the PFN voltage, this result also suggests that variations in the applied gun bias have a limited effect on the transition to the detachment-like regime under the present operating conditions. Instead, the transition is primarily governed by the neutral pressure in the expander region, which enhances power dissipation and leads to a reduction in the target electron temperature. At first, this behaviour appears different from the behaviour in a tokamak, where detachment onset is typically characterised by a threshold separatrix density, i.e. an upstream density limit (Pitcher & Stangeby Reference Pitcher and Stangeby1997). However, in tokamak plasmas, increasing upstream density simultaneously enhances recycling and raises the divertor neutral pressure, making it difficult to separate density effects from neutral trapping. Experimental studies have shown that the separatrix density required for detachment varies significantly with divertor geometry and closure, reflecting changes in neutral trapping and compression rather than a universal upstream density threshold (Moser et al. Reference Moser, Casali, Covele, Leonard, McLean, Shafer, Wang and Watkins2020). The results in figure 10 therefore support the interpretation that detachment onset is fundamentally governed by downstream neutral conditions and the associated volumetric power dissipation, as the linear device configuration enables a clear separation between the effects of upstream density and neutral pressure.
Ion saturation current I sat (a) at the centre, (b) at the expander and (c) their ratio for varying source power (dataset averaged for 4–7 ms; error bars indicate standard deviation over this interval).

Figure 14. Long description
Panel A: A scatter plot shows ion saturation current at the center for varying source power. The horizontal axis represents Pn (Expander) in mTorr, and the vertical axis represents Isat (Center) in unspecified units. The plot includes data points for three different source powers: 30 kW, 90 kW, and 160 kW, each represented by different symbols and colors. Panel B: Another scatter plot shows ion saturation current at the expander for varying source power. The horizontal axis represents Pn (Expander) in mTorr, and the vertical axis represents Isat (Expander) in unspecified units. Similar to Panel A, it includes data points for three different source powers: 30 kW, 90 kW, and 160 kW, each represented by different symbols and colors. Panel C: A scatter plot depicts the particle flux ratio for varying source power. The horizontal axis represents Pn (Expander) in mTorr, and the vertical axis represents the particle flux ratio. The plot includes data points for three different source powers: 30 kW, 90 kW, and 160 kW, each represented by different symbols and colors.
6. Summary and future work
A radiative divertor simulator using the KAIMIR magnetic mirror device has been successfully developed. As part of the development, the gas feed system was upgraded to enhance the target particle flux, and a differential pumping system employing skimmer structures was implemented to enable independent control of neutral pressure in the centre and expander regions. Installation of the differential pumping system reduced the vacuum conductance between the chambers by more than one order of magnitude, allowing the expander neutral pressure to increase from 22 mTorr without the skimmer to approximately 70 mTorr with the skimmer, while minimising perturbations to the upstream plasma. The device enables radiative divertor simulations under various magnetic configurations with independent control of the magnetic field strength at the centre and in the mirror nozzle. Upstream plasma parameters are also well regulated, clarifying investigation of gas feeding effects in the expander chamber using a differential pumping system. In addition, a cylindrical geometry of the chamber provides diagnostic accessibility, facilitating detailed observation of plasma behaviour.
As the neutral pressure in the expander region increased, we observed a clear rollover of the ion saturation current and a strong reduction in particle flux to the downstream region, indicating mitigation of the particle flux and suggesting a transition from attached to detached plasma regimes. The transition was mainly affected by neutral pressure and was independent of the upstream electron density. Fast camera imaging provided supporting evidence of enhanced radiative emissions at low electron temperature near the target under detached conditions, consistent with volumetric recombination-dominated plasma behaviour in helium. These results demonstrate that the upgraded KAIMIR device can reproduce the main characteristics of a radiative divertor configuration and reproduce detached divertor plasmas under controlled experimental conditions.
Experimental results in this study were obtained with helium plasma, and are relevant to the studies of helium ash transport and dynamics in the divertor region. Extension to hydrogen as the source plasma is under preparation to enable comparison between EIR and MAR effects (Ohno et al. Reference Ohno, Ezumi, Takamura, Krasheninnikov and Pigarov1998) on power dissipation. Future work will also focus on the development of quantitative spectroscopic diagnostics to enable reliable electron temperature estimation in detached plasmas.
Acknowledgements
The authors would like to thank all collaborators who contributed to the experiments and discussions.
Editor Cary Forest thanks the referees for their advice in evaluating this article.
Funding
This work was supported by the National Research Foundation of Korea (NRF) funded by the Korea government (Ministry of Science and ICT) (RS-2022-00155956, RS-2023-00212124) and by Korea Hydro & Nuclear Power Co., LTD (No. 2024-Tech-15).
Declaration of interests
The authors report no conflict of interest.
 q||u/t
 qlossothers
 qrec.
qrec. qe
qe ϵ
ϵ Γt
Γt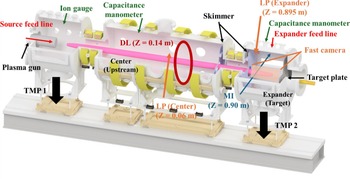
 Psource




 n¯e
n¯e


 Open access

