





Introduction
In organic wheat (Triticum aestivum L.) cultivation systems, the application of chemical fertilizers, synthetic pesticides, and plant growth regulators is strictly prohibited. This regulatory constraint often leads to increased weed species diversity, population density, and biomass accumulation within fields. This challenge is particularly severe at our study site, located in the Hetao Irrigation District of Inner Mongolia. Here, flood irrigation relies on a crisscrossing network of canals, which spreads weed seeds into the fields, leading to severe weed infestations. The resulting weed community is dominated by highly competitive species, primarily common lambsquarters (Chenopodium album L.), followed by barnyardgrass [Echinochloa crus-galli (L.) P. Beauv.] and redroot pigweed (Amaranthus retroflexus L.). Weed communities persist throughout the entire growth cycle of organic wheat, establishing intense interspecific competition that limits the crop’s access to essential resources including spatial occupancy, solar radiation, water availability, and nutrient acquisition (Chauhan et al. Reference Chauhan, Singh and Mahajan2012; Meulen and Chauhan Reference Meulen and Chanhan2017). Such competitive interactions adversely affect the population architecture, photosynthetic efficiency, and root development of wheat plants (Kaur et al. Reference Kaur, Sachan and Sharma2021; Peigné et al. Reference Peigné, Ball, Roger-Estrade and David2007). Consequently, these physiological and ecological constraints lead to significant reductions in both grain productivity and quality parameters (Chauhan and Johnson Reference Chauhan and Johnson2011; Kruidhof et al. Reference Kruidhof, Bastiaans and Kropff2008; Ryan et al. Reference Ryan, Smith, Mortensen, Teasdale, Curran, Seidel and Shumway2009). Enhancing the competitiveness of organic wheat through agronomic and genetic improvements therefore represents a pivotal research priority for sustainable organic cereal production systems.
Research has demonstrated that sowing width and row spacing configuration exert critical regulatory effects on both individual wheat development and population dynamics, fundamentally determining the crop’s competitive potential (Balkcom et al. Reference Balkcom, Price, Van Santen, Delaney, Boykin, Arriaga, Bergtold, Komecki and Raper2010; Liu et al. Reference Liu, Wang, Lin, Gu and Wang2020). In the Hetao Irrigation District, conventional wheat cultivation employs narrow-width drilling, which is characterized by a narrow sowing width (typically 2 to 3 cm) and a row spacing of 15 cm. However, this sowing method is problematic, as wide row spacing leaves large areas of bare ground exposed, especially during the early growth stages of wheat, creating a suitable environment for weed germination and growth. On the other hand, it concentrates seedlings into narrow band, leading to high local plant density and intense intraspecific competition (G Zhao et al. Reference Zhao, Fan, Li, Zhang, Dang, Li, Wang, Wang, Chen and Ni2020; QL Zhao et al. Reference Zhao, Sun, Lin, Ren, Wang, Zhang and Gao2021). This intraspecific competition can weaken individual wheat plants, ultimately reducing their competitive strength against weeds.
As an innovative cultivation strategy integrating agronomic practices with mechanized sowing technology, wide-range sowing (a method where seeds are distributed across a wide band or fully unform) demonstrates distinct technical advantages over conventional methods. Through expanding the sowing width and reducing the row spacing to optimize the plant’s spatial arrangement, this approach effectively addresses the “narrow-width, wide-row” limitations of traditional drilling. This creates more balanced above- and belowground spatial conditions for individual plants, allowing for better utilization efficiency of resources, including photosynthetically active radiation, soil moisture, and mineral nutrients. This spatial optimization effectively balances the competition between individual plants and the crop population, thereby creating a rational and high-yielding crop stand (He et al. Reference He, Zhang, Shi and Yu2024; Shi et al. Reference Shi, Chu, Yin, He, Deng, Zhang, Sun, Tian and Dai2018; Li et al. Reference Li, Bian, Liu, Ma and Liu2015; Wang et al. Reference Wang, Jia, Luo, Hao, Zhang and Shi2023). Studies show that compared with conventional drilling, wide-range sowing significantly enhances tiller survival rates, improves dry matter accumulation and partitioning efficiency, and develop an optimized canopy structure. Furthermore, this method also extends the functional persistence of photosynthetic activity while promoting root growth and distribution (Fan et al. Reference Fan, Liu, Zhao, Ma and Li2019; Li et al. Reference Li, Feng, Wang, Wang and Guo2013; Wang et al. Reference Wang, Jia, Luo, Hao, Zhang and Shi2023; Zhang et al. Reference Zhang, Hua, Liu, He, Ju and Dai2022). Evidently, by optimizing the spatial layout and population structure of wheat, wide-range sowing mediates competitive relationships both of wheat (intraspecific) and wheat–weed (interspecific), thereby establishing resource competitiveness within wheat populations. Previous study within conventional cropping systems has investigated the impacts of wide-range sowing on wheat population architecture and photosynthetic efficiency. It has established that optimized sowing width can enhance spatial niche partitioning while mitigating intra-crop competition pressures.
Our preliminary investigations revealed that wide-range sowing is beneficial for organic wheat in constructing a reasonable canopy structure, thereby enhancing its competitiveness for aboveground light and spatial resources (Zhao et al. Reference Zhao, Han, Li, Sheng, Xie, Wu and Zhang2023). Nevertheless, the regulatory effects of sowing width on organic wheat root development and the resulting nutrient competition between the wheat and weeds remain unclear. Therefore, this research aimed to clarify the regulatory effects of wide-range sowing on nutrient competition, thus providing a theoretical basis for enriching the weed control technology system for organic wheat, while also providing mechanistic insights into regulation of belowground competition in organic cereal systems.
Materials and Methods
Study Site
A field experiment (2019 to 2020) was conducted under certified organic management at the Jianzidi Organic Experimental Station, situated in the Hangjin Hou region of Bayannur City, Inner Mongolia, China (40.75°N, 106.58°E). The experimental site has maintained continuous organic certification since 2012, with strict exclusion of synthetic agrochemical inputs during this period. The soil type at the experimental field is an irrigation silting soil, classified as having a loamy texture; the basic fertility of the 0- to 20-cm soil layer is presented in Table 1.
Initial soil properties of the 0- to 20-cm soil layer.

The climate is typical temperate continental climate, with an average annual rainfall of 136.5 mm, occurring mostly between June and September. The mean annual air temperature is 13.2 C, with a maximum of 31.1 C in July and a minimum of −17.2 C in January. The cumulative temperature ≥0 C is 3,711 C, and the cumulative temperature for ≥10 C is 3,238 C. The mean annual evapotranspiration is approximately 1,953 mm. The frost-free period is approximately 152 d. The annual sunshine duration ranges from 3,100 to 3,300 h, with a sunshine rate of 72%. All meteorological data were obtained from the Meteorological Bureau of Bayannur City.
Experimental Design
The spring wheat cultivar ‘Yongliang 4’ was selected for this study. Three sowing treatments were established (Figure 1): wide-range uniform sowing (W0, with no spacing between plants and rows), 7-cm wide-range strip sowing (W7, with a seeding belt width of 7 cm and row spacing of 10 cm), and conventional drilling sowing (CK, with a seeding belt of 2 to 3 cm and row spacing of 15 cm). A randomized complete block design with three replications was employed, and each experimental plot measured 20 m by 6 m (120 m2). Sowing occurred on March 9, 2019, and March 12, 2020. The global target seedling density for each treatment was 750 × 104 plants ha−1; we also calculated the local plant density, defined as the global density divided by the fraction of the total area occupied by the seed bands. The resulting within-band density for the W7 treatment was 1,821 × 104 plants ha−1, and the within-row density for the CK was 5,250 × 104 plants ha−1. For each treatment, 3,000 kg ha−1 of organic fertilizer derived from decomposed sheep manure was applied as a base fertilizer before sowing. The fertilizer contained ≥50% organic matter, with total nitrogen (N), phosphorus (P2O5), and potassium (K2O) content of 1.2%, 1.5%, and 1.0%, respectively. Additionally, three irrigations were carried out during the wheat growth period, with each irrigation delivering 90 mm. No weed control measures were implemented throughout the growth period.
Schematic diagram of the three sowing patterns.

The W0 and W7 treatments were sown using a wide-band seeder. Its working sequence involved preparing a seedbed with a rotary tiller, broadcasting the seeds onto the soil surface, performing an initial pressing operation, covering the seeds with soil lifted by a conveyor belt, and finally, performing a second pressing operation. The seeding system for this machine functions as follows: seeds were metered by a fluted-roller metering unit and fell onto a primary flat impact plate for initial dispersion. Subsequently, they passed through a secondary dispersion unit, which consisted of a plate fit with an array of vertical pins. This two-stage system effectively randomized seed trajectories, ultimately scattering them evenly onto the soil surface to achieve the W0 treatment. To create the W7 treatment, adjustable baffles were installed on the dispersion units to constrain the seed flow to a 7-cm band. The CK was implemented using a conventional drill seeder.
Data Collection
Wheat Root Trait Measurements
At 60, 85, and 100 d after sowing (DAS), soil blocks measuring 51 cm in width (across three rows) and 50 cm in length were excavated to a depth of 80 cm. Each soil block was then sectioned into four 20-cm depth intervals. To isolate the roots, each soil sample was placed in a mesh bag and gently washed with running water to remove soil and debris. The clean roots were kept in polyethylene bags, and then immediately placed in dry ice for transport to the laboratory and were promptly scanned. Images of the root samples were obtained using a flatbed scanner (Epson Perfection V700 Photo, Seiko Epson Corporation, Suwa, Nagano, Japan) at a resolution of 600 dpi. Root parameters, including length density (RLD, cm cm−3), surface area density (RSAD, cm2 cm−3), and volume density (RVD, cm3 cm−3) were evaluated using WinRHIZO Pro 2019b software (Regent Instruments, Quebec City, Quebec, Canada). Root dry weight density (RWD, mg cm−3) was determined after drying the roots at 60 C until a constant weight. Subsequently, the average root traits for the four soil layers from 0 to 80 cm were calculated. All root density parameters were calculated according to Equation 1: ${\rm{R}}{{\rm{D}}_i} = {{{\rm{R}}{{\rm{T}}_i}} \over {{\rm{SV}}}}$
where RD i is the root density of RLD, RSAD, RVD, and RWD; RT i is the total value of root traits from a soil sample; and SV is the volume of the soil sample.
Aboveground Plant Nutrient Uptake Measurements
Aboveground biomass samples of wheat plants were collected at 45, 60, 85, and 115 DAS, while weed plants were sampled at 40, 65, 90, and 115 DAS from a 1-m2 quadrat in each plot. The weed community at the experimental field was dominated by broadleaf species, with common lambsquarters (Chenopodium album L.) as the most dominant species, followed by barnyardgrass [Echinochloa crus-galli (L.) P. Beauv.] and redroot pigweed (Amaranthus retroflexus L.). Other weeds observed were field bindweed (Calystegia hederacea Wall.), prostrate knotweed (Polygonum aviculare L.), and wild oat (Avena fatua L.). The plants materials were harvested at the soil surface level, placed in forced-air drying oven at 105 C for 30 min, followed by 80 C until dried to a constant weight. Dried samples were ground using a cyclone mill with a 0.5-mm sieve. According to the methods described by Bao (Reference Bao2000), after wet digestion of the plant samples with H2SO4-H2O2, the total nitrogen (N) content was determined using a Kjeldahl nitrogen analyzer (K1100, Hanon, Jinan, Shandong, China), the total phosphorus (P) content was measured with an automatic continuous flow analyzer (Skalar Analytical, Breda, Netherlands), and the total potassium (K) content was assessed using a flame photometer (Model 410, Sherwood Scientific, Cambridge, UK).
Wheat Grain Yield and Quality Measurements
At harvest, three samples covering 2 m2 were randomly collected from each plot, avoiding the border rows. The number of spikes per 2 m2, the grain number per spike from 50 spikes, and the 1,000-grain weight were determined as averages of the three samples. All wheat in the samples was mechanically threshed and weighed, and the total yield per hectare was estimated based on a grain moisture content of 13%. Grain protein content was determined by placing whole air-dried grains directly into a grain analyzer (InfratecTM 1241, FOSS Analytical A/S, Hillerød, Denmark). This analyzer employs near-infrared transmission technology and full-spectrum scanning with a holographic digital grating, providing comprehensive spectral information. The calibration database, developed using an artificial neural network (ANN) approach, ensures high analytical accuracy.
Statistical Analyses
Normality of the data was checked visually by residual histograms, and the homogeneity of variances was assessed using Levene’s test. As the assumptions were met, all data were analyzed using analysis of ANOVA in SAS v. 9.0 software (SAS Institute, Cary, North Carolina, USA) to detect differences between treatment means, with the LSD test at the 5% probability level. Simple linear regression was used to analyze the relationship of nutrient uptake between wheat and weeds. Additionally, Spearman’s correlation was used to analyze the relationships between crop-related variables and weed-related variables. All regression and correlation analyses, as well as plotting, were performed using Origin 2021 software (OriginLab Corporation, Northampton, Massachusetts USA).
Results and Discussion
Organic Wheat Grain Yield and Protein Content
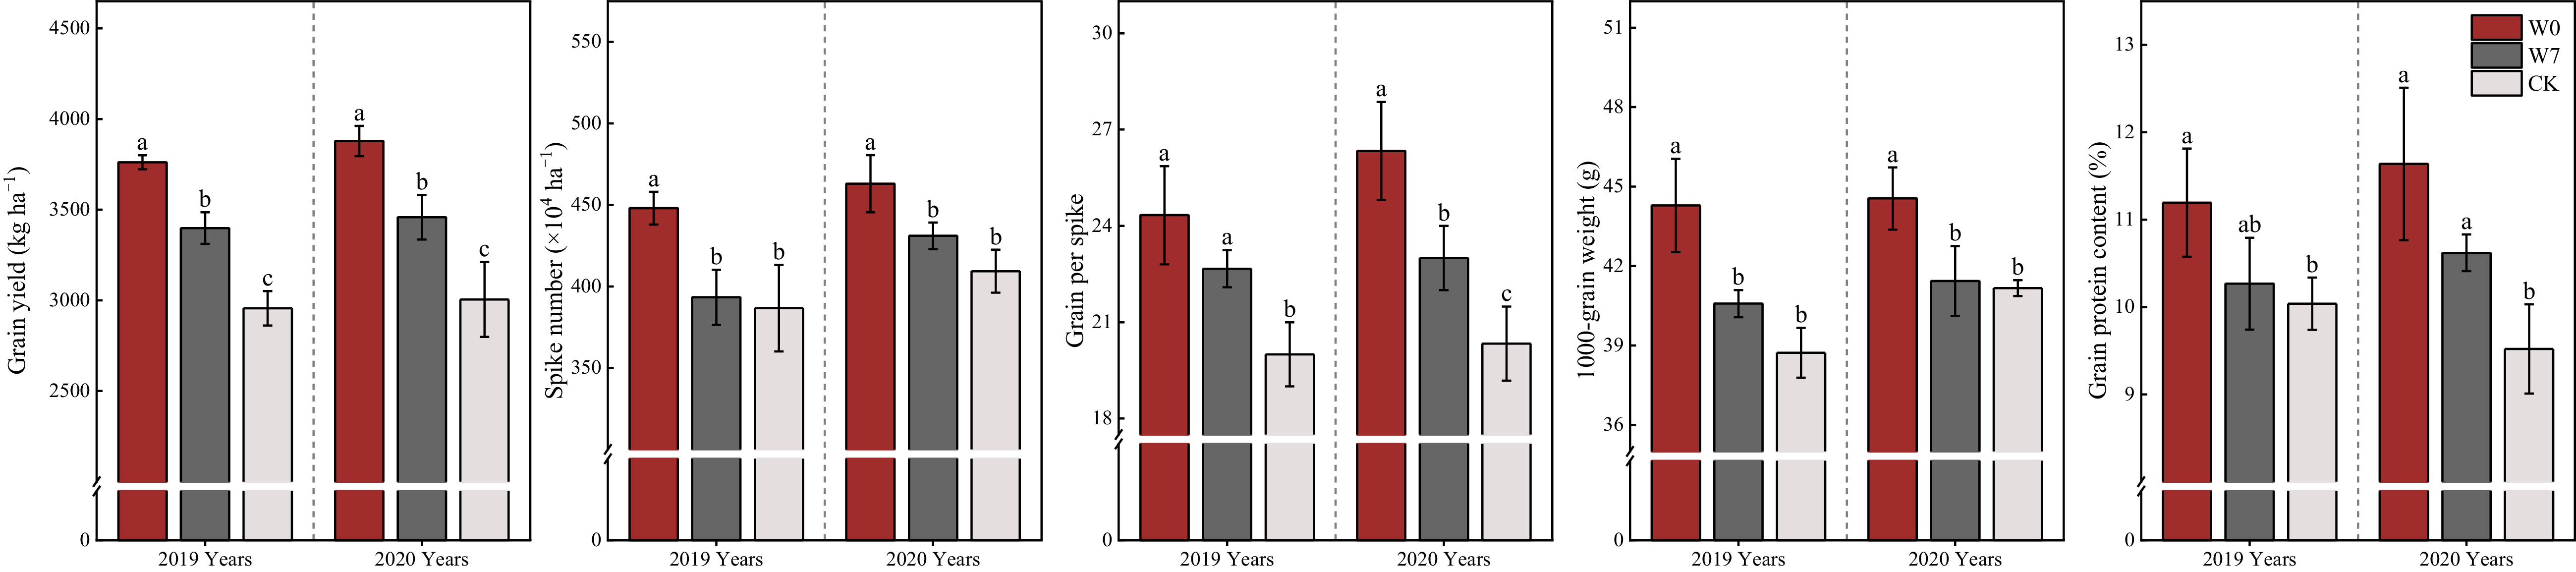
The sowing width configurations significantly (P < 0.05) influenced both yield performance and grain protein of organic wheat (Figure 2). Across the 2 yr, organic wheat grain yield ranged from 2,956.3 to 3,878.8 kg ha−1, and protein content varied from 9.5% to 11.6%, both parameters decreased with decrease in sowing width. Compared with CK, the W0 and W7 treatments achieved significant yield enhancements of 27.3% and 15.0% in 2019 (P < 0.05), with similar increases of 29.1% and 15.1% in 2020 (P < 0.05), respectively. For protein content, value for the W0 treatment achieved 1.2 to 2.1 percentage points higher than CK over 2 yr (P < 0.05), while the value for the W7 treatment showed 1.1 percentage points increase in 2020 (P < 0.05). While the protein content in the W0 treatment was higher than in the W7 treatment, the difference was not statistically significant (P > 0.05). Regarding the yield components, the spike number, grains per spike, and 1,000-grain weight of the W0 treatment were all significantly higher than those of CK, with average increases (P < 0.05) over the 2 yr of 14.5%, 25.3%, and 11.4%, respectively. The W7 treatment also showed improvements in these components.
Organic wheat grain yield and protein content under different sowing patterns. W0, no spacing between plants and rows; W7, seeding belt width of 7 cm and row spacing of 10 cm; CK, seeding belt width range of 2–3 cm and row spacing of 15 cm. Values are mean ± SD (n = 3). Different letters indicate significant differences among the treatments at P < 0.05, as determined by the LSD test.

These results confirm that optimized sowing width synergistically enhances organic wheat productivity and nutritional quality. This finding aligns with previous research demonstrating that modifying crop spatial arrangement is a key agronomic practice for balancing grain yield and quality (Lv et al. Reference Lv, Zhang, Li, Fan, Feng and Kong2020). This positive effect is particularly meaningful for organic systems characterized by low available soil nutrients and intense weed competition. The yield and quality improvements under wide-range sowing can be attributed to reduced weed interference, as evidenced by a 40.1% to 84.9% suppression in weed total nutrient (N, P, and K) uptake compared with CK. This interference was reduced by minimizing bare ground exposure and accelerating canopy closure (Zhao et al. Reference Zhao, Shen, Lang, Liu and Li2013), which in turn limited weed access to light and nutrients. Additionally, the improved spatial arrangement alleviates intraspecific competition among wheat plants, as demonstrated by the substantially lower local plant densities in the wide-range sowing treatments compared with CK. This reduced crowding provides individual plants with greater access to resources, promoting more robust root systems and individual plant development. The combined effect of these two mechanisms is conducive to optimizing light interception and conversion in wheat, enhancing the capacity for photosynthate production, and thus establishing a high-yield population structure (Chu et al. Reference Chu, Zhu, Yin, Shi, Deng, Zhang, He and Dai2018; Li et al. Reference Li, Feng, Wang, Wang and Guo2013).
Organic Wheat Root Traits
The RLD, RSAD, RVD, and RWD of organic wheat all exhibited a dynamic pattern of initially increasing and then decreasing throughout the growing season, reaching their peak values at 85 DAS. Spatially, the root system was predominantly concentrated in the 0- to 20-cm topsoil layer, which accounted for more than 50% of the total for each root trait, with values progressively decreasing with soil depth. Among the treatments (Figure 3), wide-range sowing significantly improved the root traits of organic wheat, with particularly increases in RSAD and RWD. At each growth stage, all four root parameters showed an upward trend as the sowing width increased, following the order of W0 > W7 > CK. This positive effect was especially significant in the upper soil layers. Specifically, in the 0- to 40-cm soil layer, the W0 treatment significantly increased all root traits compared with CK by 15.3% to 66.4%, 11.3% to 24.3%, and 28.6% to 34.9% at the 60, 85, and 100 DAS stages, respectively. Under the W7 treatment, the corresponding increases were 6.7% to 29.9%, 5.4% to 13.0%, and 10.6% to 16.0%. The 2-yr average data for the four soil layers indicated that compared with CK (Figure 4), the W0 treatment induced 13.8% to 50.6% (P < 0.05) root trait enhancements across different growth stage, W7 treatment significantly increased (P < 0.05) RSAD and RVD by more than 13.4% and 6.4%, respectively.
Root length density, root surface area density, root volume density, and root weight density of organic wheat in four distinct soil layers at different stages. W0, no spacing between plants and rows; W7, seeding belt width of 7 cm and row spacing of 10 cm; CK, seeding belt width range of 2–3 cm and row spacing of 15 cm. DAS, days after sowing. Values are mean ± SD (n = 3). Different letters indicate significant differences among the treatments at P < 0.05, as determined by the LSD test.

Collapsed data of 0- to 80-cm average root length density, root surface area density, root volume density, and root weight density of organic wheat at different stages. W0, no spacing between plants and rows; W7, seeding belt width of 7 cm and row spacing of 10 cm; CK, seeding belt width range of 2–3 cm and row spacing of 15 cm. DAS, days after sowing. Values are mean ± SD (n = 3). Different letters indicate significant differences among the treatments at P < 0.05, as determined by the LSD test.

Crop root system architecture exhibits strong plasticity, and the field spatial distribution of wheat plants exerts a regulatory effect on root morphological development (Fang et al. Reference Fang, Xu, Turner and Li2010; Guan et al. Reference Guan, Zhang, Al-Kaisi, Wang, Zhang and Li2015; Qiu et al. Reference Qiu, Gao, Huang, Li, Sun and Duan2013). This regulatory process is governed by factors including plant uniformity, row and plant spacing arrangement, and sowing density, among which sowing method serves as an effective measure to shape the population structure. In this study, wide-range uniform sowing promoted root growth by optimizing spatial distribution. Specifically, the local density in CK (5,250 plants m−2) was nearly three times that of W7 (1,821 plants m−2) and seven times that of W0 (750 plants m−2). This intense crowding in the CK rows likely triggered interplant root competition, thereby restricting individual root system development. This competitive effect was substantially mitigated in the wide-range sowing treatment, which also expanded soil exploration scope of the root system (Kong et al. Reference Kong, Zhao, Zhang, Shi and Yu2023; Yang et al. Reference Yang, Chen, Tang, Lin, Sun and Gao2023). This is consistent with Zheng et al. (Reference Zheng, Qin, Hua, Chu, Dai and He2023), who reported 25.5% to 25.3% increases in root density under wide sowing, and Wang et al. (Reference Wang, Jia, Luo, Hao, Zhang and Shi2023) who observed enhanced root growth in the 0- to 30-cm soil layer. In organic systems with low available nutrients, the improved root foraging efficiency (higher RLD and RSAD) is critical for nutrient and water acquisition and also provides a competitive advantage over weeds by preempting belowground resources. The unimodal root growth pattern (peaking at 85 DAS) coincides with the key weed competition period, further confirming the role of root traits in mediating crop–weed interactions.
Organic Wheat Plant Nutrient Uptake
The nutrient acquisition dynamics in organic wheat were significantly affected by the sowing pattern. Across all treatments, the N, P, and K uptake of organic wheat plants increased progressively throughout the growth stages, characterized by a rapid accumulation phase during the vegetative growth stage (0 to 60 DAS) followed by a stabilized rate in the later growth phase (Figure 5). Generally, nutrient accumulation in wheat plants was enhanced as sowing width increased, and W0 treatment was significantly higher than (P < 0.05) the W7 treatment and CK. Specifically, the W0 treatment increased N, P, and K (P < 0.05) uptake by 34.6% to 44.2%, 39.5% to 55.4%, and 39.6% to 53.9% compared with CK across growth stages. These increases peaked for N and P around the jointing stage (∼60 DAS) and for K around the grain-filling stage (∼85 DAS). In later stages, the W7 treatment also showed significant effects where, compared with CK, it significantly increased P uptake by11.6% at the maturity stage (∼115 DAS) and K uptake by 10.2% to 10.5% during the grain-filling to maturity period (85 to 115 DAS) (P < 0.05). In contrast, its N uptake remained similar to that of CK.
Organic wheat plant nitrogen (N), phosphorus (P), and potassium (K) uptake at different stages. W0, no spacing between plants and rows; W7, seeding belt width of 7 cm and row spacing of 10 cm; CK, seeding belt width range of 2–3 cm and row spacing of 15 cm. DAS, days after sowing. Values are mean ± SD (n = 3). Different letters indicate significant differences among the treatments at P < 0.05, as determined by the LSD test.

The enhanced nutrient acquisition under wide-range sowing is directly linked to improved root architecture—greater RLD and RSAD expand the root–soil contact area, facilitating nutrient uptake in organic soils with low nutrient availability. Organic cultivation relies on slow-release nutrients from green manure and farmyard manure, making root foraging efficiency a key determinant of nutrient acquisition (Carr et al. Reference Carr, Cavigelli, Darby, Delate, Eberly, Fryer, Gramig, Heckman, Mallory, Reeve, Silva, Suchoff and Woodley2020; Mpanga et al. Reference Mpanga, Tronstad, Guo, LeBauer and Idowu2021; Stedden et al. Reference Stedden, Silva, Ryan, Mallory, Darby, Dawson, Hartman and Sorrells2024). Wide-range sowing also increases the nutritional area per plant, enabling utilization of interrow nutrients, whereas in conventional drilling, this interrow space is typically occupied by weeds (Gazoulis et al. Reference Gazoulis, Papazoglou, Petraki, Antonopoulos, Danaskos, Kokkini, Kanatas and Travlos2025). The synchronized improvement in N, P, and K extraction strengthens wheat’s competitive superiority in resource-limited organic systems, which is central to organic farming systems’ focus on crop–weed competition dynamics.
Weed Plant Nutrient Uptake
The sowing pattern had a significant effect on nutrient accumulation by weeds. Nutrient acquisition was inversely correlated with sowing width, following the trend of CK > W7 > W0 (Figure 6). In terms of temporal dynamics, all treatments exhibited a transition from slow initial assimilation to accelerated uptake in the later stages. This response pattern was highly consistent with that of total weed biomass across the same treatments and time. The W0 treatment demonstrated the strongest suppression efficacy. Compared with CK, it significantly (P < 0.05) reduced weed N extraction, with reductions of 84.9% (40 DAS), 55.9% (65 DAS), 67.1% (90 DAS), and 78.4% (115 DAS). This was paralleled by significant (P < 0.05) reductions in P and K uptake across the growth stages, which ranged from 57.9% to 84.4% and 51.9% to 84.1%, respectively. The W7 treatment achieved significant but attenuated nutrient suppression, exhibiting 40.1% to 72.5% N, 39.8% to 74.8% P, and 40.2% to 75.1% K decreases (P < 0.05). These results reflect the ecological weed suppression potential of wide-range sowing, a key goal in sustainable weed management. In organic cultivation, weeds cannot be controlled with chemical herbicides in conventional systems, and the slower canopy closure of organic wheat is more favorable to weed growth. Wide-range sowing addresses this challenge in two ways: first, the uniform wheat distribution allows the crop to occupy the interrow space faster, limiting weed establishment (Manalil et al. Reference Manalil, Coast, Werth and Chauhan2017); second, the enhanced wheat biomass accelerates canopy closure, which reduces light penetration to the soil surface and inhibits weed germination and growth (Martınez-Ghersa et al. Reference Martınez-Ghersa, Ghersa and Satorre2000; Mhlanga et al. Reference Mhlanga, Chanhan and Thierfelder2016).
Field weed plant nitrogen (N), phosphorus (P), and potassium (K) uptake at different stages. W0, no spacing between plants and rows; W7, seeding belt width of 7 cm and row spacing of 10 cm; CK, seeding belt width range of 2–3 cm and row spacing of 15 cm. DAS, days after sowing. Values are mean ± SD (n = 3). Different letters indicate significant differences among the treatments at P < 0.05, as determined by the LSD test.

Nutrient Competition Dynamics between Organic Wheat and Weeds
The nutrient uptake ratios served as quantitative indicators of the competitive advantage in interspecific nutrient acquisition between organic wheat and weeds. Nutrient competition indices exhibited treatment-dependent temporal dynamics, with the W0 treatment demonstrating consistently increased N-P-K uptake ratios throughout the growing season, contrasted by unimodal patterns (initial increase followed by decline) under the W7 treatment and CK (Figure 7). The N, P, and K uptake ratios exhibited negative correlations with sowing width reduction across all growth stages, maintaining the order: W0 > W7 > CK. ANOVA demonstrated significant enhancements in W0 relative to CK, with mean N uptake ratios being higher by 30.6-, 27.1-, 42.6-, and 43.0-fold (P < 0.05) across the four stages, with 9.9- to 38.4-fold and 10.3- to 37.6-fold (P < 0.05) increases in P and K ratios, respectively.
Nitrogen (N), phosphorus (P), and potassium (K) uptake competitive ratio of organic wheat to weed at different stages. W0, no spacing between plants and rows; W7, seeding belt width of 7 cm and row spacing of 10 cm; CK, seeding belt width range of 2–3 cm and row spacing of 15 cm. DAS, days after sowing. Values are mean ± SD (n = 3). Vertical bars represent the standard deviation of the mean.

To further explore this competitive relationship, regression models revealed significant negative linear relationships between wheat and weed N-P-K acquisition (Figure 8). As weed nutrient uptake increased across growing stages, wheat nutrient uptake declined. The significant differences among the regression slopes for each nutrient effectively quantified the competitive intensity. The slope for the N regression, ranging from −0.1 to −5.5, was steeper than those for P and K. This indicates that for every unit of a nutrient taken up by weeds, the corresponding loss of N by wheat was greater. Detailed growth stage analysis reveals that the slopes of the nutrient regression equations exhibited a unimodal distribution and peaked at 85/90 DAS, indicating that this was the most intense period of competition.
Relationship of nutrient uptake between organic wheat and weed. DAS, days after sowing.

Notably, N emerged as the primary competitive focus (Carr et al. Reference Carr, Cavigelli, Darby, Delate, Eberly, Fryer, Gramig, Heckman, Mallory, Reeve, Silva, Suchoff and Woodley2020; Chmelíková et al. Reference Chmelíková, Schmid, Anke and Hülsbergen2021), a fact corroborated by both the highly competitive ratio and the steep regression slope. Weeds typically have higher N demand and faster uptake rates than crops (Poffenbarger et al. Reference Poffenbarger, Mirsky, Teasdale, Spargo, Cavigelli and Kramer2015). Especially in our study field, the weed community dominated by C. album possessed a strong competitive advantage. However, wide-range sowing strengthens wheat’s N acquisition capacity through improved root foraging and spatial occupancy. The regression analysis further explains N competition. Nitrate, a primary form of N, is highly mobile in soil and readily dissolves in water, where a well-developed and dense root system confers a decisive advantage (Garnett et al. Reference Garnett, Conn and Kaiser2009; Lynch et al. Reference Lynch, Galindo-Castañeda, Schneider, Sidhu, Rangarajan and York2024). In contrast, P and K are relatively immobile, which limits their acquisition by the root system. Consequently, the steeper regression slope for N reflects the more intense competition. The increased RLD observed in our wide-range sowing treatments created a superior “interception network” for wheat, making the competitive outcome for N highly sensitive to these improvements in root architecture, and it corroborates the conclusion that N is a key driver of crop–weed interactions (Evans et al. Reference Evans, Knezevic, Lindquist and Shapiro2017). In addition, the peak competition at 85/90 DAS corresponds to wheat’s grain-filling stage and a weed’s rapid growth phase, making this a critical window for weed management. The sustained upward trend in W0’s competitive ratio contrasts with the unimodal pattern in CK and W7, indicating that uniform sowing maintains its competitive advantage, which is critical for grain filling. At this stage, the competitive ability of wheat can be further enhanced when supplemented with manual weeding measures.
Correlation between Organic Wheat Root Traits, Nutrient Uptake, and Weed Nutrient Uptake
Significant correlations were observed between wheat performance metrics, root traits, and weed nutrient acquisition (Figure 9). Wheat grain yield and protein content showed significantly negative correlations with weed N, P, and K uptake, indicating that weed nutrient uptake exerts a constraining effect on the improvement of wheat grain yield and protein content. Meanwhile, significantly positive correlations were observed among wheat RLD, RSAD, RVD, RWD, and N, P, and K uptake. These wheat traits were significantly negatively correlated with weed N, P, and K uptake. Taken together, the results of this study suggest that wide-range uniform sowing promotes the absorption of N, P, and K of organic wheat plants by improving root traits. This enhanced nutrient absorption capacity strengthens organic wheat’s competitiveness for nutrient resources, ultimately inhibiting weed growth and nutrient uptake (Blackshaw et al. Reference Blackshaw, Molnar and Janzen2004; Craine and Dybzinski Reference Craine and Dybzinski2013), and laying a foundation for organic wheat to achieve high yield and high quality.
Correlation between organic wheat average root characteristics, nutrient uptake, and weed nutrient uptake. DAS, days after sowing. Yield and Pro, the wheat grain yield and protein content. RLD, RSAD, RVD, and RWD, the density of root length, root surface area, root volume, and root weight. WHN, WHP, and WHK, the nitrogen (N), phosphorus (P), and potassium (K) uptake of organic wheat. WEN, WEP, and WEK, the nitrogen (N), phosphorus (P), and potassium (K) uptake of field weeds.

Results from this study show that wide-range uniform sowing is an effective agronomic practice for organic wheat production, combining yield improvement and ecological weed suppression. The mechanism involves spatial optimization of wheat plants, which enhances root growth and nutrient acquisition, strengthens the crop’s competitive advantage over weeds, and reduces resource uptake by weeds. While a limitation of this study is the absence of weed-free controls, preventing a quantitative disentanglement of intraspecific from interspecific competition, it is clear that both pathways ultimately converge. That is, whether by reducing competition among wheat plants or by directly enhancing competition against weeds, the practice fundamentally works by improving the crop’s capacity to acquire nutrients. This enhanced nutrient acquisition is the pivotal mechanism that leads to both effective weed suppression and higher grain yield. Future studies incorporating weed-free controls would be valuable to partition the relative contributions of these two interconnected competitive effects.
In current wheat production practices, the wide-range sowing technique is in the demonstration and extension phase and is primarily applied in conventional, intensive cultivation systems to leverage its effect of reducing intraspecific competition. However, due to the smaller cultivation area of organic agriculture, the practical application and extension of the weed-suppressive effect of wide-range sowing have not yet been fully realized. The progressive improvement in the coordination between the operational speed and sowing uniformity of wide-range seeders, coupled with further optimization supporting water-fertilizer management and, especially, seeding density, all within the context of the future development of organic farming and the ongoing “dual reduction” (fertilizer and pesticide) initiatives, suggests wide-range sowing is poised to become a key technology for ecological weed management.
Acknowledgments
We thank the “Science and Technology Backyard” for providing the experimental platform and also the staff of the Bayannur Academy of Agricultural Sciences for their assistance with the experiment.
Funding statement
This research was funded by Inner Mongolia “Science and Technology” action focus on special “Yellow River Basin Durum Wheat Industrialization Capacity Enhancement” (NMKJXM202201-4), Inner Mongolia Autonomous Region Wheat Modern Agriculture and Animal Husbandry Industry Technology System.
Competing interests
The authors declare no conflicts of interest.




 Open access

