





Introduction
Despite their importance as key pollinators for most wild flowering plants and for many important global food crops, increasing evidence is demonstrating that bee diversity is declining (Vanbergen and The Insect Pollinators Initiative, Reference Vanbergen2013; Zattara and Aizen, Reference Zattara and Aizen2021). Bees face several threats in agricultural lands, especially in conventional, monoculture crop production, including pesticide exposure, habitat loss, and negative interactions with non-native species (Vanbergen and The Insect Pollinators Initiative, Reference Vanbergen2013; Goulson et al., Reference Goulson, Nicholls, Botías and Rotheray2015). Pesticides (e.g., insecticides, herbicides, and fungicides) are applied to seeds and/or crops across the growing season, and the types and frequencies of pesticides vary greatly among crop systems and farmer practices (Jorge et al., Reference Jorge, Nehring, Osteen, Wechsler, Martin and Vialou2014; Rosenheim et al., Reference Rosenheim, Cass, Kahl and Steinmann2020; Raine and Rundlöf, Reference Raine and Rundlöf2024). As natural lands are turned into monocultures for crop production, resources such as flowers that provide pollen and nectar foraging sources, pithy stems for cavity nesting bees, and undisturbed soil for ground nesting bees are removed or largely diminished from the environment (Kline and Joshi, Reference Kline and Joshi2020; Requier and Leonhardt, Reference Requier and Leonhardt2020). Native bee species in agricultural lands interact with non-native plants, pathogens, or animals such as the European honey bee ( Apis mellifera L.) in North America, which is often used for crop pollination in several crops (Williams et al., Reference Williams, Cariveau, Winfree and Kremen2011; Mallinger, Gaines-Day, and Gratton, Reference Mallinger, Gaines-Day and Gratton2017). These threats will likely persist as global agricultural production intensifies and expands (Lanz, Dietz, and Swanson, Reference Lanz, Dietz and Swanson2018), prompting continued research into how to protect and conserve pollinators within farmlands (Kremen and Miles, Reference Kremen and Miles2012; Nicholls and Altieri, Reference Nicholls and Altieri2013; Bretagnolle and Gaba, Reference Bretagnolle and Gaba2015; Kovács-Hostyánszki et al., Reference Kovács-Hostyánszki, Espíndola, Vanbergen, Settele, Kremen and Dicks2017; Zamorano et al., Reference Zamorano, Bartomeus, Grez and Garibaldi2020). Various agri-environmental solutions have been proposed and investigated to protect and promote pollinators and wild bees in agricultural lands (Dicks et al., Reference Dicks, Viana, Bommarco, Brosi, Arizmendi, Cunningham, Galetto, Hill, Lopes, Pires, Taki and Potts2016). This includes practices that reduce pesticide exposure and/or toxicity for pollinators, including changes to pesticide types and frequencies, application methods, and using integrated pest and pollinator management (IPPM; Lundin et al., Reference Lundin, Rundlöf, Jonsson, Bommarco and Williams2021). Additionally, various practices may add or enhance important habitat features for bees and pollinators, including flower strips, cover crops, crop rotations, hedgerows, shelterbelts, and other natural and semi-natural land features (Cole et al., Reference Cole, Kleijn, Dicks, Stout, Potts, Albrecht, Balzan, Bartomeus, Bebeli, Bevk, Biesmeijer, Chlebo, Dautartė, Emmanouil, Hartfield, Holland, Holzschuh, Knoben, Kovács-Hostyánszki, Mandelik, Panou, Paxton, Petanidou, Pinheiro de Carvalho, Rundlöf, Sarthou, Stavrinides, Suso, Szentgyörgyi, Vaissière, Varnava, Vilà, Zemeckis and Scheper2020). Approaches that limit the negative impact of honey bee colonies on wild bees have also been proposed, such as healthy beekeeping and limiting disease pressure or methods to regulate their usage and movement (Decourtye et al., Reference Decourtye, Alaux, Le Conte and Henry2019). Still, there are many knowledge gaps surrounding pollinator conservation in agricultural lands, including the crops that have been studied, the geographic locations of studies, the crop management practices that are investigated, and the pollinators under investigation.
Vineyards represent a unique crop system as they are cultivated globally across a multitude of environments (Daane et al., Reference Daane, Vincent, Isaacs and Ioriatti2018; OIV, 2019) and are considered one of the most intensively managed crop systems (Popescu et al., Reference Popescu, Comsa, Hoble, Bunea, Gaman, Tamas, Guernion, Kratschmer, Zaller and Winter2019). The wine grape ( Vitis vinifera L.) does not require animal pollination, and wild bee use of wine grape flowers as forage is limited (Dorin and Colla, Reference Dorin and Colla2024). Thus, in vineyard-dominated landscapes, providing other forage resources is likely important to support wild bees, particularly for growers who produce sustainable grape products (Daane et al., Reference Daane, Vincent, Isaacs and Ioriatti2018). Several sustainable vineyard management practices may benefit bees, including cover cropping, low- or no-till soil management, reduced mowing, organic production, and integrated pest management (IPM; Griffiths-Lee, Goulson, and Nicholls, Reference Griffiths-Lee, Goulson and Nicholls2022b). Studies on between-row vegetation and floral resources, which vary as a result of various practices such as cover cropping, tillage, mowing, and alternate row management, have demonstrated varying impacts on bees (Kratschmer et al., Reference Kratschmer, Pachinger, Schwantzer, Paredes, Guernion, Burel, Nicolai, Strauss, Bauer, Kriechbaum, Zaller and Winter2018, Reference Kratschmer, Pachinger, Schwantzer, Paredes, Guzmán, Goméz, Entrenas, Guernion, Burel, Nicolai, Fertil, Popescu, Macavei, Hoble, Bunea, Kriechbaum, Zaller and Winter2019; Popescu et al., Reference Popescu, Comsa, Hoble, Bunea, Gaman, Tamas, Guernion, Kratschmer, Zaller and Winter2019; Blaise et al., Reference Blaise, Mazzia, Bischoff, Millon, Ponel and Blight2022; Rocher et al., Reference Rocher, Melloul, Blight and Bischoff2024). In general, higher between-row floral cover generally has positive impacts on bee abundance and diversity (Wilson et al., Reference Wilson, Wong, Thorp, Miles, Daane and Altieri2018; Blaise et al., Reference Blaise, Mazzia, Bischoff, Millon, Ponel and Blight2022; Griffiths-Lee et al., Reference Griffiths-Lee, Davenport, Foster, Nicholls and Goulson2022a). Organic vineyard management has shown inconsistent impacts on bees, with some studies demonstrating a positive impact on bee abundance and/or diversity (Uzman et al., Reference Uzman, Reineke, Entling and Leyer2020; Kratschmer et al., Reference Kratschmer, Pachinger, Gaigher, Pryke, van Schalkwyk, Samways, Melin, Kehinde, Zaller and Winter2021; Kaczmarek, Entling, and Hoffmann, Reference Kaczmarek, Entling and Hoffmann2024) while others have shown limited effects (Brittain et al., Reference Brittain, Bommarco, Vighi, Settele and Potts2010; Kehinde and Samways, Reference Kehinde and Samways2012; Biella et al., Reference Biella, Ramazzotti, Parolo, Galimberti, Labra and Brambilla2025). While some practices, such as floral resource provision, more consistently benefit bees, questions remain, including the impact of floral cover crops not curated for bees, but rather, those used by growers for nutrients, soil, or pest management on bees (Daane et al., Reference Daane, Vincent, Isaacs and Ioriatti2018). Furthermore, several practices are largely unaddressed, including the impact of mowing frequencies in the between-row spaces, non-organic sustainability certifications, and alternate row management beyond tillage, such as alternate row mowing or cover cropping. Additionally, certain bee taxa may differentially respond to various management practices due to differences in their traits and behaviors, including factors like lecty, pollen collection methods, proboscis length, nesting habitat requirements, or sociality (Kratschmer et al., Reference Kratschmer, Pachinger, Schwantzer, Paredes, Guzmán, Goméz, Entrenas, Guernion, Burel, Nicolai, Fertil, Popescu, Macavei, Hoble, Bunea, Kriechbaum, Zaller and Winter2019, Reference Kratschmer, Pachinger, Gaigher, Pryke, van Schalkwyk, Samways, Melin, Kehinde, Zaller and Winter2021).
In studies that collected data across multiple countries, the bee communities and responses to vineyard management differed between geographic locations (Kehinde et al., Reference Kehinde, von Wehrden, Samways, Klein and Brittain2018; Kratschmer et al., Reference Kratschmer, Pachinger, Schwantzer, Paredes, Guzmán, Goméz, Entrenas, Guernion, Burel, Nicolai, Fertil, Popescu, Macavei, Hoble, Bunea, Kriechbaum, Zaller and Winter2019). This highlights the importance of replicating this research in various geographies with different environments, bee communities, and grape growing practices. None of the above studies have occurred in Canada, and few have in cool-climate grape growing regions. Another consideration is the vast differences in methodology used among studies, including the bee sampling methods, the number of sampling events within a growing season, and the number of years the study was replicated, factors that can significantly affect the bee communities collected (Schindler et al., Reference Schindler, Diestelhorst, Haertel, Saure, Schanowski and Schwenninger2013; Russo et al., Reference Russo, Park, Gibbs and Danforth2015; McCravy, Reference McCravy2018; Hutchinson et al., Reference Hutchinson, Oliver, Breeze, O’Connor, Potts, Roberts and Garratt2022). Sampling bees using both netting and pan traps across the entire growing season and over a representative number of sites can provide clearer insights into the impacts of vineyard management on entire bee communities across the growing season (Schindler et al., Reference Schindler, Diestelhorst, Haertel, Saure, Schanowski and Schwenninger2013; Olsson et al., Reference Olsson, Pfeiffer, Lee, Oeller and Crowder2025). These knowledge gaps support the need for research on bee conservation within Canadian vineyards.
This research aimed to assess how several vineyard management practices influence wild bee communities. Specifically, we investigated the effects of: (1) cover cropping and the extent of between-row vegetation and floral cover; (2) mowing frequency and the height of between-row vegetation; (3) the use of alternate-row management; and (4) sustainable management programs including organic management and sustainability certifications. The hypotheses and predictions were that (1) vineyards that plant flowering cover crops between vine rows, rather than frequent cultivation, herbicide applications, planting only grasses, or relying on natural vegetation, would provide greater floral resources for bees, leading to higher wild bee abundance and diversity. Similarly, (2) vineyards that mow the between-row spaces less frequently would have taller vegetation, which allows more forb species to flower, increasing both flower and bee abundance and diversity. In contrast, (3) alternate-row management practices, such as alternating tillage, mowing, or seeding in every second row, which can leave every second row with low- or no vegetation, were predicted to reduce the total vegetation and floral resources available, negatively impacting bees. It was also hypothesized that (4) conventional pesticide usage for vineyard pest, disease, and weed management, including the use of herbicides and bee-toxic insecticides, would negatively affect both bees and floral resources, lending to higher bee and flower abundance and diversity in organic vineyards, where synthetic pesticides are not allowed, compared to conventional vineyards. Certified sustainable vineyards, which were predicted to be more likely to implement practices such as cover cropping and IPM, would also support higher floral resources and bee abundance and diversity than conventional systems. Finally, it was also expected that the above management practices would influence the community composition of wild bees, potentially favoring certain taxa over others due to differences in natural histories, life cycles, and behaviors that shape how species interact with their environments.
Methods
Site selection
Grapes are the third largest fruit crop grown in Canada by total acreage (Agriculture and Agri-Food Canada, 2021), and the Niagara Region is the largest planted area with vines covering 13,600 acres (VQA, 2025). Commercial vineyard blocks of Vitis vinifera were selected across the Niagara Region that were managed conventionally, organically, or certified sustainably per the Sustainable Winegrowing Ontario (SWO) certification program (SWO, 2025). Organic management in Canada is informed by federal legislation and subsequent industry rules and standards, which outline permissible substances and activities (The Organic Council of Ontario, 2026). Organic grape production prohibits the use of synthetic substances, such as pesticides, instead relying on various cultural practices (e.g., leaf removal), physical controls (e.g., netting), biological controls (e.g., pest predators), semiochemicals (e.g., pheromones), and organic chemicals (e.g., copper; Provost and Pedneault, Reference Provost and Pedneault2016; Baiano, Reference Baiano2021). The SWO program is a third-party audited certification for both wineries and vineyards, accounting for environmental, economic, and social sustainability (SWO, 2025). For grape production, the program does not prohibit any substances; instead encouraging growers to consider factors such as biodiversity, water use, and soil health in their management (SWO, 2025). SWO recommends growers implement practices, such as cover cropping, IPM, providing wildlife habitat (e.g., brush, wetlands), composting and using organic soil amendments, practicing responsible irrigation (e.g., drip), and employing animals in the vineyard. For this study, due to the stricter regulations around organic production, sites that were managed organically and were also certified sustainable (i.e., growers that had both certifications) were categorized as organic—enabling investigation into the sustainability certification in isolation (Seufert, Ramankutty, and Mayerhofer, Reference Seufert, Ramankutty and Mayerhofer2017). In Year 1, 20 sites were sampled: 10 organic, five conventional, and five certified sustainable. In Year 2, two organic sites were removed, and six new sites were added—three certified sustainable and three conventional. Thus, in Year 2, 24 sites were sampled, eight organic, eight conventional, and eight certified sustainable (Supplementary Table 1). Eight sites were sampled for only 1 year (Supplementary Table 1). Sites covered the various grape growing sub-appellations of the region (VQA, 2025) and were at a minimum 600 m apart to sample independent bee communities (Gathmann and Tscharntke, Reference Gathmann and Tscharntke2002; Knight et al., Reference Knight, Martin, Bishop, Osborne, Hale, Sanderson and Goulson2005; Zurbuchen et al., Reference Zurbuchen, Landert, Klaiber, Müller, Hein and Dorn2010; Fig. 1). This minimum distance represents the closest centroid-to-centroid linear distance between two sites transects; most sites were at least 1 km + apart. This distance between sites accounts for the typical foraging ranges of wild bees, which are ~110 m for solitary species and ~ 450 for primitively eusocial species (Kendall et al., Reference Kendall, Mola, Portman, Cariveau, Smith and Bartomeus2022).
Vineyard sites for bee sampling across the Niagara Region, ON created in ArcMap Pro 3.0.2 (Esri, Redlands, CA) with the World Topographic and World Hillshade basemaps. Sites were overlaid on the VQA map of sub-appellations for wine growing (Brock University Maps, Data & GIS. Niagara Sub-Appellations. 2016 [GIS Data]. Scale unknown. ‘Historical Maps of Niagara’ http://hdl.handle.net/10464/13712).

Figure 1. Long description
A topographic map with a legend in the Northwest corner. The legend defines Management type as Conventional (red square), Organic (red star), and Sustainable (red triangle). Year(s) sampled are shown as 1 year (yellow) or 2 years (red).
Ten sub-appellations are color-coded and distributed along the southern shore of Lake Ontario:
* West: Lincoln Lakeshore (teal) contains one red triangle. Beamsville Bench (purple) contains one red star. Vinemount Ridge (olive) contains two yellow stars and one yellow triangle.
* Central: Twenty Mile Bench (pink) contains three red stars and two yellow squares. Creek Shores (bright green) contains two red squares. Short Hills Bench (dark blue) contains one red triangle at its southern tip.
* East: Niagara Lakeshore (dark green) contains three red triangles. Four Mile Creek (orange) contains one red star and one yellow square. St. David’s Bench (royal blue) contains one red square. Niagara River (maroon) contains two red stars and two yellow triangles.
A scale bar at the bottom left indicates 0 to 10 Kilometers. The city of St Catharines is visible in the center-right of the map.
Bee and vegetation surveys
Wild bee and vegetation sampling occurred every 4 weeks from May through August in 2021 and 2022, corresponding roughly with the grape phenology stages of leaf out, flowering, bunch closure, and veraison (color development; Schindler et al., Reference Schindler, Diestelhorst, Haertel, Saure, Schanowski and Schwenninger2013). Sites were sampled in a semi-random order during each sampling period, which was in accordance with weather forecasts and vineyard management schedules at each site. Bees were sampled using both pan traps and aerial netting on precipitation-free days. A 400 m2 area was marked out in the center of each vineyard block spanning two neighboring between-row spaces (Kratschmer et al., Reference Kratschmer, Pachinger, Schwantzer, Paredes, Guernion, Burel, Nicolai, Strauss, Bauer, Kriechbaum, Zaller and Winter2018). The transects were ~ 80 m long along the central vine row and 5 m wide across three neighboring vine rows, with the length adjusted to account for varying row spacing across sites. Aerial netting was performed for 30 minutes in the morning and afternoon, 15 minutes per alternate row, using collecting jars with ethyl acetate (BioQuip 1121 Series Collecting Jars). To focus the sampling effort on wild bee communities, active netting prioritized the collection of non-honey bees during surveys. Twenty-four 3.25 oz (96 mL) pan traps painted fluorescent yellow, blue, or white (New Horizons bee bowls, Maryland) were filled with soapy water and placed on the ground underneath the central vine row spaced ~3 m apart, with alternating colors, before 9:00 am and collected after 5:00 pm. If the under-vine area consisted of tall vegetation, then traps were raised using commercial garden stakes, which were dark green in color, to the height of the vegetation, which was ~15–30 cm (Krahner et al., Reference Krahner, Dietzsch, Jütte, Pistorius and Everaars2024).
On the same days of bee sampling, vineyard floral resources and vegetation characteristics were also recorded. A 1 m2 quadrat was semi-randomly placed eight times along the 400 m2 sampling area. To capture all blooming flowers, half of the quadrats were positioned centrally in the between-row space while the other half were placed closer to the vine rows. Flower species and their abundances were documented for all open flowers (excluding grasses, rushes, and sedges) inside the quadrat (Carvell et al., Reference Carvell, Meek, Pywell and Nowakowski2004; Baldock et al., Reference Baldock, Goddard, Hicks, Kunin, Mitschunas, Morse, Osgathorpe, Potts, Robertson, Scott, Staniczenko, Stone, Vaughan and Memmott2019) such that one flower unit was defined as a single capitulum (ex. Taraxacum officinale ), umbel (ex. Daucus carota ), head (ex. Trifolium spp.), single flower (ex. Convolvulus arvensis), single spike (ex. Plantago major), or single raceme (ex. Polygonum aviculare). Abundances were recorded as the number of open flowering units following Carvell et al. (Reference Carvell, Meek, Pywell and Nowakowski2004). For highly abundant and dense species (ex. prostrate knotweed (Polygonum aviculare)), flower abundance was counted for a smaller area and extrapolated for the entire quadrat based on the visual cover of the species. Flowers were identified using the Newcomb’s Wildflower Guide (Newcomb, Reference Newcomb1989) and the Ontario Ministry of Agriculture, Food, and Rural Affairs (OMAFRA) resources (OMAFRA, 2009, 2023a). Vegetation cover was visually estimated using a modified DAFOR scale (Rare <10%, Occasional 11%–25%, Frequent 26%–50%, Abundant 51%–75%, Dominant >76%). Vegetation height, a proxy for mowing frequency, was recorded by dividing each quadrat into four equal sections and measuring the tallest piece of vegetation in each section. The means of vegetation and floral data were calculated per site and sampling round, using the median value of the DAFOR scale for vegetation cover. Flowering species were later classified as either weeds or cover crops, the latter representing flowers intentionally planted by growers in the between-row spaces, based on OMAFRA resources and grower insights (OMAFRA, 2023a, 2023b; Supplementary Table 2). The percentage of flowers belonging to cover crop species was then calculated. A vegetation height ratio between adjacent rows was used as a proxy for alternate row management, with a ratio ≥ 2:1 classified as ‘yes’. This pattern could result from practices such as alternate row tillage, seeding, mowing, or any other management practice that produced taller vegetation in every second row.
Bee identifications
Washed and pinned bees were identified using a dissecting microscope and several identification guides and keys (see Appendix for a list of identification guides and resources used), as well as the Discover Life bee species and genera guides (Ascher and Pickering, Reference Ascher and Pickering2022). Some groups of bees were not identified to species level due to difficulty in accurate species identifications: Lasioglossum sub-genus Dialictus, Hylaeus affinis/modesutus/illinoinesis, Sphecodes atlantis/cressonii, and one distinct morphospecies of Sphecodes sp. All results and discussion at the ‘species’ level hereafter include these sub-genus level identifications unless otherwise specified. A subset of identifications, per species, was verified by fellow graduate students in York University’s Centre for Bee Ecology, Evolution, and Conservation.
Statistical analyses
All analyses were performed in R v.4.4.2 (R Core Team, 2024) using all bees collected (pan trap and netted bees combined), unless otherwise specified. Honey bees were removed from analyses due to our focus on wild bees and a lack of knowledge on surrounding hive densities (Kratschmer et al., Reference Kratschmer, Pachinger, Schwantzer, Paredes, Guernion, Burel, Nicolai, Strauss, Bauer, Kriechbaum, Zaller and Winter2018). This includes an inability to track the use and movement of hives for crop pollination throughout the region—which grows several pollinator-dependent crops, including various fruit trees (Ontario Beekeepers’ Association, 2026; OMAFRA, 2024). To determine which vineyard management variables influence bee abundance, species richness, and Shannon diversity index, Generalized Linear Mixed Models (GLMM) were run using the packages ‘lme4’ (Bates et al., Reference Bates, Maechler, Bolker and Walker2015), ‘lmerTest’ (Kuznetsova, Brockhoff, and Christensen, Reference Kuznetsova, Brockhoff and Christensen2017), ‘glmmTMB’ (Brooks et al., Reference Brooks, Kristensen, van Benthem, Magnusson, Berg, Nielsen, Skaug, Maechler and Bolker2017), and ‘MuMIn’ (Bartoń, Reference Bartoń2024) following Zuur and Ieno (Reference Zuur and Ieno2016) and Harrison et al. (Reference Harrison, Donaldson, Correa-Cano, Evans, Fisher, Goodwin, Robinson, Hodgson and Inger2018). Models included fixed effects for management type, floral abundance, floral richness, vegetation height, vegetation cover, month, and year, with site as a random intercept to account for the non-independent repeat sampling of sites over time and unmeasured site-level variation (Supplementary Table 3; Bolker, Reference Bolker, Fox, Negrete-Yankelevich and Sosa2015). All numeric explanatory variables were scaled and centered, and one variable, floral abundance, was log(x + 1) transformed (Zuur, Ieno, and Elphick, Reference Zuur, Ieno and Elphick2010; Harrison et al., Reference Harrison, Donaldson, Correa-Cano, Evans, Fisher, Goodwin, Robinson, Hodgson and Inger2018). Multicollinearity was checked using variance inflation factors (VIF) with the package ‘car’ (Fox and Weisberg, Reference Fox and Weisberg2019). Co-plots were used to visualize interactions with month using the package ‘ggplot2’ (Wickham, Reference Wickham2016), and interactions were included in model selection when relationships varied substantially over time (Zuur et al., Reference Zuur, Ieno and Elphick2010; Harrison et al., Reference Harrison, Donaldson, Correa-Cano, Evans, Fisher, Goodwin, Robinson, Hodgson and Inger2018). Global models were fitted with the appropriate family and link function and were assessed for model fit and diagnostics by plotting Pearson’s residuals against fitted values and using the package ‘performance’ (Lüdecke et al., Reference Lüdecke, Ben-Shachar, Patil, Waggoner and Makowski2021) as well as the packages ‘gstat’ (Gräler, Pebesma, and Heuvelink, Reference Gräler, Pebesma and Heuvelink2016) and ‘sp’ (Bivand, Pebesma, and Gomez-Rubio, Reference Bivand, Pebesma and Gomez-Rubio2013) for spatial variograms of model residuals (Zuur and Ieno, Reference Zuur and Ieno2016; Harrison et al., Reference Harrison, Donaldson, Correa-Cano, Evans, Fisher, Goodwin, Robinson, Hodgson and Inger2018).
Model selection was based on the second-order Akaike Information Criterion (AICc) using the function dredge to rank all possible models and perform model averaging when multiple top models had delta AICc<2 (Harrison et al., Reference Harrison, Donaldson, Correa-Cano, Evans, Fisher, Goodwin, Robinson, Hodgson and Inger2018; Kratschmer et al., Reference Kratschmer, Pachinger, Schwantzer, Paredes, Guernion, Burel, Nicolai, Strauss, Bauer, Kriechbaum, Zaller and Winter2018; Biella et al., Reference Biella, Ramazzotti, Parolo, Galimberti, Labra and Brambilla2025). Both the zero method, which uses the ‘full model’ and sets predictor coefficients to ‘0’ for any models where that predictor is not included, and the ‘conditional model’, which calculates the average predictor coefficients only from models where that predictor is included, were used. The former uses a more conservative approach when model uncertainty is high. To get final model R2 values for averaged models, a GLMM was run with all fixed effects included in the final averaged model, significant or not. Final averaged models were assessed using the ‘DHARMa’ package (Hartig, Reference Hartig2024). For significant categorical variables, the ‘emmeans’ package (Lenth, Reference Lenth2024) was used to obtain back-transformed estimated marginal means and conduct Tukey-adjusted pairwise comparisons.
To assess the effects of cover cropping and alternate row management on bees, mid-summer models using only June and July data were run—which is when these practices were most evident. Due to some bee groups not being identified to species level, three further groups of bee data were modeled as above. First, models were run with genus-level bee richness and the Shannon diversity index. Second, the abundance of Lasioglossum (Dialictus) bees, which were highly abundant and not identified to species level, was modeled separately. Lastly, bee abundance models were also run separately for bees collected by pan trap and those collected by netting to investigate potential differences in bee responses based on sampling method (Portman, Bruninga-Socolar, and Cariveau, Reference Portman, Bruninga-Socolar and Cariveau2020; Supplementary Table 3).
GLMMs were also used to test how floral and vegetation characteristics varied by management type, with floral abundance, floral richness, vegetation cover, and vegetation height as the response variables, vineyard management, month, and year as fixed effects, and site as the random effect, following similar procedures as above. To investigate relationships between floral and vegetation variables themselves, a Spearman’s correlation matrix was run on these variables averaged across months and years, with cover crop percentage and vegetation height ratio (a quantitative proxy for alternate row management) averaged across June and July months only. Similarly, to see if vineyard management types differed in their use of cover cropping or alternate row management, the aggregated cover crop percentage and the frequency of alternate row management were compared between the management categories of organic, sustainable, and conventional using a one-way analysis of variance (ANOVA) and Fisher’s Exact test, respectively.
To examine how vineyard management influenced bee community composition, bee species abundances per site were averaged over years, and Hellinger transformations were applied (Zuur, Ieno, and Smith, Reference Zuur, Ieno and Smith2007). Non-metric multidimensional scaling (NMDS) using the ‘vegan’ package (Oksanen et al., Reference Oksanen, Simpson, Blanchet, Kindt, Legendre, Minchin, O’Hara, Solymos, Stevens, Szoecs, Wagner and Weedon2024) was run on these data, and permutational multivariate analysis of variance (PERMANOVA) tested differences across management types. Individual bee species, as well as floral and vegetation variables that were correlated with the NMDS, were determined using the envfit function with random permutations (n = 999; Kratschmer et al., Reference Kratschmer, Pachinger, Schwantzer, Paredes, Guernion, Burel, Nicolai, Strauss, Bauer, Kriechbaum, Zaller and Winter2018). To further examine how bee communities varied among management types, negative binomial Generalized Linear Models (GLMs) were run using the ‘MASS’ package (Venables and Ripley, Reference Venables and Ripley2002) for select genera. Models were run for Andrena, Agapostemon, Augochlorella, Bombus, Ceratina, Halictus, Hylaeus, and Lasioglossum as these genera were the most widespread and abundant genera across sites (Supplementary Table 4) and had at least one species associated with the NMDS of bee community composition. Models were run separately for each year, with management type as the fixed effect, on the total abundance per genus. For each model, we tested the overall effect of management type using likelihood ratio tests comparing a null model (intercept-only) to a model including management type (Bolker, Reference Bolker2008). The resulting p-values were adjusted for multiple testing using the Benjamini–Hochberg false discovery rate procedure. Lastly, NMDS was also performed on Hellinger-transformed floral species data to assess floral community differences by management type, adding floral and vegetation variables as well as individual flower species that were correlated with the NMDS, following similar procedures as above.
Results
In total, 4,490 bees from 27 genera and 95 species or species groups were collected across both years; collecting 2,510 bees, 25 genera, and 73 species in 2021 and 1,980 bees, 24 genera, and 73 species in 2022 (Table 1). The most abundant and widespread genera were Lasioglossum collected in 26 of 26 sites; Agapostemon, Andrena, Augochlorella, Bombus, and Halictus collected in 25 of 26 sites; Ceratina collected in 23 of 26 sites; and Hylaeus collected in 21 of 26 sites (Supplementary Table 4).
Summary of bees collected across all vineyard sites for each year, excluding honey bees

Table 1. Long description
The table is organized into seven columns: Year, Month, Bee abundance, Genera richness, Species richness, Mean temperature in degrees Celsius, and Total precipitation in millimeters.
For the year 2021, which totaled 2,510 bees, 25 genera, and 73 species:
* May: 493 bees, 14 genera, 37 species, 13.2 degrees Celsius, 16.2 millimeters.
* June: 637 bees, 20 genera, 46 species, 20.8 degrees Celsius, 53.2 millimeters.
* July: 961 bees, 18 genera, 39 species, 21.7 degrees Celsius, 59.9 millimeters.
* August: 419 bees, 16 genera, 33 species, 24.4 degrees Celsius, 10.2 millimeters.
For the year 2022, which totaled 1,980 bees, 24 genera, and 73 species:
* May: 348 bees, 11 genera, 35 species, 13.8 degrees Celsius, 46.77 millimeters.
* June: 386 bees, 18 genera, 39 species, 19.5 degrees Celsius, 74.7 millimeters.
* July: 673 bees, 22 genera, 39 species, 22.6 degrees Celsius, 33.1 millimeters.
* August: 573 bees, 13 genera, 30 species, 23.1 degrees Celsius, 33.6 millimeters.
Note: Species richness includes specimens identified to subgenera levels (ex. Lasioglossum (Dialictus)). Weather data were taken from the Port Weller (AUT), Ontario station (Government of Canada, 2024).
Modeling of bee responses to vineyard management practices and temporal variables displayed relationships with months and years for both bee abundance and diversity (richness and Shannon diversity). Sampling year and months were retained in the final models for all bee response variables, often being significant (p < 0.05) in both the conditional and full models. In general, bee abundance and diversity were highest in midsummer months (June and July), lowest in May, and higher in 2021 than in 2022 (Table 2). Multiple vineyard management variables also influenced bee abundance and diversity. Bee abundance had a positive relationship with vegetation height (estimate = 0.12, Z = 2.00, p = 0.046; Fig. 2A) as did bee species richness (estimate = 0.076, Z = 2.03, p = 0.043; Fig. 2B). Bee species richness was also negatively associated with certified sustainable management, though this was not significant at p < 0.05 (estimate = −0.21, Z = 1.88, p = 0.061). Shannon diversity index (H) had a positive relationship with floral abundance (estimate = 0.091, Z = 2.66, p = 0.0078; Fig. 2C) and was also negatively associated with certified sustainable management (estimate = −0.26, Z = 2.34, p = 0.019). Post hoc testing showed there was a higher H in organic vineyards compared to certified sustainable vineyards, while conventional vineyards did not significantly differ from either management type (Fig. 2D). Genus-level results were generally similar to species-level but with less significance (Supplementary Table 5). Interestingly, bee genus richness was most impacted by floral richness, with a positive but not significant relationship (estimate = 0.064, Z = 1.93, p = 0.055). For Shannon genus diversity (H′), results were similar to species-level but were no longer significant at p < 0.05. Floral abundance had a positive influence on H′ (estimate = 0.066, Z = 1.93, p = 0.054) while certified sustainable vineyards had lower H′ (estimate = −0.21, Z = 1.80, p = 0.072).
Generalized linear mixed model (GLMM) summaries for each bee response variable with site as a random effect
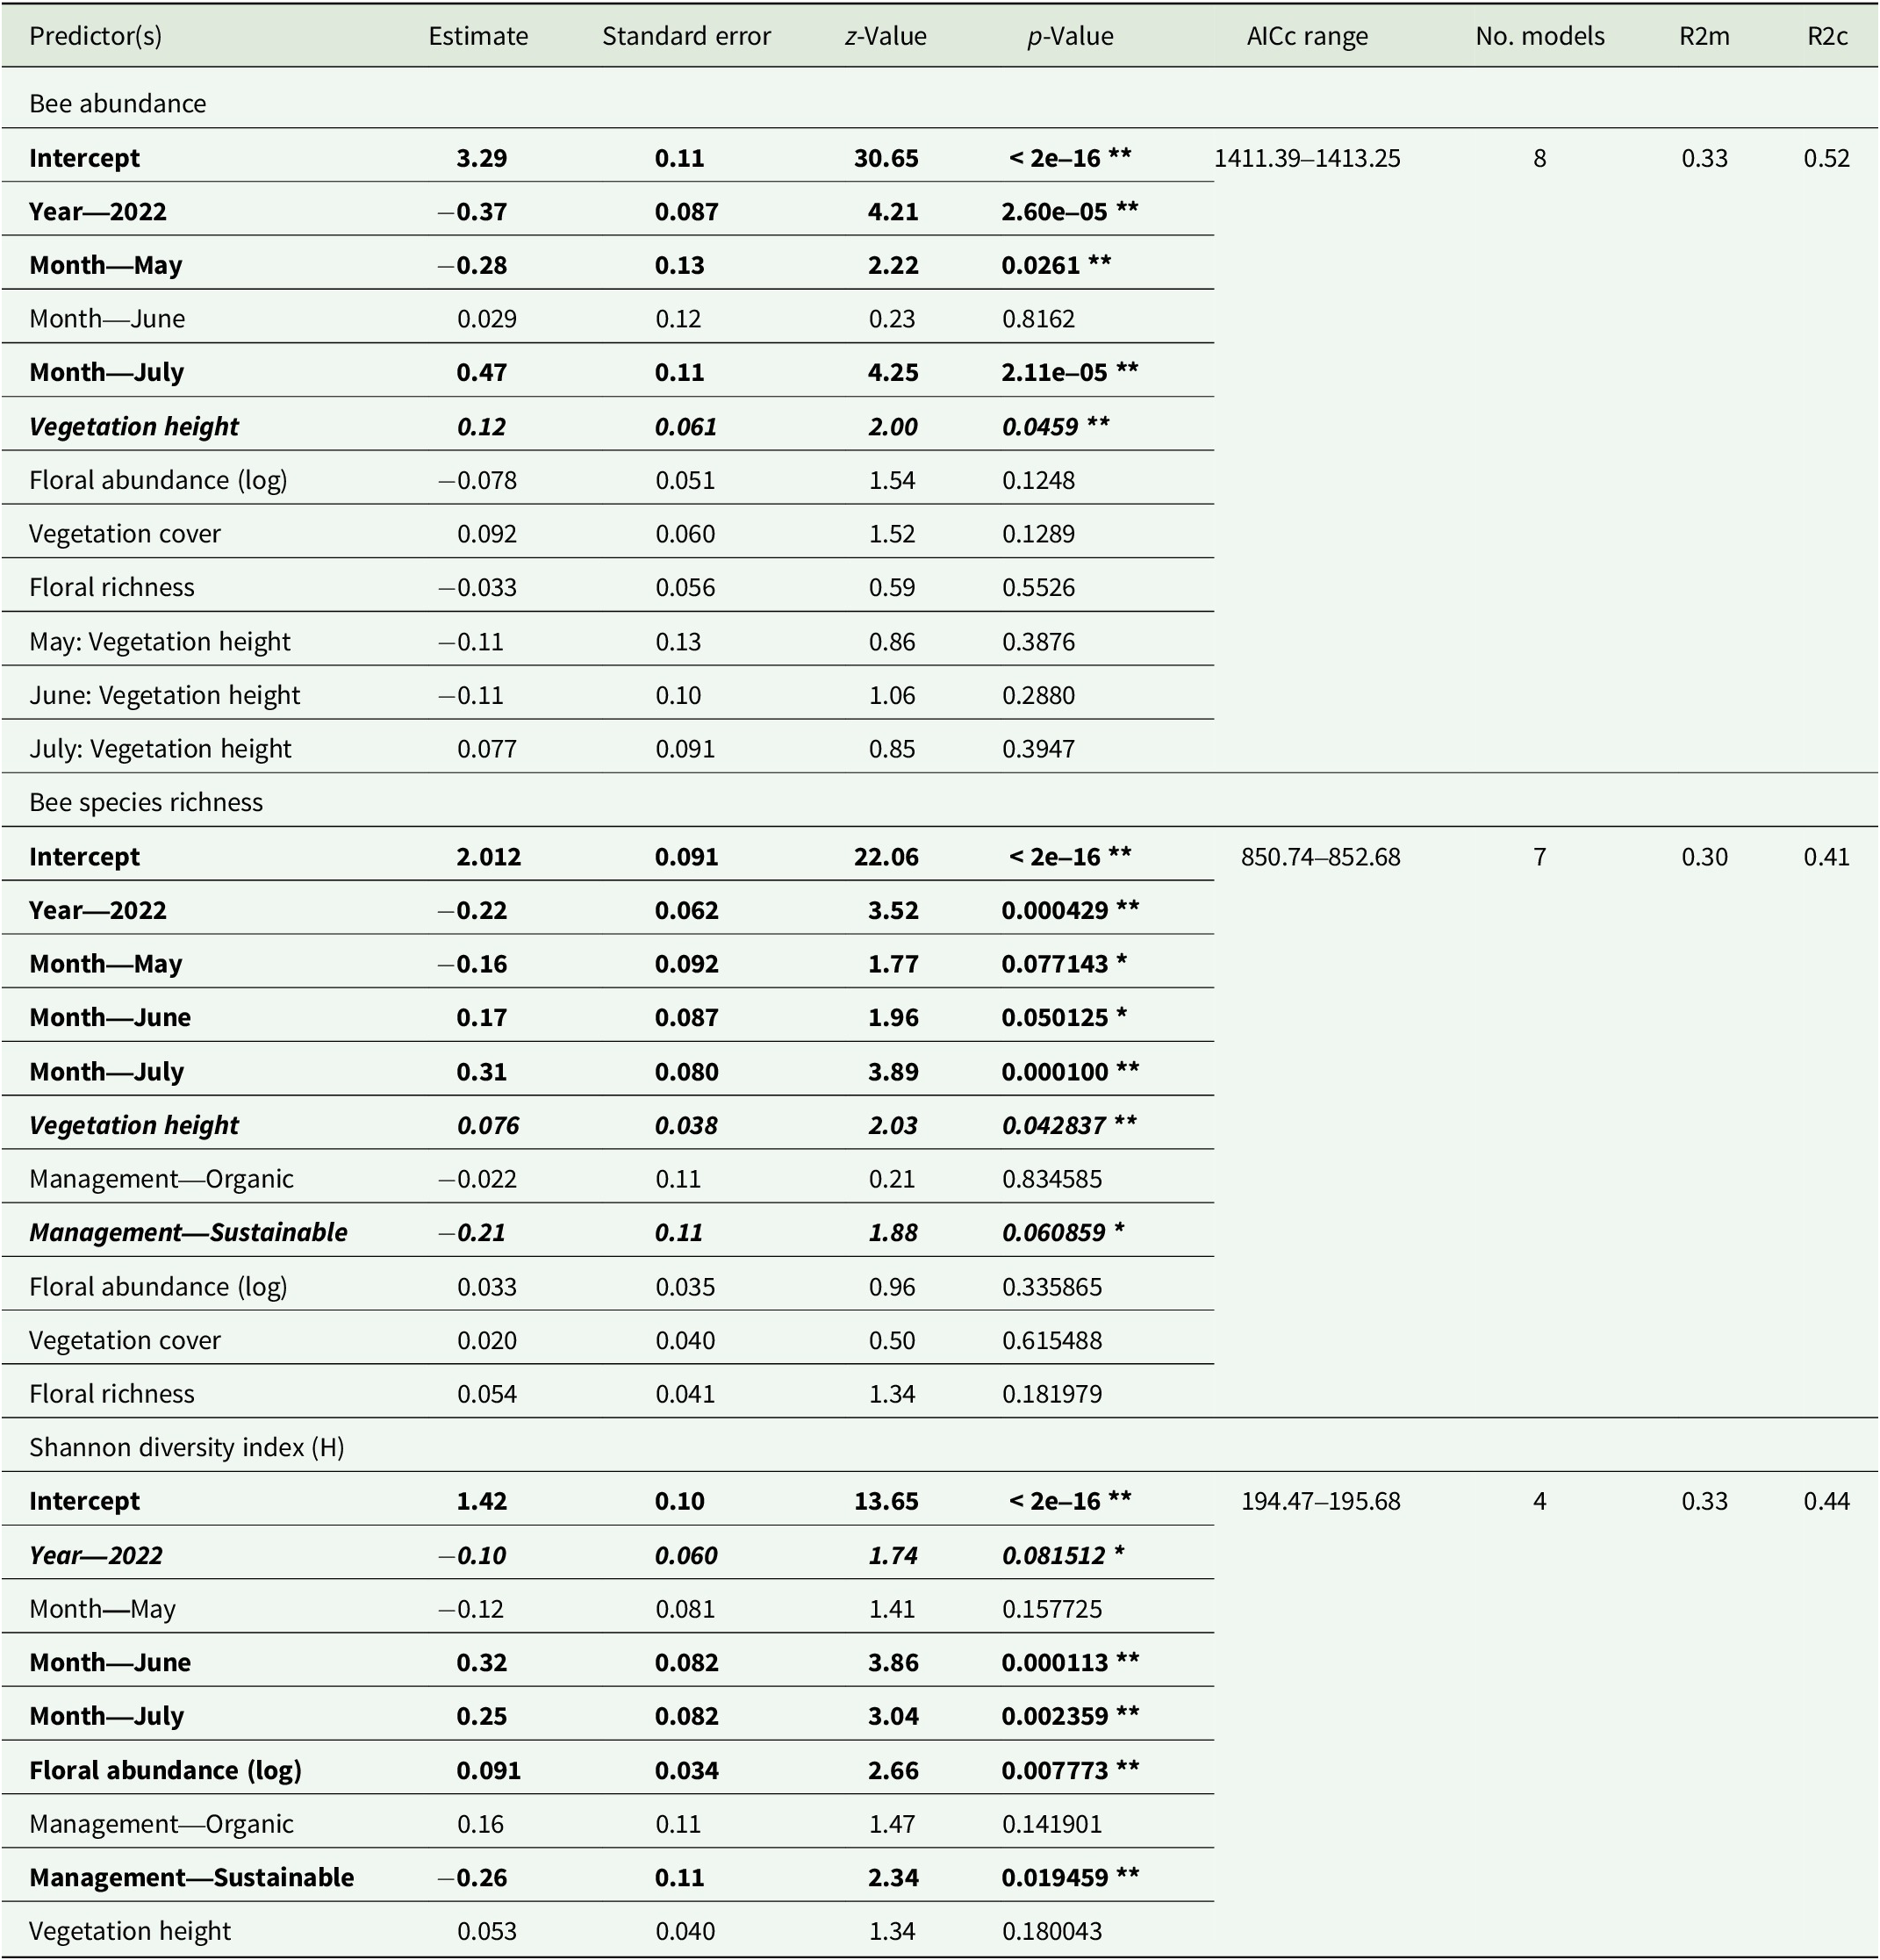
Table 2. Long description
The table is divided into three primary sections based on bee response variables.
1. Bee abundance section:
* Intercept: Estimate 3.29, p-Value less than 2e minus 16.
* Year 2022: Estimate minus 0.37, p-Value 2.60e minus 05.
* Month May: Estimate minus 0.28, p-Value 0.0261.
* Month July: Estimate 0.47, p-Value 2.11e minus 05.
* Vegetation height: Estimate 0.12, p-Value 0.0459.
* Model stats: A I C c range 1411.39 to 1413.25, 8 models, R 2 m 0.33, R 2 c 0.52.
2. Bee species richness section:
* Intercept: Estimate 2.012, p-Value less than 2e minus 16.
* Year 2022: Estimate minus 0.22, p-Value 0.000429.
* Month May: Estimate minus 0.16, p-Value 0.077143.
* Month June: Estimate 0.17, p-Value 0.050125.
* Month July: Estimate 0.31, p-Value 0.000100.
* Vegetation height: Estimate 0.076, p-Value 0.042837.
* Management Sustainable: Estimate minus 0.21, p-Value 0.060859.
* Model stats: A I C c range 850.74 to 852.68, 7 models, R 2 m 0.30, R 2 c 0.41.
3. Shannon diversity index (H) section:
* Intercept: Estimate 1.42, p-Value less than 2e minus 16.
* Year 2022: Estimate minus 0.10, p-Value 0.081512.
* Month June: Estimate 0.32, p-Value 0.000113.
* Month July: Estimate 0.25, p-Value 0.002359.
* Floral abundance (log): Estimate 0.091, p-Value 0.007773.
* Management Sustainable: Estimate minus 0.26, p-Value 0.019459.
* Model stats: A I C c range 194.47 to 195.68, 4 models, R 2 m 0.33, R 2 c 0.44.
Note: Model summaries are from model averaging of the top models (ΔAICc<2). On the left are predictors included in the conditional averaged models alongside their estimates, standard errors (adjusted for averaged models), z-values, and p-values. All continuous predictor variables were standardized (z-scored) before analyses. Interactions are denoted by ‘X:X’. Significant predictors are shown at p < 0.05 (**) and nearly significant at p < 0.1 (*). Bolded predictors are significant in both the full and conditional models, while bolded and italicized predictors are significant only in the conditional model. For categorical variables, reference values are those not shown: ‘Conventional’ for Management, ‘2021’ for Year, and ‘August’ for Month. Also shown is the range of AICc values across the top models included in model averaging, as well as the number of models included in the final averaged model. The marginal R2 (R2m, variance explained by fixed effects) and conditional R2 (R2c, variance explained by fixed and random effects) are shown for a model run with all variables included in the averaged model (significant or not).
Significant (p < 0.05) vineyard management predictors from the Generalized Linear Mixed Models (GLMM) of bee response variables: bee abundance (A), bee species richness (B), and Shannon diversity index (C, D). Final GLMMs were averaged from the top models using delta AICc <2. Graphs show the raw data points. For categorical variables, Tukey post hoc tests from model-estimated marginal means are shown with different letters denoting significantly different categories (p < 0.05).

Figure 2. Long description
A four-panel set of graphs labeled A through D.
Panel A is a scatter plot with a regression line and gray confidence interval. The x-axis is Vegetation height in centimeters from 0 to 60. The y-axis is Bee abundance from 0 to 90. The data shows a slight positive linear increase in bee abundance as vegetation height increases.
Panel B is a scatter plot with a regression line and gray confidence interval. The x-axis is Vegetation height in centimeters from 0 to 60. The y-axis is Bee species richness from 0 to 15. The data shows a clear positive linear increase in species richness as vegetation height increases.
Panel C is a scatter plot with a regression line and gray confidence interval. The x-axis is Floral abundance log from 0 to 6. The y-axis is Shannon diversity H from 0.0 to 2.0. The data shows a positive linear trend between floral abundance and diversity.
Panel D is a box plot comparing Shannon diversity H on the y-axis across three Management categories on the x-axis. Conventional management has a median diversity around 1.4 and is labeled with letters a b. Organic management shows the highest median diversity near 1.7 and is labeled with letter a. Sustainable management shows the lowest median diversity around 1.3 and is labeled with letter b. Outliers are represented by black dots below the whiskers.
The mid-summer models, which included cover cropping and alternate row management, were largely similar to those from the entire growing season (Table 3 and Supplementary Table 6). Alternate row management did not have a significant impact on bee abundance or diversity in any models. However, the percentage of flowers that came from cover crop species had a negative relationship with bee abundance (estimate = −0.12, Z = 2.64, p = 0.008; Fig. 3A) and no significant relationship with species or genus level richness or diversity. Specific to mid-summer months, a positive relationship was seen between vegetation cover and bee abundance (estimate = 0.19, Z = 2.92, p = 0.004; Fig. 3B) as well as between vegetation height and Shannon diversity index (estimate = 0.15, Z = 3.48, p = 0.0005; Fig. 3C) as well as Shannon genus diversity index (estimate = 0.11, Z = 2.28, p = 0.023). Bee species richness was negatively associated with sustainable management in mid-summer (estimate = −0.23, Z = 2.04, p = 0.042); however, post-hoc comparisons were not significant (Fig. 3D).
Generalized linear mixed model (GLMM) summaries for each bee response variable for mid-summer models run with June and July data only, to include cover crop percentage and alternate row management as additional predictors
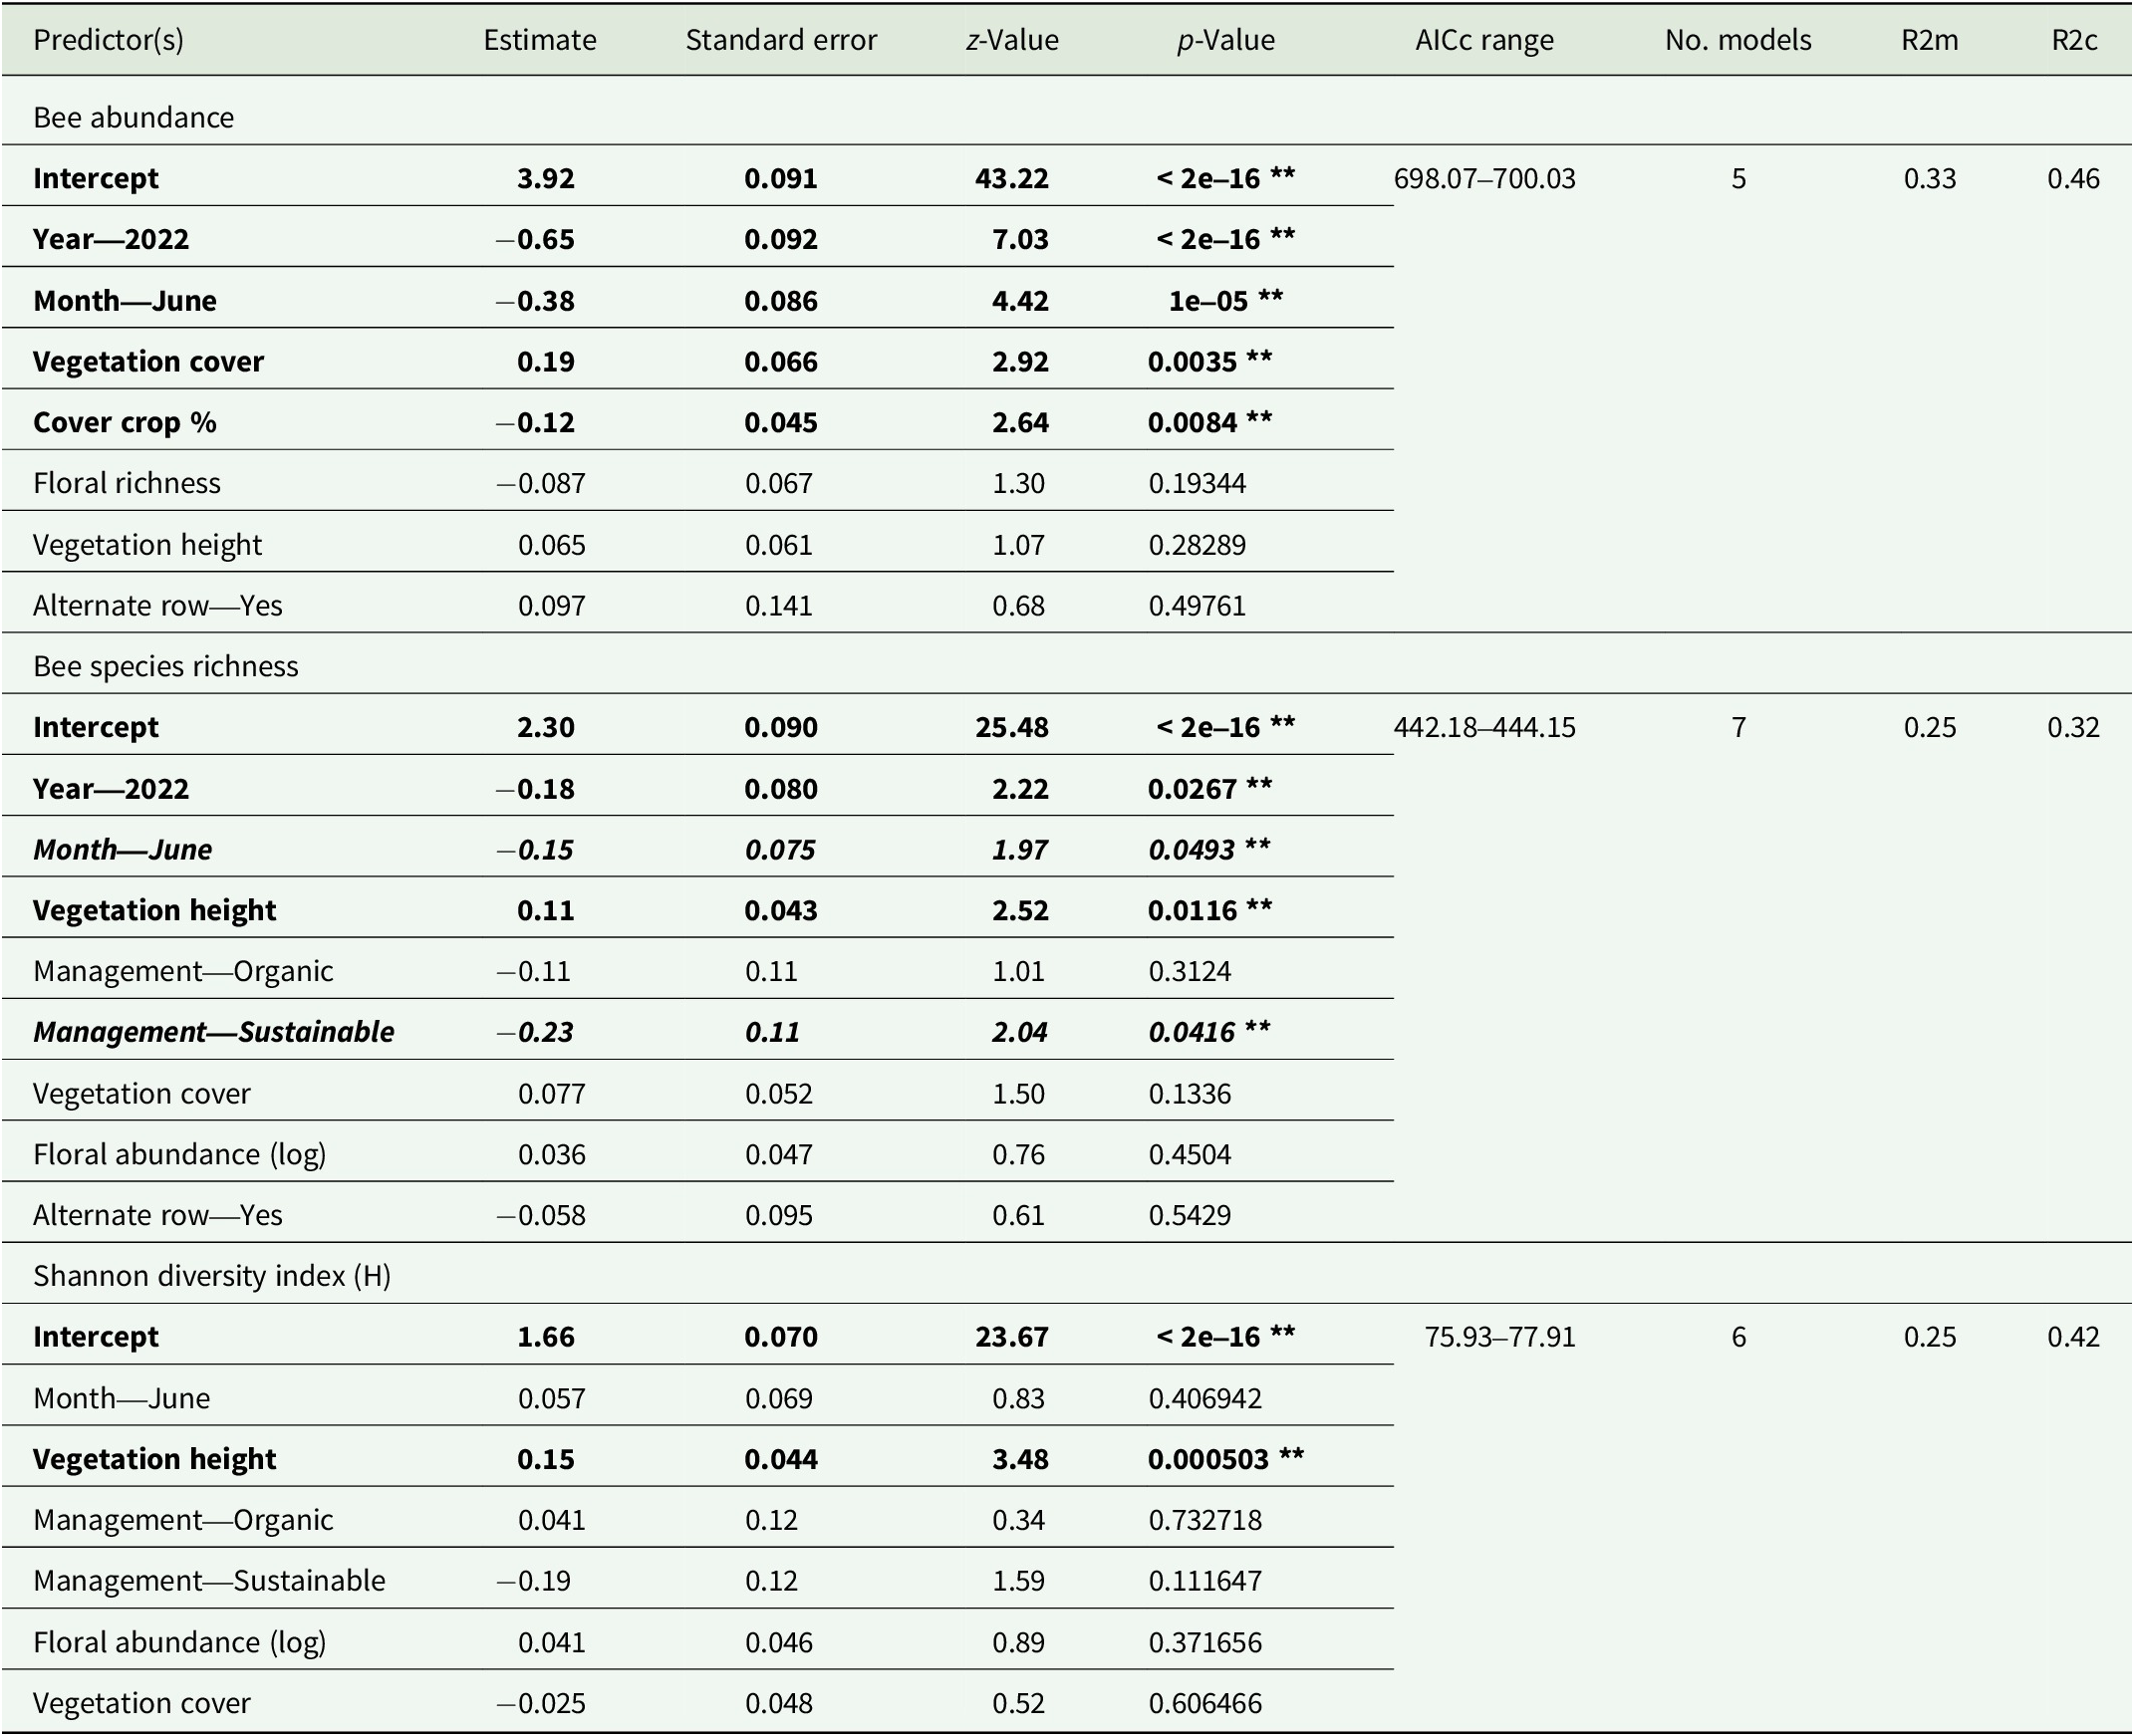
Table 3. Long description
The table is divided into three horizontal sections based on bee response variables.
1. Bee abundance section: Significant predictors include Intercept (Estimate 3.92, p < 2e-16), Year-2022 (-0.65, p < 2e-16), Month-June (-0.38, p 1e-05), Vegetation cover (0.19, p 0.0035), and Cover crop % (-0.12, p 0.0084). Non-significant predictors are Floral richness, Vegetation height, and Alternate row-Yes. Model stats: A I C c range 698.07 to 700.03, 5 models, R 2 m 0.33, R 2 c 0.46.
2. Bee species richness section: Significant predictors include Intercept (2.30, p < 2e-16), Year-2022 (-0.18, p 0.0267), Month-June (-0.15, p 0.0493), Vegetation height (0.11, p 0.0116), and Management-Sustainable (-0.23, p 0.0416). Non-significant predictors are Management-Organic, Vegetation cover, Floral abundance log, and Alternate row-Yes. Model stats: A I C c range 442.18 to 444.15, 7 models, R 2 m 0.25, R 2 c 0.32.
3. Shannon diversity index H section: Significant predictors include Intercept (1.66, p < 2e-16) and Vegetation height (0.15, p 0.000503). Non-significant predictors are Month-June, Management-Organic, Management-Sustainable, Floral abundance log, and Vegetation cover. Model stats: A I C c range 75.93 to 77.91, 6 models, R 2 m 0.25, R 2 c 0.42.
Note: All models had site as a random effect. Model summaries are from model averaging of the top models (ΔAICc<2). On the left are predictors included in the conditional averaged model alongside their estimates, standard errors (adjusted for averaged models), z-values, and p-values. All continuous predictor variables were standardized (z-scored) before analyses. Interactions are denoted by ‘X:X’. Significant predictors are shown at p < 0.05 (**) and nearly significant at p < 0.1 (*). Bolded predictors are significant in both the full and conditional models, while bolded and italicized predictors are significant only in the conditional model. For categorical variables, reference values are those not shown: ‘Conventional’ for Management, ‘2021’ for Year, ‘June’ for Month, ‘No’ for Alternate row. Also shown is the range of AICc values across the top models included in model averaging, as well as the number of models included in the final averaged model. The marginal R2 (R2m, variance explained by fixed effects) and conditional R2 (R2c, variance explained by fixed and random effects) are shown for a model run with all variables included in the averaged model (significant or not).
Newly significant (p < 0.05) vineyard management predictors from the Generalized Linear Mixed Models (GLMM) for bee response variables from mid-summer months only (June and July) for bee abundance (A, B), Shannon Diversity of bee species (C), and bee species richness (D). Final GLMMs were averaged from the top models using delta AICc <2. Graphs show the raw data points. For categorical variables, Tukey post hoc tests from model-estimated marginal means are shown with different letters denoting significantly different categories (p < 0.05).

Figure 3. Long description
A multi-panel figure containing three scatter plots with regression lines and one box plot.
* Panel A: A scatter plot with a regression line showing a slight downward trend. The y-axis is Bee abundance from 0 to 90. The x-axis is Flowers from cover crops (percentage) from 0 to 100. Data points are concentrated between 0 and 30 on the y-axis.
* Panel B: A scatter plot with a regression line showing a slight upward trend. The y-axis is Bee abundance from 0 to 90. The x-axis is Vegetation cover (percentage) from 20 to 80. A shaded confidence interval widens as vegetation cover increases.
* Panel C: A scatter plot with a regression line showing a clear linear increase. The y-axis is Shannon diversity (H) from 0.5 to 2.5. The x-axis is Vegetation height (cm) from 20 to 60. Most data points cluster between 1.0 and 2.0 on the y-axis.
* Panel D: A box plot comparing Bee species richness across three categories on the x-axis: Conventional, Organic, and Sustainable. The y-axis ranges from 5 to 15. All three categories are labeled with the letter ‘a’ above their whiskers, indicating no significant difference. Organic management shows the highest median and a single outlier point at the top.
Models examining distinct groups of collected bees produced differing results. Models specifically examining Lasioglossum (Dialictus) abundance revealed a negative relationship with floral abundance (estimate = −0.17, Z = 2.06, p = 0.040; Supplementary Table 7) and in mid-summer, a positive relationship with vegetation cover (estimate = 0.24, Z = 2.18, p = 0.030) and negative association with organic management (estimate = −0.66, Z = 2.37, p = 0.018). Furthermore, models of the abundance of bees collected by netting showed that netted bees were positively associated with vegetation height (estimate = 0.24, Z = 3.57, p = 0.0004) and floral richness (estimate = 0.23, Z = 3.82, p = 0.0001) and slightly negatively associated with sustainable management, though this was not significant (estimate = −0.38, Z = 1.86, p = 0.0630; Supplementary Table 8). In mid-summer, similar relationships existed with vegetation height and floral richness, while a nearly significant positive relationship with floral abundance was also seen (estimate = 0.17, Z = 1.82, p = 0.069). Pan trapped bee abundance, oppositely, had a negative relationship with floral richness (estimate = −0.17, Z = 2.10, p = 0.036) and a positive relationship with vegetation height in July only (estimate = 0.29, Z = 2.46, p = 0.014) and a nearly significant positive relationship with vegetation cover (estimate = 0.14, Z = 1.94, p = 0.0519). In mid-summer, similar relationships were seen with floral richness and vegetation cover, as well as a negative relationship with the percentage of flowers from cover crops (estimate = −0.22, Z = 4.12, p = 0.000).
Overall, between-row vegetation characteristics were important predictors of multiple bee response variables, with vegetation height emerging as the most influential factor. Across the full growing season (Table 4), bee abundance, netted bee abundance, and bee species richness all increased with greater vegetation height. During mid-summer (Table 5), vegetation height was also positively associated with netted bee abundance, bee species richness, and Shannon diversity at both the species and genus levels. Vegetation cover showed fewer significant relationships and only during mid-summer, where it was positively associated with total bee abundance, pan-trapped bee abundance, and Lasioglossum (Dialictus) abundance. Floral resources exhibited mixed effects; floral richness was positively associated with netted bee abundance but negatively associated with pan-trapped bee abundance, while floral abundance was positively related to Shannon diversity and negatively related to Lasioglossum (Dialictus) abundance. In mid-summer, cover cropping was negatively associated with both bee abundance and pan-trapped bee abundance, whereas alternate row management showed no significant relationships. Vineyard management type had modest effects, with sustainable management negatively associated with bee species richness (mid-summer) and Shannon species diversity (full season), while organic management was negatively associated with Lasioglossum (Dialictus) abundance (mid-summer). Collectively, these results suggest that while some aspects of between-row vegetation structure broadly support bee communities, specific bee taxa may respond differently to particular vegetation characteristics and management practices.
Summary of the top models for each bee response variable across the entire growing season

Table 4. Long description
The table columns represent eight bee response variables: Bee abundance total, Netted bee abundance, Pan-trapped bee abundance, Bee species richness, Bee genus richness, Shannon Diversity Index for bee species, Shannon Diversity Index for bee genera, and Lasioglossum Dialictus abundance. Each column provides the Estimate plus or minus Standard Error (S E).
Key predictors (rows) include:
* Intercept: Significant positive values across all variables, ranging from 1.21 to 3.29.
* Year 2022: Significant negative relationships for total abundance -0.37, pan-trapped abundance -0.49, species richness -0.22, genus richness -0.20, and Lasioglossum -0.58.
* Month July: Significant positive relationships for total abundance 0.47, pan-trapped abundance 0.61, species richness 0.31, genus richness 0.27, Shannon species diversity 0.25, and Lasioglossum 0.62.
* Vegetation height: Significant positive relationships for total abundance 0.12, netted abundance 0.24, and species richness 0.076.
* Floral richness: Significant positive relationship for netted abundance 0.23 and significant negative for pan-trapped abundance -0.17.
* Floral abundance log: Significant positive for Shannon species diversity 0.091 and significant negative for Lasioglossum -0.17.
* Management Sustainable: Significant negative relationship for Shannon species diversity -0.26.
Model fit statistics at the bottom show Marginal R squared (R sub 2 m) values from 0.09 to 0.39 and Conditional R squared (R sub 2 c) values from 0.15 to 0.61.
Note: For each model’s predictors, the estimate (Est) and adjusted standard error (SE) are shown, as well as the model’s marginal R2 (R2m) and conditional R2 (R2c). Empty cells are variables that were not retained in the top-averaged model based on delta AICc. Interaction terms, which were only included in the bee abundance models, are not shown. Orange shading represents a negative relationship with the response variables, and green indicates a positive relationship, while bolded text and darker shading indicate significance at p < 0.05. For categorical variables, reference values are those not shown: ‘Conventional’ for Management, ‘2021’ for Year, and ‘August’ for Month.
Summary of the top models for each bee response variable across mid-summer months

Table 5. Long description
A table with 9 columns and 14 rows. The columns represent bee response variables: Bee abundance total, Netted bee abundance, Pan-trapped bee abundance, Bee species richness, Bee genus richness, Shannon Diversity Index bee species, Shannon Diversity Index bee genera, and Lasioglossum (Dialictus) abundance.
Rows list predictors with values formatted as Estimate plus or minus Standard Error:
* Intercept: Significant positive values across all variables, ranging from 1.31 to 3.92.
* Year 2022: Significant negative effects on total abundance (-0.65), pan-trapped abundance (-0.84), species richness (-0.18), genus richness (-0.17), and Lasioglossum abundance (-0.81).
* Month June: Significant negative effects on total abundance (-0.38), pan-trapped abundance (-0.47), species richness (-0.15), and Lasioglossum abundance (-1.02); significant positive effect on Shannon Diversity Index bee genera (0.19).
* Vegetation cover: Significant positive effects on total abundance (0.19), pan-trapped abundance (0.24), and Lasioglossum abundance (0.24).
* Vegetation height: Significant positive effects on netted abundance (0.22), species richness (0.11), and both Shannon Diversity indices (0.15 and 0.11).
* Floral richness: Significant positive effect on netted abundance (0.18) and significant negative effect on pan-trapped abundance (-0.17).
* Management Sustainable: Significant negative effect on bee species richness (-0.23).
* Management Organic: Significant negative effect on Lasioglossum abundance (-0.66).
* Cover crop percentage: Significant negative effects on total abundance (-0.12) and pan-trapped abundance (-0.22).
The bottom rows provide model fit statistics: R sub 2 m (marginal) ranges from 0.04 to 0.56, and R sub 2 c (conditional) ranges from 0.09 to 0.70, with Lasioglossum abundance showing the highest fit.
Note: For each model’s predictors, the estimate (Est) and adjusted standard error (SE) are shown, as well as the model’s marginal R2 (R2m) and conditional R2 (R2c). Empty cells are variables that were not retained in the top-averaged model based on delta AICc. Orange shading represents a negative relationship with the response variables, and green indicates a positive relationship, while bolded text and darker shading indicate significance at p < 0.05. For categorical variables, reference values are those not shown: ‘Conventional’ for Management, ‘2021’ for Year, ‘July’ for Month, and ‘No’ for Alternate row management.
This was further seen with the analysis of the bee species and their abundances across sites, which showed that bee community composition differed significantly between vineyard management categories (PERMANOVA F = 2.18, R2 = 0.16, p = 0.003; Fig. 4). Certified sustainable sites were associated with Lasioglossum (Dialictus), Andrena commoda, and Agapostemon virescens, while conventional sites were associated with Halictus confusus, Halictus rubicundus, Osmia conjuncta, Melissodes subillatus, Ceratina calcarata, and Lasioglossum cinctipes. Organic sites were associated with Andrena wilkella, Augochlorella aurata, Megachile mendica, and Hylaeus affinis/modestus/illinoisensis. Augochlora pura, Bombus bimaculatus, Bombus impatiens, and Andrena nasonii were associated with both organic and conventional sites, while Lasioglossum zonulum was associated with both sustainable and organic sites. Organic sites were also associated with higher floral richness, vegetation cover, and vegetation height (Fig. 4). Comparisons of the abundance of select genera between management types further highlighted some of these differences in bee community composition, though no genera were significantly different at p < 0.05 after false discovery rate adjustments (Supplementary Table 9). However, some trends include, in at least 1 year of the study, Bombus and Hylaeus were less abundant in sustainable sites, Augochlorella and Andrena were more abundant in organic sites, and Lasioglossum were more abundant in sustainable sites.
Non-metric multidimensional scaling (NMDS) of bee community composition data aggregated per site across months and years (n = 26) using Bray–Curtis dissimilarity of Hellinger-transformed abundance data (stress = 0.20). Convex hulls represent different vineyard management categories (Permutational Multivariate Analysis of Variance F = 2.18, R2 = 0.16, p = 0.003) as well as vectors for significantly correlated bee species and vegetation and floral variables (p < 0.05, based on 999 permutations).

Figure 4. Long description
An N M D S ordination plot with M D S 1 on the horizontal axis and M D S 2 on the vertical axis, both ranging from negative 1.0 to 1.0. At the center of the plot, three colored convex hulls represent vineyard management categories: red for Conventional, green for Organic, and blue for Sustainable. The hulls overlap significantly around the origin.
Numerous vectors radiate from the center toward the periphery, indicating correlated bee species and environmental variables.
In the upper-left quadrant, vectors point toward Lasioglossum Dialictus and Andrena commoda.
In the upper-right quadrant, vectors point toward Halictus confusus, Osmia conjuncta, Halictus rubicundus, Melissodes subillatus, Ceratina calcarata, and Lasioglossum cinctipes.
In the lower-right quadrant, a dense cluster of vectors points toward environmental variables including Veg ht, Floral rich, and Veg cov, alongside species such as Hylaeus affinis modestus illinoisensis, Megachile mendica, Augochlorella aurata, Andrena nasonii, and Bombus impatiens.
Along the right horizontal axis, vectors point toward Bombus bimaculatus and Augochlora pura.
In the lower-left quadrant, vectors point toward Lasioglossum zonulum and Agapostemon virescens.
In the bottom-center, a vector points toward Andrena wilkella.
Comparison of the local vegetation characteristics and floral resources across vineyard management categories (Supplementary Table 10) revealed that certified sustainable vineyards had the lowest floral richness (estimate = −0.70, p = 0.02; Fig. 5A). Vegetation height was slightly positively influenced by organic management (estimate = 6.18, p = 0.09), and post hoc testing indicated that vegetation was tallest in organic vineyards and shortest in certified sustainable vineyards, with conventional vineyards not differing significantly from either (Fig. 5B). Furthermore, aggregated floral and vegetation data across months and years showed that several of these variables were significantly correlated with one another (p < 0.05; Supplementary Figure 1). Vegetation height, vegetation cover, floral abundance, and floral richness were all positively correlated with one another, while the vegetation height ratio (proxy for alternate row management) was strongly negatively correlated with vegetation cover. When comparing cover cropping and alternate row management across vineyard management categories in mid-summer, there was no difference in the percentage of flowers from cover crops between organic, conventional, or sustainable vineyards (Supplementary Figure 2A) or in the use of alternate row management (Supplementary Figure 2B). Lastly, grouping of sites by their flower species and abundances showed that the floral community composition also differed significantly between vineyard management categories, with organic vineyards being most dissimilar to conventional and certified sustainable vineyards (PERMANOVA F = 1.81, R2 = 0.14, p = 0.005; Fig. 6). Organic vineyards were associated with species such as common chickweed (Stellaria media), yellow sweetclover (Melilotus officinalis), and spotted ladysthumb (Polygonum persicaria), while sustainable and conventional sites were more associated with black medick (Medicago lupilina). Vineyard floral abundance and cover crop percentage were associated with the sorting of sites by floral communities, with cover cropping being associated with sites high in red clover (Trifolium pratense) and common dandelion (T. officinale), while high floral abundance sites were associated with prostrate knotweed (P. aviculare).
Comparison of floral richness (A) and vegetation height (B) in vineyards under different management types. Graphs show the estimated marginal means from Generalized Linear Mixed Models of each response variable with month, year, and vineyard management as fixed effects and site as a random effect. Letters denote significantly different categories (p < 0.05) from Tukey post hoc testing of model-estimated marginal means.

Figure 5. Long description
Two side-by-side bar charts labeled A and B.
Panel A, Estimated floral richness. The y-axis ranges from 0.0 to 2.0. The x-axis is labeled Management.
- Conventional management has a bar height of approximately 1.8 with an error bar and the letter a above it.
- Organic management has the highest bar at approximately 1.9 with an error bar and the letter a above it.
- Sustainable management has the lowest bar at approximately 1.2 with an error bar and the letter b above it.
Panel B, Estimated vegetation height in centimeters. The y-axis ranges from 0 to 30. The x-axis is labeled Management.
- Conventional management has a bar height of approximately 25 with an error bar and the letters a b above it.
- Organic management has the highest bar at approximately 31 with an error bar and the letter a above it.
- Sustainable management has the lowest bar at approximately 21 with an error bar and the letter b above it.
Non-metric multidimensional scaling (NMDS) of flower community composition data aggregated per site (n = 26) using Bray–Curtis dissimilarity of Hellinger-transformed abundance data (stress = 0.25). Convex hulls represent vineyard management categories (PERMANOVA F = 1.81, R2 = 0.14, p = 0.005). Overlaid are vectors of the most correlated vegetation and floral variables with the ordination (p < 0.1, based on 999 permutations, black font); Floral_ab = floral abundance (r2 = 0.26, p = 0.03) and CC_per = percentage of flowers from cover crops in mid-summer months (r2 = 0.19, p = 0.09). Also shown are the flower species that were significantly correlated with the ordination (p < 0.05), highlighting species that largely contribute to community variation (orange font). Redundant species with overlapping vectors were removed for clarity: Asclepias syriaca, Hieracium lachenalii, and Linaria vulgaris (redundant with Arabis hirsuta).

Figure 6. Long description
The scatter plot uses N M D S 1 on the x-axis ranging from -1.0 to 1.0 and N M D S 2 on the y-axis ranging from -0.5 to 1.0. A legend at the top identifies three management categories: Conventional (red dots), Organic (green dots), and Sustainable (blue dots).
* Data Clusters: Three overlapping convex hulls represent the management types. The Organic hull (green) is the largest, shifted toward the upper-left quadrant. The Sustainable hull (blue) is central, and the Conventional hull (red) is shifted toward the lower-right quadrant.
* Environmental Vectors (Black Arrows): Two black vectors originate from the center. C C _ per points toward the top-right (positive N M D S 2). Floral _ ab points toward the bottom-left (negative N M D S 1 and N M D S 2).
* Species Vectors (Red Arrows): Multiple red vectors radiate from the center to specific species labels in orange font:
- Top-Left: Stellaria _ media, Melilotus _ officinalis, and Polygonum _ persicaria.
- Top-Center: Trifolium _ pratense.
- Top-Right: Taraxacum _ officinale.
- Bottom-Right: Medicago _ lupulina.
- Bottom-Left: Arabis _ hirsuta and Polygonum _ aviculare.
Discussion
Of the vineyard management practices investigated in this study, the most consistently impactful variable on bee abundance and diversity was mowing frequency, as measured through between-row vegetation height. We hypothesized that sites with lower mowing frequencies, and thus taller vegetation, would support more abundant and diverse bee communities—consistent with what was found. However, while vegetation height was used as a proxy for mowing frequency, it can also be influenced by factors such as the plant community composition, tillage practices, soils and nutrients, and light and water availability (den Hollander, Bastiaans, and Kropff, Reference den Hollander, Bastiaans and Kropff2007). Vegetation height is less frequently recorded in other studies on this topic; however, the positive association with vegetation height in this study is consistent with Biella et al. (Reference Biella, Ramazzotti, Parolo, Galimberti, Labra and Brambilla2025), who also found a significant positive impact of vegetation height on bee diversity. While vegetation height, floral richness, floral abundance, and vegetation cover were all positively correlated with each other in this study, vegetation height was the most consistently significant predictor of bee abundance and diversity. This suggests that vegetation height may capture additional ecological factors beyond those represented by the other correlated variables. The hypothesis was then that the floral community composition would differ with vegetation height, as taller vegetation would allow certain forbs to reach flowering that otherwise would not be able to flower with constant mowing. However, vegetation height did not significantly correlate with the NMDS of sites by floral composition. Instead, floral abundance and cover crop percentage had a stronger influence. Although the underlying mechanism remains unclear, reducing mowing frequency may benefit bees, and possibly other pollinators, and warrants further investigation with research extending beyond pollinator conservation to include broader vineyard management implications, such as impacts on pest and predator populations, fungal pressure, and other relevant factors (Guerra and Steenwerth, Reference Guerra and Steenwerth2012).
Two other between-row vegetation variables had a positive association with bees—floral abundance had a positive relationship with the Shannon diversity index, and vegetation cover had a positive relationship with bee abundance during mid-summer months. This is consistent with the hypothesis that vineyards with more vegetation cover between vine rows, as opposed to bare soil, and where vegetation consisted of more flowers, as opposed to grasses, would support more abundant and diverse bees. The positive influence of vegetation cover seen in this study is consistent with Popescu et al. (Reference Popescu, Comsa, Hoble, Bunea, Gaman, Tamas, Guernion, Kratschmer, Zaller and Winter2019) and Kratschmer et al. (Reference Kratschmer, Pachinger, Schwantzer, Paredes, Guzmán, Goméz, Entrenas, Guernion, Burel, Nicolai, Fertil, Popescu, Macavei, Hoble, Bunea, Kriechbaum, Zaller and Winter2019) and highlights the importance of between-row vegetation cover rather than bare soil for bees. Furthermore, the positive influence of floral abundance on bees emphasizes that floral cover between vine rows, rather than grasses alone, which are also common cover crops (Sharifi et al., Reference Sharifi, Salimi, Rosa and Hart2024), is an important consideration for bee conservation in vineyards. Further research should be extended to investigations into floral under-vine cover cropping (Abad et al., Reference Abad, Marín, Imbert, Virto, Garbisu and Santesteban2023), which opposes the common practice of herbicides or tillage, as half the quadrats used in this study were placed toward the vine rows to capture all floral resources within the vineyard. This practice could further extend the cover of vegetation and flowers in vineyards and may be beneficial to bees. Interestingly, while floral richness was not a significant predictor in the bee abundance or diversity models, it was significantly associated with the NMDS of sites by bee community composition. Furthermore, high floral richness was associated with higher bee abundance through netting but lower bee abundance in pan traps. The negative relationship with pan-trapped bees may be explained by the taxonomic bias of pan-trap collections toward certain bees, such as Halictidae, which may not require as diverse a floral resource (Portman et al., Reference Portman, Bruninga-Socolar and Cariveau2020). Alternatively, it is possible that bees are more likely to be collected by pan traps in resource-poor environments, though the opposite relationship may also be true as flowers draw in more bees to the area (Portman et al., Reference Portman, Bruninga-Socolar and Cariveau2020). Consistent with this uncertainty, a recent systematic review of pan trapping studies by Krahner et al. (Reference Krahner, Dietzsch, Jütte, Pistorius and Everaars2024) found no consistent evidence that surrounding floral abundance or diversity systematically increases or decreases bees captured in pan traps, with correlations being highly variable and often non-significant even among studies using similar methodologies.
During mid-summer months, when cover crop species were primarily in bloom, the cover crop percentage of floral resources was negatively associated with bee abundance and had no association with bee diversity, not supporting the prediction that floral cover crops would positively influence bee communities. These results may be explained by the common cover crop species observed, which were predominantly clover species (Trifolium sp.)—with white clover ( Trifolium repens ) being the fourth most abundant flower species recorded occurring in 23 of 26 sites, while both aslike clover ( Trifolium hybridum ) and red clover ( Trifolium pratense ) occurred in 11 and 18 sites, respectively. Clover flowers, with their long corollas, may primarily support certain bees, such as bumble bees and honey bees, while solitary or smaller-bodied bees may be unable or unlikely to utilize these flowers for forage (Harris and Ratnieks, Reference Harris and Ratnieks2022). This is further evidenced by the negative relationship between the percentage of flowers from cover crops and the abundance of pan-trapped bees—a relationship not seen with netted bees. Smaller-bodied pan-trapped bees, such as Lasioglossum, which were primarily collected by pan traps (Supplementary Table 4), may be unable or unlikely to utilize the clover cover crops. In contrast, Wilson et al. (Reference Wilson, Wong, Thorp, Miles, Daane and Altieri2018) found cover cropping increased both the abundance and diversity of bees in vineyards using a cover crop mixture of Phacelia tanacetifolia (purple tansy), Ammi majus (Bishop’s flower), and Daucus carota (wild carrot). Griffiths-Lee et al. (Reference Griffiths-Lee, Davenport, Foster, Nicholls and Goulson2022a) found that floral plantings specifically formulated for bees had stronger impacts on bee abundance and diversity than natural regeneration or other seed mixes. Thus, more research is needed on cover crop species mixes that are both beneficial to vineyard management (ex. pest suppression, weed competition, soil health and nutrients, water use) and wild bees.
In contrast to the negative association between bee abundance and cover crops observed in this study, there was no significant impact of alternate row management on either bee abundance or diversity. This suggests that alternate row management is not detrimental to bees, opposing the initial prediction that it would negatively affect bees by reducing total floral and vegetation resources. While Kratschmer et al. (Reference Kratschmer, Pachinger, Schwantzer, Paredes, Guernion, Burel, Nicolai, Strauss, Bauer, Kriechbaum, Zaller and Winter2018) reported a positive influence of alternate row tillage on bees and on floral resources, in this study, alternate row was defined as the ratio of vegetation height between alternate rows, reflecting management more broadly; any practice that alters vegetation in one row, such as mowing, seeding, or tilling. These results underscore the need to understand how much flower-rich habitat is required to support pollinators in farmlands (Dicks et al., Reference Dicks, Baude, Roberts, Phillips, Green and Carvell2015), as our results suggest that alternate row management could be a cost-effective way to implement practices like mowing or cover cropping, saving both time and costs for growers, without negatively impacting bees. Future research should investigate the impact of alternate row floral plantings or cover cropping and alternate row mowing on bees, as well as on vineyard production.
Opposing our prediction that organic sites would have the highest bee abundance and diversity, there was a limited impact of organic vineyard management on bee abundance or diversity in this study—with only a slightly higher Shannon species diversity index in organic vineyards when compared to sustainable vineyards, and no difference from conventional sites. Additionally, despite organic regulations surrounding herbicide usage, vegetation height was the only vegetation or floral characteristic that differed significantly in organic vineyards, being taller than in sustainable vineyards. The limited effect of organic management on wild bees in this study is consistent with findings from other studies (Brittain et al., Reference Brittain, Bommarco, Vighi, Settele and Potts2010; Kehinde and Samways, Reference Kehinde and Samways2012) and is notable given that organic vineyards avoid synthetic pesticides, many of which are known to be harmful to bees (OMAFRA, 2021; Campani et al., Reference Campani, Manieri, Caliani, Di Noi and Casini2025). These results may be attributed, in part, to the fact that several of the organic sites were in close proximity to conventional vineyards or other crop types. Thus, bees, even those with relatively small foraging ranges, may be exposed to pesticides outside of the studied organic blocks by foraging elsewhere. Ostandie et al. (Reference Ostandie, Giffard, Bonnard, Joubard, Richart-Cervera, Thiéry and Rusch2021) found lower pollinator abundance in organically managed vineyards, associated with increased tillage intensity in organic sites, but found a positive effect from the proportion of organic farming in the surrounding landscape within a 1 km radius. This suggests that landscape-scale adoption of organic farming may be an important consideration for pollinator conservation in farmlands. Ostandie et al. (Reference Ostandie, Giffard, Bonnard, Joubard, Richart-Cervera, Thiéry and Rusch2021) also found that insecticide use intensity, both organic and conventional, negatively impacted pollinator abundance and richness. Similarly, Zielonka et al. (Reference Zielonka, Shutt, Butler and Dicks2024) found that while organic vineyards in the UK tended to apply fewer harmful pesticides, the frequency of their organic agrochemical applications was higher than in non-organic vineyards. This increased frequency of sprays had a stronger negative effect on arthropod diversity than the consideration of frequency and toxicity together. However, Kaczmarek et al. (Reference Kaczmarek, Entling and Hoffmann2024) found no impact of reduced fungicide use on wild bees in vineyards, and they did find a positive influence of organic management on bee abundance. Further research is needed to evaluate how different vineyard spray regimes, including types and frequencies, affect wild bee communities at both field and landscape scales over longer time periods. In this study, organic sites were required to have been managed organically for at least 3 years. The lethal and sub-lethal effects of pesticide exposure may not be immediately evident in metrics such as bee abundance and diversity and likely require longer-term studies to fully capture their population- and community-level impacts (Raine and Rundlöf, Reference Raine and Rundlöf2024). Future research should obtain the length of time under organic management from producers and include this as a factor in models looking at wild bee responses to farm management.
Opposite to our prediction that certified sustainable sites would have higher bee abundance and diversity than conventional sites, we found that Shannon species diversity was lower in certified sustainable vineyards compared to organic vineyards and did not differ significantly from conventional vineyards. However, Lasioglossum ( Dialictus ) bee abundance in mid-summer was oppositely negatively impacted by organic management. Thus, some of the differences in diversity between vineyard management types may be attributed to the fact that Lasioglossum ( Dialictus ) bees were not identified to species level and were more abundant in sustainable vineyards than in organic vineyards. It is difficult to estimate the diversity and evenness of Lasioglossum ( Dialictus ) bees in these sites, as the range in abundance across sites was extremely large, ranging from 2 to 219 individuals per year. Sites with significantly higher Lasioglossum ( Dialictus ) abundances may indicate nearby nest aggregations (Nelson et al., Reference Nelson, Evans, Donovan and Howlett2023) or may be dominated by highly abundant species. A study of the bees in mowed and unmowed meadow sites in the Niagara Region demonstrated that of the nine Lasioglossum ( Dialictus ) species or morphospecies collected, two species (L. hitchensi Gibbs and L. versatum (Robertson)) represented ~75% of all Lasioglossum ( Dialictus ) bees collected (Audet, Romero, and Richards, Reference Audet, Romero and Richards2021).
Overall, the genus-level results of this study may be clearer in their interpretation than the species-level results. While the genus level decrease in bee diversity in sustainable sites was only nearly significant (p < 0.1), these results indicate that vineyard sustainability certifications may require bee-specific requirements to benefit the diversity of bees in the region. When Zielonka et al. (Reference Zielonka, Shutt, Butler and Dicks2024) investigated the arthropods in UK vineyards enrolled in the Sustainable Wines of Great Britain (SWGB) scheme, they found no difference in arthropod abundance or diversity between SWGB-accredited vs. non-SWGB-accredited vineyards. They also calculated an ‘ecotoxicity score’ based on grower-reported chemical inputs and a ‘practice score’ rating the sustainability of reported management practices. Interestingly, the ecotoxicity score was higher, and the sustainability practice score was lower in SWGB-accredited sites. Authors discuss that conventional vineyards can still be low-input and harbor more biodiversity than organic or sustainably certified vineyards. Similarly, in this study, there was also no difference in the use of cover cropping or alternate row management between vineyard management categories. This demonstrates that conventional growers in Niagara were also using these practices.
Another important consideration for this study is that the SWO program only began in 2017 (SWO, 2025), and several sites had just begun their certification at the time of this study. Additionally, several sites that were considered ‘conventional’ for this project were later SWO certified in the following years—suggesting they may have been implementing sustainable practices prior to formal certification. Furthermore, all participating vineyards, even those that were deemed ‘conventional’, may artificially represent sites with higher levels of sustainability due to the growers’ willingness to participate in this study. It is also important to note that approximately half of the organic sites were also SWO-certified. In the analysis, however, the ‘highest’ certification level was utilized to isolate the effects of the certified sustainable designation on bee communities. Future research should investigate the extent to which vineyard management practices change when undertaking sustainability certifications (Moscovici and Reed, Reference Moscovici and Reed2018) as well as the temporal response time between certifications and their impacts on wild bee communities (Griffin et al., Reference Griffin, Bruninga-Socolar, Kerr, Gibbs and Winfree2017).
Floral richness and vegetation height were also lower in certified sustainable vineyards. Anecdotally, one certified sustainable grower described their practice of mowing between rows before spraying pesticides to minimize exposure of bees to these sprays. This site continuously had low between-row vegetation height, floral abundance, and floral richness, as well as bee abundance and diversity. This highlights the importance of future research investigating how to balance protecting bees from pesticide exposure versus providing floral resources in agricultural lands (Raine and Rundlöf, Reference Raine and Rundlöf2024). Furthermore, both the bee communities and the floral communities differed significantly between vineyard management types. Thus, certain bee species or taxonomic groups may be associated with specific floral resources, spray regimes, or other factors that differ with management type, not measured here. It is possible that regional beta and gamma diversity may actually benefit from having vineyards under varying management regimes throughout the landscape (Socolar et al., Reference Socolar, Gilroy, Kunin and Edwards2016).
The consistent and strong temporal variation in vineyard bee abundance and diversity seen in this study is consistent with the literature, as bee communities are known to vary over a growing season and between years (Turley et al., Reference Turley, Biddinger, Joshi and López-Uribe2022). This highlights the importance of sampling bees sufficiently over the growing season when investigating crop management impacts on wild bees, especially for crops that have particularly long growing seasons, such as grapes. Sampling intensity, however, must be balanced with grower schedules as a lack of time is an often-limiting factor in grower participation in research (Delate et al., Reference Delate, Canali, Turnbull, Tan and Colombo2017). Lastly, models of bee abundance and species diversity (richness and Shannon diversity index) explained only 32%–52% of the variability in the bee response variables. Thus, there are still factors outside of those measured in this study that are influencing vineyard bees, which could include climate, specific pesticide uses, soil characteristics, or landscape contexts. However, this range of R2 is consistent with other studies looking at pollinator or arthropod responses to vineyard management (Zielonka et al., Reference Zielonka, Shutt, Butler and Dicks2024; Biella et al., Reference Biella, Ramazzotti, Parolo, Galimberti, Labra and Brambilla2025). There was also a high degree of model uncertainty for each of the models, with 4–8 models having a delta AICc <2. This is likely, in part, due to the correlations between the vegetation and floral variables included in the models. While these variables had low enough VIFs to include in modeling procedures, they likely explained similar variability in the bee response variables. Overall, further research is needed to understand how vineyard management can most effectively support diverse and abundant bee communities, including how sustainable practices such as certification programs, mowing frequency, alternate row management, and cover cropping shape floral and vegetation characteristics and ultimately influence wild bee communities.
Conclusion
The results of this study suggest that reducing mowing frequency should be prioritized to support wild bee communities in vineyards. Allowing between-row vegetation to grow taller, potentially by mowing every second row to manage costs, may support more abundant and diverse bees. The results also reinforce existing evidence that vegetation cover, particularly when it includes floral resources, is beneficial for wild bees. However, while cover cropping is often promoted to increase both vegetation cover and flowers in vineyards, this study indicates that current cover cropping practices do not enhance overall bee abundance or diversity. Bee-specific cover crops may be necessary to better support the diversity of wild bees. Additionally, these findings suggest that more research is needed on organic and sustainable certifications for wild bee conservation, including how these certification programs can be adapted to better support pollinators, how outcomes differ across spatial scales, and longer-term studies to detect impacts at the community level.
Supplementary material
The supplementary material for this article can be found at http://doi.org/10.1017/S1742170526100519.
Data availability statement
Select anonymized data that support the findings of this study are available from the corresponding author, B.D., upon reasonable request.
Acknowledgments
This article is dedicated to the memory of Dr. Sheila Colla, who passed away during the preparation of this work. We sincerely thank the many grape growers and wineries that supported this research and allowed data collection on their properties, including 20 Bees Winery, Dim Wine Co., Featherstone Estate Winery and Vineyard, Frogpond Farm Organic Winery, Laundry Vineyards, Henry of Pelham Family Estate Winery, Hernder Estate Wines, Hidden Bench Estate Winery, Hughes Vineyards, K.J. Watson Vineyards, Malivoire Wine Company, On Seven Estate Winery, Pearl Morissette Winery, Pillitteri Estates Winery, Queenston Mile Vineyard, Reif Estate Winery, Saunders Family Vineyard, Southbrook Vineyards, Stratus Vineyards, Strewn Winery, Sue-Ann Staff Estate Winery, Tawse Winery, Molek Vineyards, and Vieni Estates. We sincerely appreciate everyone who contributed to this project, including Kelly Ramsay with statistical guidance, Anthony Ayers, Katherine Odanaka, and Hadil Elsayed with bee identification verification, Ryanna Baich and Taylor Pataracchia-Low with fieldwork assistance, and Sarah MacKell, Hadil Elsayed, Taylor Kerekes, Victoria MacPhail, Amanada Liczner, Sarah Rotz, Gail Fraser, Leesa Fawcett, and Laurence Packer with project and manuscript feedback.
Author contribution
B.D. and S.C. formulated the research questions and study design. B.D. collected the data, analyzed the data, and wrote the manuscript. S.C. provided funding and resources as well as manuscript edits and feedback.
Funding statement
Research funds were provided by the National Research Council of Canada (NSERC 504165), the Entomological Society of Canada (Student research award), and York University (Student and faculty research awards and funds). No funders held a role in the design, analysis, or writing of this article.
Competing interests
The authors declare no competing interests.
Ethics statement
The authors declare that no ethical review was required for this research.
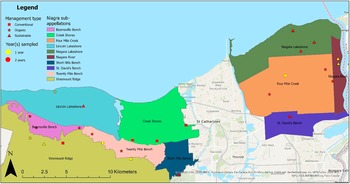
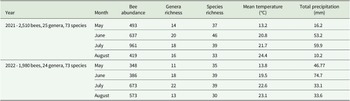
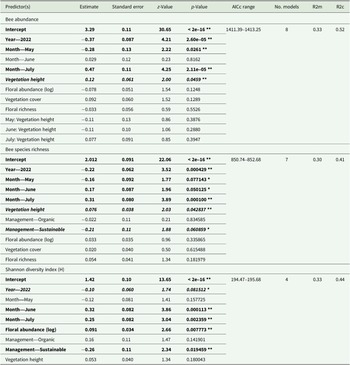
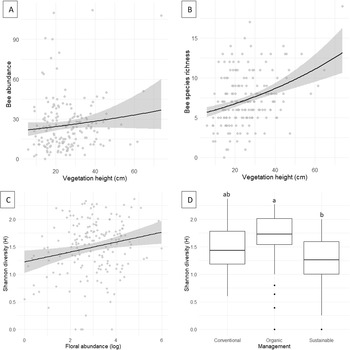
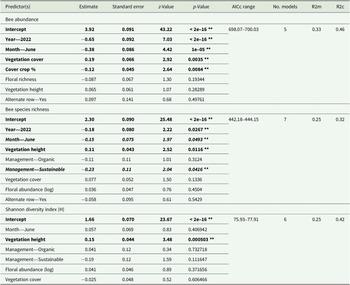
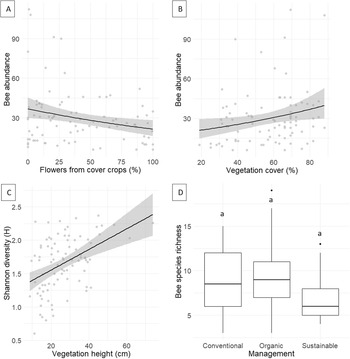
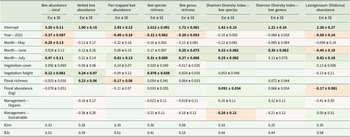
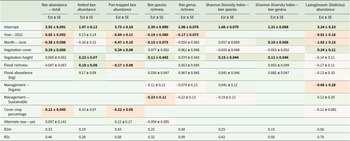
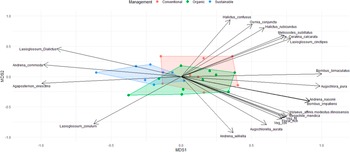
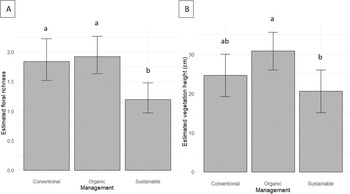
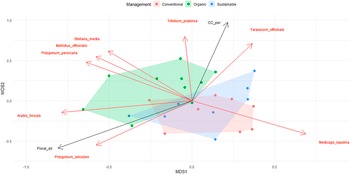


 Open access

