


Albanian (endonym: Shqip; Glotto: alba1268) is an Indo-European language which has been suggested to form an independent branch of the Indo-European family since the middle of the nineteenth century (Bopp Reference Bopp1855, Pedersen Reference Pedersen1897, Çabej Reference Çabej1976). Though the origin of the language has been debated, the prevailing opinion in the literature is that it is a descendant of Illyrian (Hetzer Reference Hetzer1995). Albanian is currently spoken by around 6–7 million people (Rusakov Reference Rusakov and Kapović2017: 552; Curtis Reference Curtis, Klein, Joseph and Fritz2018: 1800), the majority of whom live in Albania and Kosovo, with others in Italy, Greece, North Macedonia and Montenegro. Figure 1 shows a map of the main Albanian-speaking areas of Europe, with major linguistic subdivisions according to Gjinari (Reference Gjinari1988) and Elsie & Gross (Reference Elsie and Gross2009) marked by different colours and shades.
Map of the Albanian-speaking areas of Europe. Subdivisions are based on Gjinari Reference Gjinari1988 and Elsie & Gross Reference Elsie and Gross2009. CC-BY-SA 4.0 Stefano Coretta, Júlio Reis.

At the macro-level, Albanian includes two main varieties: Gheg, spoken in Northern Albania, Kosovo and parts of Montenegro and North Macedonia; and Tosk, spoken in Southern Albania and in parts of Greece and Southern Italy (von Hahn Reference von Hahn1853, Desnickaja Reference Desnickaja1976, Demiraj Reference Demiraj1986, Gjinari Reference Gjinari1985, Beci Reference Beci2002, Shkurtaj Reference Shkurtaj2012, Gjinari et al. Reference Gjinari, Bahri Beci, Gosturani and Dodi2007). At the meso-level, Gheg and Tosk are usually further divided into the following sub-varieties (Gjinari Reference Gjinari1988): Gheg includes Northwestern Gheg, Northeastern Gheg, Central Gheg and Southern Gheg; while Tosk includes Northern Tosk, Southern Tosk, Cham, Arvanitika and Arbe̤resh. The speakers recorded for this illustration were all born and raised in areas where Northern Tosk is spoken, namely the counties of Pe̤rmet and Fier. Thus, we consider the doculect (Cysouw & Good Reference Cysouw and Good2013) discussed here to belong to Northern Tosk.
Northern Tosk differs from other Tosk and Gheg varieties on several phonological and phonetic features. For instance, Gheg has contrastive vowel nasalisation, while Tosk lacks it, e.g. ‘drink.imp:2sg’ and ‘numb.imp:2sg’ are realised as /pi/ vs /p̃/ in Gheg but as /pi/ vs /mpi/ in Tosk (Beci Reference Beci1995). Northern Tosk also lacks vowel length contrasts, whereas pockets of Southern Tosk, Southern Gheg, Central Gheg and Northeastern Gheg contrast long and short vowels and Northwestern Gheg contrasts short, long and extra-long vowels (e.g. Beci Reference Beci1995, Çabej Reference Çabej1975, Shkurtaj Reference Shkurtaj and Domi1975, Gjinari et al. Reference Gjinari, Bahri Beci, Gosturani and Dodi2007).
The five consultant speakers (two females and three males) were aged between 25 and 33 years old. They were digitally recorded (44,100 Hz, 16 bits) in an anechoic chamber at the Institute of Phonetics and Speech Processing at the Ludwig-Maximilians-Universität München (Germany) using a Neumann TLM 103 microphone connected to a Steinberg UR824 console, while reading a word list, a list of sentences and ‘The North Wind and the Sun’ story. Two of the speakers were visiting family when recorded and still lived in Albania whereas the remaining three lived in Munich but reported speaking Northern Tosk with a member of their household on a daily basis. The participants were first screened by one of the authors (EK), who is a native speaker of Northern Tosk, to ensure they were representative speakers of the variety. Immediately prior to the recordings, each speaker also engaged in a 10-minute conversation with this author to reduce possible effects from German or English (Antoniou et al. Reference Antoniou, Best, Tyler and Kroos2010).Footnote 1 For a full report of the methods employed in this study, the reader is referred to the online supplementary materials.
Following recommendations for Open Science in Crüwell et al. (Reference Crüwell, Johnny van Doorn, Makel, Hannah Moshontz, Orben, Parsons and Schulte-Mecklenbeck2019) and Berez-Kroeker et al. (Reference Berez-Kroeker, Lauren Gawne, Kelly, Heston, Holton, Pulsifer, Beaver, Chelliah and Dubinsky2018), data and code used to produce the analyses discussed in this paper are available on the Open Science Framework at https://osf.io/vry3h/ (Coretta et al. Reference Coretta, Riverin-Coutlée, Kapia and Nichols2021).
Consonants
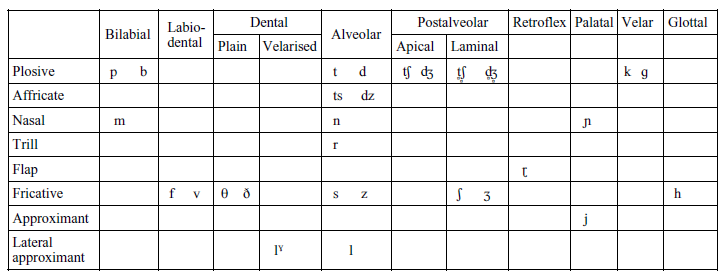
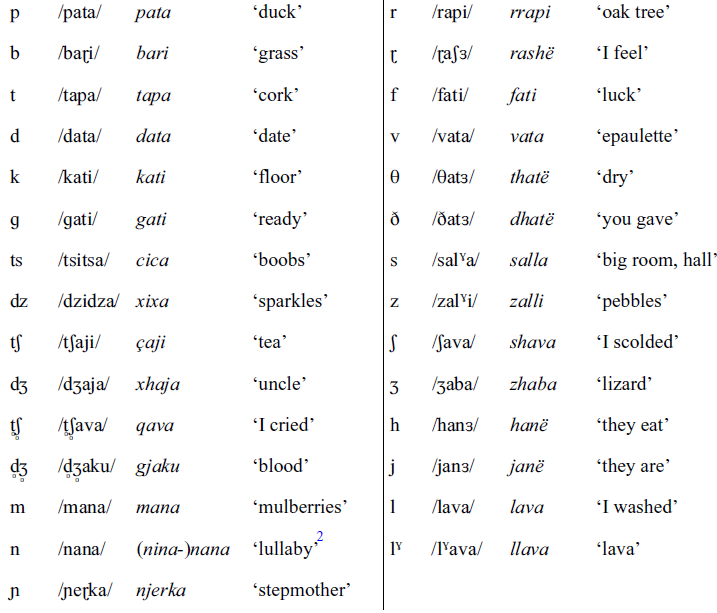
The 29 phonemic consonants of Northern Tosk described here are shown in the table of consonants. For each consonant, our description is based on the consonant that occurs as the first segment of near-minimal pairs consisting of trochaic words. The illustrative words are taken from Beci (Reference Beci2004), with these exceptions: bari, xhaja, mana, nana, njerka, fati, vata, lava and llava. Northern Tosk contrasts eight manners of articulation (as defined in International Phonetic Association 1999: 8): plosive, affricate, nasal, trill, flap, fricative, approximant and lateral approximant. In total, there are nine contrastive places of articulation: labial, labiodental, dental, alveolar, postalveolar, retroflex, palatal, velar and glottal. The postalveolar place of articulation further contrasts apical and laminal articulators in the affricates. Plosives, affricates and fricatives (with the exception of /h/) contrast voiceless and voiced phonemes.
Plosives
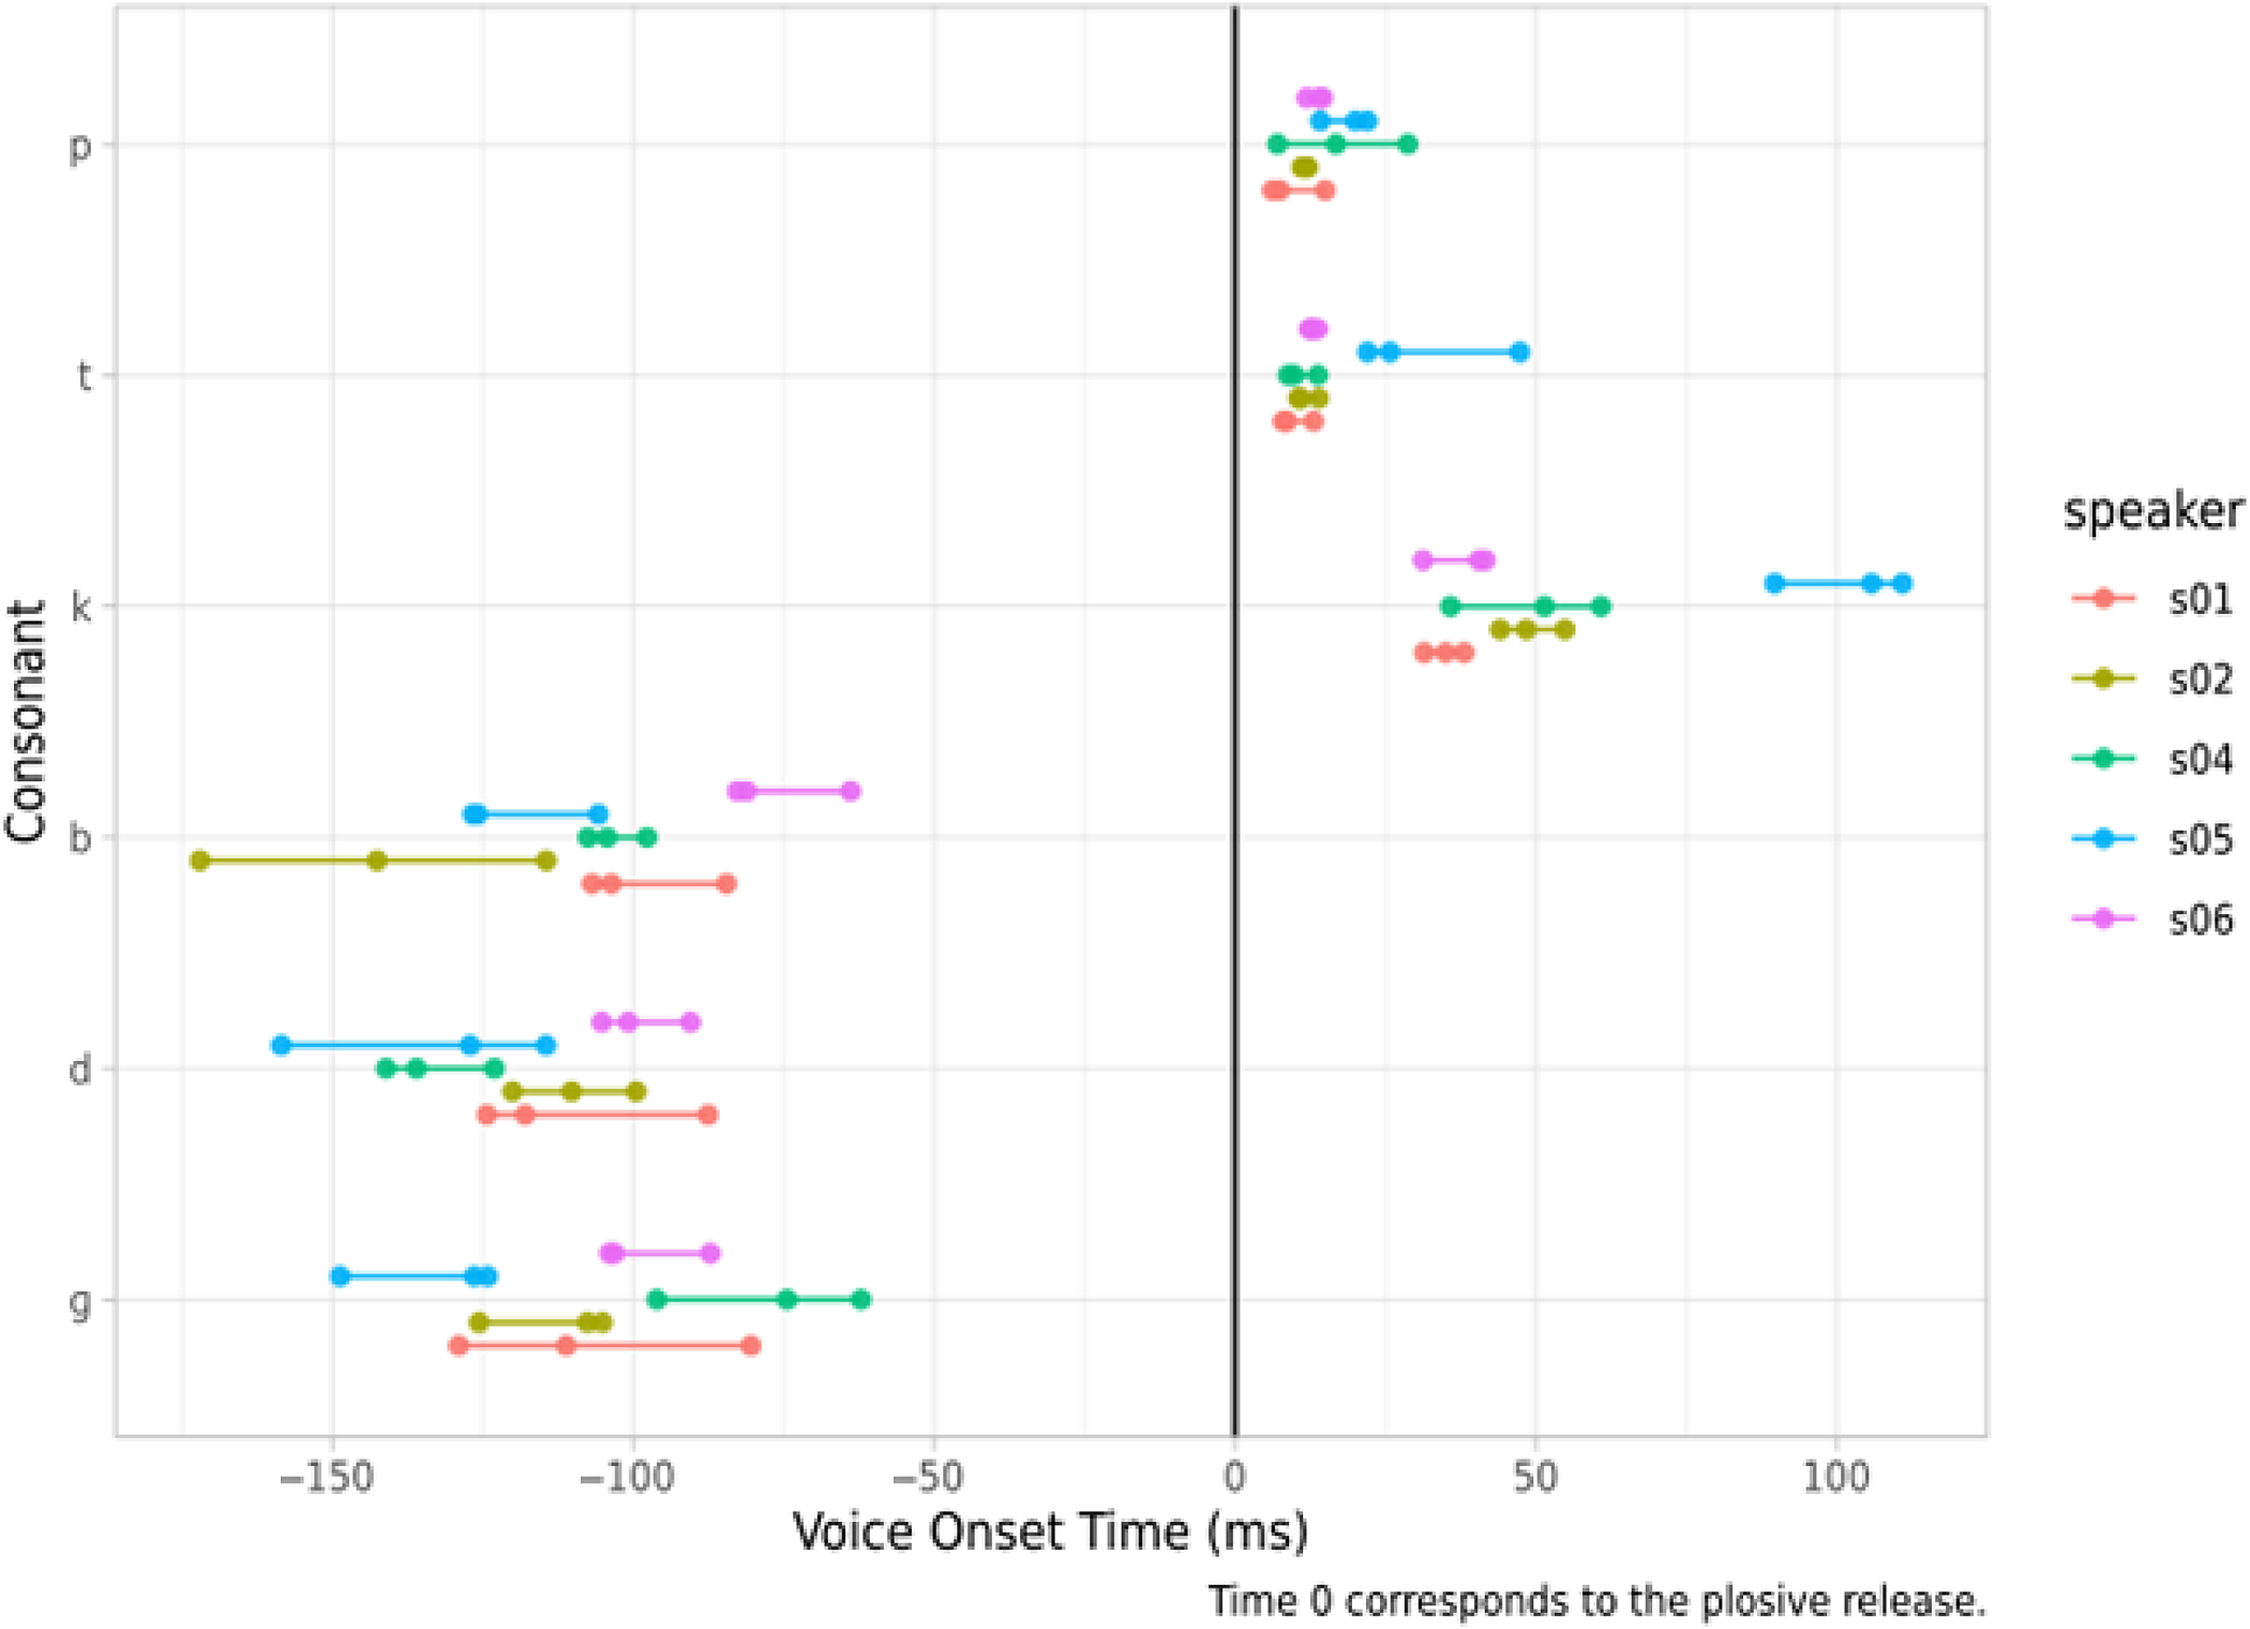
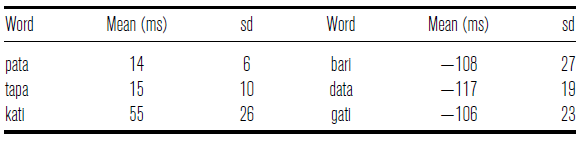
Northern Tosk possesses six plosives: bilabial /p b/, (apico-)alveolar /t d/ and velar /k ɡ/. Figure 2 shows an example of the segmentation of stop release and voice onset in pata and kati. Figure 3 shows raw voice-onset time (VOT) values obtained for the initial plosive of the words pata, bari, tapa, data, kati and gati as produced by the five speakers. Each speaker repeated each word three times, so that there are three points per speaker/consonant in the figure. The voiceless plosives /p t k/ have a positive VOT, with /k/ being more post-aspirated (and more so for speaker S05 than other speakers). The mean VOT of /p/ is 14 ms (SD = 6), /t/ 15 ms (10), /k/ 55 ms (26), as shown in Table 1. The voiced plosives /b d ɡ/ have robust vocal fold vibration during their closure (i.e. pre-voicing or negative VOT). Their VOT values tend to show more intra- and inter-speaker variability than those of the voiceless plosives. The mean VOT values are similar across these consonants and they show greater standard deviations than the voiceless plosives: /b/ −108 ms (SD = 26), /d/ −117 ms (19), /ɡ/ −106 ms (26).
Segmentation of release and voice onset in /pata/ ‘duck’ and /kati/ ‘floor’, uttered by speaker S04. Tiers from top to bottom: word, segments, C1 release, voice onset. (The left boundary of word-initial voiceless stops has been placed at the time of release since the location of closure onset cannot be seen from the spectrogram.)

Voice-onset time (VOT) of voiceless and voiced plosives as measured in the first consonant of pata, bari, tapa, data, kati and gati. VOT = 0 corresponds to the time of consonant release. Each speaker repeated each word three times (each repetition is represented by a dot in the figure).
Fricatives
Northern Tosk has nine fricatives at the labiodental, dental, alveolar, postalveolar and glottal places of articulation. In all places but glottal, a voiceless fricative contrasts with its voiced counterpart. The fricatives /f v/ are labiodental, /Θ Ð/ (inter-)dental, /s z/ (apico-)alveolar, /ʃ ʒ/ (lamino-)postalveolar and /h/ (voiceless) glottal.
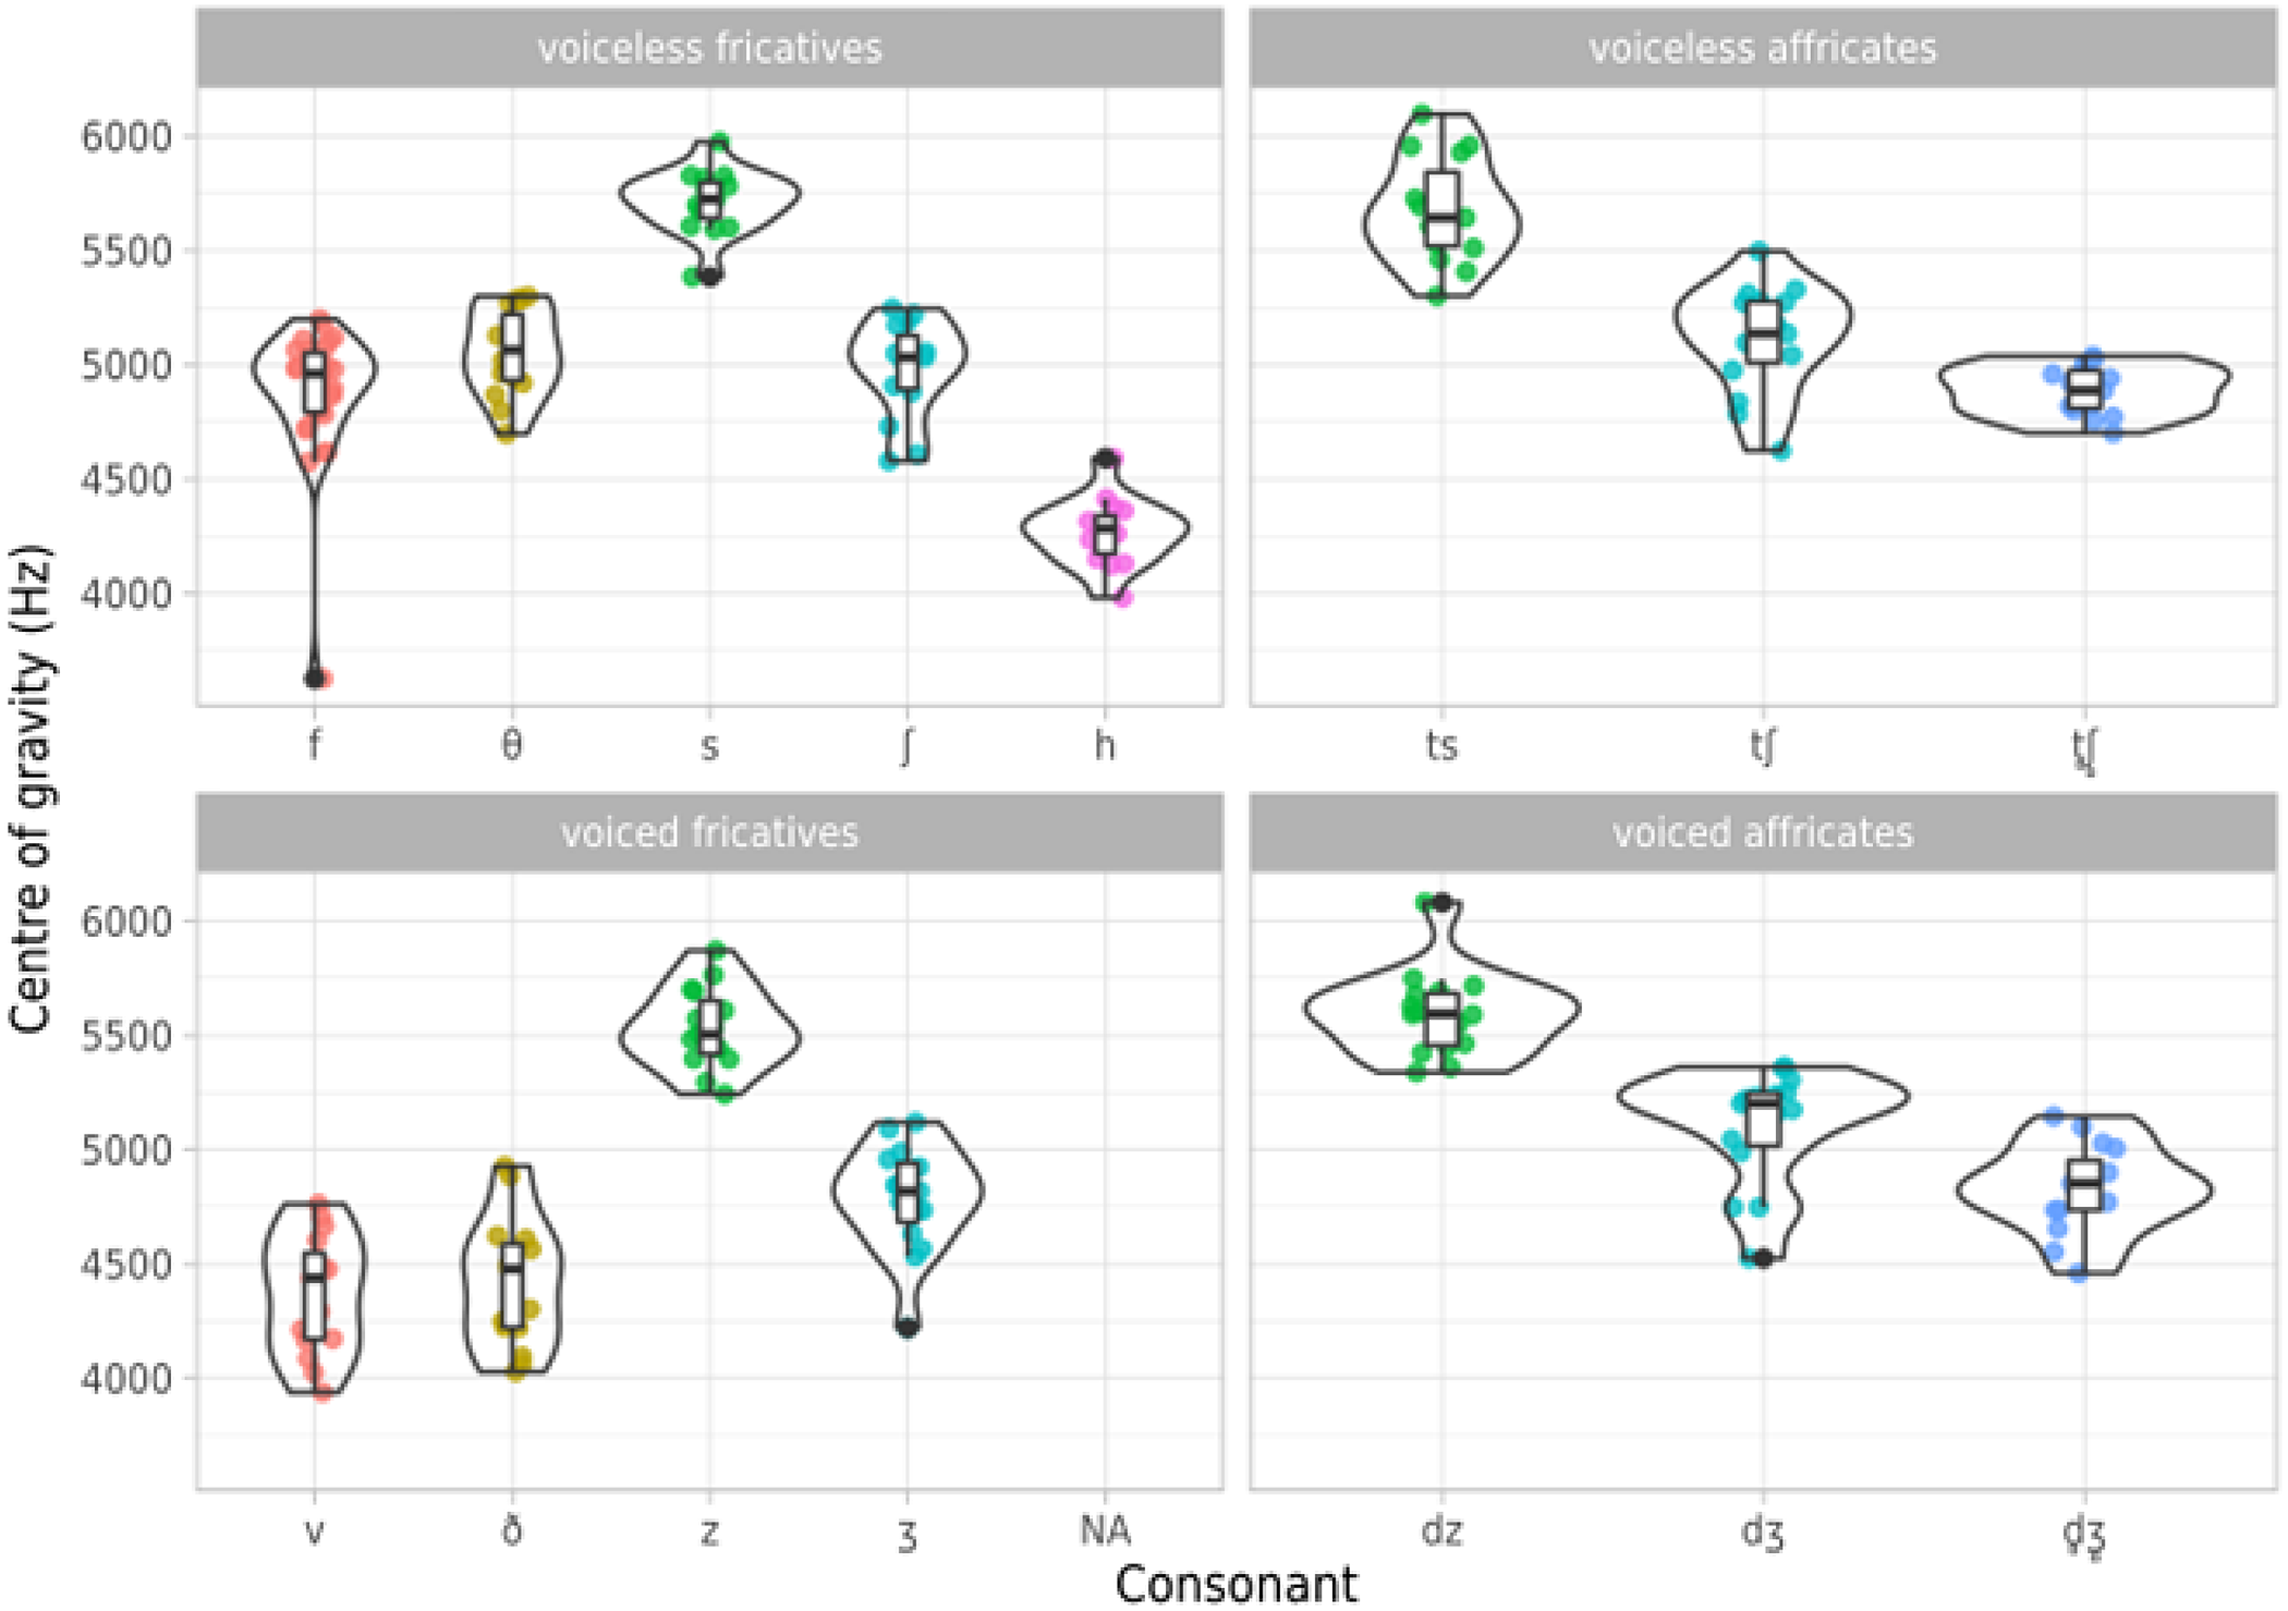
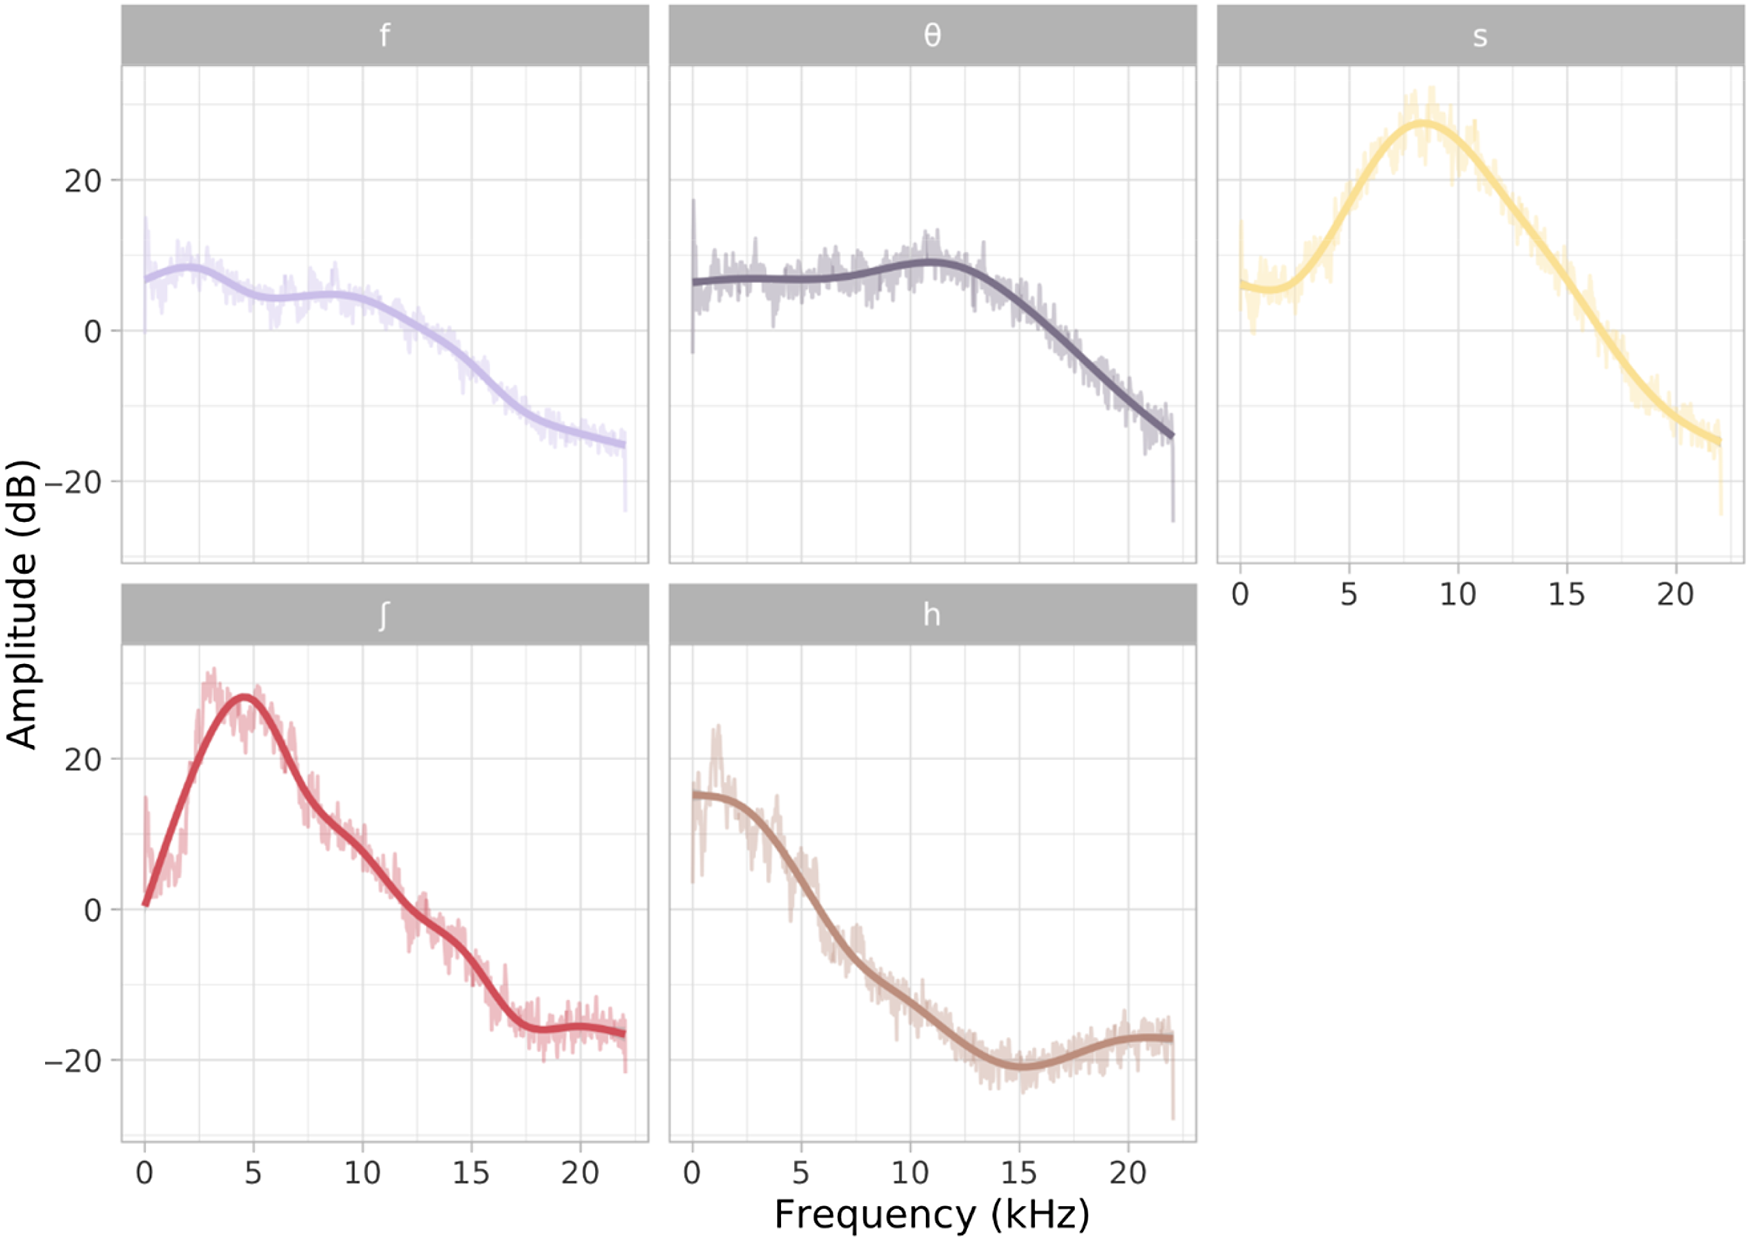
The left-hand panels of Figure 4 show the spectral centre of gravity (CoG) of voiceless (top) and voiced fricatives (bottom). As is seen cross-linguistically, /s z/ are well separated from /ʃ ʒ/ in having a markedly higher CoG than the latter (see for example Maniwa, Jongman & Wade Reference Maniwa, Jongman and Wade2009 and references therein). Notably, the labiodental and dental fricatives are not distinguished by CoG. This is not surprising in light of the common sound change from dental to labiodental fricatives, as seen in varieties of English like Northern British English (Baranowski & Turton Reference Baranowski, Turton and Hickey2015). The power spectrum slices in Figure 5 show the contrast between /f Θ/ and /ʃ/: although these fricatives have similar CoG, the fricatives /f Θ/ have a more diffuse spectrum than /ʃ/.
Spectral centre of gravity of fricatives and affricates. The violins show the probability density function of the CoG, while the superimposed box-plots indicate the median (solid horizontal line), the inter-quartile range (IQR; box) and the value corresponding to ±1.5 IQR from the first and third quartile (whiskers). The individual observations are represented by points, jittered horizontally to reduce overlap.
Mean power spectrum slices of the voiceless fricatives. The mean raw spectrum slices (lines with lighter hue) were calculated for each fricative based on all the repetitions of the words illustrating fricatives, from all the speakers. GAM smoothed spectra (thicker lines with darker hues) are superimposed to the mean raw spectra.
Mean VOT and standard deviation of word-initial plosives (15 tokens per word).
In the isolated words from the word list, the voicing contrast is consistent and robust for all speakers: the voiceless fricatives show no passive voicing from neighbouring segments and the voiced fricatives are usually produced with vocal fold vibration throughout the entire consonant. However, the glottal fricative /h/ is at times realised as voiced [ɦ] in connected speech, as can been seen in the phonetic transcription of ‘The North Wind and the Sun’ (e.g. /Ðe meɲɜheɽɜ uÐɜtaɽi/ [Ðɛ miɲɜˈɦɛɹoΘˈtaɽ̞i] ‘and immediately the traveller’).
Affricates
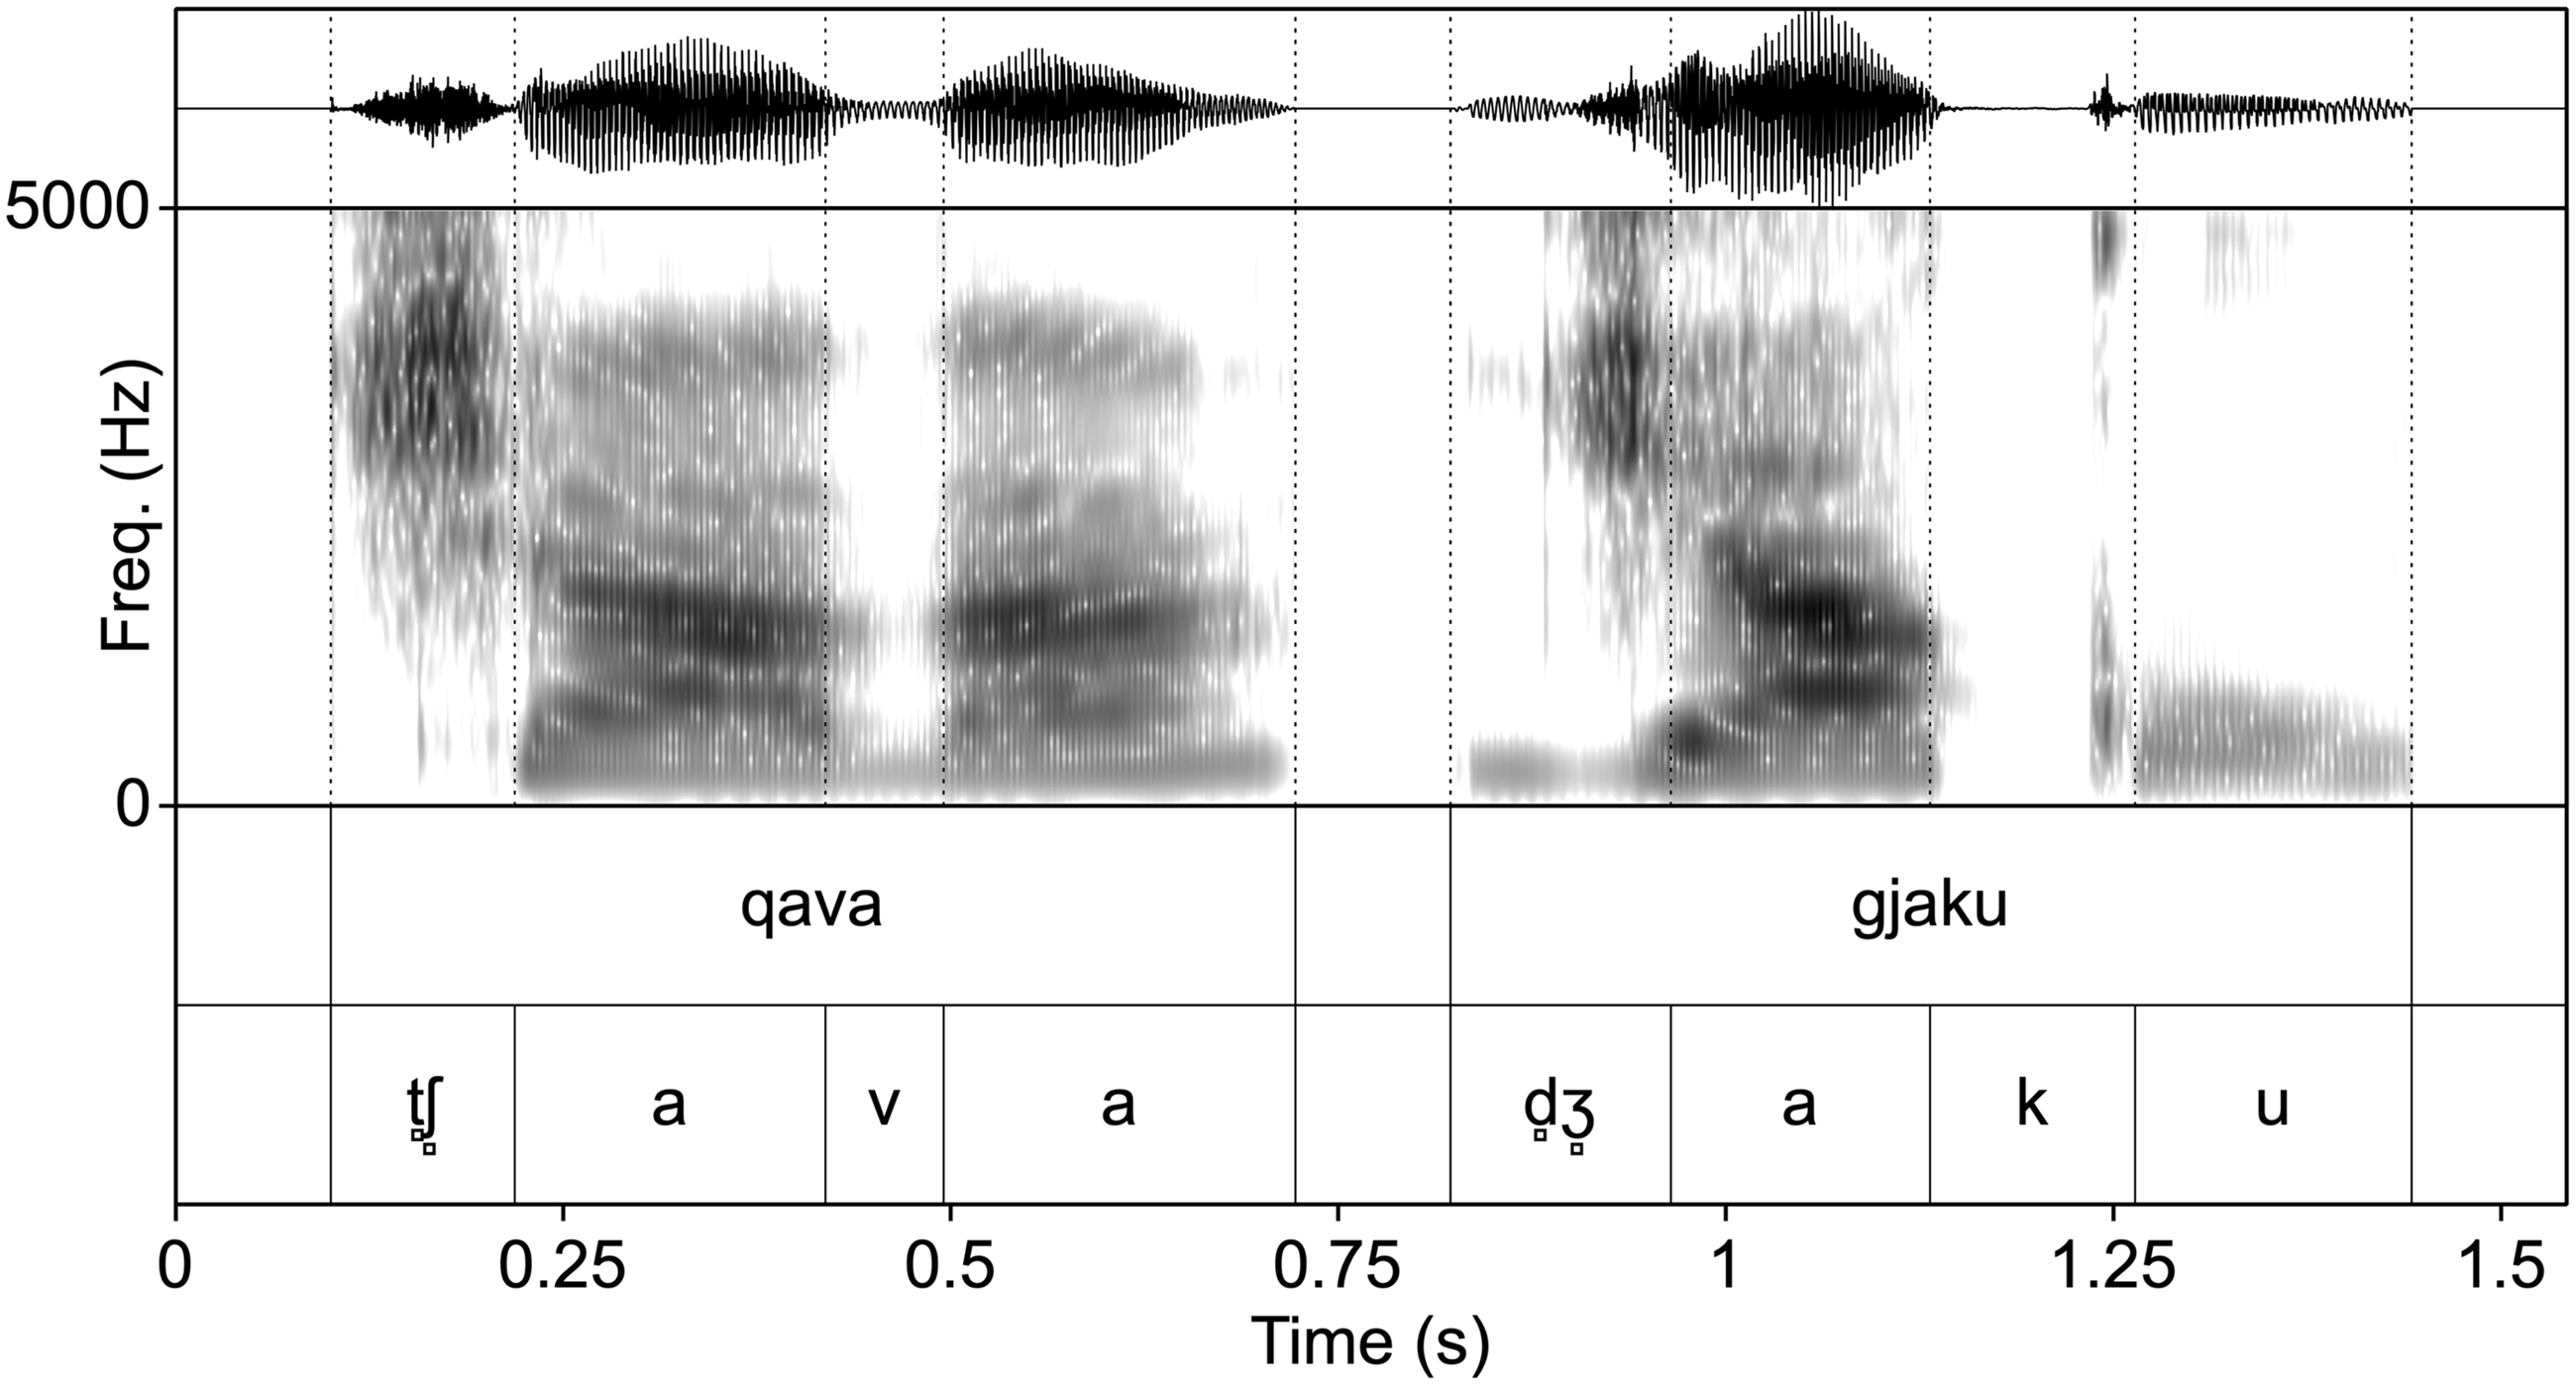
The consonants represented by ⟨q⟩ and ⟨gj⟩ in writing are traditionally described as plosives (Newmark Reference Newmark1957; Bevington Reference Bevington1971; Newmark, Hubbard & Prifti Reference Newmark, Hubbard and Prifti1982; Dodi Reference Dodi1996; Memushaj Reference Memushaj2005, Reference Memushaj2011; Jubani-Bengu Reference Jubani-Bengu2011, Reference Jubani-Bengu2012), though Lowman (Reference Lowman1932) classifies them as affricates and Belluscio (Reference Belluscio, Gesuato and Grazia Busà2014) reports that they are realised with strong frication. In our data, in fact, they are never realised as plosives and are instead clearly affricated for all speakers. The waveforms and spectrograms of qava ‘I cried’ and gjaku ‘blood’ as produced by speaker S04 are provided in Figure 6. From these it can be seen that the plosive closure in word-initial position is followed by a period of frication of substantial duration.
Waveforms and spectrograms of qava ‘cried’ and gjaku ‘blood’ as produced by speaker S04.
Another contested aspect of these consonants concerns their place of articulation, which is generally reported to be palatal or pre-palatal/alveolo-palatal (Lowman Reference Lowman1932; Bevington Reference Bevington1971; Dodi Reference Dodi1996; Kolgjini Reference Kolgjini2004; Memushaj Reference Memushaj2005, Reference Memushaj2011; Jubani-Bengu Reference Jubani-Bengu2011, Reference Jubani-Bengu2012; Belluscio Reference Belluscio, Gesuato and Grazia Busà2014). On the other hand, Newmark (Reference Newmark1957) and Newmark et al. (Reference Newmark, Hubbard and Prifti1982) group ⟨q⟩ and ⟨gj⟩ together with the postalveolar fricatives and affricates /ʃ ʒ tʃ dʒ/ under the label ‘laminal’ and observe that the tongue tip is raised during the production of the former. To ascertain the place of articulation of ⟨q⟩ and ⟨gj⟩, we carried out a palatographic investigation of various consonants, displayed in Figure 7. Palatograms were produced for the lingual plosive and affricate consonants by applying a mixture of vegetable oil and charcoal powder to the tongue of one of the authors (EK) who then uttered one of the consonants flanked by /a/ (e.g. /ata/). A picture of the impression of the tongue on the hard palate was taken with the help of a mirror (Ladefoged Reference Ladefoged2003). The black markings on the palate indicate the place of contact with the tongue surface.
Palatograms of lingual plosives and affricates. The areas in black indicate the area of contact between the tongue and the palate.
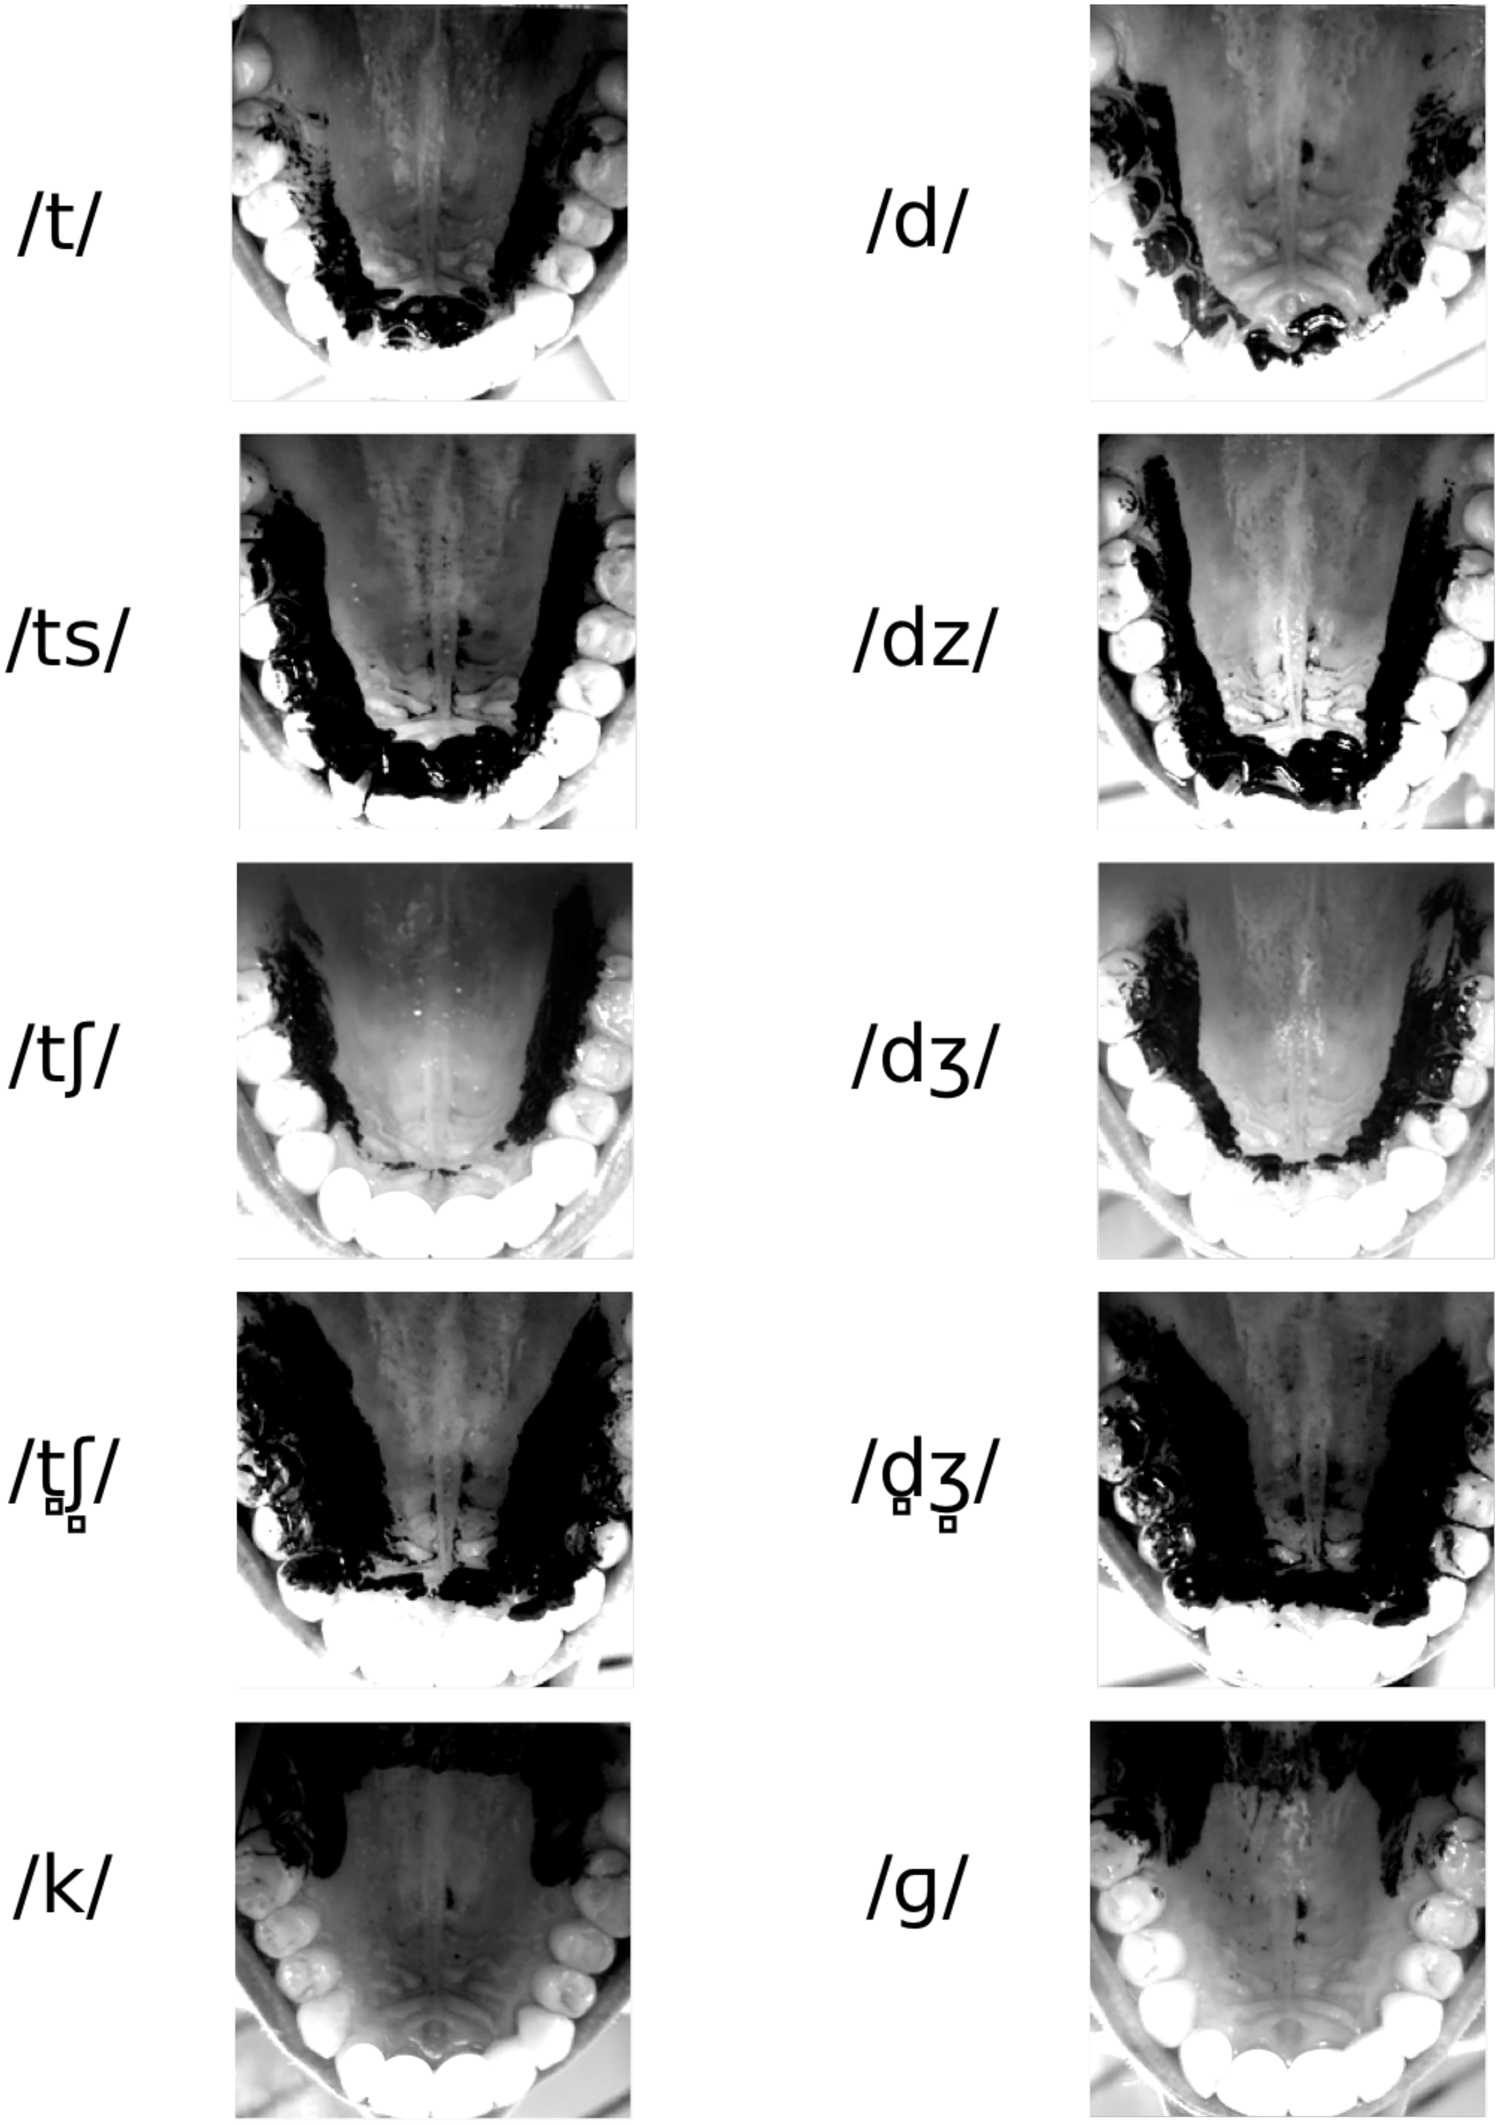
The affricates ⟨q⟩ and ⟨gj⟩ (second row from the bottom) are produced with greater tongue contact than the postalveolar affricates /tʃ dʒ/ (third row), though the location of the anterior contact is approximately the same. We interpret this as an indication that ⟨q⟩ and ⟨gj⟩ are articulated with a lamino-postalveolar closure (see Ladefoged & Maddieson Reference Ladefoged and Maddieson1996: 29) while /tʃ dʒ/ have an apico-postalveolar closure. This is reflected in our choice to use the plain postalveolar symbols /tʃ dʒ/ for the apico-postalveolar affricates and the same symbols with the addition of the laminal diacritic /t̻ʃ̻ d̻ʒ̻/ for the lamino-postalveolar affricates ⟨q⟩ and ⟨gj⟩.
The right panels of Figure 4 above show the spectral centre of gravity (CoG) of the fricative portion of the voiceless (top) and voiced affricates (bottom). The affricates /ts dz/ have the highest CoG, consistent with /s z/. Figure 7 further shows that the tongue-contact area of the alveolar affricates and that of the alveolar plosives /t d/ is virtually identical. The apico-postalveolar affricates /tʃ dʒ/ have CoG values that match those of /ʃ ʒ/. Finally, the lamino-postalveolar /t̻ʃ̻ d̻ʒ̻/ have lower CoGs than the other affricates, consistent with the spectral properties of lamino-postalveolar consonants discussed in Ladefoged & Maddieson (Reference Ladefoged and Maddieson1996: 30). As for voicing, the voiceless affricates are produced with no vocal fold vibration, while voiced affricates are produced with fold vibration during both closure and post-release frication. Thus, in total, we identified three voiceless–voiced pairs of affricates: alveolar /ts dz/, apico-postalveolar /tʃ dʒ/ and lamino-postalveolar /t̻ʃ̻ d̻ʒ̻/.
Rhotics
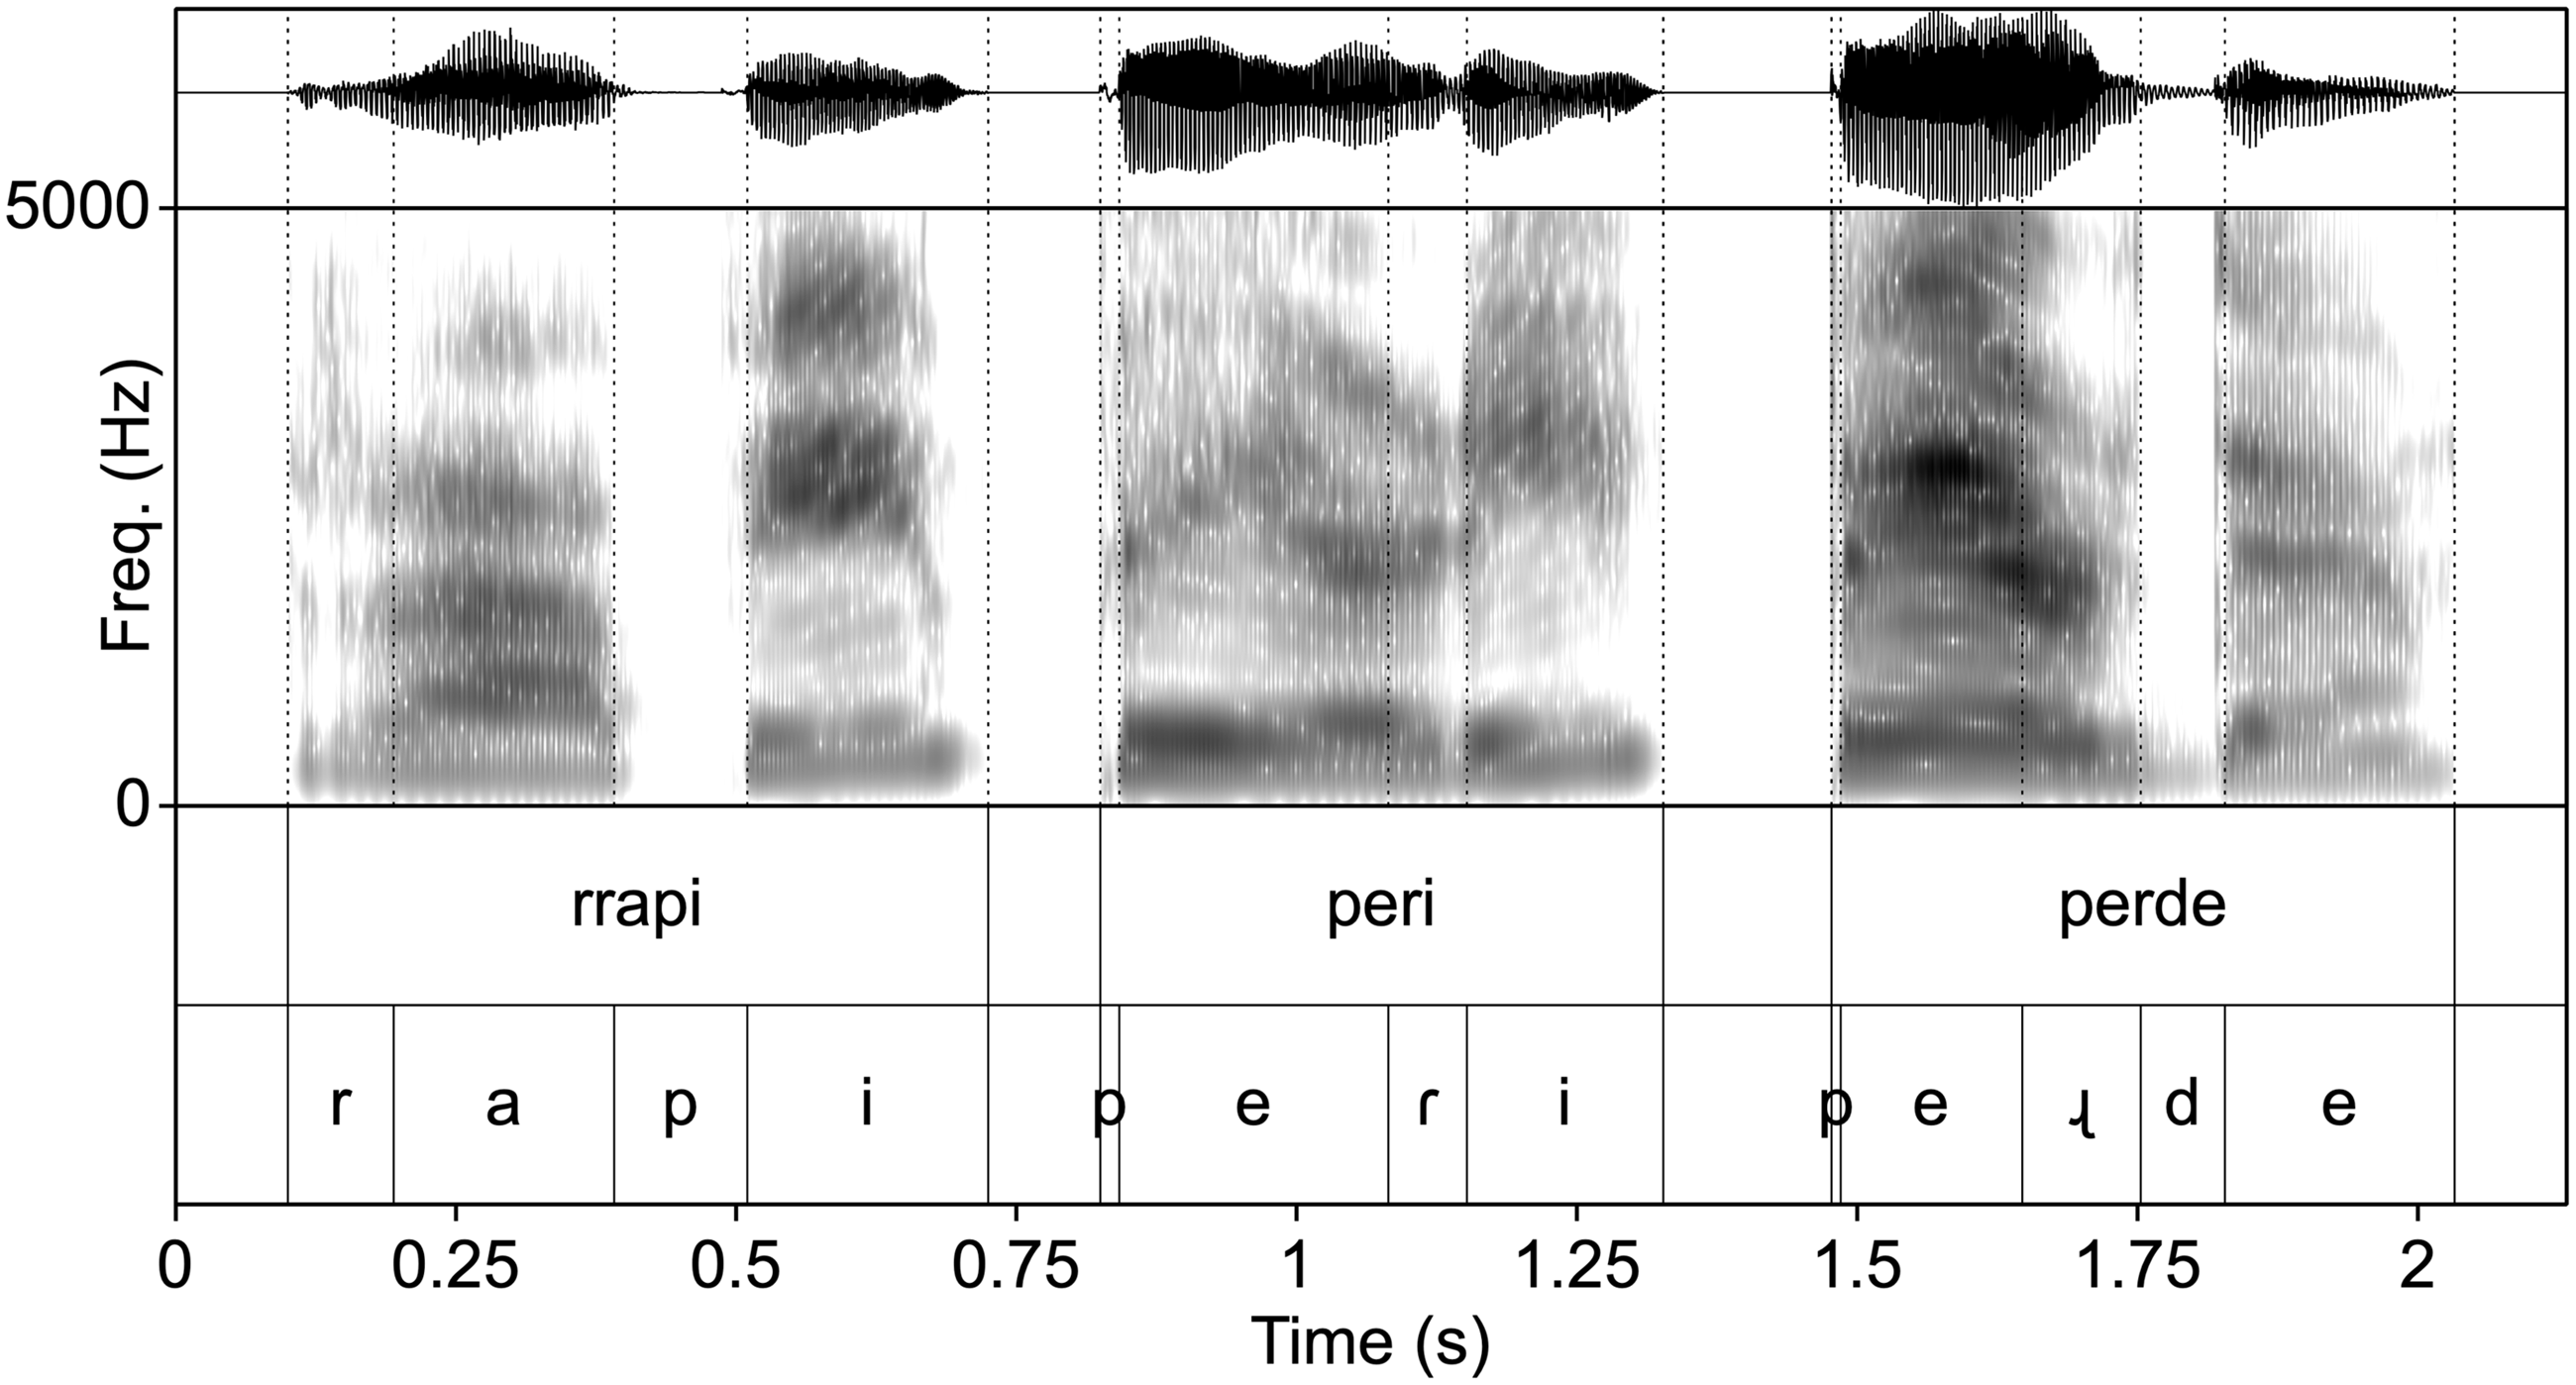
Northern Tosk contrasts two rhotics, written as ⟨r⟩ and ⟨rr⟩, both of which can occur word initially, medially and finally. While our speakers always realised ⟨rr⟩ as an alveolar trill [r], ⟨r⟩ was characterised by a great deal of allophonic variation, as also previously noted by Belluscio (Reference Belluscio, Gesuato and Grazia Busà2014). Among the range of realisations for ⟨r⟩, we found retroflex flaps [ɽ] and retroflex approximants [ɻ]. These seem to be in complementary distribution, with [ɻ] tending to appear in coda position, although for some speakers and in some words, word-initial /r/ was also realised as a retroflex approximant [ɻ]. Impressionistic studies and some case-study analyses suggest that /r/ may increasingly be realised as [ɻ] or variants thereof in different varieties of Albanian (Hysenaj Reference Hysenaj2009, Jubani-Bengu Reference Jubani-Bengu2012, Belluscio Reference Belluscio2016). Figure 8 shows illustrative examples of the three main rhotic allophones. The limited set of contexts in the words collected does not allow us to make definitive generalisations about the distribution of these allophones and future work is warranted on this matter. We have chosen to use /r/ for ⟨rr⟩ and /ɽ/ for ⟨r⟩, though as noted above, /ɽ/ is frequently realised as [ɻ].
Waveforms and spectrograms of rrapi ‘oak tree’, peri ‘thread’ and perde ‘curtains’ as produced by speaker S04.
Laterals
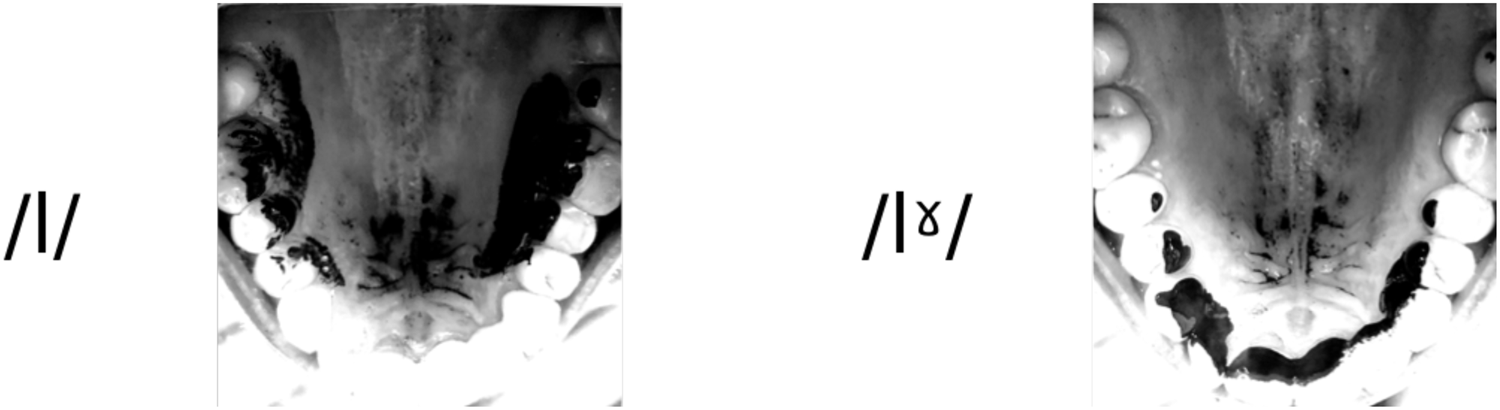
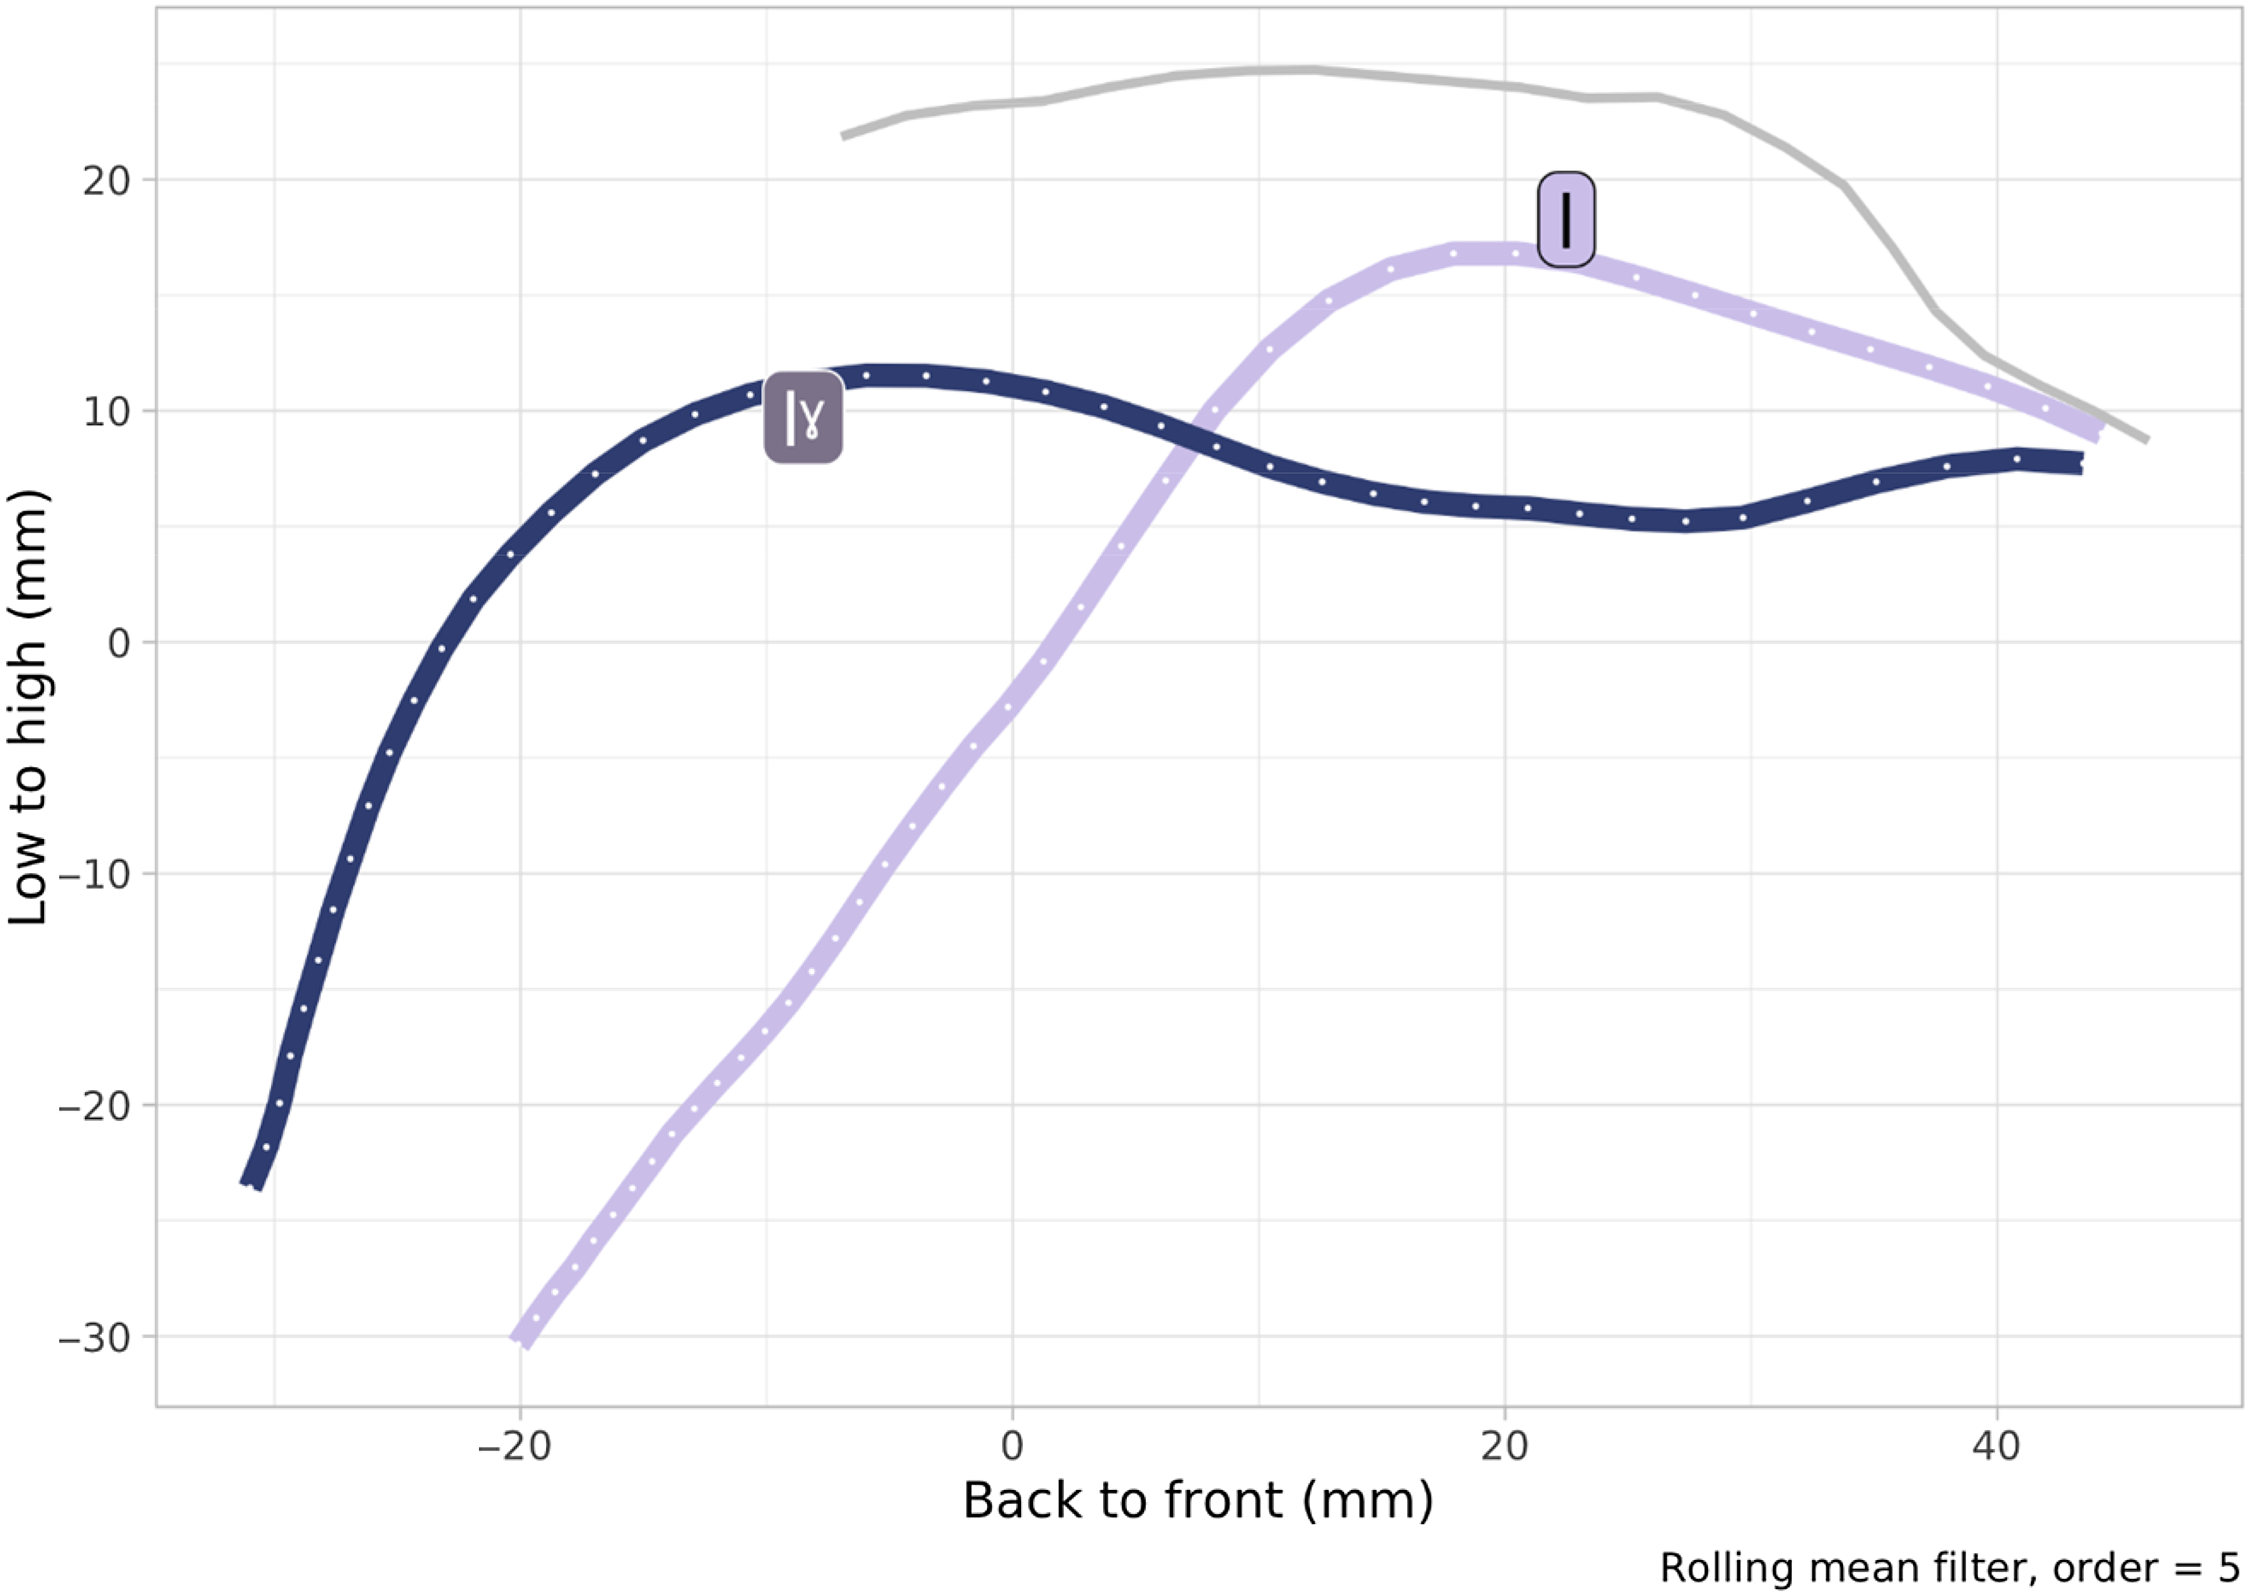
Northern Tosk contrasts two lateral consonants, namely a plain alveolar lateral approximant /l/ and a velarised dental lateral approximant /lˠ/. As evidenced by the palatograms in Figure 9, the tongue-tip closure is produced just behind the alveolar process for /l/ while it is clearly dental for /lˠ/. Figure 10 shows the smoothed midsagittal tongue contours of /l/ and /lˠ/ as gathered from ultrasound tongue imaging, extracted from a single utterance of the nonce words ala and alla respectively. In this figure, the tongue tip is on the right-hand side. The dashed line indicates the surface of the hard palate. The posterior part of the tongue dorsum is raised in /lˠ/, making it velarised. Moreover, the plain lateral /l/ shows some degree of body raising, as can be seen in Figure 10. We take these results from palatography and ultrasound imaging to indicate that /lˠ/ is a velarised (lamino-)dental lateral approximant (Dodi Reference Dodi2004, Belluscio Reference Belluscio, Gesuato and Grazia Busà2014), while /l/ is an (apico-)alveolar lateral approximant with some degree of palatalisation.
Palatograms of the lateral approximants /l/ and /lˠ/. Note the fronter (dental) closure in /lˠ/.
Smoothed midsagittal tongue contours of /l/ and /lˠ/ from ultrasound tongue imaging of one utterance of /ala/ and /alˠa/. The dashed line marks the surface of the hard palate. The tongue body is somewhat raised in /l/, while the dorsum is in /lˠ/.
The velarised lateral /lˠ/ is sometimes vocalised in running speech, as can be observed in the phonetic transcription of ‘The North Wind and the Sun’ (/e hɔt̻ʃ̻i palˠtɔn/ [ɜ ˌhɔt̻ʃ̻i ˈpälutɔn] ‘took off his cloak’).
Nasals and approximant
Finally, Northern Tosk has three nasal consonants at the bilabial /m/, alveolar /n/ and palatal /ɲ/ places of articulation and one palatal approximant /j/. We did not identify any peculiarities in these consonants that would set them apart from their canonical realisation as seen cross-linguistically.
Vowels
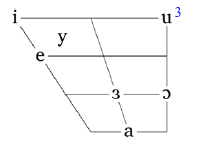
The position of the vowels in the chart approximately reflects their position in the F1/F2 space (see Figure 11).
F1 and F2 space in normalised Hertz of the Albanian vowels, with 95 $\%$
confidence ellipses and vowel labels at the centroids. See supplementary materials for a description of the normalisation procedure.
$\%$
confidence ellipses and vowel labels at the centroids. See supplementary materials for a description of the normalisation procedure.
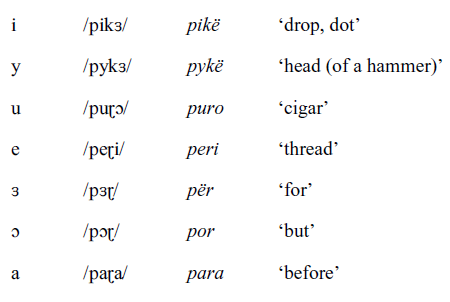
Northern Tosk has seven vowels: /i y u e ɜ ɔ a/. The above vowel diagram shows a trapezoid with the vocalic symbols placed approximately according to their mean position in the F1/F2 normalised-Hertz space displayed in Figure 11. Hertz values were normalised across speakers to reduce the effects of anatomical and gender differences on formants (see online supplementary material for a full explanation of the normalisation procedure).
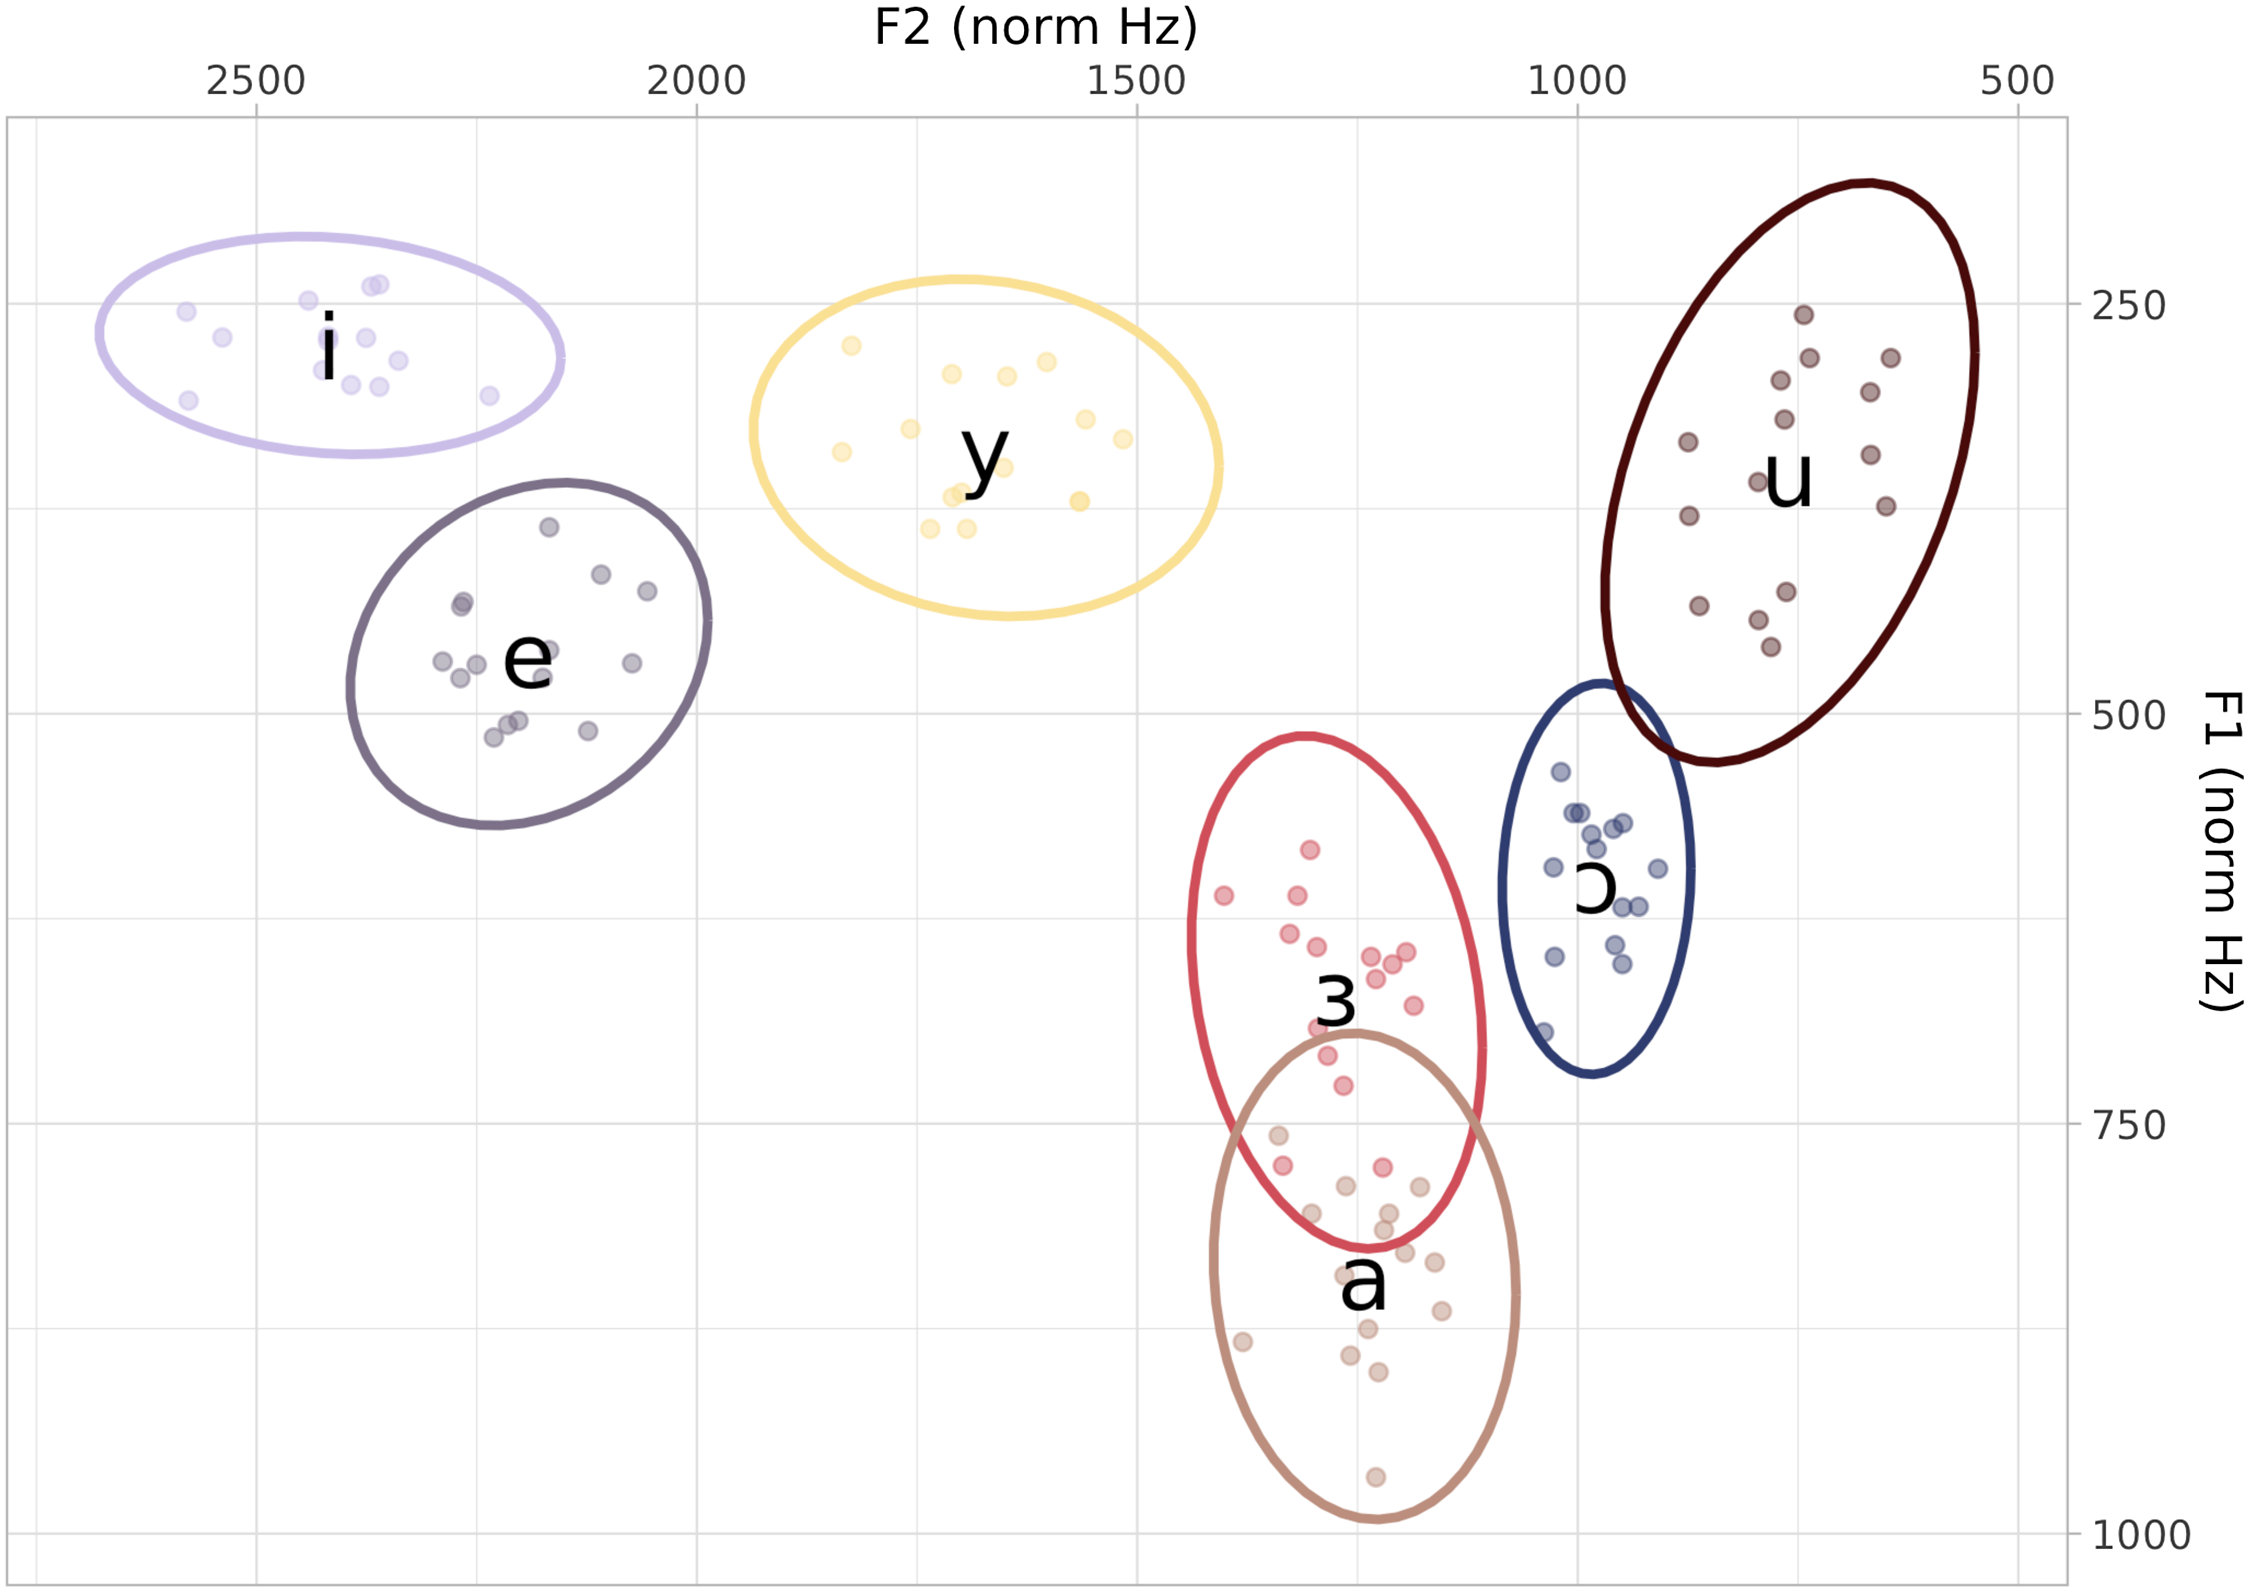
The labiograms of the seven vowels uttered in isolation are shown in Figure 12. Furthermore, Figure 13 shows midsagittal tongue contours from ultrasound imaging extracted from around the mid-point of the sustained tokens of each vowel (the front of the oral cavity is on the right side). In this figure, the tongue contours have been smoothed using a generalised additive model (Hastie & Tibshirani Reference Hastie and Tibshirani1986, Wood Reference Wood2006) with polar coordinates (Coretta Reference Coretta2019).
Labiograms of a sustained token of each vowel produced in isolation. A picture of the lips was taken first from the front then from the side.
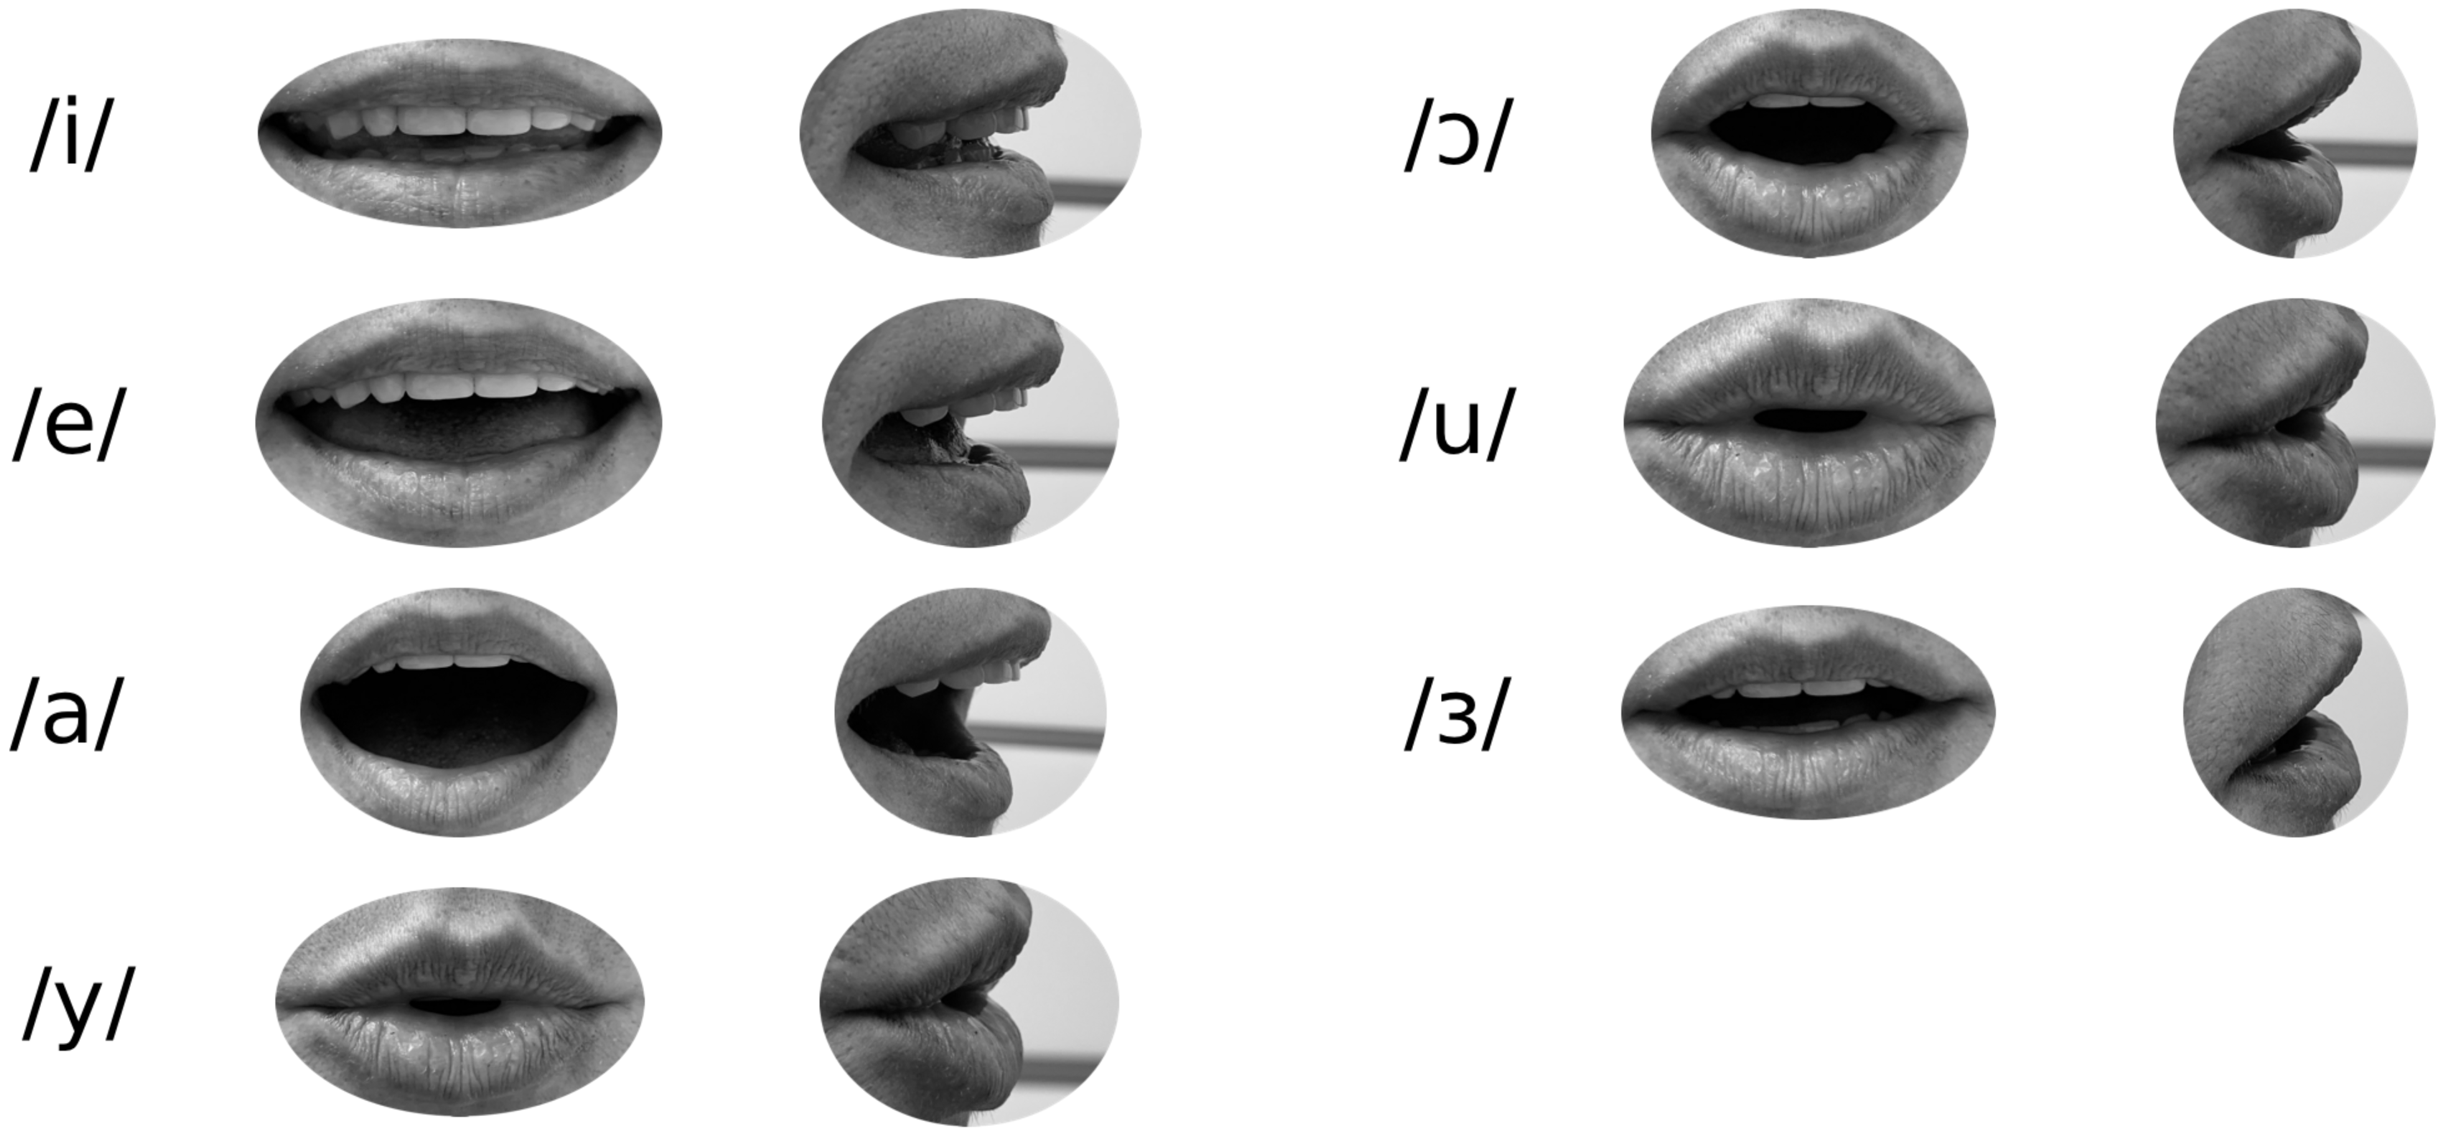
Smoothed midsagittal tongue contours from ultrasound tongue imaging, taken from the mid-point of sustained utterances of each vowel. The tongue tip is on the right and the tongue back on the left, the solid grey line indicates the surface of the hard palate.
Note that the description below is restricted to data from lexically-stressed vowels. The characteristics of unstressed vowels may differ (see Belluscio Reference Belluscio, Gesuato and Grazia Busà2014), although we did not investigate this thoroughly and leave it to future work.Footnote 4
Close vowels
Among the close vowels, /i/ is articulated as an unrounded, close and front [i]. It is tense; this is reflected in the peripheral position of /i/ in the acoustic F1/F2 space in Figure 11 above and the position of the tongue, which is markedly high and front, as evidenced in Figure 13. The vowel /y/ is a mid-centralised (i.e. lax) close front rounded vowel [ʏ]. The mid-centralised articulation of this vowel is clearly visible in Figure 13, which shows that the highest point of the midsagittal contour of the tongue in /y/ is lower than that of /i/ and /e/. In Figure 11, /y/ also occupies a central position, although this could in part be attributable to both F3 and F2 having lower frequency in rounded vowels (Schwartz et al. Reference Schwartz, Beautemps, Abry and Escudier1993). The mid-centralised quality of /y/ was also observed by Newmark (Reference Newmark1957) and Newmark et al. (Reference Newmark, Hubbard and Prifti1982). /u/ is a rounded close back vowel. Its quality ranges from close [u] to a more open [u̞], as illustrated by its spread distribution in Figure 11. Figure 12 illustrates the very similar, if not identical, labial profiles of /y/ and /u/.
Mid vowels
Regarding the mid vowels, /e/ is front, close-mid and unrounded [e]. Figure 12 illustrates that /e/ is produced with lips as retracted as /i/ but with a greater degree of aperture. /ɔ/ is a back, open-mid and rounded vowel [ɔ]. Both the position of /ɔ/ in the acoustic space and its tongue configuration show the open-mid nature of this vowel. /ɔ/ is produced with rounded lips, though they are unsurprisingly not as protruded as for /y/ and /u/ due to the greater lip aperture.
The vowel written ⟨e̤⟩ in the Albanian writing system has traditionally been described as a mid central vowel (i.e. schwa). However, work on different varieties of Albanian by Granser & Moosmüller (Reference Granser, Moosmüller, Dziubalska-Kołaczyk and Weckwerth2002) shows that this vowel is characterised by a great deal of variation across speakers and contexts and that it deviates from the canonical mid central vowel [ə]. We identify this vowel as a central open-mid unrounded /ɜ/. In our data, /ɜ/ is more open than canonical [ə] and partially overlaps with /a/ in the F1/F2 space. Interestingly, a similar kind of variation for this type of vowel has been reported for Nalögo, an Oceanic language of the Temotu (Alfarano Reference Alfarano2021). Furthermore, the tongue contour in Figure 13 highlights the low position of the tongue in the articulation of /ɜ/, which is as low as that of /a/. What distinguishes these two vowels in terms of tongue configuration is in fact the tongue root, which is fronter for /ɜ/ than /a/. Moreover, /ɜ/ shows some degree of lip protrusion, similar to that of /ɔ/, while it is totally absent for /a/. In sum, /ɜ/ is realised as a partially labialised open-mid central vowel [ɜ̹ ∼ ɞ̜].
Open vowel
The only open vowel /a/ is articulated between an open central vowel [ä] and an open back vowel [ɑ].
Prosody
As we are not aware of any study that has specifically addressed the stress and intonation system of Northern Tosk in particular, we will review here those that exist on Standard Albanian, given that Standard Albanian is based primarily on Northern Tosk (Kostallari Reference Kostallari1984).
Lexical stress
Albanian is a stress-accent language (Hyman Reference Hyman2006), with traditional grammars referring to it as having ‘dynamic stress’ (rather than ‘melodic stress’, i.e. a pitch-accent system or lexical tones). More specifically, Çabej (Reference Çabej1976), Demiraj (Reference Demiraj1984) and Topalli (Reference Topalli1995), among others, argue that the primary acoustic correlates of stress are duration and intensity (although see Jubani-Bengu & Conforti Reference Jubani-Bengu and Conforti2008 for a less robust role of intensity). The location of lexical stress has been argued to be predictable from either phonological or morphological structure (e.g. Demiraj Reference Demiraj1984, Trommer & Grimm Reference Trommer and Grimm2004, Bermúdez-Otero Reference Bermúdez-Otero, Marc van Oostendorp, Ewen and Rice2011, Memushaj Reference Memushaj2017). Generally speaking, primary lexical stress can be found on the final, penultimate and antepenultimate syllable of the word, as illustrated by the following words.
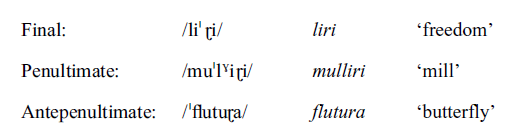
To assess which acoustic features might cue lexical stress in Northern Tosk, we extracted three measures from each vowel in the words liri /li.ˈɽi/, mulliri /mu.ˈlˠi.ɽi/ and flutura /ˈflu.tu.ɽa/, as uttered by the five speakers in our corpus. From the total number of word tokens (N = 45, 3 words × 3 repetitions × 5 speakers), we removed tokens that were uttered with a rising contour, which we attribute to the typical list effect when reading from a word list. Thirteen such word tokens were excluded from further analysis, leaving 32 tokens. From each vowel of these tokens we extracted vowel duration, maximum intensity and maximum f0, which we then z-scored to allow for cross-subject comparison. These are shown in Figure 14. Each dot represents a vowel and the grey lines link vowels belonging to the same word token. The stressed vowel in each token is marked by a red dot.
Three acoustic correlates of lexical stress: duration (top), intensity (middle) and f0 (bottom). Each dot represents a vowel and the grey lines link vowels belonging to the same token (N = 32). Red dots represent stressed vowels.
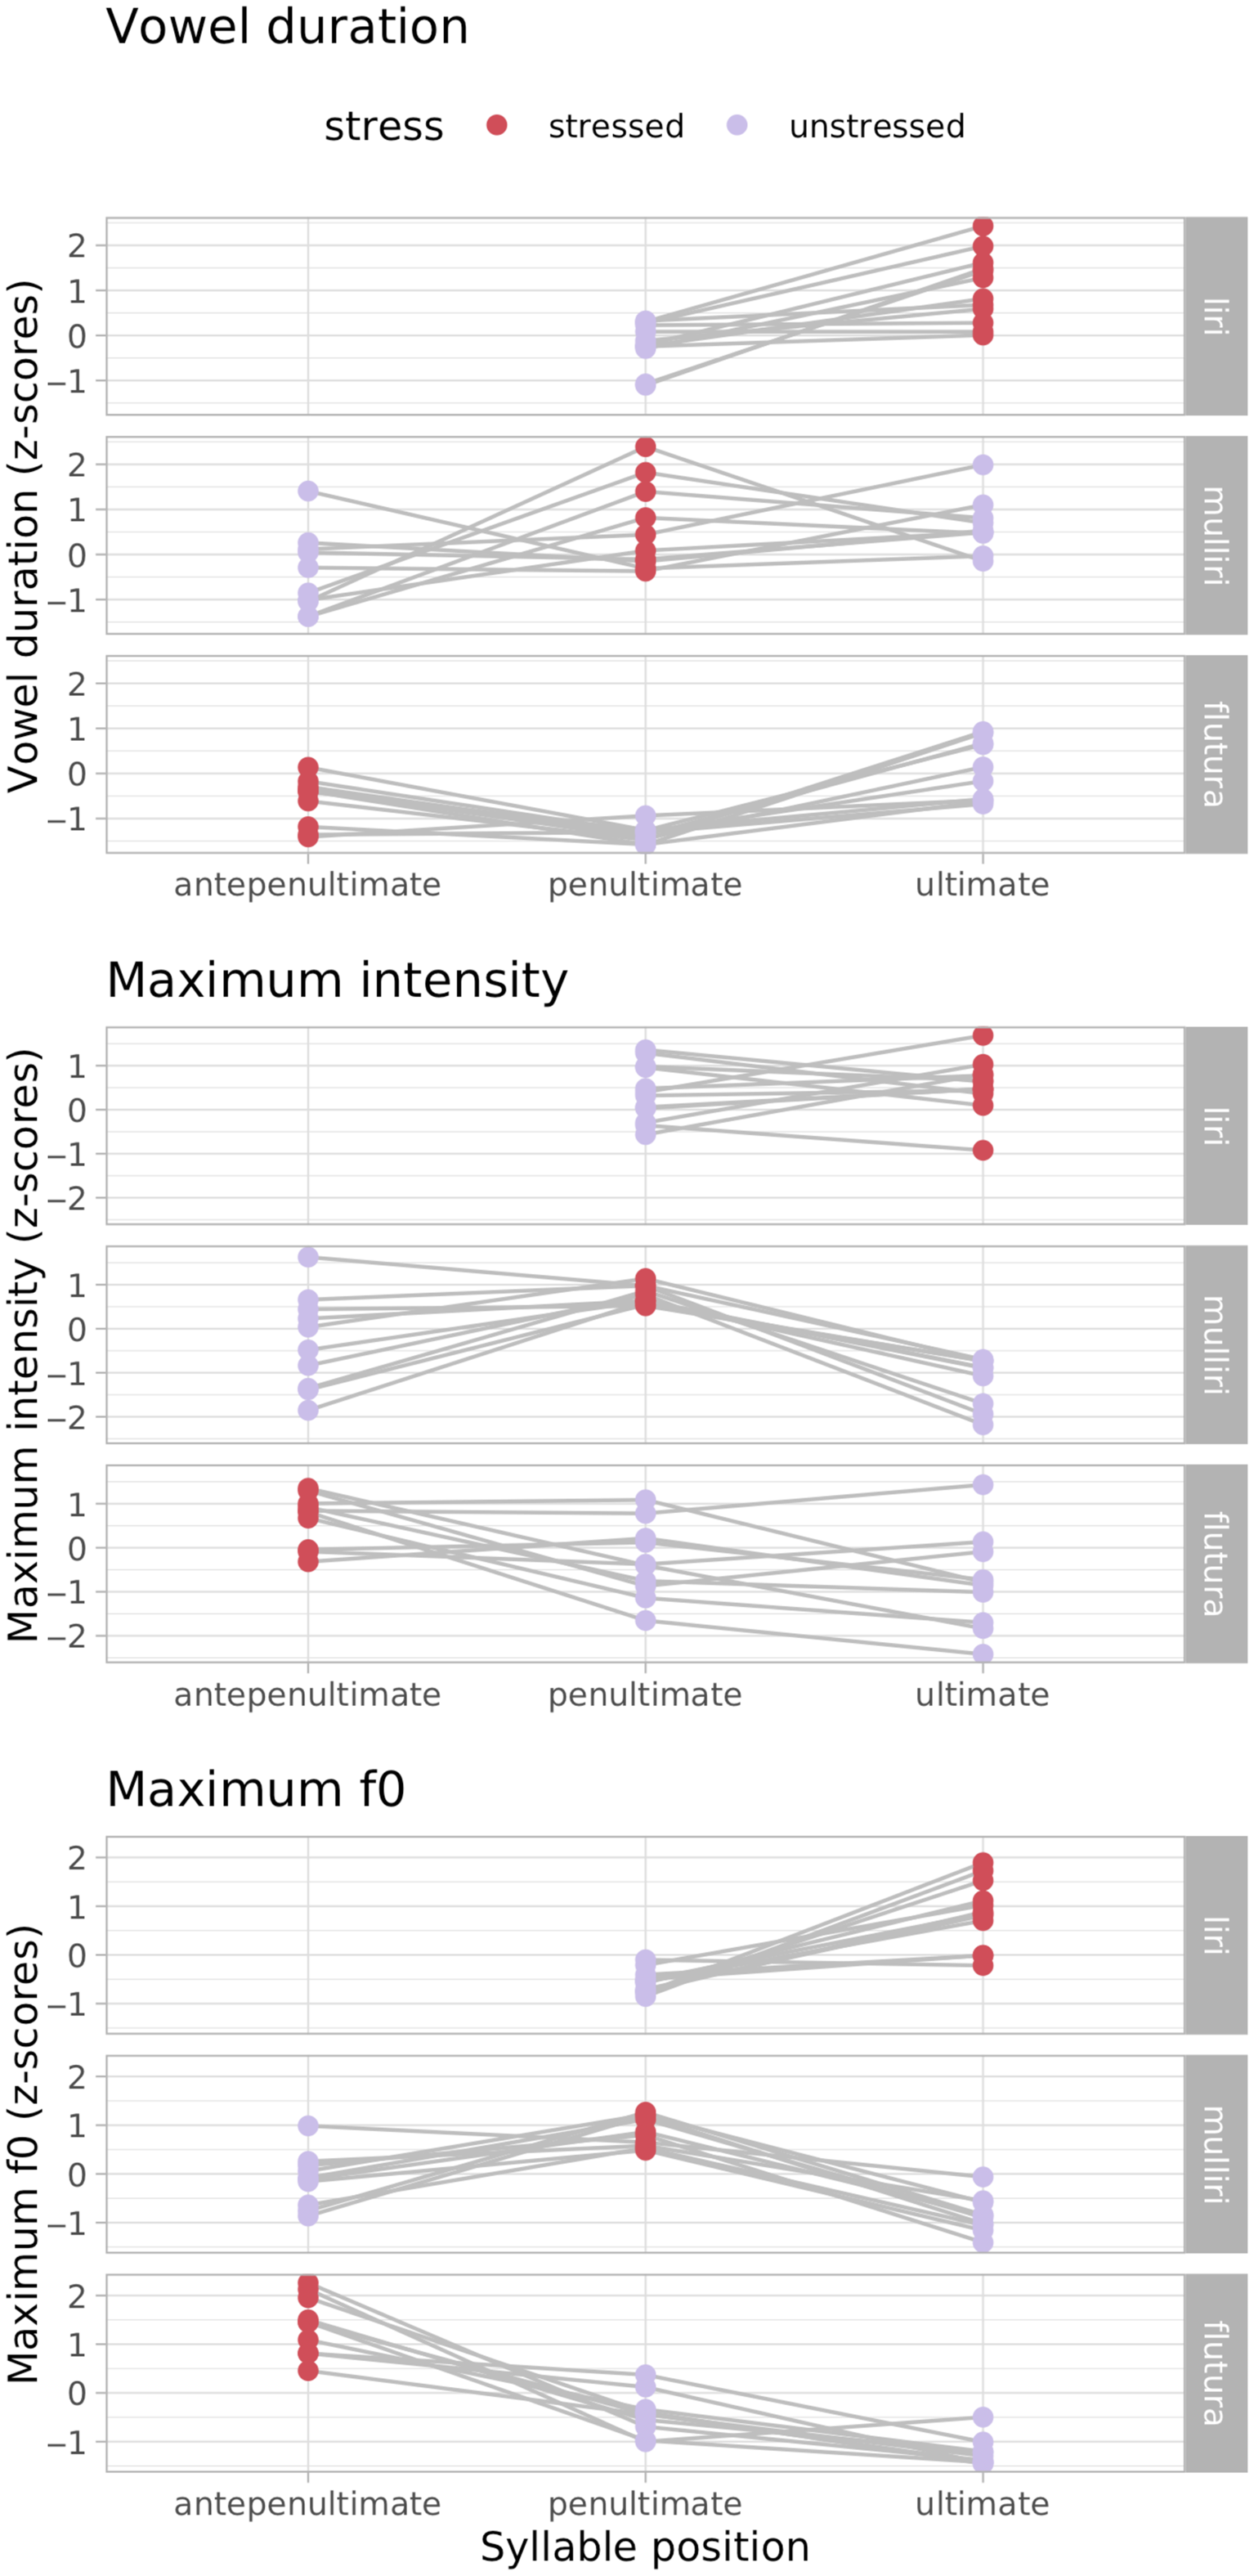
The top panel of Figure 14 shows measurements of vowel duration. The slope of each connecting grey line indicates whether duration increases (positive slope), decreases (negative slope) or does not change (horizontal line) when comparing one syllable to the next. For vowel duration, a general pattern emerges which indicates that stressed vowels tend to be longer than unstressed vowels. This is especially evident when comparing the antepenultimate and penultimate syllables in mulliri and flutura. Note that the increase of vowel duration in word-final position, albeit not universal, is a well-known phenomenon (White, Benavides-Varela & Mády Reference White, Benavides-Varela and Mády2020) and, as such, the increase observed in final syllables is not surprising.
The mid panel reports maximum intensity (i.e. peak intensity within each vowel). While there is a general tendency for stressed vowels to show higher intensity than unstressed vowels, the opposite pattern can also be observed in the data. Moreover, especially in flutura, some tokens are characterised by a stable maximum intensity value across two consecutive syllables. Finally, the maximum intensity values of the stressed vowels in mulliri and flutura show substantially less variation than those in the unstressed vowels. In sum, intensity might be playing a role as a cue to stress but less systematically so than vowel duration, which is also in line with Jubani-Bengu & Conforti (Reference Jubani-Bengu and Conforti2008).
Maximum f0 is shown in the bottom panel of Figure 14. Fundamental frequency is systematically higher in stressed compared to unstressed vowels. This result is surprising in light of the traditional view that Albanian lexical stress is cued by duration and possibly intensity (Çabej Reference Çabej1976, Demiraj Reference Demiraj1984, Topalli Reference Topalli1995, Jubani-Bengu & Conforti Reference Jubani-Bengu and Conforti2008) but not by f0 (Jubani-Bengu & Conforti Reference Jubani-Bengu and Conforti2008). However, f0 modulations are not unusual in stress-accent languages and the presence of durational, intensity and f0 differences in stressed vs unstressed vowels in production has been argued, for example, for Italian (Albano Leoni & Maturi Reference Albano Leoni and Maturi1998, Alfano Reference Alfano, Savy and Crocco2006, Alfano, Savy & Llisterri Reference Alfano, Savy, Llisterri, Romito, Galatà and Lio2009, Sulpizio & McQueen Reference Sulpizio and McQueen2012).
In sum, the data in our corpus suggest that vowel duration and f0 can differentiate lexically-stressed from unstressed vowels (with the former being longer and having higher f0). While intensity might also play a role, we found less robust patterns for this cue than the other two.
Intonation
-
(a) Lena lau murin. ‘Lena washed the wall.’
-
(b) Lena lau murin, jo lulen. ‘Lena washed the wall, not the flowers.’
-
(c) A e lau Lena murin? ‘Did Lena wash the wall?’
-
(d) Çfarë lau Lena? ‘What did Lena wash?’
Figure 15 shows the f0 contours of a declarative sentence (a), a contrastive focus sentence (b), a polar question (c) and a content question (d) from three of our informants. Early descriptive studies have suggested that declarative sentences have a falling intonational contour, as seen in our corpus in sentences (a) and (b), while questions have a rising one, as in sentences (c) and (d) (Boriçi Reference Boriçi1987, Memushaj Reference Memushaj2015). More recent work has proposed that different informational-structure constructs, such as topic, informational focus and contrastive focus associate with different tunes in Standard Albanian (Kapia & Brugos Reference Kapia and Brugos2016, Reference Kapia and Brugos2019; Kapia, Kleber & Harrington Reference Kapia, Kleber and Harrington2020, Kapia, Harrington & Kleber forthcoming). The narrow focus pattern can be seen in the word murin in the polar question (c).
Smoothed intonation contours (f0) of (a) declarative sentence, (b) contrastive focus, (c) polar question, (d) content question. Normalised times of syllabic boundaries are marked by vertical lines within each panel.

Transcription of recorded passage ‘The North Wind and the Sun’
Albanian orthographic version
Era e Veriut dhe Dielli po ziheshin se kush ishte më i fortë, kur aty kaloi një udhëtar që kishte veshur një pallto të ngrohtë. Ata ranë dakord që kush do ta bënte udhëtarin të hiqte pallton më përpara do të quhej më i forti. Fill pas kësaj, Era e Veriut filloi të frynte me gjithë fuqinë e saj, por sa më shumë që frynte aq më shumë kapej udhëtari pas palltos së tij, derisa më në fund Era e Veriut u dorëzua. Pastaj Dielli lëshoi rrezet e tij të ngrohta dhe menjëherë udhëtari e hoqi pallton. E kështu Era e Veriut u detyrua të pranonte që dielli ishte më i fortë se ajo.


Narrow phonetic transcription

Open Science statement
The research compendium containing data and code used in this illustration can be found at https://osf.io/vry3h/.
Authors’ roles
We follow the CRediT (Contributor Roles Taxonomy) standard in providing information about the roles and contribution of each author. A visual representation of the authors’ roles is available here: https://github.com/stefanocoretta/alb-ipa/blob/main/img/credit-taxonomy.png. A description of the roles can be found here: http://credit.niso.org/contributor-roles-defined/.
Acknowledgements
We would like to thank our consultant speakers who enthusiastically participated in this study. This study was supported by the European Research Council Grant No. 742289 Human Interaction and the Evolution of Spoken Accent (2017–2022) awarded to Professor Jonathan Harrington (authors SC, EK), by the Georg Forster Fellowship of the Alexander von Humboldt Foundation (EK), and by the Fonds de recherche du Québec – Société et Culture (JRC).
Supplementary material
To view supplementary material for this article, please visit https://doi.org/10.1017/S0025100322000044.


 Open access