

Obesity is a global epidemic with more than 300 million adults being clinically obese worldwide. It is associated with various disorders including CVD, type 2 diabetes and certain types of cancers. Obesity is most commonly caused by a combination of factors such as excessive consumption of energy-dense foods, lack of physical activity and genetic susceptibility. Recently, the intestinal microbiota has been identified as a factor that may contribute to obesity development in both mice and human subjects(Reference Turnbaugh, Ley and Mahowald1, Reference Ley, Turnbaugh and Klein2). Obesity has been linked to changes in the relative proportions of the phyla Bacteroidetes and Firmicutes(Reference Ley, Backhed and Turnbaugh3), which account for more than 90 % of all faecal bacteria(Reference Ley, Turnbaugh and Klein2). Genetically obese leptin-deficient (ob/ob) mice harboured 50 % fewer Bacteroidetes and correspondingly more Firmicutes than the corresponding wild-type mice which were lean(Reference Ley, Backhed and Turnbaugh3). Moreover, conventional (CV) mice accumulated more body fat than germ-free (GF) mice when fed a Western-style, high-fat, sugar-rich diet (WD)(Reference Backhed, Manchester and Semenkovich4). To explain these observations, intestinal bacteria were proposed to afford a more efficient energy harvest from the diet by converting non-digestible carbohydrates to SCFA. The microbiota was also suggested to cause a reduction of fasting-induced adipose factor (Fiaf), also known as angiopoietin-like protein 4 (Angptl4), a circulating inhibitor of lipoprotein lipase, and thereby to promote the storage of fatty acids released by lipoprotein lipase in host adipose tissue(Reference Backhed, Manchester and Semenkovich4).
We set out to define the exact role of the intestinal microbiota in diet-induced obesity in more detail. For this purpose, we first checked whether the alterations in microbial composition obtained for the leptin-deficient mice(Reference Ley, Backhed and Turnbaugh3) are also valid for wild-type mice, and can therefore be generalised. We fed GF and CV mice various diets, including a semi-synthetic high-fat diet (HFD), which we used previously to induce obesity(Reference Klaus5), and we determined body weight gain, body fat, energy expenditure, respiratory quotient and composition of the gut microbiota. We also investigated whether the lipogenic effects of the various diets are reflected by changes in intestinal Fiaf/Angptl4 mRNA and Fiaf/Angptl4 plasma concentrations in the GF or CV host, respectively. Here, we have reported that GF mice are not generally protected from obesity, and that Fiaf does not appear to play a major role in gut microbiota-mediated effects on fat storage.
Materials and methods
Animal maintenance and experimental setup
Male GF and CV C3H mice were purchased from Charles River (L'Arbresle, France). GF mice were maintained in positive-pressure isolators (Metall & Plastik, Radolfzell, Germany). All experimental diets were irradiated (25 kGy). Mice were housed individually in polycarbonate cages on irradiated wood chips at 22 ± 2°C and at a relative air humidity of 55 ± 5 % on a 12 h light–dark cycle. They had free access to a standard chow diet (SD, Altromin fortified type 1310; Altromin, Lage, Germany) and autoclaved distilled water. Coprophagy was not prevented. Animal maintenance and experiments were approved by the animal welfare committee of the Ministry of Agriculture and Environment (State of Brandenburg, Germany).
Expt 1
GF and CV mice, 12 weeks of age (n 7), were assigned either to a semi-synthetic low-fat diet (LFD) or to a HFD(Reference Klaus5, Reference Daenzer, Ortmann and Klaus6) for 4 weeks (Table 1). Feed was provided in special containers that allowed the collection of spilled feed. Body weight was measured twice per week. Energy intake (E in) and energy loss via the faeces (E faeces) were determined during the first 3 d of the intervention phase (IKA-Calorimeter C5000; IKA-Werke GmbH and Company KG, Staufen, Germany). Food digestibility in percentage was calculated as (E in − E faeces)/E in × 100, and the digestible energy as E in × food digestibility. Faecal samples were collected directly before intervention and in week 4 of the intervention phase to analyse the microbial community composition by 16S rRNA-targeted flow cytometry-coupled fluorescence in situ hybridisation (FISH).
Composition of the semi-synthetic diets (low-fat diet (LFD) and high-fat diet (HFD)) and the commercial Western diet (WD)
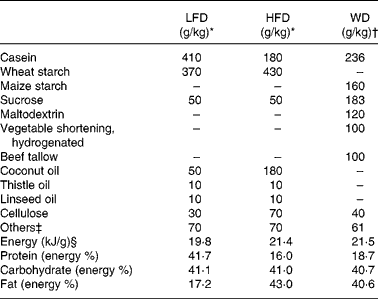
* Diet components as described in Daenzer et al. (Reference Daenzer, Ortmann and Klaus6).
† Diet components as provided by the manufacturer (Harlan Teklad).
‡ Among others minerals and vitamins.
§ As defined by bomb calorimetry.
Expt 2
Twelve-week-old male GF and CV mice (n 5) were fed either a HFD or a commercial WD (TD96132; Harlan Teklad, Madison, WI, USA) for 4 weeks. Food digestibility and digestible energy were measured during the first 3 d of the intervention. At the end of the experiments, mice were anaesthetised, and blood was collected by cardiac puncture. Subsequently, the mice were killed by cervical dislocation. Organs were removed, weighed, frozen in liquid nitrogen and stored at − 80°C. Faecal samples were collected and analysed by flow cytometry-coupled FISH as in Expt 1.
Expt 3
Twelve-week-old CV mice (n 5) were fed three different diets for 4 weeks: HFD, WD or SD. Faecal samples were collected in week 3 of the feeding experiment, and the faecal SCFA concentrations were determined. One week later, the mice were killed, and the DNA extracted from the colonic contents was subjected to microbial community analysis based on 16S rRNA gene sequencing.
Body composition and energy expenditure
Body composition was determined at the end of the dietary intervention (day 30) using quantitative magnetic resonance (Bruker's Minispec MQ10, Bruker Minispec, Houston, TX, USA) as described previously(Reference Klaus, Rudolph and Dohrmann7). Lean body mass was calculated by subtracting body fat values obtained by quantitative magnetic resonance from body weight values obtained before quantitative magnetic resonance measurement. Total energy expenditure (TEE) was measured by indirect calorimetry as described earlier(Reference Klaus, Rudolph and Dohrmann7–Reference Ortmann, Prinzler and Klaus9) using an open respirometric system (gas analysers: Magnos 16 and Uras 14, Hartmann & Braun, Frankfurt/Main, Germany). Microbial colonisation of GF mice during the calorimetry was prevented by using irradiated cages, cage lids and water flasks, and high efficiency particulate air filters on the air inlet of the cages. All the mice were unrestrained, and had free access to their respective diets and water. The respiratory quotient (VCO2:VO2) and TEE (kJ/d) were calculated as described previously(Reference Petzke, Friedrich and Metges10). Measurements were performed at 6 min intervals over a 23 h period. After calorimetric measurements, faecal samples were collected from GF mice, and were checked for bacterial contamination.
Quantitative real-time PCR
RNA was isolated from the mucosa of the lowest third of the small intestine and the epididymal white adipose tissue as described before(Reference Boeuf, Klingenspor and Van Hal11) with modifications as described by Weber et al. (Reference Weber, Bolander and Sarkar12). Residual genomic DNA was removed using the Turbo DNA-free Kit (Applied Biosystems, Foster City, CA, USA; Ambion, Austin, TX, USA). Synthesis of complementary DNA was performed from 1 μg of total RNA using the RevertAid H Minus First Strand complementary DNA Synthesis Kit (Fermentas, St Leon-Rot, Germany). Quantitative real-time PCR was performed on the Applied Biosystems 7900 HT Fast Real-Time PCR System (Applied Biosystems). The PCR mix (5 μl) contained TaqMan(R) Universal PCR Master Mix, No AmpErase(R) UNG (Applied Biosystems) and a complementary DNA amount corresponding to 5 ng of RNA used for complementary DNA synthesis and gene-specific primer probe pairs (for Fiaf/Angptl4: forward 5′-GGGACCTTAACTGTGCCAAG-3′, reverse 5′-CCGTGGGATAGAGTGGAAGT-3′, probe 5′-6-FAM-CCACCAGCCACCAGAGAGGCT-TAMRA-3′ and for 18S rRNA: forward 5′-ACCACATCCAAGGAAGGCAG-3′, reverse 5′-TTTTCGTCACTACCTCCCC-3′, probe 5′-6-FAM-AGGCGCGCAAATTACCCACTCCC-TAMRA-3′). Gene expression was calculated as ΔC T using 18S rRNA as a reference, and was expressed relative to the GF HFD group normalised to a value of 1.
Immunological detection of fasting-induced adipose factor/angiopoietin-like protein 4 in plasma
Plasma samples were run on an SDS polyacrylamide gel (4 % stacking gel and 10 % running gel), and were transferred to polyvinylidine fluoride membranes (Roti-PVDF; Carl Roth GmbH, Karlsruhe, Germany). Unspecific antibody binding was blocked with 5 % milk powder (Carl Roth GmbH) in 0·1 % Tween 20/Tris-buffered saline (TBS-T; 20 mm-Tris, 137 mm-NaCl and 0·1 % (v/v) Tween 20, (pH 7·6)) for 60 min at room temperature. Membranes were incubated overnight at 4°C in 1 % bovine serum albumin/TBS-T with rabbit anti-Fiaf/Angptl4 (final dilution 1:2000; Acris Antibodies GmbH, Herford, Germany), washed four times in TBS-T and subsequently incubated for 1 h at room temperature with a horseradish peroxidase-conjugated secondary antibody, goat anti-rabbit-IgG in 1 % bovine serum albumin/TBS-T (final dilution 1:2000; Cell Signaling Technology, Danvers, MA, USA). After four washing steps in TBS-T, the membranes were incubated for 5 min with Super Signal West Femto Maximum Sensitivity Substrate (Thermo Scientific, Waltham, MA, USA) at room temperature. Signals were detected with the UVIprochemi imaging system (Biometra, Goettingen, Germany), and were quantified using the BioDocAnalyze 2.46.8.1 Software (Biometra).
Plasma analysis
Glucose concentrations were determined with Contour glucose sticks (Bayer, Leverkusen, Germany). Insulin was analysed by an ultrasensitive ELISA (Insulin mouse ultrasensitive ELISA; DRG Instruments, Marburg, Germany).
Liver TAG and glycogen analyses
For TAG analysis, liver tissue was ground in liquid nitrogen to a homogenous powder. One hundred milligrams of tissue were homogenised in 5 ml of 10 mm-sodium phosphate buffer, pH 7·4, containing 1 mm-EDTA and 1 % polyoxyethylene 10 tridecyl ether using an Ultra-Turrax (IKA-Werke), and were centrifuged for 15 min at 23 100 g. The supernatant fraction was incubated at 70°C for 5 min and centrifuged again. TAG (triglyceride reagent; Sigma, St Louis, MO, USA) and protein contents (detergent compatible protein assay; Bio-Rad, Hercules, CA, USA) were analysed in triplicates from the supernatant.
For glycogen analysis, 50 mg of ground liver tissue were homogenised in 750 μl of 0·1 m-NaOH using an Ultra-Turrax. The homogenate was incubated at 70°C for 45 min and centrifuged for 10 min at 4°C and 12 400 g. Glycogen (Starch Kit; R-Biopharm, Darmstadt, Germany) and protein contents (detergent compatible protein assay) were analysed in triplicates from the supernatant.
Quantification of faecal bacteria by fluorescence in situ hybridisation
Freshly collected faecal samples (0·2 g wet weight) were suspended in 1·8 ml of PBS (138 mm-NaCl, 26·8 mm-KCl, 40·3 mm-Na2HPO4 and 17·6 mm-KH2PO4 (pH 7·4)), thoroughly vortexed for 5 min and centrifuged at 300 g for 1 min at 4°C to remove debris. The cells were fixed by addition of 1·5 ml of 4 % paraformaldehyde solution to 500 μl of cell suspension and subsequent storage at 4°C for 3 h. Fixed bacterial cells were kept at − 80°C until analysis. For analysis, the paraformaldehyde-fixed cells were thawed and hybridised with 16S rRNA-targeted oligonucleotide probes. The probes used were EUB338 for the detection of total bacteria(Reference Amann, Binder and Olson13), non-Eub338 for quantifying unspecific binding of the fluorochrome(Reference Wallner, Amann and Beisker14), Bac303 for the detection of Bacteroides(Reference Manz, Amann and Ludwig15), Erec482 for the detection of the Eubacterium rectale–Clostridium coccoides cluster(Reference Franks, Harmsen and Raangs16), Lab158 for the detection of Lactobacillus/Enterococcus spp.(Reference Harmsen, Elfferich and Schut17) and Clep866, which was used in conjunction with the two competitor probes cpClep1 and cpClep2, for the detection of the Clostridium leptum group(Reference Lay, Sutren and Rochet18). The probes were covalently linked at their 5′-end to either fluorescein isothiocyanate or indodicarbocyanine. Following hybridisation, a 100-μl aliquot of each cell suspension was added to 250 μl FACSFlow (Becton Dickinson, Pont de Claix, France) for flow cytometric detection. Data acquisition was performed with a FACSCalibur flow cytometer (Becton Dickinson) equipped with an air-cooled argon ion laser providing 15 mW at 488 nm combined with a 635 nm red-diode laser as described previously(Reference Mueller, Saunier and Hanisch19). All parameters were collected as logarithmic signals. A total of 105 events were stored in listmode files. The rate of events in the flow was generally approximately 3000 counts/s.
Bacterial community analysis based on 16S rRNA gene sequencing
Bacterial DNA was isolated from colonic contents using the FastDNA® SPIN Kit (MP Biomedicals, Eschwege, Germany) according to the manufacturer's instructions. Isolated DNA was pooled from five mice per dietary group. The 16S rRNA genes were amplified using the 1492 reverse primer (5′-TACCTTGTTACGACTT-3′) and a mixture of the following twenty-seven forward primers(Reference Frank, Reich and Sharma20): 27f-Bif, 5′-AGGGTTCGATTCTGGCTCAG-3′, Bifidobacteriaceae; 27f-Bor, 5′-AGAGTTTGATCCTGGCTTAG-3′, Borrelia; 27f-Chl, 5′-AGAATTTGATCTTGGTTCAG-3′, Chlamydiales; and 27f-YM, 5′-AGAGTTTGATYMTGGCTCAG-3′, where Y is C or T, and M is A or C. The PCR mixture (50 μl) contained 50 mm-KCl, 20 mm-Tris–HCl, 2·5 mm-MgCl2, 0·25 mm of each deoxyribonucleotide triphosphate, 0·2 μm of each primer, 2·5 μmol/min of Taq DNA polymerase (Invitrogen, Karlsruhe, Germany) and 1 μl of template DNA. The PCR program was 94°C for 4 min, thirty cycles of 94°C for 30 s, 54°C for 30 s and 72°C for 30 s, and finally one cycle of 72°C for 2 min. PCR products were ligated into the vector pGEM-T Easy (Promega, Mannheim, Germany), and were transformed into Escherichia coli JM109. For each diet, approximately 170 colonies containing cloned amplicons were processed for sequencing. Plasmid inserts were sequenced unidirectionally by Eurofins MWG Operon (Eberswalde, Germany) using the vector-specific primer SP6. Using the Basic Local Alignment Search Tool (BLAST, http://blast.ncbi.nlm.nih.gov/Blast.cgi), the obtained 16S rRNA gene sequences were compared against the sequence database. Only sequences with a length>750 bp were considered. The taxonomic assignment given in Table 5 is based on the phylogenetic position of the most closely related species (>96 %).
Analysis of faecal SCFA
Faecal acetate, butyrate, propionate, valerate and isovalerate were measured with an HP 5890 series II gas chromatograph (Hewlett-Packard, Waldbronn, Germany) equipped with an HP-20 M column and a flame ionisation detector. Fresh faeces were fivefold diluted with water and centrifuged at 21 000 g for 5 min. Supernatant (200 μl) was mixed with 23·6 μl of 12 mm-isobutyric acid, 270 μl of 1 m-NaOH and 280 μl of 0·36 m-HClO4. The mixture was lyophilised overnight, and the remnant was re-dissolved in a mixture of 400 μl of acetone and 100 μl of 5 m-formic acid. After centrifugation, 1 μl of the supernatant was injected into the gas chromatograph.
Statistical analysis
Data are presented as means with their standard errors. Differences between groups were analysed using ANOVA (two-factorial or repeated measurements when appropriate) followed by the Bonferroni post-test analysis (Prism 4.0 for Windows, Graph Pad Software, Inc., La Jolla, CA, USA). Differences were considered significant at P < 0·05. Differences in the microbiological data within the groups at baseline and after intervention were analysed using the Wilcoxon signed rank test. Differences between the dietary groups during the intervention were analysed using the Mann–Whitney U test.
Results
Expt 1
To better define the possible role of intestinal bacteria in diet-induced obesity, we first investigated whether the previously reported protection of GF mice from obesity(Reference Backhed, Manchester and Semenkovich4) is generally valid. If this was the case, this protection should not be restricted to a certain type of HFD. Therefore, GF and CV wild-type mice (n 14), previously kept on SD, were fed for 4 weeks either one of the two experimental semi-synthetic diets (n 7): a LFD and a HFD(Reference Klaus5). The mean body weight at the start of the dietary intervention period was 29·3 (sem 0·3) g for the GF mice and 27·5 (sem 0·2) g for the CV mice (P < 0·001). GF and CV mice fed the LFD had essentially the same body weight gain over the 4-week intervention period (GF LFD 2·0 (sem 0·3) g and CV LFD 1·8 (sem 0·4) g per animal per 4 weeks). In contrast, GF mice fed the HFD gained more body weight than CV mice fed the HFD (Fig. 1(A), P < 0·001). These differences in body weight gain after 4 weeks on the HFD are consistent with differences in the body fat content, which was more than twofold higher in GF mice than in CV mice (Fig. 1(B), P < 0·001). There was no significant difference in lean mass between CV and GF mice, neither on the LFD nor on the HFD (Table 2).
Weight gain (A) and body fat (B) of conventional (CV) and germ-free (GF) mice after 4 weeks on the semi-synthetic low-fat diet (LFD) and the high-fat diet (HFD), respectively. Mean values with their standard errors are plotted, n 7. a,b,c Mean values at week 4 with unlike letters were significantly different (P ≤ 0·05). *** Mean values were significantly different compared with GF mice (P < 0·001). (A) –△–, GF LFD; –○–, GF HFD; –▲–, CV LFD; –●–, CV HFD. (B) □, GF; ▨, CV.

(Mean values with their standard errors, n 7)

TEE, total energy expenditure; RQ, respiratory quotient; BW, body weight.
Mean values were significantly different compared with GF mice on the same diet: *P < 0·05, **P < 0·01, ***P < 0·001.
† P>0·05.
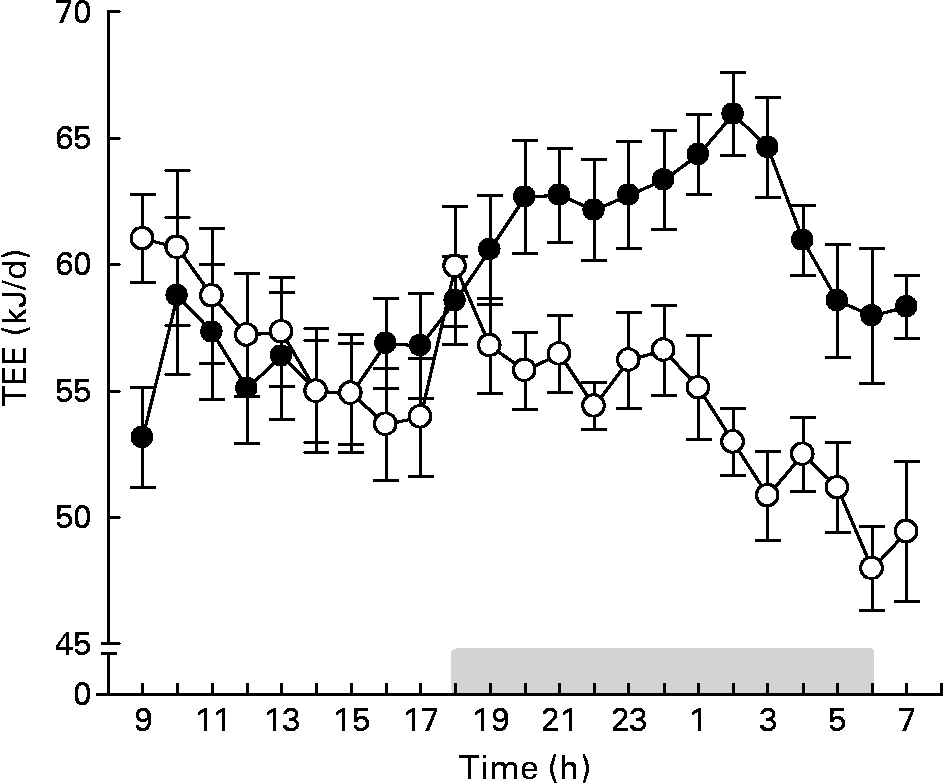
During the first 3 d of the 4-week intervention period, we also measured food digestibility and total digestible energy. The digestibility of the LFD and the HFD was>90 % in both CV and GF mice (Table 2). The total digestible energy did not differ between CV and GF mice, neither on the LFD nor on the HFD. After 4 weeks of dietary intervention, we measured the TEE of the mice. The daily patterns of TEE in GF and CV mice fed the LFD (data not shown) and in the CV mice fed the HFD were similar (Fig. 2). In contrast, GF mice fed the HFD had a lower TEE than CV mice fed the HFD, in particular during the dark phase (i.e. activity period) and when normalised for body weight (Table 2). The respiratory quotient, an indicator of the overall substrate oxidation(Reference Jequier, Acheson and Schutz21), was higher for mice fed the LFD than for those fed the HFD, no matter whether the mice were GF or CV. This indicates that the LFD leads to a higher overall carbohydrate oxidation. Since there were no significant differences in digestible energy, we propose that the low energy expenditure of GF mice on the HFD is a major factor that contributes to the higher accumulation of body fat in this group.
Twenty-three-hour total energy expenditure (TEE) of conventional (●) and germ-free (○) mice after 4 weeks on the semi-synthetic high-fat diet. The grey bar indicates night time (lights off). Values are means with their standard errors (n 7). For statistical analysis, see Table 2.
To assess the impact of the two experimental diets on the gut microbial community of the CV mice, we collected faeces before and after the dietary intervention, and determined by flow cytometry-coupled FISH the proportions of four major phylogenetic groups representative of the two dominant phyla in the mouse intestine: the phylum Bacteroidetes was represented by the Bacteroides–Prevotella group, and the phylum Firmicutes was represented by the E. rectale–C. coccoides cluster, the Lactobacillus–Enterococcus group and the C. leptum group. These four bacterial groups accounted at baseline (SD) for approximately 75 % of total bacterial cells detectable with the EUB338 probe, while they accounted for only 51·5 (sem 4·6) % when fed the LFD and 27·2 (sem 7·2) % when fed the HFD (Table 3; Expt 1), indicating that the proportion of bacteria detectable with the selected probes decreased in response to the semi-synthetic diets.
(Mean values with their standard errors; Expt 1, n 7; Expt 2, n 5)

SD, standard chow diet; LFD, low-fat diet; HFD, high-fat diet; WD, Western diet
* One sample of each animal was analysed in duplicates before and at the end of the intervention.
† Mean values were significantly different between baseline and intervention for a given group (P < 0·05).
‡ Mean values were significantly different between dietary groups during intervention (P < 0·05).
Expt 2
The afore-mentioned results appeared to be in conflict with the observations and conclusions of Backhed et al. (Reference Backhed, Manchester and Semenkovich4) who reported that GF mice but not CV mice are protected from diet-induced obesity. These authors used a commercial semi-synthetic HFD, referred to as WD. While the macronutrient compositions of WD and HFD are almost identical, they differ in the type of carbohydrates and lipids (Table 1). To further test the hypothesis that GF mice are not generally protected from obesity, we performed a second feeding experiment, in which we compared the effects of HFD and WD on weight gain and body fat of GF and CV mice (n 5). In the course of the dietary intervention, GF mice gained significantly more weight on the HFD than on the WD (P < 0·01) and, accordingly, at the end of the intervention period, they had 68 % more body fat on the HFD than on the WD (Table 4).
(Mean values with their standard errors, n 5)

BW, body weight.
Mean values were significantly different compared with GF mice on the same diet: *P < 0·05, **P < 0·01, ***P < 0·001.
† P>0·05.
In agreement with the experiments of Backhed et al. (Reference Backhed, Manchester and Semenkovich4), GF mice fed the WD had 41 % less body fat than CV mice fed the WD (P < 0·05, Table 4). In contrast, GF mice fed the HFD had body fat content that was similar to that of CV mice fed this diet, and the weight gain of the GF mice and the CV mice on this diet was also similar. The latter finding differs from that in the first experiment, in which GF mice gained more weight than CV mice and had more body fat when fed the HFD. Nevertheless, both the experiments consistently showed that GF mice fed the HFD did not have less body fat than the corresponding CV mice. These data clearly demonstrate that GF mice are not generally protected from obesity, but that the actual components of the diet rather than the macronutrient composition determine the extent of protection. The differences in weight gain and body fat observed from the comparison of the HFD-fed GF and CV mice between Expt 1 and 2 might be due to accidental differences at the start of the dietary intervention: in Expt 1, the initial body weight was higher for the GF mice than for the CV mice on the HFD (CV mice 27·5 (sem 0·2) g and GF mice 29·3 (sem 0·3) g, P < 0·001), while the opposite was true in Expt 2 (CV mice 28·2 (sem 0·3) g and GF mice 24·3 (sem 0·6) g, P < 0·001).
There was no significant difference in lean mass between GF mice fed the HFD and GF mice fed the WD (data not shown). The digestibility of the WD was similar in GF and CV mice (92·1 (sem 0·31) and 92·1 (sem 0·27) %, respectively), and intake of digestible energy in the first 3 d of the dietary intervention phase was also not different between GF and CV mice (85·0 (sem 3·4) and 83·6 (sem 2·6) kJ/d, respectively). These findings suggest that the WD but not the HFD rendered GF mice in comparison with CV mice less sensitive to the induction of obesity. However, this ‘resistance’ of GF mice fed the WD was not due to an impaired ability to digest this particular diet. While plasma glucose, plasma insulin and liver glycogen concentrations were lower in GF mice on both the diets, we observed a significant difference in liver TAG concentrations between GF and CV mice only on the WD, with increased liver TAG in CV mice but not in GF mice (Table 4).
It has been proposed that the intestinal microbiota promotes fat storage of the host by suppressing the intestinal expression of Fiaf/Angptl4, a circulating lipoprotein lipase inhibitor(Reference Backhed, Manchester and Semenkovich4, Reference Backhed, Ding and Wang22). To find out whether the differential effects of the two HFD are mediated by changes in intestinal Fiaf/Angptl4, we measured the corresponding mRNA concentrations in GF and CV mice after 4 weeks on LFD, HFD and WD, respectively (Fig. 3(a) and (b)). In all the diet groups, we observed higher expression of Fiaf/Angptl4 mRNA in the mucosa of the distal small intestine of GF mice than of CV mice. As Fiaf/Angptl4 is a secreted protein, we also determined its plasma concentrations (Fig. 3(c)). Contrary to the increased intestinal mRNA concentrations, GF mice did not show higher concentrations of any of the three Fiaf/Angptl4 forms detectable in murine plasma (native Fiaf/Angptl4, S2 form and S1 form) on any of the diets. CV mice even showed a slightly increased Fiaf/Angptl4 S2 concentration on any of the diets (approximately 2-fold that of GF mice on LFD and 1·3-fold on HFD and WD, P < 0·05). The differences in the Fiaf/Angptl4 S2 concentrations between the diets were modest and NS, neither in GF mice (LFD approximately 0·91 WD approximately 0·81 HFD) nor in CV mice (LFD approximately 0·94 WD approximately 0·84 HFD). Using the same antibody, we failed to detect any Fiaf/Angptl4 in the intestinal mucosa of both GF and CV mice (data not shown). This suggests that the intestinal production of Fiaf/Angptl4 does not contribute significantly to circulating Fiaf/Angptl4 concentrations.
Intestinal fasting-induced adipose factor (Fiaf/angiopoietin-like protein 4 (Angptl4)) mRNA and plasma protein concentrations of mice fed the low-fat or two different high-fat diets for 4 weeks. Quantitative real-time PCR assays of Fiaf/Angptl4 expression in the distal small intestines of germ-free (GF, □) and conventional (CV, ▨) mice from Expt 1 (a, n 7) and Expt 2 (b, n 5). Mean values with their standard errors are plotted. Mean values were significantly different compared with GF mice on the same diet: ** P < 0·01, *** P < 0·001. (b) Western blots of plasma from GF and CV mice fed the low-fat diet (LFD), high-fat diet (HFD) or the Western diet (WD) using anti-mFiaf antibody. The two truncated N-terminal Fiaf/Angptl4 forms, S1 and S2, are visible. Visualisation of the native form needed longer exposure times (not shown). In each lane, 0·4 μl plasma was loaded. AU, arbitrary units.

The faecal microbiota analysed in the CV mice by flow cytometry-coupled FISH at baseline and during the 4-week dietary intervention revealed changes in response to this intervention: the proportion of faecal bacteria detectable with the four selected probes was considerably higher at baseline (SD) (79·7 (sem 5·5) % for group 1 (HFD) and 76·2 (sem 6·6) % for group 2 (WD)) than during the intervention phase when the mice received either one of the two semi-synthetic high-fat diets (HFD: 27·3 (sem 2·6) % or WD: 19·1 (sem 3·6) %). These observations were in accordance with those made in Expt 1 (Table 3), and they suggested that bacteria not detectable with the selected probes had increased at the expense of those targeted by these probes.
Expt 3
To investigate the dietary effects on the gut microbiota in more detail, we performed a third feeding experiment, in which we compared three groups of CV mice (n 5) fed either one of the three diets for four weeks: SD, HFD or WD. Weight gain and body fat content of the mice fed the HFD or the WD were significantly higher than those of the mice fed the SD. In accordance with Expt 2, the body fat content of mice fed the HFD was significantly higher than that of mice fed the WD (Fig. 4). The pooled DNA from colonic contents of each of the three dietary groups was subjected to 16S rRNA gene sequence-based bacterial population analysis. The majority (94 %) of the 16S rRNA gene sequences (approximately 170 per diet) were attributable to Bacteroidetes and Firmicutes (Table 5). Mice on the HFD and WD harboured in addition sequences attributable to Proteobacteria and Deferribacteriaceae, none of which is detectable by any of the four group-specific probes used in the flow cytometric analysis in Expt 1 and 2. The percentage of Bacteroidetes on the HFD (5·4 %) and WD (5·5 %) was approximately threefold lower than that of Bacteroidetes on the SD (15·5 %). The three dietary groups differed substantially in the proportion of sequences belonging to the Erysipelotrichaceae, a family within the phylum Firmicutes, which are also not detectable with any of the group-specific probes used in Expt 1 and 2. On the HFD and the WD, the Erysipelotrichaceae sequences accounted for approximately 55 and 26 %, respectively, of the Firmicutes sequences, but for only 8 % on the SD (Table 5). This is in agreement with a recent study(Reference Turnbaugh, Backhed and Fulton23), which reported the bloom of a single class of the Firmicutes in the mouse intestine in response to adipogenic diets.
Weight gain (a) and body fat (b) of conventional mice fed standard chow diet (SD), high-fat diet (HFD) or Western diet (WD) (n 5) for 4 weeks. * P < 0·05, ** P < 0·01, *** P < 0·001.

Taxonomy-based analysis of 16S rRNA gene sequences of pooled colonic contents of conventional mice fed different diets for 4 weeks
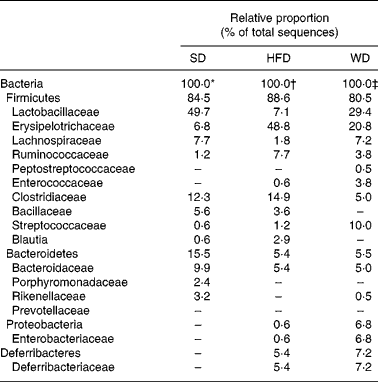
SD, standard chow diet; HFD, high-fat diet; WD, Western diet.
* 164 16S rRNA gene sequences.
† 168 16S rRNA gene sequences.
‡ 173 16S rRNA gene sequences.
The faecal concentrations of acetate, propionate and butyrate were 2·5- to 5-fold lower for mice fed the adipogenic HFD or WD than for mice fed the SD (Table 6). In contrast, Schwiertz et al. (Reference Schwiertz, Taras and Schafer24) observed higher faecal propionate concentrations in overweight and obese human subjects. Our findings do not support the notion that higher SCFA concentrations are responsible for the increased weight and body fat observed in the mice fed the HFD or the WD.
(Mean values with their standard errors)
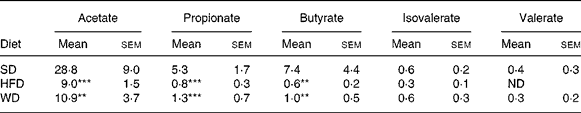
ND, not detected.
Mean values were significantly different in comparison to the SD group: **P < 0·01, ***P < 0·001.
Discussion
Recent reports indicate that the intestinal microbiota plays a role in the development of diet-induced obesity. However, whether and to which extent this influence is modulated by diet is largely unknown. We therefore investigated the influence of various diets on the development of obesity depending on the intestinal microbiota. Our main findings are (1) that the absence of gut microbiota does not provide a general protection from the development of diet-induced obesity in mice; (2) that intestinal production of Fiaf/Angptl4 does not play a crucial role as a mediator of gut microbiota-induced effects on fat storage.
Germ-free mice are not generally protected against diet-induced obesity
Backhed et al. (Reference Backhed, Manchester and Semenkovich4) reported that GF mice fed a WD gained less body fat than CV mice fed the same diet. This was interpreted to mean that GF mice are protected against obesity in spite of being fed a HFD. Using the same diet, we were able to reproduce these results. However, when we fed mice the semi-synthetic HFD with the same overall proportions of macronutrients but composed of different ingredients, we observed that GF mice showed a significant gain of body weight and fat, which was as high as (Expt 2) or even higher (Expt 1) than that observed in the CV mice. Hence, we conclude that GF mice are not generally protected against obesity induced by high fat feeding. Differences in body fat gain observed between GF and CV mice in response to the different diets were not due to differences in food intake and/or diet digestibility. The higher weight gain of GF mice on the HFD was rather due to their lower energy expenditure. On this diet, we observed an 8·3 % lower TEE of GF mice when compared with CV mice for a 23 h observation period. Using shorter measurements (1–2 h), it was reported previously that GF mice show a lower oxygen consumption than their CV counterparts(Reference Backhed, Ding and Wang22, Reference Bruckner-Kardoss and Wostmann25). In line with our observations in GF mice on the LFD and HFD, Wostmann et al. (Reference Wostmann, Bruckner-Kardoss and Pleasants26) showed that the energy expenditure of GF mice greatly depended on the diet used. Unfortunately, we did not measure energy expenditure on the WD, and thus, cannot exclude the possibility that it affected energy expenditure differently compared with the HFD.
High intestinal fasting-induced adipose factor/angiopoietin-like protein 4 gene expression in germ-free mice does not protect from diet-induced obesity
It has been proposed that the intestinal microbiota promotes fat storage of the host by suppressing the intestinal production of Fiaf/Angptl4(Reference Backhed, Manchester and Semenkovich4, Reference Backhed, Ding and Wang22). We analysed whether the differences in fat accumulation which we observed in GF mice on the two HFD are mediated by differences in Fiaf/Angptl4 concentrations. We found higher Fiaf/Angptl4 mRNA concentrations in the mucosa of the distal small intestine of GF mice compared with CV mice, no matter whether they were fed the HFD or the WD. This argues against an involvement of this factor in the differential effects of these diets. Here, we have shown that increased intestinal Fiaf/Angptl4 mRNA expression was not reflected by increased plasma protein concentrations, nor could we detect Fiaf/Angptl4 in intestinal mucosa. These findings suggest that the intestinal mucosa is not a main contributor to circulating Fiaf/Angptl4 concentrations. This also argues against a role of the intestinal Fiaf/Angptl4 as an inhibitor of lipoprotein lipase in peripheral tissues of GF mice. Besides its role in lipid metabolism, Fiaf/Angptl4 is a key player in angiogenesis, exhibiting pro- and anti-angiogenic activities(Reference Le Jan, Amy and Cazes27, Reference Cazes, Galaup and Chomel28). Since intestinal bacteria modulate the density of the capillary network in the intestine(Reference Stappenbeck, Hooper and Gordon29), it may be speculated that intestinal Fiaf/Angptl4 is involved in this process. In any case, the high intestinal Fiaf/Angptl4 gene expression in GF mice deserves further investigation.
Alterations in the gut microbial community in response to dietary changes
The proportion of intestinal bacteria detectable with the four group-specific probes used in our study decreased within 4 weeks after switching the mice from SD to any of the semi-synthetic diets (HFD, LFD and WD), especially in mice receiving the high-fat diets (HFD and WD). This suggests that bacteria not detectable with these probes proliferated in response to the diet switch. This is in accordance with a recent study which reported a reduction in the Cytophaga–Flavobacterium–Bacteroides phylum and in the E. rectale–C. coccoides cluster in response to HFD(Reference Cani, Neyrinck and Fava30).
Feeding the mice a HFD led to a dramatic reduction in microbial diversity and simultaneously to an increase in one subgroup of the Firmicutes referred to as Mollicutes(Reference Turnbaugh, Backhed and Fulton23). Our sequencing data revealed a three- and sevenfold higher proportion of Erysipelotrichaceae in mice fed the WD and the HFD, respectively, compared with mice fed the SD (Table 5). Our re-analysis of the 16S rRNA sequences provided by Turnbaugh et al. (Reference Turnbaugh, Backhed and Fulton23) revealed that the majority of sequences referred to as Mollicutes belong to the Erysipelotrichaceae. The exact role of this bacterial group in host energy metabolism is still obscure, and deserves further research.
Differential effects of different high-fat diets on obesity development in germ-free mice
By comparing two semi-synthetic diets, HFD and WD, we demonstrated that mice respond differently to the two diets despite their almost identical overall macronutrient ratio. WD and HFD differ in the types and sources of fats and carbohydrates. For example, the WD contains considerably more sucrose than the HFD (Table 1). The difference in the sucrose content of HFD and WD could be of importance. Gazzinelli et al. (Reference Gazzinelli, Silva and Moraes-Santos31) observed that CV mice fed high-sucrose diets were heavier and had a higher carcass fat content than their GF counterparts, suggesting that the sucrose content of the diet had a greater lipogenic effect on CV mice than on GF mice. They proposed that reducing the activities of the rate-controlling enzymes of the hexose monophosphate shunt leads to a decreased production of NADPH, which in turn diminishes the capacity of the liver to de novo synthesise fatty acids from carbohydrates. We like others(Reference Backhed, Manchester and Semenkovich4) also observed differences in parameters of carbohydrate metabolism, such as a reduced liver glycogen content in GF mice (Table 4). Interestingly, liver TAG levels were elevated only in the livers of CV mice fed the WD. This possibly reflects an improved capability of CV mice to synthesise TAG from the ingested sucrose. On the other hand, the vegetable shortening used in the WD contains approximately 31 % of trans-fatty acids, whereas our HFD does not contain any trans-fatty acids. The consumption of trans-fatty acids has been shown to correlate with insulin resistance and obesity(Reference Riserus32). Recently, it has also been shown that a LFD enriched in trans-fatty acids stimulates intrahepatic lipid accumulation in rats(Reference Dorfman, Laurent and Gounarides33), which fits with the elevated liver TAG levels we observed in CV mice fed the WD. We are not aware of any studies examining the effects of trans-fatty acids in GF mice. Therefore, it remains to be established which of these differences in diet composition are responsible for the different effects of the two different HFD on body weight and body fat development in GF and CV mice.
Our study clearly shows that the effect of the HFD cannot be attributed to the crude fat content alone. Hence, specific dietary components may affect metabolic pathways and the gut microbial composition to a much larger extent than previously assumed.
Acknowledgements
The present study was supported by the Deutsches Institut für Ernährungsforschung. The authors thank Ines Grüner and Ute Lehmann for excellent technical assistance. S. K. is a member of EU COST action Mitofood (FA0602). M. B., G. L. and S. K. designed the research; C. K. F., M. M. A. E.-B. and N. H. conducted the research; C. K. F., M. B. and N. H. wrote the paper. M. B. and S. K. had primary responsibility for the final content. All authors read and approved the final manuscript. The authors have no conflicts of interest to disclose.


