


1. Introduction
The physical properties of polycrystalline ice are controlled not only by the size and orientation of the constituent grains and impurities within the ice mass, but also by the nature and mobility of the defects and boundaries within and between the grains (Hobbs, Reference Hobbs1974; Goodman et al., Reference Goodman, Frost and Ashby1981; Petrenko and Whitworth, Reference Petrenko and Whitworth1999; Schulson and Duval, Reference Schulson and Duval2009; Cuffey and Paterson, Reference Cuffey and Paterson2010). In glacier ice, defects include high-angle grain boundaries (HAGBs) (intergranular, crystallographically incoherent boundaries separating one crystal from adjacent crystals); subgrain boundaries (SGBs) (intragranular, partially coherent, low-angle boundaries formed from assemblages of dislocations); slip bands (thinly spaced lamellae along which slip has occurred); and incoherent and semi-coherent second phases (e.g. bubbles, air-hydrate clathrates and particulates), among others.
While HAGBs and the presence of multiple second phases are a natural consequence of the depositional processes that create a glacier or ice sheet, microstructures such as subgrains, subgrain domain walls and slip bands develop as post-depositional, in situ, grain-scale responses to applied stresses. Their presence and evolution tell us something about the in situ stress state of the body of ice.
SGBs have become a subject of interest to the ice microstructure community in the last decades. Few references to their occurrence in ice cores are seen in the earlier (pre-1990) ice core literature on physical properties, even though their occurrence is undoubtedly ubiquitous. Their appearance in firn (Kipfstuhl et al., Reference Kipfstuhl, Faria, Azuma, Freitag, Hamann, Kaufmann, Miller, Weiler and Wilhelms2009) and shallow ice (Kipfstuhl et al., Reference Kipfstuhl, Hamann, Lambrecht, Freitag, Faria, Grigoriev and Azuma2006; Faria et al., Reference Faria, Kipfstuhl, Azuma, Freitag, Hamann, Murshed and Kuhs2009; Weikusat et al., Reference Weikusat, Kipfstuhl, Faria, Azuma and Miyamoto2009; Stoll et al., Reference Stoll, Eichler, Härhold, Erhardt, Jensen and Weikusat2021) is among the first indications that the constituent grains of ice that compose an ice sheet are responding to stresses associated with compaction and deformation. In this context, the formation of SGBs by dislocation glide represents one of the mechanisms active in the deformation-and-recovery continuum that permits a continuously deforming body of ice to evolve from a randomly oriented, physically isotropic polycrystalline aggregate in the near-surface environment, to a physically anisotropic, highly oriented polycrystalline aggregate with very different flow properties at depth.
Although the first appearance of SGBs in ice cores has typically been reported deeper than 100 m (e.g. Thorsteinsson et al., Reference Thorsteinsson, Kipfstuhl and Miller1997; Azuma et al., Reference Azuma, Wang, Yoshida, Narita, Hondoh, Shoji and Watanabe2000; Fitzpatrick et al., Reference Fitzpatrick, Voigt, Fegyveresi, Stevens, Spencer, Cole-Dai, Alley, Jardine, Cravens, Wilen, Fudge and McConnell2014), Kipfstuhl et al. (Reference Kipfstuhl, Faria, Azuma, Freitag, Hamann, Kaufmann, Miller, Weiler and Wilhelms2009) document their first appearance in shallow firn at the EPICA Dronning Maud Land core site. Densification stresses usually rise to several bars in firn, the highest stresses typically experienced by ice, and are more than sufficient to cause dislocation multiplication and glide, and the formation of SGBs. Previous studies of the occurrence of SGBs in ice core samples and in laboratory-synthesized samples that have undergone controlled deformation have identified several different categories based on orientation and appearance. As elucidated in Hamann et al. (Reference Hamann, Weikusat, Azuma and Kipfstuhl2007) and Weikusat et al. (Reference Weikusat, Kipfstuhl, Faria, Azuma and Miyamoto2009, Reference Weikusat, Miyamoto, Faria, Kipfstuhl, Azuma and Hondoh2011), these include ‘n’ or ‘normal’ type, the trace of which, either on a free surface or in thin section, appears perpendicular to (0001) (these have also been referred to as ‘c’ or classic type); ‘p’type, the trace of which appears parallel to the basal (0001) plane; a ‘z’ or ‘zigzag’ type composed of segments of p and n type SGBs; and, an ‘indeterminate’ type that occurs in no particular orientation to the (0001) plane.
In a study of natural and laboratory-grown polycrystalline ice-utilizing electron backscatter techniques, Piazolo et al. (Reference Piazolo, Montagnat and Blackford2008) observed that lattice distortions were concentrated mainly at grain boundaries and triple junctions and that these distortions occurred both as continuous intracrystalline distortions attributable to screw or mixed edge and screw dislocations lying in the basal plane and as distinct tilt boundaries and subgrains formed by the basal edge dislocations arranged into low-energy configurations. Piazolo et al. (Reference Piazolo, Montagnat and Blackford2008) also observed lattice distortion of as much as 6° in the vicinity of an air bubble in a sample of Vostok ice, as well as non-equilibrium triple junctions. A later study (Piazolo et al., Reference Piazolo, Borthwick, Griera, Montagnat, Jessell, Lebensohn and Evans2012) utilizing similar analytical methods combined with uniaxial compression experiments confirmed earlier studies (Jia et al., Reference Jia, Baker, Liu and Dudley1996; Mansuy et al., Reference Mansuy, Meyssonnier and Philip2002) indicating that direct stress translation across HAGBs can occur in polycrystalline ice.
Experimental studies (Montagnat et al., Reference Montagnat, Blackford, Piazolo, Arnaud and Lebensohn2011) on the initiation of SGB formation in bubble-free, S2-type polycrystalline columnar laboratory ice at −11°C showed that SGB’s initiate at or near triple junctions and form parallel to the c-axis of the grain in which they occur. These results are in agreement with the earlier studies (Liu et al., Reference Liu, Baker, Yao and Dudley1992, Reference Liu, Baker and Dudley1993, Reference Liu, Baker and Dudley1995; Mansuy et al., Reference Mansuy, Meyssonnier and Philip2002) in which dislocation formation was observed and modeled to be closely related to stress concentrations at grain boundaries and triple junctions in bubble-free polycrystalline ice.
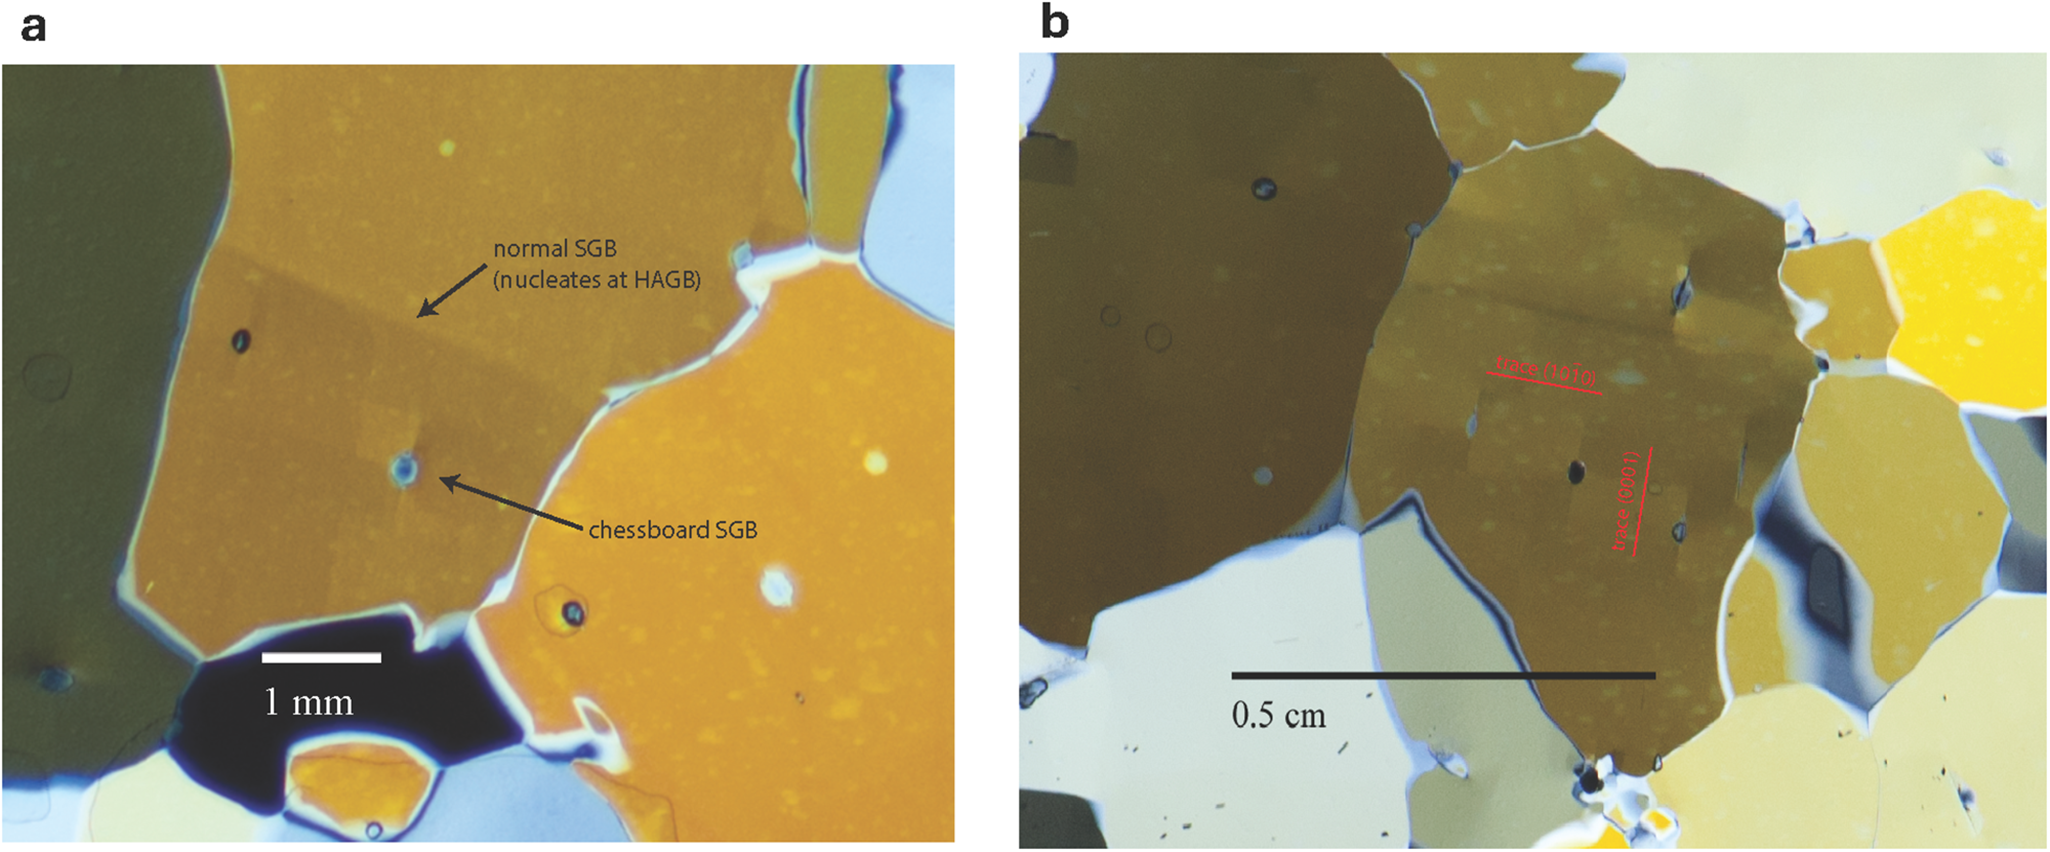
In the course of characterizing the grain sizes and grain-size distributions in the WAIS (West Antarctic Ice Sheet) Divide ice core (Fitzpatrick et al., Reference Fitzpatrick, Voigt, Fegyveresi, Stevens, Spencer, Cole-Dai, Alley, Jardine, Cravens, Wilen, Fudge and McConnell2014), we noted the presence of an interesting subgrain microstructure visible in thin sections under cross-polarized illumination (Figure 1a), which occurs in the large grain-size fraction of the grain population in the brittle-ice zone. This microstructure comprises sets of straight, perpendicular SGBs centered on bubbles that separate alternating subgrain domains that are slightly crystallographically mis-aligned to each other. The traces of these SGBs in thin section are aligned parallel and perpendicular to the c-axis orientation. This texture is visually similar to chessboard microstructure observed in β-quartz, the hexagonal high-temperature polymorph of trigonal α-quartz, commonly found in high-temperature, low-pressure metamorphic terrains (e.g. Kruhl, Reference Kruhl1996; Okudaira et al., Reference Okudaira, Takeshita and Toriumi1998; Blenkinsop, Reference Blenkinsop2000; Morgan and Law, Reference Morgan and Law2004; Passchier and Trouw, Reference Passchier and Trouw2005; Sawakuchi et al., Reference Sawakuchi, Blair, DeWitt, Faleiros, Hyppolito and Guedes2011). As with chessboard texture in β-quartz (Figure 2),the microstructure we observe is most readily visible in grains whose c-crystallographic axes lie close to the plane of the thin section when the grain is close to optical extinction in cross-polarized illumination (Kruhl, Reference Kruhl1996). Subsequent examination of thin sections prepared from the GISP2-D core, the DISC Drill test core (both from central Greenland), Siple Dome A core (SDM-A), and the more recent SPICEcore (both from Antarctica) revealed the presence of the same microstructure to greater and lesser extents in similarly oriented grains (Figures 1b and S-1). In almost all cases, the chessboard domains are spatially associated with a bubble residing within the grain interior, with the bubble frequently occupying the common corner of four squares of the chessboard. In most instances, the domain boundaries that intersect at the bubble disappear before reaching the HAGBs at the edges of the grain containing the bubbles.
Chessboard domains in ice from WAIS divide and DISC drill test ice cores. RGB images of ∼300 micron thick, vertical thin sections photographed in cross-polarized illumination. Stratigraphic up is up in these photos (and all others). (a) An example of conventional grain-traversing subgrain boundary and orthogonal chessboard subgrain boundaries in a sample from 561 m depth in the WAIS divide ice core. This sample was stabilized in the field shortly after drilling and was thinned and photographed approximately 5 months after recovery. Multiple, coherent domains are separated by straight subgrain domain walls whose traces are parallel and perpendicular to the trace of the (0001) basal plane can be seen around the bubble. Bubble is slightly flattened in the basal plane. (B) thin section image of a chessboarded grain in the DISC drill test core, ∼600 m. The boundaries (trace directions indicated in red) cross at the bubble and are not connected to the high-angle grain boundaries in this instance.
Chessboard-patterned subgrain domain development in high-temperature metamorphosed quartz. great Zimbabwe, Zimbabwe. Vertical domain boundaries are on prismatic planes, horizontal domain boundaries lie on basal planes. Horizontal dimension of the photomicrograph is ∼1 mm. (BLENKINSOP, Reference Blenkinsop2000, figure. 4.10; reprinted with the permission of Kluwer Academic Publishers).

Only bubbles situated in grain interiors (not on HAGBs) were observed to be associated with chessboard domains and a small percentage of chessboard-textured grains contained no visible bubbles. Relaxation microcracks were commonly, but not always, observed emanating from bubbles along the (0001) planes and followed the trace (0001) chessboard boundaries; however not all bubbles with relaxation microcracks displayed chessboard subgrains, even if the enclosing grain was in a favorable orientation for them to be visible (θ > 85°).
In one instance of a grain containing both chessboard boundaries and (0001) slip traces, the chessboard boundaries appeared to be offset by the slip bands.
In this paper, we characterize both conventional subgrain boundaries (henceforth SGBs) and chessboard subgrain boundaries (henceforth chSGB) observed in three samples of the WAIS Divide ice core from nominal depths of 805 m, 1125 m and 1325 m. To accomplish this, we resampled the grain-orientation dataset originally described in Fitzpatrick et al. (Reference Fitzpatrick, Voigt, Fegyveresi, Stevens, Spencer, Cole-Dai, Alley, Jardine, Cravens, Wilen, Fudge and McConnell2014). We first describe the sample preparation and sample characteristics, followed by our analytical methods and conventions. We then evaluate spatial and orientation uncertainties utilizing low-strain grains identified in each of the three selected samples and then characterize both SGBs and chSGBs. We then finish with a discussion of the possible origin and potential significance of the chessboard texture.
2. Methods
2.1. Sample preparation and characteristics
For this study, we selected three samples from a set of vertical thin sections (VTS) prepared from the brittle-ice zone (∼650–1300 m) of the WAIS Divide main core (WDC-06A). The samples were selected from depths where the trend in the mean grain size of the largest 50 grains was relatively stable (805 m), slowly decreasing with increasing depth (1125 m), and rapidly decreasing with increasing depth (1325 m) (Fitzpatrick et al., Reference Fitzpatrick, Voigt, Fegyveresi, Stevens, Spencer, Cole-Dai, Alley, Jardine, Cravens, Wilen, Fudge and McConnell2014). Core sections from the depth vicinity of 1125 m displayed the most brittle behavior of all ice recovered from the WDC-06A borehole and it is also the depth region over which the chessboard texture is most intensely developed. The samples in this study were prepared during the 2010 core processing session at the National Science Foundation Ice Core Facility (Denver, CO, USA) on ice that had been recovered during the 2008–09 austral field season and overwintered on site so as to minimize potential damage to the brittle ice interval during shipping. All samples were prepared, cut, and photographed from 10-cm long vertical samples using the methods described in Fitzpatrick (Reference Fitzpatrick2013) and Fitzpatrick et al. (Reference Fitzpatrick, Voigt, Fegyveresi, Stevens, Spencer, Cole-Dai, Alley, Jardine, Cravens, Wilen, Fudge and McConnell2014). The maximum possible elapsed time between the recovery of this ice and its sample preparation was 20 months. Information on the general setting for these samples is provided in Figure 3. Grain size distributions for these samples are close to being log normal.
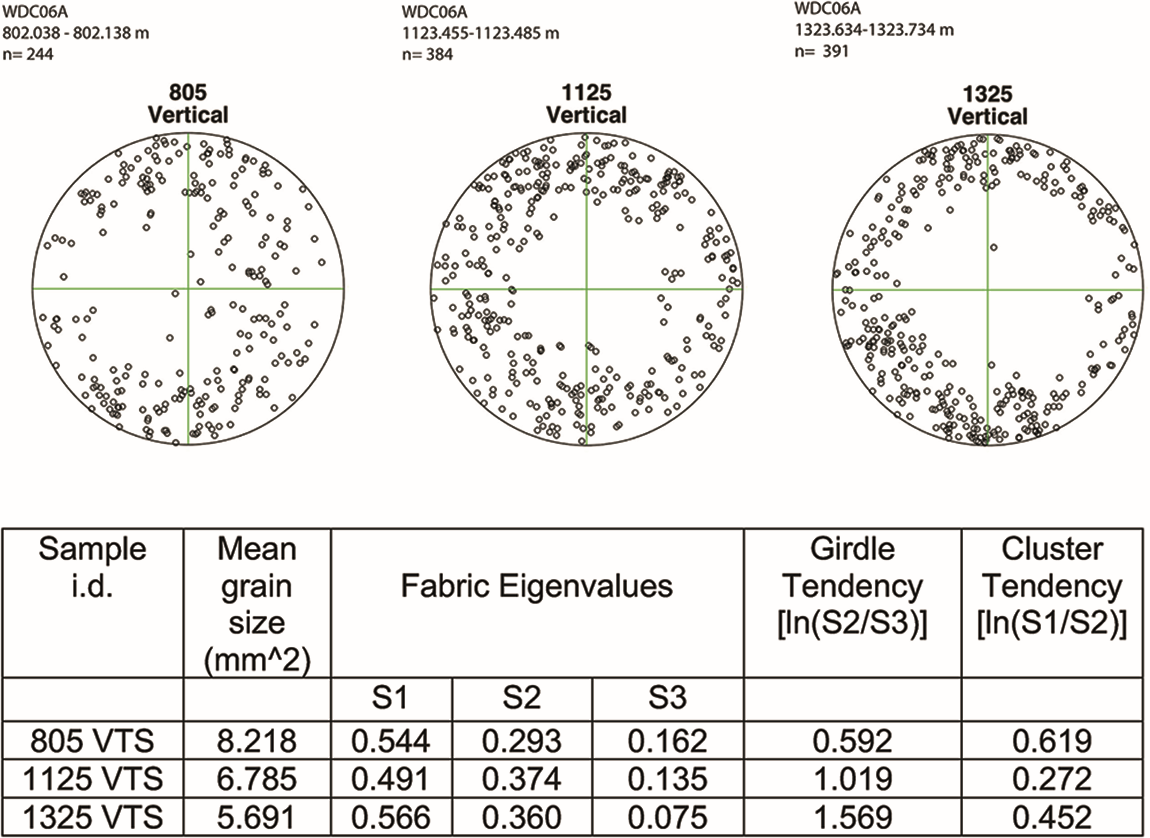
Schmidt projection (equal-area, lower-hemisphere) fabric diagrams of the vertical thin section samples chosen for this study. Over the sample depth range the girdle tendency increases with increasing depth while the cluster tendency remains relatively flat. Samples 1125 and 1325 were cut nearly perpendicular to the ice flow direction (Fitzpatrick et al., Reference Fitzpatrick, Voigt, Fegyveresi, Stevens, Spencer, Cole-Dai, Alley, Jardine, Cravens, Wilen, Fudge and McConnell2014 and this study).
805 VTS
This sample is situated ∼150 m below the start of the brittle ice interval (Neff, Reference Neff2014). Schmidt plots of the original c-axis orientation data for this sample (Figure 3) show a developing girdle fabric at 805 m. The girdle tendency value [ln(S2/S3)] is over 4 times its starting value at 140 m. The thin section was cut ∼27° off the direction of ice flow. The mean grain area at this depth is 8.22 mm2 and the sample is situated below the zone of rapid ‘normal’ grain growth and above the zone of grain-size reduction due to polygonization (Alley et al., Reference Alley, Gow and Meese1995; Fitzpatrick et al., Reference Fitzpatrick, Voigt, Fegyveresi, Stevens, Spencer, Cole-Dai, Alley, Jardine, Cravens, Wilen, Fudge and McConnell2014).
1125 VTS
This sample is situated ∼475 m below the onset of brittle behavior (Neff, Reference Neff2014). Schmidt plots of the original c-axis orientation data (Figure 3) show a continued strengthening of girdle fabric with increasing depth whose tendency value is slightly more than 8 times its value at 140 m. The thin section was cut ∼10° off the primary direction of ice flow. The mean grain area at this depth is 6.79 mm2 and the sample falls within the depth range over which the mean grain size of the population of the largest grains begins to decrease due to polygonization (Alley et al., Reference Alley, Gow and Meese1995; Fitzpatrick et al., Reference Fitzpatrick, Voigt, Fegyveresi, Stevens, Spencer, Cole-Dai, Alley, Jardine, Cravens, Wilen, Fudge and McConnell2014).
1325 VTS
The sample is situated at the bottom of the brittle ice interval at WAIS Divide (Neff, Reference Neff2014). Schmidt plots of the grain orientation data (Figure 3) show a girdle fabric continuing to strengthen with increasing depth. The girdle tendency value is approximately 12 times the initial value at 140 m and the thin section was cut ∼10° off the primary direction of ice flow. The mean grain size at this depth is 5.69 mm2 and the sample falls within the depth range over which the mean grain size of the largest grains is rapidly decreasing due to polygonization (Alley et al., Reference Alley, Gow and Meese1995; Fitzpatrick et al., Reference Fitzpatrick, Voigt, Fegyveresi, Stevens, Spencer, Cole-Dai, Alley, Jardine, Cravens, Wilen, Fudge and McConnell2014).
2.2. Analytical methods and conventions
Grain size and size distributions were acquired using image processing and analysis techniques described in Fitzpatrick (Reference Fitzpatrick2013) and Fitzpatrick et al. (Reference Fitzpatrick, Voigt, Fegyveresi, Stevens, Spencer, Cole-Dai, Alley, Jardine, Cravens, Wilen, Fudge and McConnell2014). c-Axis orientation (LPO) data were collected using the automated c-axis analysis system of Hansen and Wilen, Reference Hansen and Wilen2002. Measurements were carried out on the same samples in two different physical locations—the National Science Foundation Ice Core Facility in Denver for the high-resolution imagery and Pennsylvania State University for the LPO data. The data were blended into single datasets by cross-matching the x- and y-positions of the grains within the reference frame of the sample. Although the optical resolutions of the two data collection systems are different (80 px/mm vs. ∼5 px/mm) it was possible to downscale the high-resolution RGB imagery for the cross-matching between the two systems.
For the purpose of this study, fabric datasets were resampled at a single-pixel level. A discussion of how the data resampling was conducted and the potential sources of error associated with the resampling is given in Supplementary Material S-1.
The geometry of all SGBs and chSGBs was investigated using several indicators including the geometry of the boundaries, the amplitude of the orientation change across the boundaries, and the step-wise incremental change in orientation as the boundary was crossed along a single pixel row or column. The geometry was investigated by inspection of the RGB images and the extinction contrast in several orientations. The orientation change was calculated by segregating the pixel-level orientation data into the subgrain domains in which they resided, and the incremental misorientation was determined by calculating the misorientation between each pixel in a boundary-crossing single pixel row or column and the first pixel in that row or column.
It is to be noted that, as with any optical technique, the automated fabric analysis determines the orientation of only the c-axes for grains. In our convention, the zero point for θ (the polar angle) is defined as the direction perpendicular to the plane of the thin section and increases to 90° as the plane of the thin section is approached. The zero point for  $\varphi$ (the azimuthal angle) is defined as the east point of the image and increases anti-clockwise.
2.3. Characterization of uncertainties
Two types of uncertainties exist in the data: angular uncertainties in the c-axis orientation originating from the potential sources of error discussed in S-1 and spatial/positional uncertainties associated with downscaling the RGB imagery to the fabric-analysis system imagery.
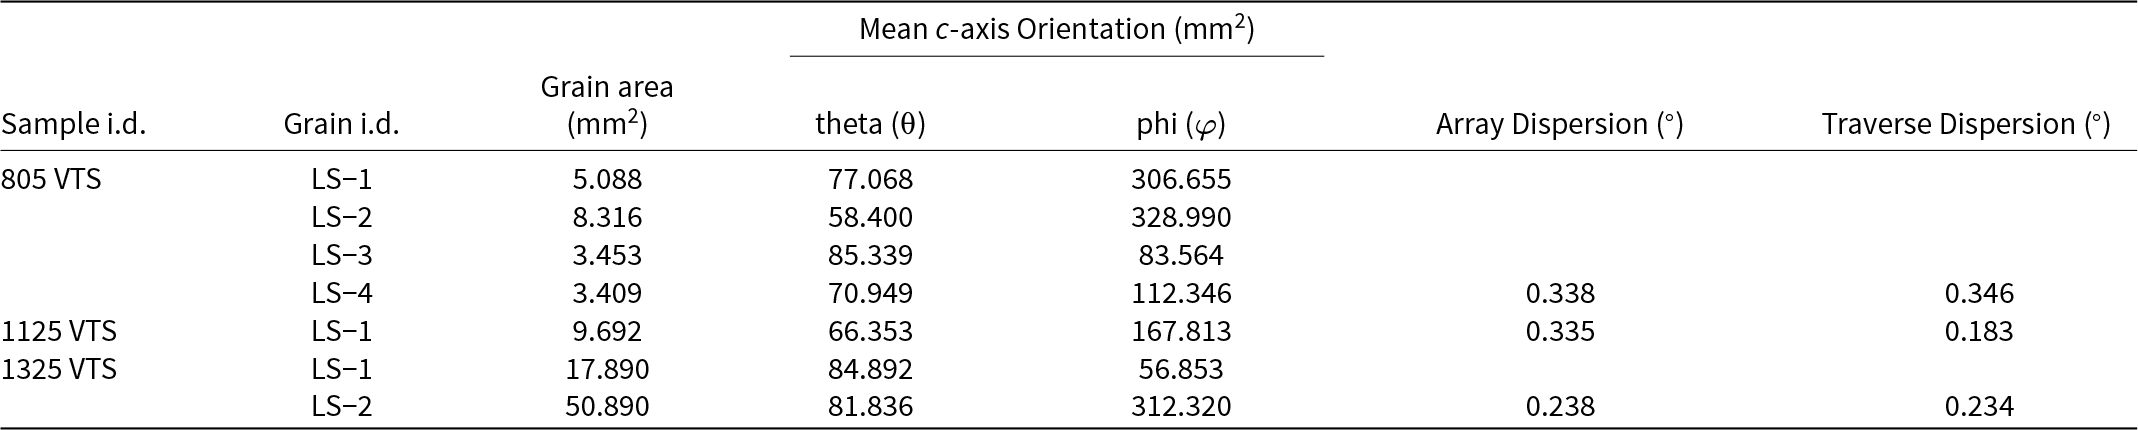
The angular uncertainty was estimated by calculating the intragrain variability of the c-axis orientations (dispersion) at each resampled pixel in arrays and rows of single pixels inside grains exhibiting no evidence of strain (henceforth referred to as ‘low-strain grains’ and designated LS-n). The selection of these grains was based on (1) the absence of intragranular bubbles, (2) the absence of detectable SGBs or slip traces, and (3) featureless optical extinction behavior. Additional detail is provided in S-2 and the grain size, orientation, and dispersion information for all low-strain grains is given in Table 1. An example of this analysis for a low-strain grain in sample 1125 VTS is shown in Figure 4. Additional analyses for grains in samples 805 VTS and1325 VTS are shown in Figs. S-2 and S-3. Results are shown in Table 1. For all grains examined in this study, the angular uncertainty was set to the array dispersion for the low-strain grains in the same sample.
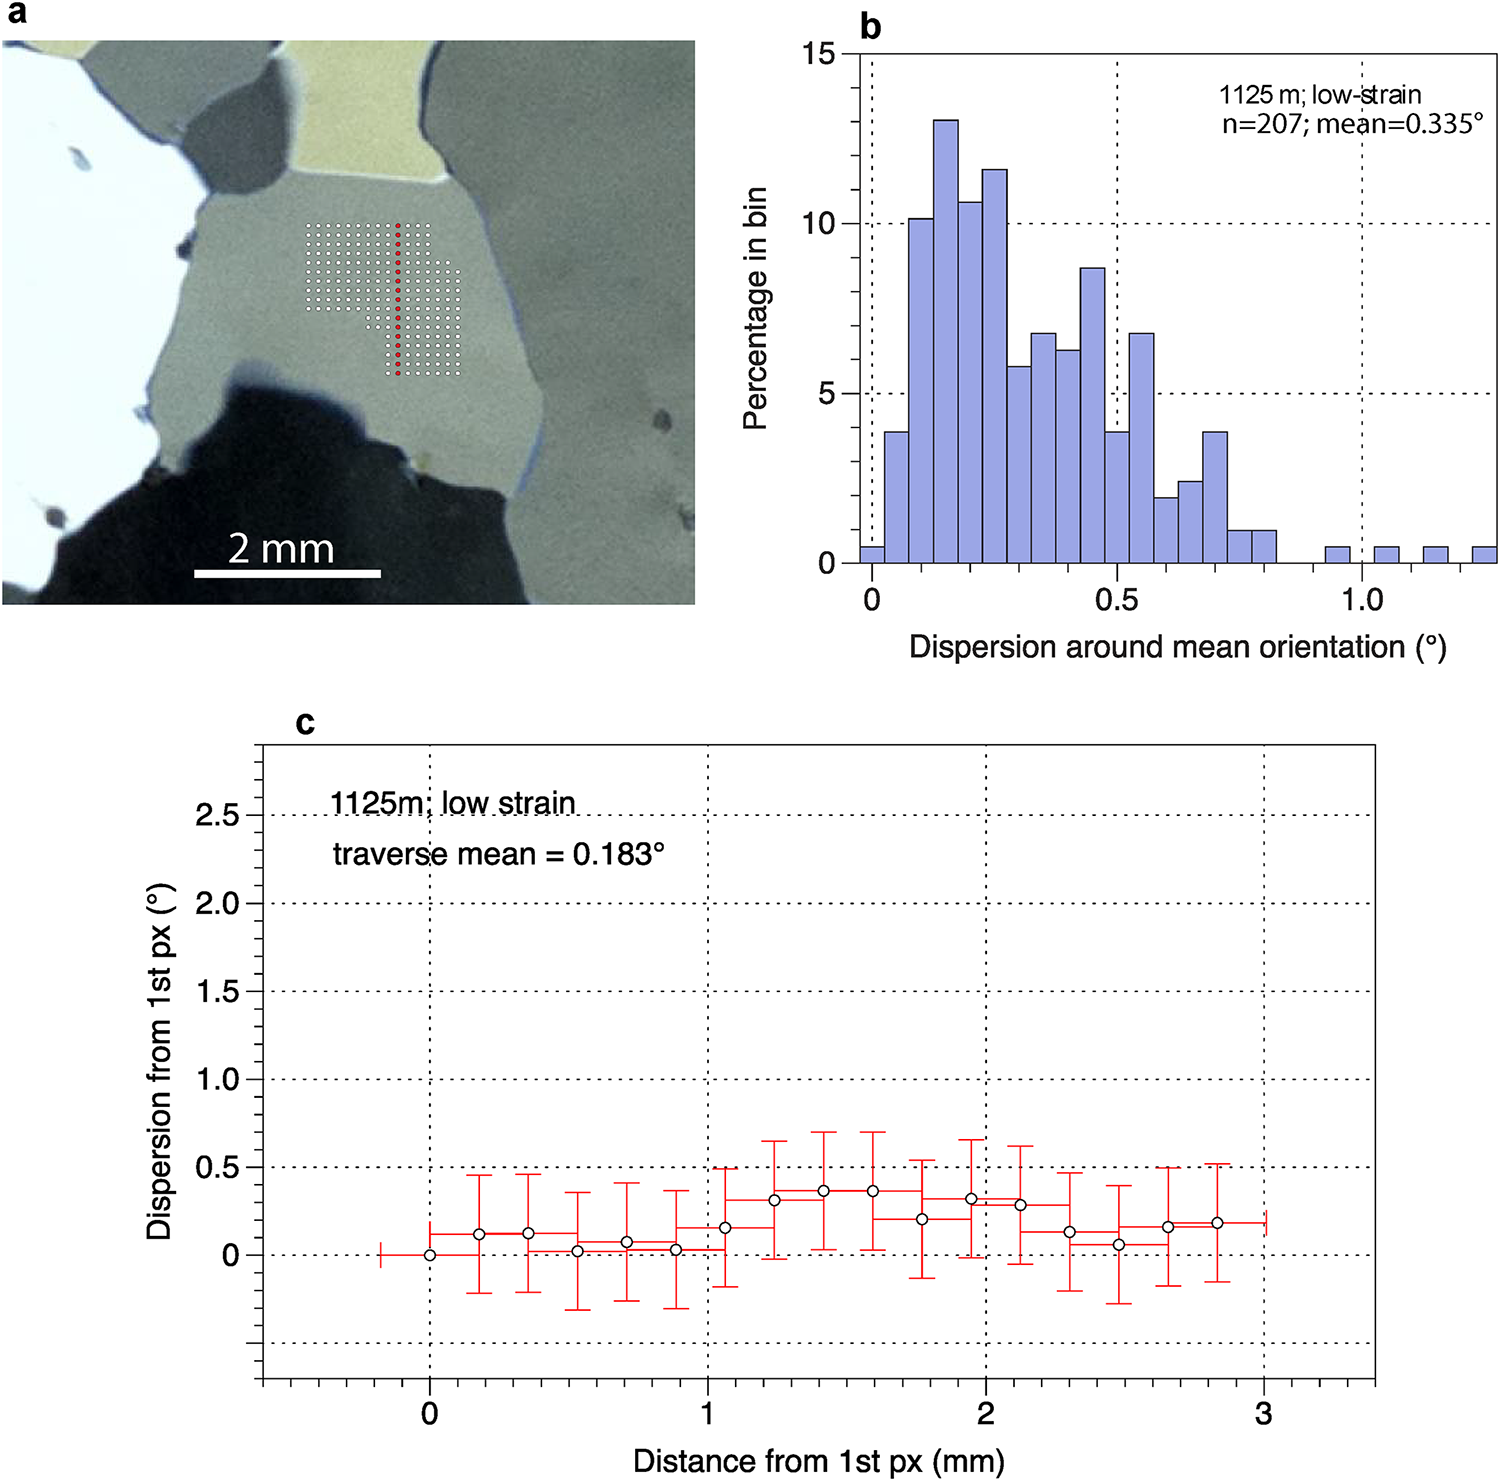
Low-strain grain LS-1 in sample 1125 VTS. Grain characteristics given in Table 1 (a) RGB image of grain in thin section with 207 pixel center locations for orientation analyses overlain (white dots) and location of single column traverse (red dots). (b) The distribution of the dispersions of c-axis orientations around the mean of the grain (θ = 66.35°,  $\varphi$ = 167.81). (c) Single-column traverse across grain (red dots). dispersion values are calculated on the basis of the first pixel (topmost) in the column of analyses. Single-column traverse was run for comparison with similar traverses in grains displaying subgrain boundaries.
Grain size, orientations, and dispersion values for low-strain grains analyzed in this study. Array dispersion values for 805 VTS and 1325 VTS were averaged over multiple grains (see Figs. S-2 and S-3)
The spatial/positional uncertainty was estimated by testing the registration between the position of HAGBs in the RGB image of low-strain grains with the step in the co-registered fabric data for each sample. We assumed that any mis-correspondence between the mapping of the fabric data onto the RGB image would be immediately apparent because the spatial location of the grain boundary would fail to coincide with the step in the orientation data. Further, we assumed that any apparent ramping of the orientation in the fabric data as the HAGB was approached would be due to a combination of the signal spillage from the orientation measurements taken with the stage in ξ = 45° position (see S-1), any error in the mapping function, a grain boundary with a shallow angle to the plane of the sample and/or a true change in crystallographic orientation due to strain as the HAGB was approached. For all grains examined in this study, the positional uncertainty was set to the maximum signal spillage incurred due to measurements acquired in the ξ = 45° stage position for the given sample thickness. We defined a stable orientation signal as being achieved when the difference in orientation between adjacent pixels was less than the uncertainty in the orientation measurement. The results of six traverses, examples of which are shown in Figure 5, indicate that the spatial registry of the grain boundary is within 1-pixel of the fabric data. Ramping of the orientation is observed and typically falls within ± 2 pixels (400 μm) or less, of the HAGB. This is approximately twice the anticipated value from the ξ = 45° signal spillage alone for the given sample thickness and so indicates that the contributions from the other sources are small. The observed misorientations associated with chSGBs and SGBs are generally large compared to the uncertainties in both the spatial positioning and orientation dispersion measurement. Hence, useful results can be obtained with our observational system.
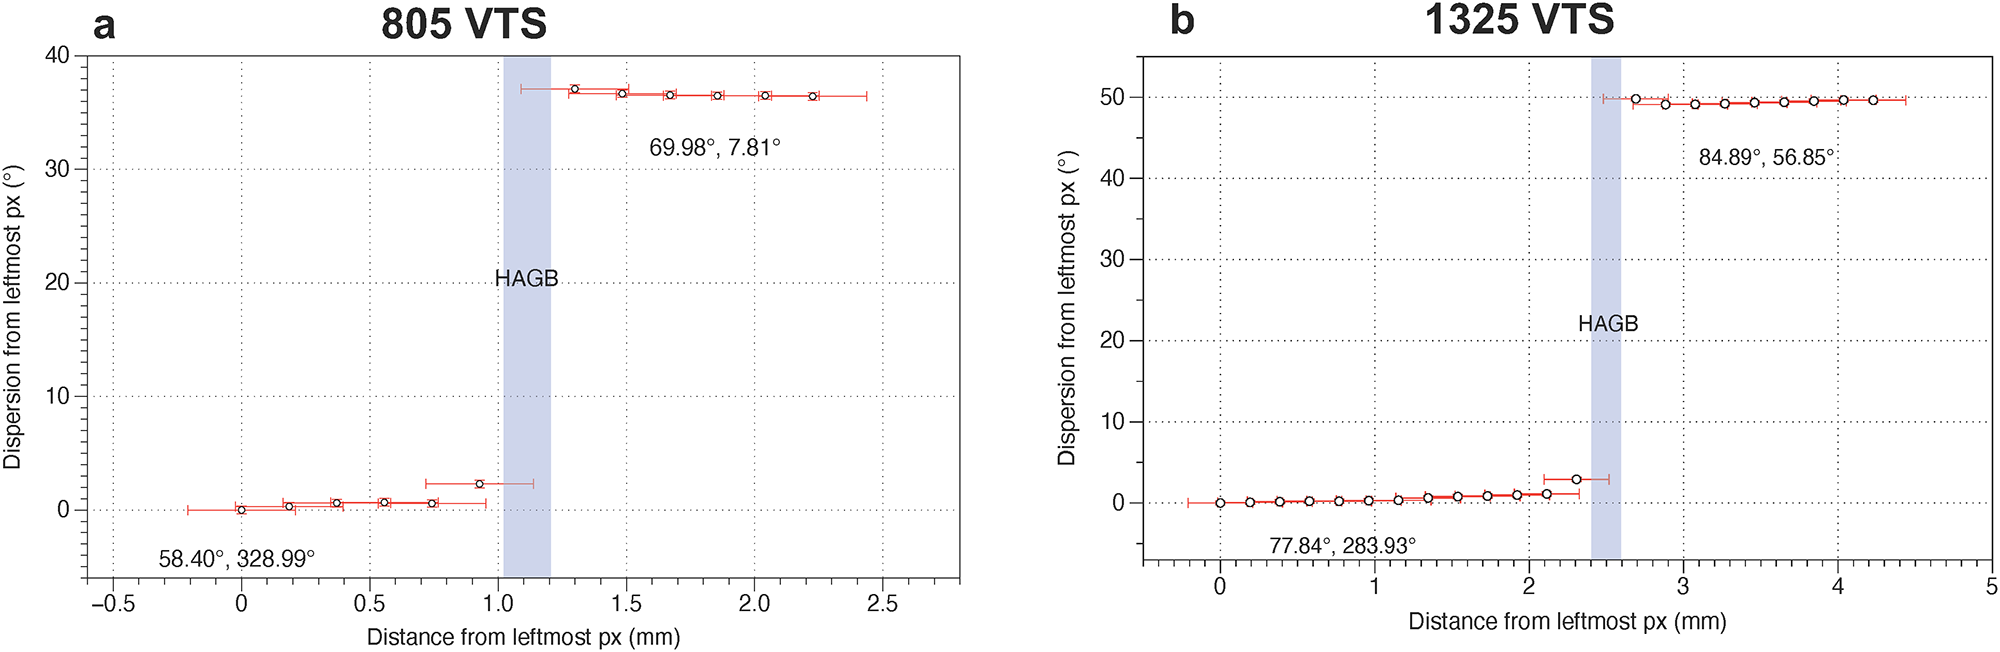
Examples of single-pixel traverses across HAGBs in low-strain grains from samples 805 VTS and 1325 VTS. Mean θ and  $\varphi$ values for grains on either side of the HAGB are shown at the bottom and top of the plot. The c-axis orientation of the pixel containing the grain boundary is undefined. (a) Sample 805 VTS; orientation ramp approaching the HAGB from the left is 2 px (0.370 mm) wide. The slight orientation change approaching the HAGB from the right is within the uncertainty of the measurement. The change in orientation across the HAGB is 36.6°. (b) Sample 1325 VTS; orientation ramp approaching the HAGB is also 2px (0.380 mm) wide and is symmetric. The change in orientation across the HAGB is 22.8°.
3. Characterization of SGBs
General
SGBs were first detected in the sample from 200 m depth, and are commonly observed below 500 m, where they are concentrated in the large grain size fraction. It is likely that they were also present at depths shallower than 200 m (see, for instance, Kipfstuhl et al., Reference Kipfstuhl, Faria, Azuma, Freitag, Hamann, Kaufmann, Miller, Weiler and Wilhelms2009; Stoll et al., Reference Stoll, Eichler, Härhold, Erhardt, Jensen and Weikusat2021), but were not detected by the methods used in this study. SGBs most often crossed the entire grain in which they were observed and usually terminated at an irregularity or change in curvature at a HAGB.
chSGBs were first detected unambiguously in the sample from 561 m depth at WAIS Divide (Figure 1a) and became increasingly common with increasing depth. At a depth of ∼1100 m this microstructure was observed in the majority of large grains whose c-axes lay close to the plane of the thin section. As clathrates began to dominate over bubbles below 1250 m, the chessboard pattern was less frequently observed, and below 1400 m it was no longer observed. Similar to the chSGBs commonly seen in β-quartz (Figure 2), the chessboard domain boundary traces in ice appear parallel and perpendicular to the trace of the (0001) plane suggesting that they may occur on the basal (0001) and prismatic { $10\bar 10$} crystallographic planes (types ‘p’ and ‘n’ of Hamann et al., Reference Hamann, Weikusat, Azuma and Kipfstuhl2007). chSGBs whose traces are normal to (0001) are typically much longer than those whose traces are parallel to it, and they sometimes extend to the HAGB at the host grains edge or terminate in a chessboard boundary associated with another nearby bubble. Boundaries parallel to the trace of (0001) are rarely observed to extend to a HAGB. The chessboard domain boundaries are almost always centered on a bubble.
Characterization of SGBs
Analysis of a SGB in a grain in sample 805 VTS is given here. Additional analyses for SGBs in sample 1325 VTS are shown in Supplemental Material Fig. S-4.
A 141-px region in a grain in sample 805 VTS crosses a well-developed (0001)-normal SGB trace (Figure 6a). The full array yields a mean dispersion value of 1.627° (Figure 6b), which is over four times larger than the mean orientation dispersion calculated on low-strain grains in the same sample. Calculation of the dispersion values within each individual subgrain domain (Figure 6c) shows that the mean dispersions within the individual subgrain domains are as low as those of the low-strain grains in the same sample (Table 1).
Sample 805 VTS, conventional subgrain domains. (a) RGB image of conventional subgrain domains and subgrain boundary in a grain in sample 805 VTS. Locations of 141 pixel centers used for orientation calculations are shown in the overlay of white dots. Red dots indicate pixel positions of traverse in 6d. Mean grain orientation is θ = 82.74°;  $\varphi$ = 158.65°. (b) Distribution of orientation dispersions around the mean of all 141 observations. (c) Within-domain orientation distributions. (d) Single-pixel orientation traverse across the SGB. The dispersion values are calculated from the orientation value of the bottommost pixel.
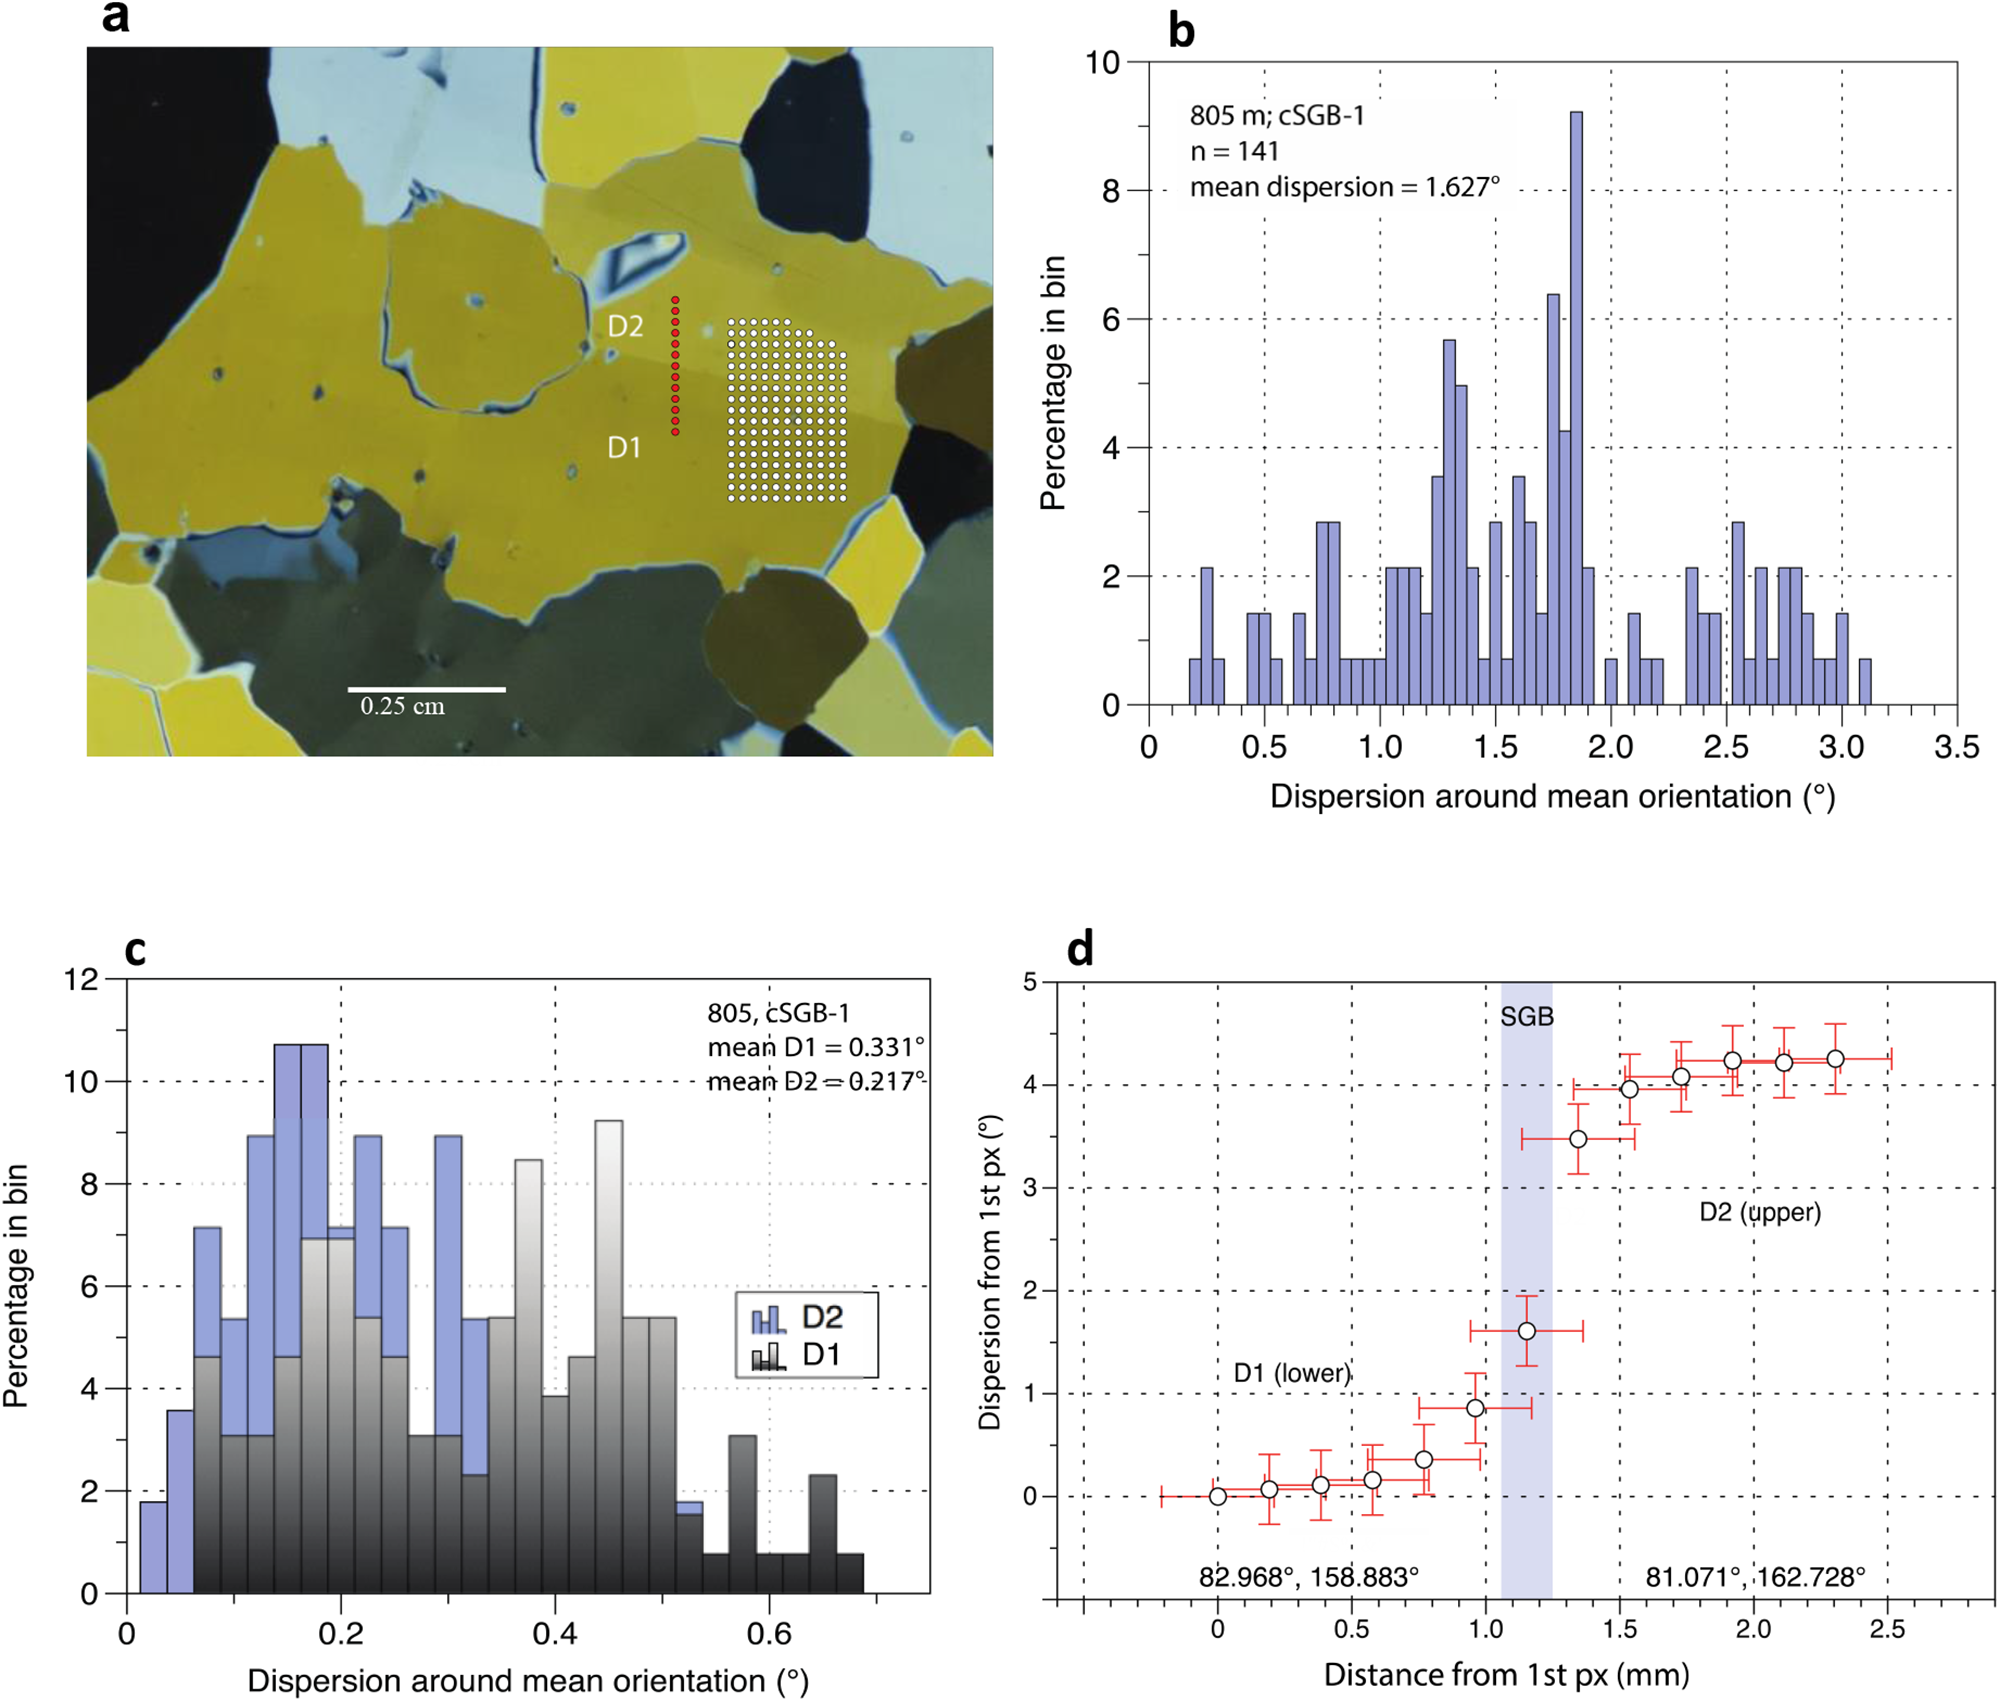
A transect across the SGB in this grain (Figure 6d) shows the same extent of ramping observed across HAGB in the same sample, showing that both grain boundaries and SGBs are quite narrow and are registered and sampled accurately in our analyses. The orientation change across the SGB separating the lower domain (D1) from the upper subgrain domain (D2) is 4.25° and is accomplished with a 1.9° rotation in θ accompanied by a 3.9° rotation in  $\varphi$. Rotation of the c-axis orientation of the D1 domain into the plane of the thin section (i.e. θ = 90°) via stereographic projection indicates that the data for this SGB are consistent with it being an ‘n’-type tilt boundary consisting of basal plane edge dislocations.
Similar analyses on SGBs observed in grains from sample 1325 (Fig. S-4) yield a mean orientation dispersion value of 1.32° calculated from an array of 196 single-pixel evaluations. This value is over five times the mean dispersion value calculated on low-strain grains in the same sample due to the orientation changes across the SGBs. As with the previous sample, the changes in c-axis orientation as these SGBs are crossed are consistent with n-type tilt boundaries.
In summary, the values of dispersions around the mean orientation for the grains containing these SGBs were usually several times larger than the orientation dispersions observed in the low-strain grains from the same sample due to the magnitude of the orientation change across the SGBs. Restricting the population of sampled pixels to within-domain subsets and recalculating the orientation dispersions on the mean of the domain-restricted subset of values generally yielded dispersion values similar to those observed in the low-strain grains in the same samples. The observed range of misorientations across SGBs is 0.79–4.25°. Misorientation data indicate that the largest orientation changes are localized at the SGB. Incremental orientation changes as the SGBs are approached are similar to those observed at HAGBs, but generally lie within the uncertainty of the measurements. Lastly, the instances examined are consistent with characterization of these SGBs as tilt boundaries parallel to the c-axis consisting of basal plane edge dislocations.
Characterization of chSGBs
Analysis of a chSGB in a grain in sample 1125 VTS is given here. Additional analyses for this sample and for chSGBs in other samples are provided in Supplementary Material S-3 and Fig. S-5 through S-9. Table 2 details the size and orientations of each grain analyzed.
Grain identifiers, sizes and c-axis orientations for chessboard-textured grains examined in this study

3.3. Sample 1125 VTS
Single-pixel c-axis orientation analyses were carried out on two grains in this sample, each of which contain chessboard domains. The full analysis for grain CH-1 in sample 1125 VTS is given here.
Chessboard grain 1125 VTS CH-1
Grain size and orientation data are shown in Table 2. The c-axis of this grain lies almost exactly in the plane of the thin section. A 237-px region acround a bubble at the center of the multiple-domain grain was examined in detail (Figure 7a). The trace (0001)-normal chSGB that appears to originate at the bubble extends upward, terminating at the HAGB. The trace (0001) chSGBs appear to terminate within the grain, extending only a short distance (<0.5 mm) from the bubble. HAGBs above and below the bubble appear to lie at or close to the trace of (0001).
Chessboard grain CH-1 in sample 1125 VTS. (a) RGB thin section image (left) and overlay (right) of 237 pixel-center locations used for orientation analyses. Black dots are pixel-center locations for the (0001) trace chSGB-crossing traverse; red dots are pixel-center locations for the (0001)-normal chSGB trace crossing traverse. (b) Histogram of the distribution of orientation dispersions around the mean orientation for the entire dataset. (c) Histogram of the distribution of orientation dispersions from the within-domain means. (d) Single-pixel traverses across chSGBs traces both parallel (left) and perpendicular (right) to the trace of the (0001) crystallographic plane.
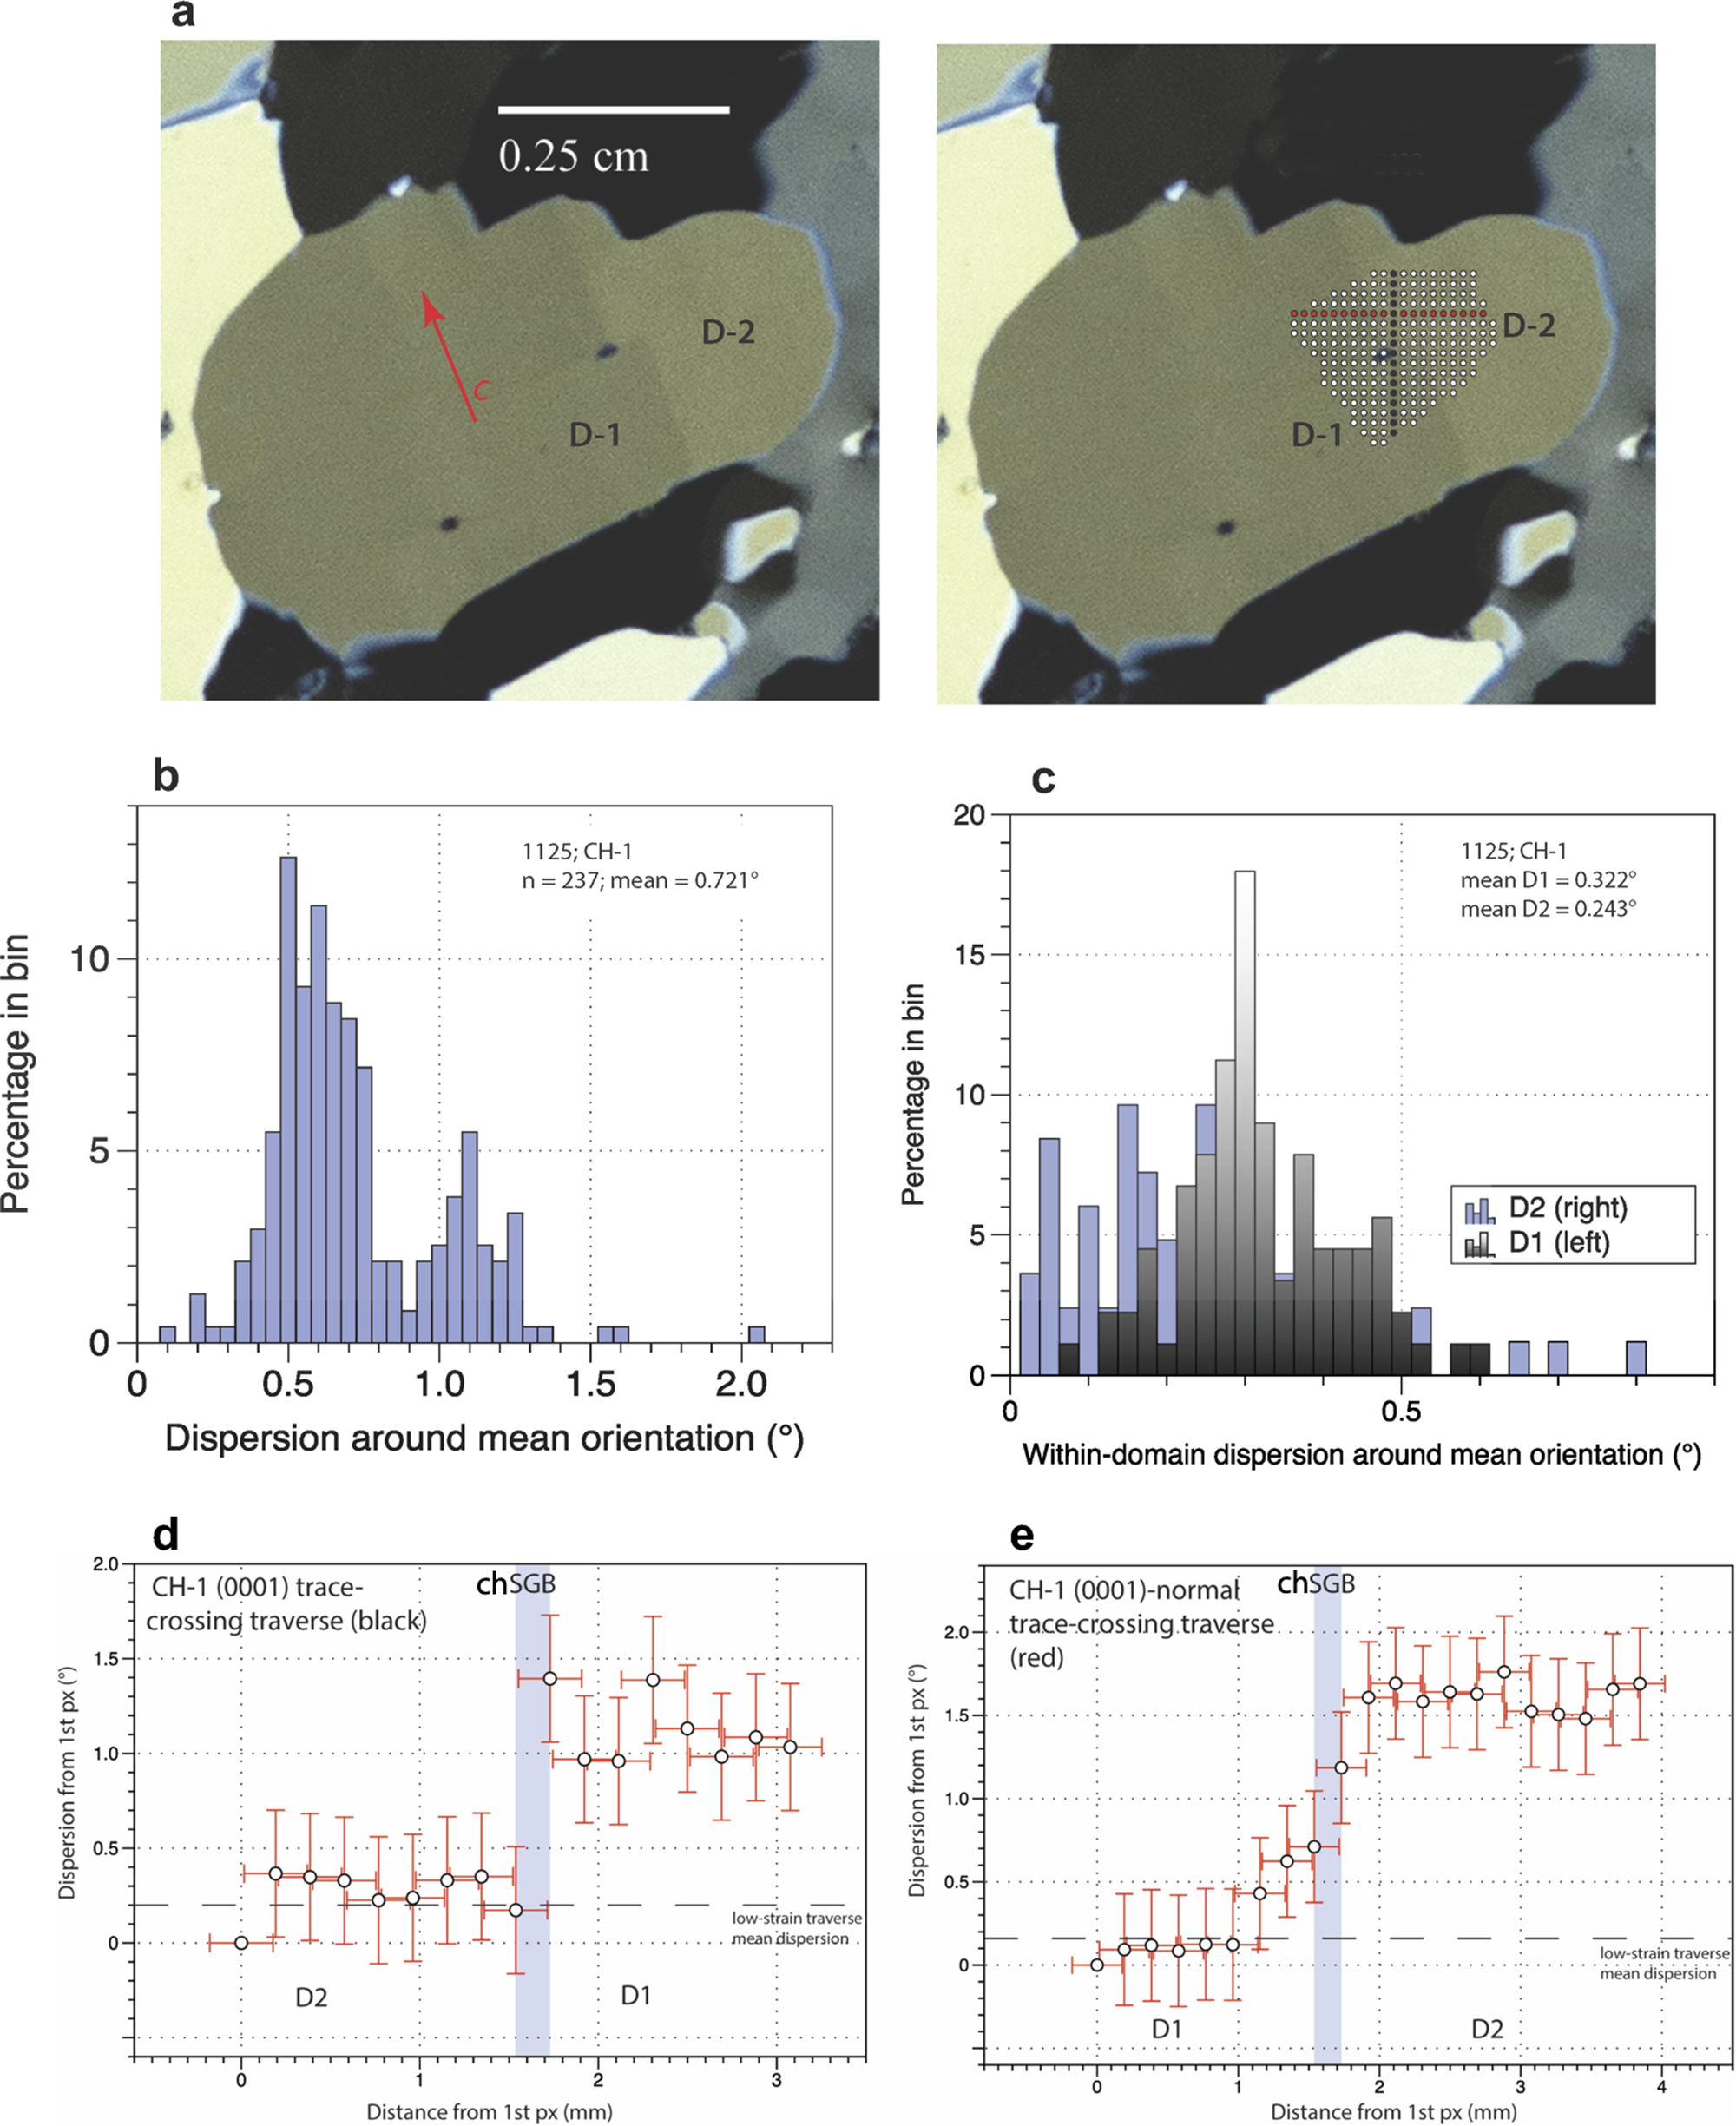
The mean of the distribution of single-pixel orientation dispersions around the bubble is 0.721° (Figure 7b), slightly over twice that of the value observed in low-strain grains in the same sample and, as observed in the grains from sample 805 VTS, the within-domain dispersion means (0.322° and 0.243°) are comparable to the observed dispersion means for the low-strain grains in the same sample (Figure 4b, Figure 7c and Table 1).
The single-pixel traverse crossing the trace (0001) chSGB displays no ramping as the boundary is crossed whereas the trace (0001)-normal chSGB exhibits a 1–2 px ramp (Figure 7d and 7e). The orientation change across the trace (0001) boundary is 0.69° and is due to small rotations in both θ and ϕ. The orientation change across the trace (0001)-normal boundary is 1.09° and the dominant control in this instance is a 1.4° rotation in  $\varphi$ with no change in θ, suggesting that this is a tilt boundary. Misorientation values lie within the range of misorientations observed across SGBs and are larger than the mean misorientation observed in the low-strain traverse in the same sample.
3.4. Summary of results
Data on all grains are summarized in Table 3. When taken in conjunction with observations on the high-resolution imagery, we draw the following conclusions from the data:
Data summary.
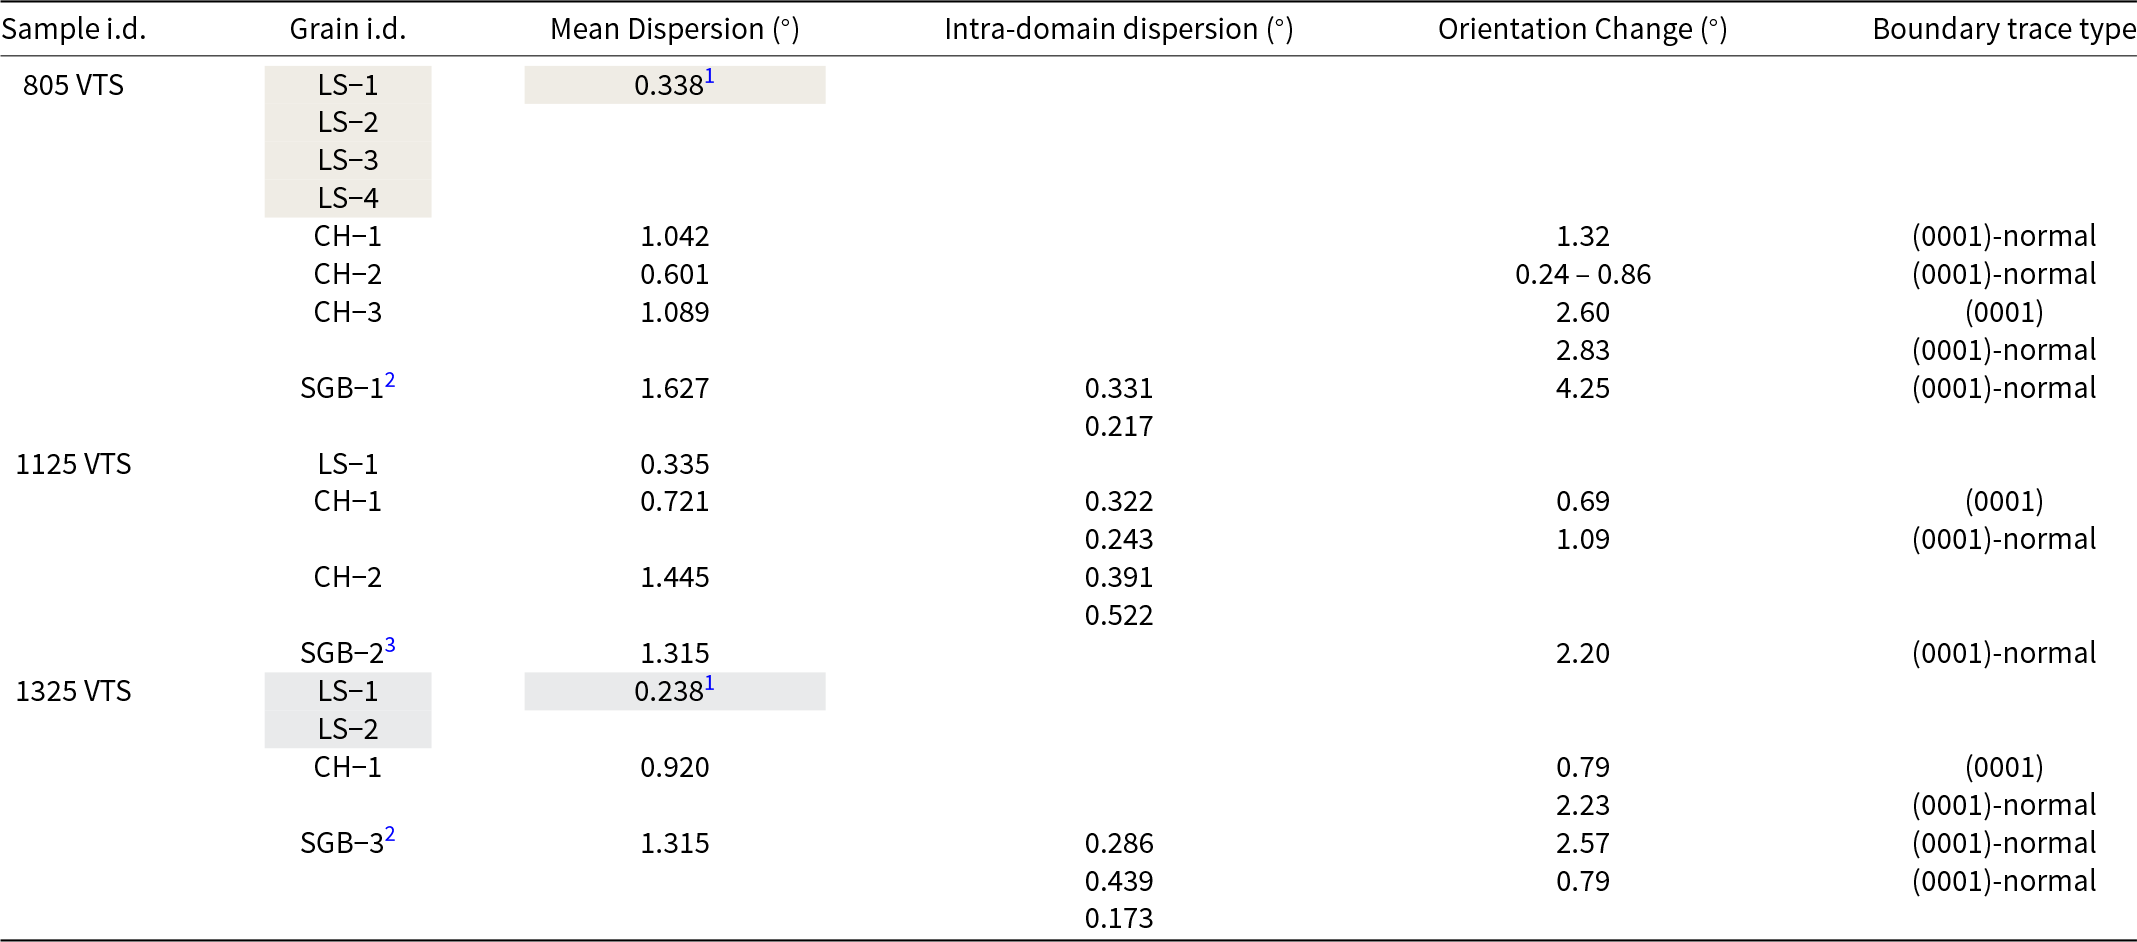
1 Fill indicates points from multiple grains were averaged
2 Conventional SGBs
3 This SGB located in chessboard grain CH-2; sample 1125 VTS (see Fig. S-8)
(1) Mean orientation dispersion values observed for grains containing either SGBs or chSGBs are higher than mean orientation dispersion values for low-strain grains in the same samples.
(2) Mean orientation dispersion values observed in chessboard-textured grains are generally smaller than in grains in the same sample containing only SGBs.
(3) Both SGBs and chSGBs sometimes occur in the same grain. In these instances, the orientation change across the SGB is usually larger than the orientation changes across the chSGBs.
(4) In grains where orientation dispersions can be segregated into discrete populations on either side of a SGB or chSGB, the dispersion values for these populations are comparable to those of the low-strain grains in the same sample suggesting that, in such cases, strain is localized at the boundary.
(5) The orientation change crossing the trace (0001)-normal chSGB is always observed to be larger than the orientation change crossing the trace (0001) chSGB on the same bubble.
(6) For chessboard-textured grains whose c-axis orientation lies close to the plane of the section (θ > 80°), the orientation change across SGBs generally required a distance of 0–2 pixels (<0.36 mm) to stabilize into the new orientation on either side of the boundary. This is approximately twice the distance anticipated when the geometry of the orientation measurement is taken into account. The ramping effect is largest for grains whose c-axes do not lie close to the plane of the thin section (θ < 80°), suggesting that it occurs as a consequence of the interaction between the full grain orientation (including the a-axis), the inclination of the SGB to the plane of the sample, and the optics of the fabric analysis system.
Discussion
Potential for chessboard subgrain boundaries as artifacts
We considered the possibility that dislocations forming the chSGBs may have been introduced during sample preparation. Primary concerns in the sample preparation process include stresses induced during microtoming and the potential effect of curing stresses in the adhesive bond between the ice and its glass plate substrate. In order to investigate these possibilities, samples were prepared with and without adhesive and were thinned and photographed at several different thicknesses (0.25–1 mm). In all cases, the chessboard microstructure was observed to varying, uncorrelated extents. If sample preparation methods were responsible for the chessboard microstructure, then one would anticipate that it would be generated at all depths in bubbly ice to a similar extent above the onset of enclathratization. This is not the case. In addition, chessboard domains are sometimes observed without a central bubble. The observation of the infrequent chessboard lacking a central bubble argues for the existence of this microstructure in three dimensions prior to sample preparation.
Post-coring relaxation is another possible source of the chessboard domain structure. We examined samples with a wide range of relaxation times (hours to years) and find that the incidence of chessboard domain occurrence is not correlated with post-coring relaxation time, but that it is correlated with the degree of brittle behavior as documented by the core loggers during drilling (Fitzpatrick et al., Reference Fitzpatrick, Voigt, Fegyveresi, Stevens, Spencer, Cole-Dai, Alley, Jardine, Cravens, Wilen, Fudge and McConnell2014). We observe that post-coring relaxation microcracks originating at bubble walls are nearly always present prior to sample preparation in the brittle ice interval, yet the chessboard texture only appears in a subset of grains exhibiting microcracks. This observation is consistent with the chessboard domains being present prior to the opening of the microcracks, which exploit the same (0001) boundary as the (0001) domain wall.
If the observed microstructure occurs in situ, some relationship between the chessboard occurrence and in situ conditions would be anticipated. One might, for example, investigate the c-axis orientations of the grains displaying this microstructure and contrast this population with grains in the same sample that do not display this microstructure. A preliminary investigation indicates that the mean c-axis orientation of the grains showing chessboard subgrains lies closer to the direction of pure shear than the mean of the rest of the grains in the samples investigated. Interactions between the subgrain domain walls and any slip bands should also be investigated to determine precedence/antecedence relationships. In one instance in which a grain containing both chessboards and slip bands was observed, the slip bands appear to displace the boundary. Further investigation of this relationship would clearly be beneficial.
4.2. Hypotheses for origin of chessboard microstructure
Our main purpose here is to document the occurrence of chessboard microstructure, providing sufficient evidence to stimulate further research. We next provide some hypotheses for possible causes and possible importance of this microstructure, to help justify further research. We hypothesize that the structure arises in predictable ways from the evolving ice stress state and lattice preferred orientation, and that the microstructure contributes to brittleness in ice cores, controls on grain size, and perhaps also to enhancement of grain-boundary sliding.
Chessboard microstructure in quartz is generally confined to the high-temperature stability field of β-quartz (aka ‘high quartz’) in which both basal {0001} and prismatic { $10\bar 10$} slip systems are activated. A high-resolution electron backscattering diffraction (EBSD) investigation of the nature of the chessboard domains showed that the chSGB boundaries consisted of {m}[c] edge dislocations on the prism plane and dislocations with < a > Burgers vectors on the basal plane (Wallis et al., Reference Wallis, Parsons and Hansen2019). In contrast, the activation energies of the basal and prismatic slip systems in ice are significantly different primarily due to the low stacking-fault energy associated with the dissociation of the perfect basal glide dislocation ( $\frac{1}{3}$< $11\bar 20$>) into two Shockley partial dislocations. Additionally, the chessboard texture in ice appears to be intimately associated with the presence of an intracrystalline second-phase... bubbles. Determination of the extent to which the chessboard domain texture in β-quartz and in ice may be mechanistically related requires further investigation.
The origin of the chessboard microstructure in ice rather clearly involves the bubbles but may depend on bubbles as dislocation sources or as influences on dislocation motion. These are not mutually exclusive.
Because bubbles support no stress, a shear stress on a basal or prism plane of the enclosing crystal leads to a stress concentration around the bubble that is maximized where those planes cut the bubble in hemispheres, making these locations the most probable sites for dislocation emission. The observation that the chessboard domain boundaries generally align through the center of the bubbles is consistent with this concept and suggests that dislocation generation at bubbles may be important.
The chessboard structure also may arise from the effects of the evolving c-axis orientations on the interactions of bubbles and dislocations. Our data suggest that the chessboard microstructure is especially well-developed in grains with c-axis orientations near vertical. We find this microstructure in the upper half of the ice sheet at WAIS Divide, where vertical compression and lateral extension are important, above the depths where basal shear is rapid. Theory and observations show that, in this stress environment, grains with non-vertical c-axes deform by dislocation glide on their basal planes and minimize overlap with adjacent grains by rotating their c-axes toward the vertical, which reduces the resolved shear stress on the basal planes and thus reduces further deformation (e.g. Alley, Reference Alley1988; Cuffey and Paterson, Reference Cuffey and Paterson2010).
Formation of SGBs is often treated as a recovery process. After driving forces generate and move large numbers of dislocations, those forces may decrease in magnitude below the interaction forces between dislocations. The previously generated dislocations then migrate short distances to form SGBs that minimize strain energy in the crystal (e.g. Poirier, Reference Poirier1985). Grains that are rotating and deforming in the external stress field of ice sheets may pass a threshold beyond which the motion of their existing dislocations is controlled more by their mutual interactions than by the ice-flow stresses resolved on the glide planes, allowing the dislocations to arrange into SGBs. The far-field stresses still affect these ice grains, although not producing large, resolved shear stresses on the basal planes, and the dislocation alignments must reflect those stresses. The dislocation-generation and dislocation-rearrangement hypotheses clearly may interact, with bubbles favoring dislocation generation, and those dislocations then migrating out of the grains with high resolved shear stresses on glide planes but rearranging into SGBs when resolved shear stresses drop sufficiently.
We note that our sampling for this project was restricted to optical analyses. Rapidly improving observational techniques, and especially EBSD (e.g. Chauve et al., Reference Chauve, Montagnat, Piazolo, Journaux, Wheeler, Barou, Mainprice and Tommasi2017; Weikusat et al., Reference Weikusat, Kuiper, Pennock, Kipfstuhl and Drury2017), offer important opportunities for testing these and other hypotheses, and extending the studies here.
4.3. Possible significance of chessboard microstructure
The chessboard microstructure may contribute to several important processes in ice sheets. We hypothesize that it affects grain-size evolution, the fracture of ice cores recovered from the brittle ice zone, and perhaps grain-boundary sliding or other processes.
The strengthening of SGBs into HAGBs contributes to polygonization of large grains and subsequent reduction in grain size observed over the depth interval 1000–1360 m at WAIS Divide (Fitzpatrick et al., Reference Fitzpatrick, Voigt, Fegyveresi, Stevens, Spencer, Cole-Dai, Alley, Jardine, Cravens, Wilen, Fudge and McConnell2014). This is also the depth range over which chessboard domains are most fully developed. The incidence of chSGBs is much higher than the incidence of SGBs in this interval. If the chSGBs also eventually strengthen into HAGBs, it is likely that they contribute significantly to polygonization of large grains over this depth range at WAIS Divide.
Deeper parts of all ice cores above the depth of enclathratization behave in a brittle manner following recovery, fracturing easily and sometimes spontaneously, but brittleness varies notably between cores (e.g. Neff, Reference Neff2014). Observations here show that bubbles frequently fracture along chSGBs on basal planes. If the fractures propagate along prismatic as well as basal planes, then the microstructure may allow interconnection of fractures over longer distances, favoring brittle behavior. If so, then understanding of the controls on chessboard microstructure may provide some knowledge of likely brittle behavior of new ice cores.
Grain-boundary sliding contributes to ice deformation and may be important or dominant under some circumstances (e.g. Goldsby and Kohlstedt, Reference Goldsby and Kohlstedt2001). If chSGBs strengthen into grain boundaries, they provide additional surfaces for sliding, with deformation favored along aligned boundaries but not across them.
5. Summary
Thin-section observations of the WAIS Divide deep ice core reveal the occurrence of chSGBs associated with the presence of bubbles. Several tests detailed here indicate that these boundaries occur in situ in the ice sheet, are easily and reliably resolved by our observational techniques, and are also present in other ice cores. The chSGBs are generally straight and likely occur along basal and prismatic crystallographic planes. Basal-trace boundaries typically terminate within grains. Prismatic-trace boundaries frequently terminate at basal-trace boundaries or HAGBs.
The chSGBs are observed only in ice that behaved in a brittle manner during core recovery and do not appear in shallow ice that was easily handled, nor in ice below the depth at which bubbles transitioned to clathrate-hydrate inclusions. Fractures are frequently observed emanating from bubbles along the basal-plane chessboard boundaries, suggesting a mechanistic link between chessboards and brittle behavior.
Preliminary results indicate that the chessboard structure is most common in grains with c-axes near vertical, for which there is little or no resolved shear stress on the basal plane, and thus little or no driving stress for migration of dislocations through the grain-to-grain boundaries. The population of such grains increases with increasing depth as lattice preferred orientation develops. This suggests the hypothesis that c-axis rotation of individual grains may cross a threshold beyond which the interaction forces between dislocations exceed the driving forces for dislocation migration from ice-sheet deformation, allowing the dislocations to arrange into SGBs, which focus into chessboards centered on bubbles in response to the effect of bubbles on the stress field. The straight nature of chessboard boundaries in almost all cases suggests that they are not being actively offset by ongoing deformation; the observation of such an offset in one case shows that it can be observed. Bubbles also may serve as sources for dislocations.
SGBs are known to strengthen into grain boundaries in many cases. The development of chessboard microstructure thus may contribute to grain-size reduction and may produce additional grain boundaries for ice deformation by boundary sliding. For these and additional reasons, we argue that chessboard microstructure merits further investigation.
Supplementary material
The supplementary material for this article can be found at https://doi.org/10.1017/aog.2024.19.
Data availability statement
Data used in this investigation are available at https://doi.org/10.5066/P1CPP6YN.
Acknowledgements
The authors wish to acknowledge the following funding sources for support of this work: USGS Climate and Land Use Change Research and Development Program; National Science Foundation Division of Polar Programs Grants 1738934 and 1043528, 2218402, and NASA 2021_80NSSC22K0384.
The authors also wish to acknowledge the staff of the NSF Ice Core Facility in Denver, Colorado; the WAIS Divide Science Coordination Office at the University of New Hampshire; and the U.S. Ice Drilling Program.
Finally, we express our gratitude to our reviewers whose suggestions and comments resulted in a greatly improved paper.


 Open access