


1 Introduction
Optical frequency comb (OFC) systems[Reference Udem, Holzwarth and W. Hänsch1] are usually described as mode-locked fiber lasers with a certain repetition rate ( $f_{\text{rep}}$) and locked offset frequency between a carrier and an envelope ( $f_{\text{ceo}}$). They have been widely employed in many fundamental physics experiments and applications, ranging over absolute distance measurements[Reference Coddington, Swann, Nenadovic and Newbury2–Reference Lee, Kim, Lee, Lee and Kim4], comb spectroscopy[Reference Diddams, Hollberg and Mbele5, Reference Bernhardt, Ozawa, Jacquet, Jacquey, Kobayashi, Udem, Holzwarth, Guelachvili, Hänsch and Picqué6] and immediate three-dimensional imaging[Reference Baumann, Giorgetta, Deschênes, Swann, Coddington and Newbury7, Reference Wang, Deng, Gu, Liu, Luo, Zhu, Li and Zeng8]. In the development of OFC systems, a series of outstanding works on fiber OFC generations have been demonstrated[Reference Schibli, Minoshima, Hong, Inaba, Onae, Matsumoto, Hartl and Fermann9–Reference Ma, Xu, Ishii, Meng, Nakajima, Matsushima, Schibli, Zhang and Minoshima13], and the all-fiber structure has been utilized for more compact systems with excellent stability[Reference Schibli, Minoshima, Hong, Inaba, Onae, Matsumoto, Hartl and Fermann9, Reference Hartl, Imeshev, Fermann, Langrock and Fejer14, Reference Inaba, Daimon, Hong, Onae, Minoshima, Schibli, Matsumoto, Hirano, Okuno, Onishi and Nakazawa15]. Nevertheless, high-performance OFC systems confined to a well-controlled laboratory are limited by the environmental sensitivity of mode-locked fiber lasers. With the increase in industrial and physical demand, however, application environments have been extended outside the laboratory[Reference Sinclair, Coddington, Swann, Rieker, Hati, Iwakuni and Newbury16] or even to outer space[Reference Lee, Lee, Jang, Jang, Han, Lee, Kang, Lim, Kim and Kim17]. Hence, all-polarization-maintaining (PM) fiber based systems were developed for more stable performances[Reference Kuse, Lee, Jiang, Mohr, Schibli and Fermann18, Reference Sinclair, Deschênes, Sonderhouse, Swann, Khader, Baumann, Newbury and Coddington19]. Moreover, considering that any arbitrary longitudinal mode $f_{\text{m}}$ of an OFC can be defined as $f_{\text{m}}=nf_{\text{rep}}+f_{\text{ceo}}$, two degrees of freedom ( $f_{\text{rep}}$ and $f_{\text{ceo}}$) determine the certain frequency of comb teeth. As far as we know, feedback control based on pump current is a common scheme for controlling $f_{\text{ceo}}$, and the phase locking of $f_{\text{rep}}$ usually depends on the actuators related to the cavity length of lasers. Generally, the complex construction of phase-locking systems and mode-locked lasers limits the practicability of OFC systems. Furthermore, some specific frequency applications with OFCs require a tunable repetition rate, such as the absolute distance measurement with the time-of-flight method. These developing trends and limitations have put a critical requirement on the stability and portability of OFCs. Therefore, a compact, portable and robust OFC source with a tunable repetition rate is desired for applying OFC technology.
Here, we have developed a compact, movable and robust OFC system with a tunable repetition rate. We combined a homemade all-PM, mode-locked fiber laser[Reference Zhu, Liu, Zhang, Luo, Wang, Zhou, Deng and Li20] with another all-PM fiber amplifier and two phase-locked loops to realize an electrically controlled OFC system with attractive features. The all-fiber structure ensures the contraction of volume and makes the system compact. The optimized homemade oscillator with low noise guarantees the noise suppression of phase locking and excellent performance for ensuring the accuracy and reliability of OFC measurements. The modular design with portability and the improved mechanical package design with PM components provide robustness and anti-environment-disturbance ability. The design of electronic control makes it possible to provide a variable repetition rate with simultaneous phase locking by programmed operations on the internal fiber delay and external radio frequency (RF) signals, which makes it more convenient to use OFCs in wider fields.
With an electrically controlled fiber delay line in the laser cavity, the OFC can provide a tunable range of 342 kHz at a repetition rate of 101 MHz, while the laser remains mode-locked with simultaneous phase locking. The stabilized in-loop  $f_{\text{ceo}}$ shows the fractional instability of $5.69\times 10^{-18}$ at a 1 s averaging time with the residual phase noise of 713 mrad integrated from 1 Hz to 1 MHz. The $f_{\text{rep}}$ is phase-locked to a standard frequency source with a standard deviation of $165~\unicode[STIX]{x03BC}\text{Hz}$. The Allan deviation of out-loop $f_{\text{rep}}$ at a 1 s averaging time is $1.68\times 10^{-12}$, and the residual phase noise of $f_{\text{rep}}$ from 1 Hz to 1 MHz is $336~\unicode[STIX]{x03BC}\text{rad}$, which is limited by the noise characteristics of the reference RF signal. The compact and low-noise OFC system with a tunable repetition rate has many potential uses. One practical application is the precision frequency metrology without the traditional wavelength meter. With the definition of each certain comb tooth[Reference Ma, Zucco, Picard, Robertsson and Windeler21] with $f_{\text{tooth}}=n(f_{\text{rep}}+\unicode[STIX]{x0394}f_{\text{rep}})+f_{\text{ceo}}$ (where $\unicode[STIX]{x0394}f_{\text{rep}}$ is the regulation of $f_{\text{rep}}$ and the integral order $n$ is ${\sim}1.9\times 10^{6}$ around 1560 nm), the unambiguous identification of one uncertain laser frequency can be realized by this system within a ${\sim}0.65~\text{THz}\;(=1.9\times 10^{6}\times 342~\text{kHz})$ scanning range in the 9.2 nm frequency region. On the other hand, the tunable repetition rate is also significant with precise and continuous scanning for experiments requiring synthesis between optical frequencies, such as pump-to-probe detection[Reference Jones, Potma, Cheng, Burfeindt, Pang, Ye and Xie22], matching frequency modes between two frequency combs[Reference Ma, Bi, Bartels, Robersson, Zucco, Windeler, Wilpers, Oates, Hollberg and Diddams23] or between the frequency comb and the CW laser, and measurements by dual-comb system[Reference Coddington, Swann, Nenadovic and Newbury2]. Furthermore, benefiting from our outstanding results, these applications with movable and compact structure have no limitations for use in various environments.
2 Comb design
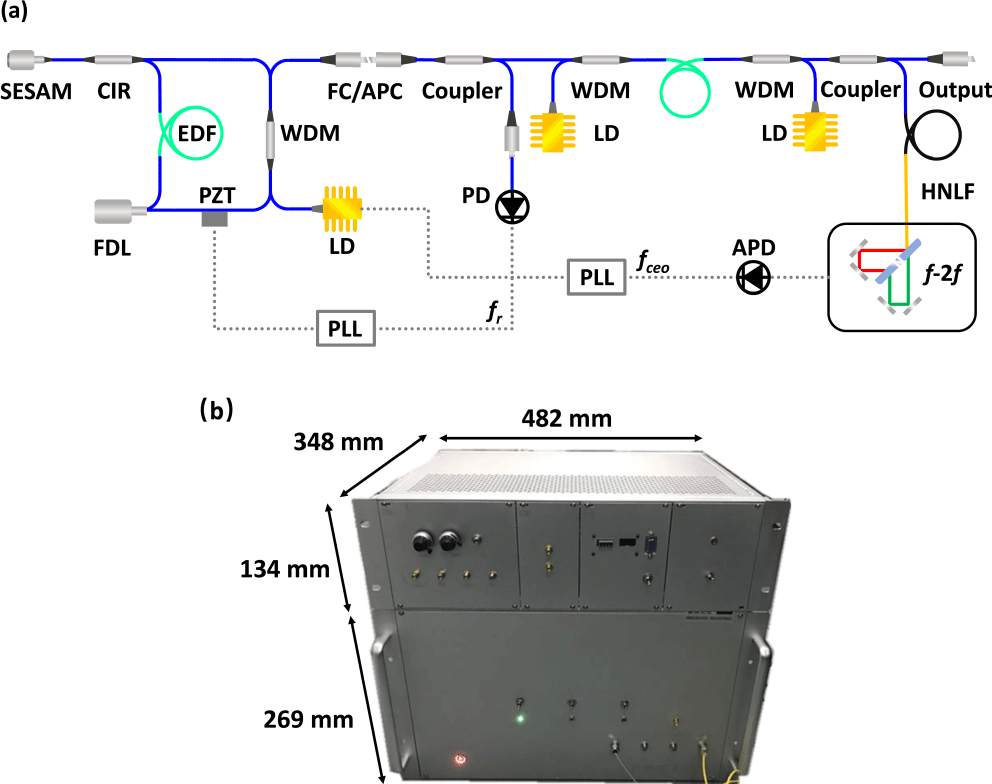
The configuration of a tunable compact fiber frequency comb design is shown in Figure 1(a), and the photograph of the ‘optics package’ and one package of the PLLs are presented in Figure 1(b). The oscillator strongly utilizes our previous work on the use of all-PM fiber cavity, with a SESAM[Reference Keller, Weingarten, Kartner, Kopf, Braun, Jung, Fluck, Honninger, Matuschek and Aus der Au24] to support self-starting mode locking. The ring-cavity oscillator is an all-PM Er-doped fiber mode-locked laser consisting only of all-PM fiber components. A fiber circulator connects the fiber-coupled SESAM with a ring fiber loop for mode locking. In the ring cavity, a 35 cm PM Er-doped fiber with 80 dB/m absorption at 1530 nm is used as the gain medium, and a piece of PM fiber (PM-1550) is stuck to a piezoelectric transducer (PZT) for cavity length modulations. A fiber-coupled delay line, equipped with a 1 cm tunable optical path, is inserted into the cavity for repetition rate regulation, which is electrically controlled with a minimal increment movement of  $3~\unicode[STIX]{x03BC}\text{m}$. The wavelength division multiplexer (WDM) utilizes an extra branch as a directional 30% output tap.
(a) Experimental setup. APD, avalanche photodiode; CIR, circulator at 1550 nm; EDF, Er-doped fiber; FC/APC, FC/APC connectors; FDL, electrically controlled fiber delay line; HNLF, highly nonlinear fiber;  $f\text{-}2f$, homemade $f$-to- $2f$ interferometer; LD, 976 nm laser diode; PD, fiber-coupled photodiode; PLL, phase-locked loop system; PZT, piezoelectric transducer; SESAM, packaged semiconductor saturable absorber mirror; WDM, 980/1550 nm wavelength division multiplexer. (b) The photograph and movie (Visualization 1) of the ‘optics package’ $(482~\text{mm}\times 348~\text{mm}\times 269~\text{mm})$ and one package of the PLLs $(482~\text{mm}\times 348~\text{mm}\times 134~\text{mm})$.

The net intra-cavity dispersion of  $-0.0298~\text{ps}^{2}$ results in a soliton pulse generation[Reference Mollenauer and Stolen25] with a full width at half maximum of 9.2 nm at a center wavelength of 1560 nm, as shown in Figure 2(a). The RF spectrum was measured by an RF analyzer (N9010A, Agilent), as shown in Figure 2(b). The fundamental repetition rate is 101.416 MHz with a 70 dB signal-to-noise ratio under the 300 kHz resolution bandwidth, corresponding to a ${\sim}197~\text{cm}$ fiber path in the cavity with the fiber delay line placed at the zero position. The tunable range for the repetition rate was calculated by measuring the maximum and minimum $f_{\text{rep}}$. By placing the fiber delay line from the zero point to the terminal point, the repetition rates were measured with the RF analyzer, as shown in Figure 2(c). The 342 kHz tunable range and the reliability of the regulation were demonstrated. The output power from the oscillator was recorded for 12 h by a power meter (PMD 1000) (Figure 2(d)) and showed a 0.49% (standard deviation) power fluctuation in the long-term test. Another 40 m stability test of the oscillator package was carried out and the anti-environment-disturbance ability was demonstrated (part of the test is shown in Visualization 2). The optimized amplitude noise of the oscillator was measured by a noise analyzer (R&S FWSP8). Figure 2(e) plots the original amplitude noise (blue line) from the oscillator and the integration (green line) of 0.016% from 1 Hz to 10 MHz, indicating excellent reliability as a source of an OFC.
(a) The optical spectrum of the oscillator. (b) Measured RF spectrum of the repetition rate (300 kHz resolution). (c) The tunable repetition rates with FDL modulations (10 Hz resolution). (d) Long-term output power of the oscillator above 12 h and the stability test (Visualization 2). (e) The original amplitude noise (blue line) and the integral amplitude noise (green line) from the oscillator. (f) The pulse duration of the compressed pulse after the amplifier.

The low noise of the optimized fiber oscillator also provided a lower noise level for the following phase locking. To further suppress the technical noise from the environment and make our system robust outside the laboratory, the packaging of optics and the mechanical package design were improved. Different parts of optics were installed in aluminum boxes separately. The main purpose of the separated design was to keep the oscillator independent for possible dismantlement and overhaul in the future. For the same reason, the FC/APC connectors were used between the oscillator and the amplifier while fiber splicing was employed for other connecting points, as shown in Figure 1(a). All the fibers and fiber components of each part were placed in the box and were attached to the aluminum housing by room-temperature-vulcanizing silicone. Outside the aluminum boxes, a 5 mm heat insulation layer and a 15 mm shock absorption layer were successively employed to protect the boxes from environmental vibrations for robustness. The material of our heat insulation layer was polyurethane foam with a thermal conductivity of  ${\sim}0.03~\text{W}/(\text{m}\cdot \text{K})$, and the shock absorption layer was formed by polyethylene foam with a damping loss factor $\text{tg}\unicode[STIX]{x1D6FF}$ above 0.35 in the temperature range from 0 to $70\,^{\circ }\text{C}$. All of the pump lasers were fixed on an individual heat sink, and each diode laser had a thermoelectric cooler (TEC) to control the temperature with a butterfly package. Then these packaged parts were combined as an integral optics package in another box with a volume of $482~\text{mm}\times 348~\text{mm}\times 269~\text{mm}$ for compactness and portability. A pair of fans were also installed for better heat dissipation of the heat sink and the internal low-noise electric source. The connectors of the PZT and the fiber delay were designed as standardized interfaces connected via a path cable to ensure the independence of each task module. By separating optics from electrical parts, the system demonstrated a more stable operation state with excellent adaptability in different environments. Furthermore, the homemade circuitry systems for phase locking were also packaged in two boxes with a volume of $482~\text{mm}\times 348~\text{mm}\times 134~\text{mm}$ for better movability.
The pulses of the oscillator are separated by a coupler, and the 90% power gets into an all-PM fiber amplifier for boosting pulse energy. Two WDMs, equipped with unidirectional isolators at 1550 nm, are spliced at the two ends of the gain fiber in the amplifier. The gain fiber in the amplifier is  ${\sim}2.5~\text{m}$ with normal dispersion at the laser wavelength, and the single-mode fibers utilized in other fiber devices are all PM-1550 fibers with anomalous dispersion. A section of PM-1550 fiber spliced after the Er-doped fiber serves as a compressor, and the whole length is exactly calculated depending on the whole dispersion of the system[Reference Sinclair, Deschênes, Sonderhouse, Swann, Khader, Baumann, Newbury and Coddington19]. The average power obtained from the oscillator is ${\sim}2~\text{mW}$, which is amplified to ${\sim}200~\text{mW}$ in the amplifier under a pump power of ${\sim}1200~\text{mW}$. Approximately 10% of the output at the tap coupler is divided at the end of the amplifier and another 190 mW power is involved in the supercontinuum generation. The pulse duration was eventually compressed to 74 fs by a Gaussian fit, corresponding to a peak power of ${\sim}25.6~\text{kW}$, as shown in Figure 2(f). The pulse quality is degraded by the appearance of the pedestal in the autocorrelation trace, and the degradation is mainly caused by the uncompensated third-order dispersion of the long fiber[Reference Ruehl, Hundertmark, Wandt, Fallnich and Kracht26].
The compressed pulse train with a high peak power is then fiber-coupled to a piece of highly nonlinear germanosilicate fiber[Reference Hirano, Nakanishi, Okuno and Onishi27] with anomalous dispersion at 1550 nm. An octave-spanning spectrum is then obtained in the PM highly nonlinear fiber (HNLF) via a soliton fission process and measured with two optical spectrum analyzers (AQ6370 and 771B-MIR) aimed at different wavelength ranges. Figure 3(a) shows the supercontinuum ranging from 1000 nm to 2300 nm. Benefiting from the stable pulse energy and spectral shape provided by the all-PM oscillator and amplifier, the results of octave-spanning show good stability and invariance for the detection of the CEO frequency. A homemade  $f$-to- $2f$ interferometer, containing a 1-mm-thick lithium niobate crystal (CTL Photonics) with a fan-out poling period ranging from $31.3~\unicode[STIX]{x03BC}\text{m}$ to $32.81~\unicode[STIX]{x03BC}\text{m}$, is employed to detect $f_{\text{ceo}}$. By adjusting the frequency doubling of the red-shift edge in the output spectrum, the signal-to-noise ratio of $f_{\text{ceo}}$ is optimized up to 32 dB in a 100 kHz resolution bandwidth as shown in Figure 3(b).
(a) The supercontinuum after HNLF with the compressed pulses. (b) The RF spectrum of the  $f_{\text{ceo}}$ frequency detected by the APD.

For the phase locking between the carrier and the envelope, the detected RF signal of  $f_{\text{ceo}}$ is then compared to a reference signal from a Rb atomic clock at 10 MHz, after a series of conversions including filtering, amplifying and dividing. The resulting error signal from the phase detector is converted into a feedback signal by a digital–analog hybrid $\text{PI}^{2}\text{D}$ controller. The feedback signal is employed to control the pump current to realize the stabilization of $f_{\text{ceo}}$. For the phase locking of $f_{\text{rep}}$, the RF signal of $f_{\text{rep}}$ detected before the amplifier is similarly handled. The error signal between the $f_{\text{rep}}$ and the reference signal at 101 MHz from the signal generator is converted to the feedback signal by means of another PID controller. The PZT in the laser cavity is utilized to receive the feedback control for locking $f_{\text{rep}}$. For the time synchronization of the whole system, the signal generator is referenced to the same Rb atomic clock mentioned above.
3 Results and discussion
Adopting the modular design, the robust and movable fiber OFC has been demonstrated with many attractive features. The self-starting process has been shown in Visualization 1, and a series of other results pertaining to the long-term behavior of the OFC are measured here, as shown in Figure 4. A  $\unicode[STIX]{x1D6EC}$-type frequency counter referenced to the Rb atomic clock in the system is employed to register the in-loop $f_{\text{ceo}}$ and out-loop $f_{\text{rep}}$ at 1 s gate time for more than 11 h. The time trace of $f_{\text{ceo}}$ is presented in Figure 4(a). The resolution is limited by the counter corresponding to 0.1 mHz, and the offset follows a normal trace ranging from $-4~\text{mHz}$ to 4 mHz with a standard deviation of 1.1 mHz. Figure 4(b) shows a histogram of the frequency offset with a Gaussian profile with a corresponding width of ${\sim}2.41~\text{mHz}$. The Allan deviation of $f_{\text{ceo}}$ is calculated in Figure 4(c). The fractional instability of the stabilized $f_{\text{ceo}}$ is $5.69\times 10^{-18}$ at a 1 s averaging time and is improved to $2.17\times 10^{-19}$ at 1000 s averaging time. The raw data of the counted $f_{\text{rep}}$ are displayed in Figure 4(d) for above 11 h with the standard deviation of $165~\unicode[STIX]{x03BC}\text{Hz}$. Figure 4(e) shows the histogram of the frequency difference between the $f_{\text{rep}}$ and the reference RF signal, and the width of the trace is $362~\unicode[STIX]{x03BC}\text{Hz}$ from Gaussian fitting. The fractional instability of $f_{\text{rep}}$ is improved from $1.68\times 10^{-12}$ to $3\times 10^{-14}$ at an averaging time below 1000 s. Considering that the RF signal for $f_{\text{rep}}$ stabilization is referenced to the Rb atomic clock, the Allan deviation is limited by the Rb atomic clock[Reference Wang, Meng, Li, Jiang, Wang, Fang and Zhang28], and the results indicate that $f_{\text{rep}}$ has been tightly phase-locked at the referenced frequency.
(a) The recorded time series of the  $f_{\text{ceo}}$ offset. (b) The counts of the $f_{\text{ceo}}$ offset. (c) The overlapping Allan deviation of the recorded $f_{\text{ceo}}$. (d) The recorded time series of the $f_{\text{rep}}$ offset. (e) The counts of the $f_{\text{rep}}$ offset. (f) The overlapping Allan deviation of the recorded $f_{\text{rep}}$.

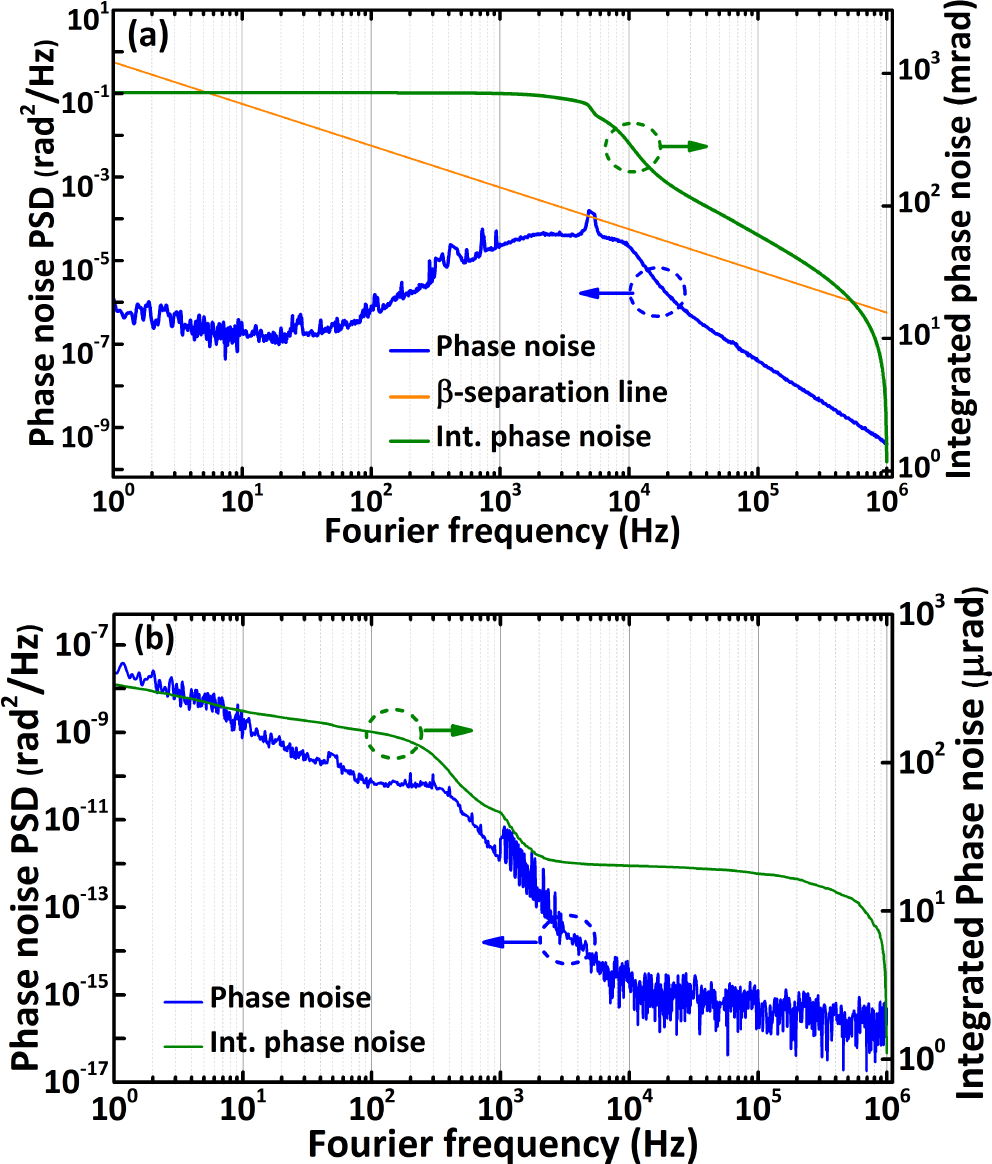
The phase noise performance is another important evaluation for the stability of OFCs. The phase noise of the in-loop  $f_{\text{ceo}}$ was measured and plotted in Figure 5(a). By means of feedback control of the pump current, the phase noise below 10 kHz is obviously suppressed and the servo dump occurs at 5 kHz, corresponding to the feedback bandwidth of $f_{\text{ceo}}$. The achievable bandwidth is limited by the stimulated lifetime depending on the gain medium and design of the laser cavity[Reference Lee, Mohr, Bethge, Suzuki, Fermann, Hartl and Schibli29]. The equipment of fast loss modulators in the cavity, such as graphene modulators[Reference Lee, Mohr, Bethge, Suzuki, Fermann, Hartl and Schibli29] and optic–optic modulators[Reference Hoffmann, Schilt and Südmeyer30], may help us to extend the limit. To distinguish regimes where there is a main linewidth contribution to the comb lines of $f_{\text{ceo}}$, we introduce the $\unicode[STIX]{x1D6FD}$-separation line in Figure 5(a) (orange line). According to the crossing point of the phase noise PSD of the stabilized $f_{\text{ceo}}$ with the $\unicode[STIX]{x1D6FD}$-separation line, only a small portion of the phase noise PSD exceeds the $\unicode[STIX]{x1D6FD}$-separation line around 5 kHz and contributes to the line linewidth[Reference Bucalovic, Dolgovskiy, Schori, Thomann, Di Domenico and Schilt31]. The integrated phase noise of $f_{\text{ceo}}$ is displayed in Figure 5(a) in green, and the residual phase noise of the stabilized $f_{\text{ceo}}$ is 713 mrad (1 Hz to 1 MHz). The $f_{\text{rep}}$ represents the repetition rate between pulses and is related to the round time of the mode-locked fiber laser. By means of feedback control of the PZT stuck to a piece of fiber in the cavity, the cavity length can be controlled at a certain value, resulting in a fixed $f_{\text{rep}}$. In some measurements with OFCs, the accuracy of $f_{\text{rep}}$ is important for the results, especially in the absolute distance measurement with the time-of-flight method. The phase noise of locked $f_{\text{rep}}$ is displayed in Figure 5(b). Low-noise characteristics can be seen in the region above 1 kHz, and the phase locking benefits the noise suppression below 1 kHz. As shown in Figure 5(b), the residual phase noise of $f_{\text{rep}}$ is $336~\unicode[STIX]{x03BC}\text{rad}$, and the noise level is limited by the noise characteristics of the reference RF signal.
(a) The noise characterization of  $f_{\text{ceo}}$. The phase noise of $f_{\text{ceo}}$ stabilized with the pump current (blue line), the integrated phase noise of the $f_{\text{ceo}}$ stabilized with the pump current (green line) and the introduced $\unicode[STIX]{x1D6FD}$-separation line (orange line). (b) The noise characterization of $f_{\text{rep}}$. The phase noise of $f_{\text{rep}}$ stabilized with the PZT (blue line) and the integrated phase noise of $f_{\text{rep}}$ stabilized with the PZT (green line).
4 Conclusions
In conclusion, we have developed a compact and robust OFC system. The all-PM fiber design makes the system movable and practical for applications outside the laboratory. By means of an electrically controlled fiber delay in a laser cavity, the repetition rate of the OFC has a tunable range of 342 kHz at 101 MHz for specific applications, especially benefiting those measurements with tunable repetition rates. Tight phase locking of  $f_{\text{rep}}$ and $f_{\text{ceo}}$ guarantees the accuracy of measurement results obtained by using our system, and the factional instabilities are calibrated to be $1.68\times 10^{-12}$ and $5.69\times 10^{-18}$, respectively, at an averaging time of 1 s. The residual phase noise of $f_{\text{ceo}}$ is 713 mrad integrated from 1 Hz to 1 MHz, while the integration of $f_{\text{rep}}$ is $336~\unicode[STIX]{x03BC}\text{rad}$. Moreover, long-term stability is also demonstrated by an 11 h test. We are confident that this compact and low-noise OFC system can be widely applicable to the fields of precise metrology with OFCs.
Acknowledgements
This work was partly supported by the National Natural Science Foundation of China (Nos. 11804096, 11874153 and 11904105), the National Key R&D Program of China (Nos. 2018YFA0306301 and 2017YFF0206000) and the Shanghai Sailing Program (No. 18YF1407300).


 Open access