

Overweight and obesity are increasing worldwide(Reference Gill, Antipatis and James1). In Australia the prevalence of obesity has doubled in two decades and increases are projected to continue(Reference Cameron, Welborn, Zimmet, Dunstan, Owen, Salmon, Dalton, Jolley and Shaw2). However, much remains unclear about the population BMI trends that are driving the increase. Specifically, it is unclear to what extent the current prevalence of obesity is a result of increases across the whole spectrum of BMI or limited mostly to the upper BMI ranges. It is possible that the BMI distribution in today’s population has a larger mean, more variability, increased skewness or any combination of these aspects in comparison with historical age-matched sections of the population.
It has been shown in the USA and New Zealand that increases in the prevalence of obesity have been accompanied by an increase in right skew of the BMI distributions(Reference Flegal and Troiano3–5). In Australia, the surveillance of obesity has been limited to describing changes in the prevalence of overweight and obesity. There has been no analysis of trends in the continuous distribution of BMI. Without understanding the detail of the increase in obesity prevalence we cannot accurately measure its burden, fully understand its drivers or ensure that obesity prevention and treatment campaigns are targeted appropriately. Here, we examine BMI trends in urban Australian adults between 1980 and 2000, focusing on trends in the continuous distribution of BMI.
Methods
The present study compares data from five cross-sectional surveys: the 1980, 1983 and 1989 National Heart Foundation Risk Factor Prevalence Study (RFPS), the 1995 National Nutrition Survey (NNS) and the 1999/2000 Australian Diabetes, Obesity and Lifestyle Study (AusDiab).
Data sources
National Heart Foundation Risk Factor Prevalence Study
The RFPS comprised three national population-based surveys of the prevalence of risk factors for heart disease conducted in 1980, 1983 and 1989. Their target population was residents of Australian capital cities listed on state electoral rolls and aged 25–64 and 20–69 years. From initial target samples of 8375, 10 148 and 9328, the 1980, 1983 and 1989 studies involved 5603 (67 %), 7615 (75 %) and 6097 (65 %) respondents, respectively. Participants were administered a questionnaire, and underwent a physical examination and blood test(Reference Bennett and Magnus6). For the current analysis participants with missing values for measured height or weight, those aged <25 and >65 years and women recorded as pregnant at the time of survey were excluded, leaving 5550, 7562 and 7667 participants from the 1980, 1983 and 1989 surveys for analysis, respectively. For each survey, there were no further missing values for country of birth or smoking status.
National Nutrition Survey
The NNS was a sub-sample of a larger population survey, the National Health Survey (NHS). The target population was residents of Australian States and Territories and aged over 2 years. For the NHS, a nationwide sample of approximately 23 800 households was obtained. Of households selected to participate, 92 % responded, with a total of 57 633 persons interviewed. Of those, 22 562 were selected to participate in the NNS. A total of 13 858 persons (61 % of those selected) participated in the NNS(7). Participants with missing values for measured height or weight, aged <25 and >65 years, not living in capital cities and women recorded as pregnant at the time of survey were excluded, leaving 4783 participants for analysis. There were no further missing values for country of birth or smoking status.
Australian Diabetes, Obesity and Lifestyle Study
AusDiab was a national population-based survey conducted in 1999/2000, the methods for which are described in detail elsewhere(Reference Dunstan, Zimmet, Welborn, Cameron, Shaw, de Courten, Jolley and McCarty8). Household questionnaires of the nationwide sample were completed in 67 % of the households (n 11 479) that could be contacted and contained at least one eligible person. A total of 20 347 eligible individuals were interviewed in these 11 479 households. The final survey sample (those attending the biomedical examination) included 11 247 adults (5049 men and 6198 women), representing 55 % of those completing the household interview and 37 % of those selected. Participants with missing values for measured height or weight, who were pregnant at the time of survey, not living in capital cities or aged <25 and >65 years were excluded, leaving 5529 participants for analysis. While there were no further missing values for the separate analysis by country of birth, missing smoking responses were excluded for the analysis by smoking status, leaving 5463 participants for that analysis.
BMI
BMI was calculated as weight divided by height squared (kg/m2), where weight and height were measured using standard procedures. Standard cut-offs were applied to the BMI scores to classify people into underweight (<18·5 kg/m2), normal weight (18·5–24·9 kg/m2), overweight (25·0–29·9 kg/m2) and obese (≥30·0 kg/m2), and to classify obese people into obese class I (30·0–34·9 kg/m2), obese class II (35·0–39·9 kg/m2) and obese class III (≥40·0 kg/m2)(9, 10).
Analysis
Study-specific sample weights were used to represent the age, sex and state distribution of the Australian population at the time of each survey.
Analyses of BMI were stratified by sex and age group (age categorised in 10-year groups between ages 25 and 64 years) and conducted using the Intercooled Stata statistical software package version 9·0 (StataCorp, College Station, TX, USA).
The prevalence of each BMI category and mean BMI were calculated in each survey. Linear regression was used to analyse the changes in BMI adjusted for age and sex. Changes in the distribution of BMI between surveys are illustrated by Tukey mean–difference plots(Reference Flegal and Troiano3, 5). In these plots, the difference between mean BMI in corresponding quantiles of different surveys is plotted against the total mean of the combined quantiles.
Analyses were also conducted according to ‘country of birth’ (with strata defined as Australian-born and overseas-born) and stratified according to smoking status (with strata defined as ‘never smoker’ and ‘past or current smoker’). The definitions of country of birth and smoking status were consistent across surveys.
Results
Across the five surveys, the number of participants in each sex and age group ranged from 379 to 1237. The distributions of age group, sex and proportion Australian-born were similar in each survey (with the exception of age group in AusDiab). The response fractions differed – they were higher in the RFPS, lower in the NNS and substantially lower in AusDiab – and the percentage of never smokers was higher in AusDiab than in the previous four surveys (Table 1).
Demographic information from the five surveys among urban Australian adults aged 25–64 years, 1980–2000

RFPS, Risk Factor Prevalence Study; NNS, National Nutrition Survey; AusDiab, Australian Diabetes, Obesity and Lifestyle Study.
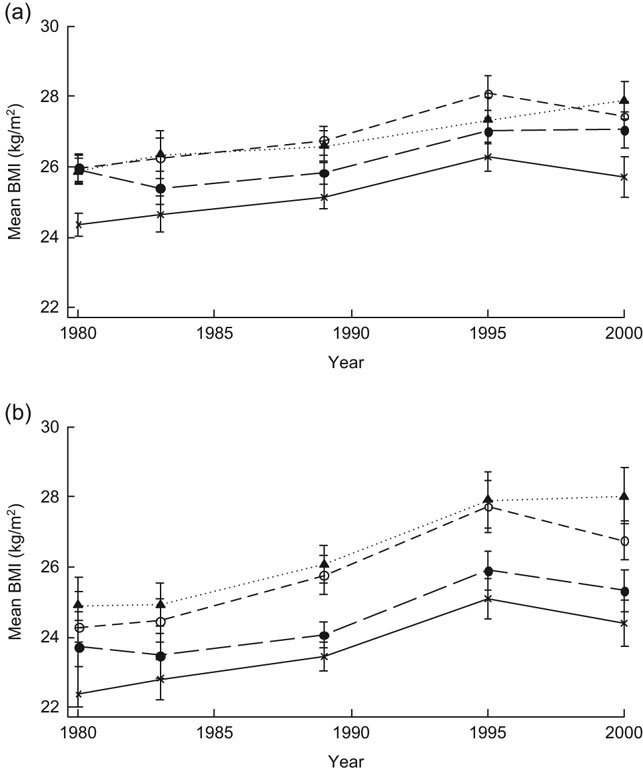
Mean BMI was higher in 2000 than 1980 in all sex and age groups. The age-adjusted increase was 1·4 kg/m2 in men and 2·1 kg/m2 in women. The mean increase was significantly greater for women than men, but the changes in mean BMI by age group were not significantly different. Figure 1 shows that the crude increase over the 20 years for the different age and sex groups ranged from 1·0 to 2·6 kg/m2. Three distinct phases were apparent during the 20-year period. A modest increase in BMI was observed between 1980 and 1989 (approximately 0·04 kg/m2 per year for men, 0·10 kg/m2 for women), followed by a more rapid increase between 1989 and 1995 (approximately 0·19 kg/m2 per year for men, 0·21 kg/m2 per year for women), and from 1995 to 2000 a decrease (approximately 0·05 kg/m2 per year for men, 0·04 kg/m2 per year for women). These trends were similar across most male and female age groups.
Mean BMI between 1980 and 2000 of urban Australian males (a) and females (b) aged 25–64 years by age group (——×——, 25–34 years; — — • — — , 35–44 years; – – ○ – –, 45–54 years; · · · · ▴ · · · ·, 55–64 years), with 95 % confidence intervals represented by vertical bars
We assessed changes in the shape of the distribution for the 20-year period (1980–2000) and individually for the three distinct time periods (1980 to 1989, 1989 to 1995 and 1995 to 2000). Figure 2 illustrates the changing shape of the BMI distribution between 1980 and 2000, and 1980 and 1995. In general, there is a rightwards shift in the whole distribution, and the tail is also stretching further out (an increase in skew). The right-skewing of the distribution is more pronounced for women than men. The greatest increases in skew were generally in the period with the most rapid increases in mean BMI (1989–95). In the last period (1995–2000), there was a leftwards shift of the total population BMI distribution.
Distribution of BMI in 1980 (——), 1995 and 2000 (– – –) in urban Australian adults aged 25–64 years by sex: (a) 1980 and 2000, males; (b) 1980 and 2000, females; (c) 1980 and 1995, males; (d) 1980 and 1995, females
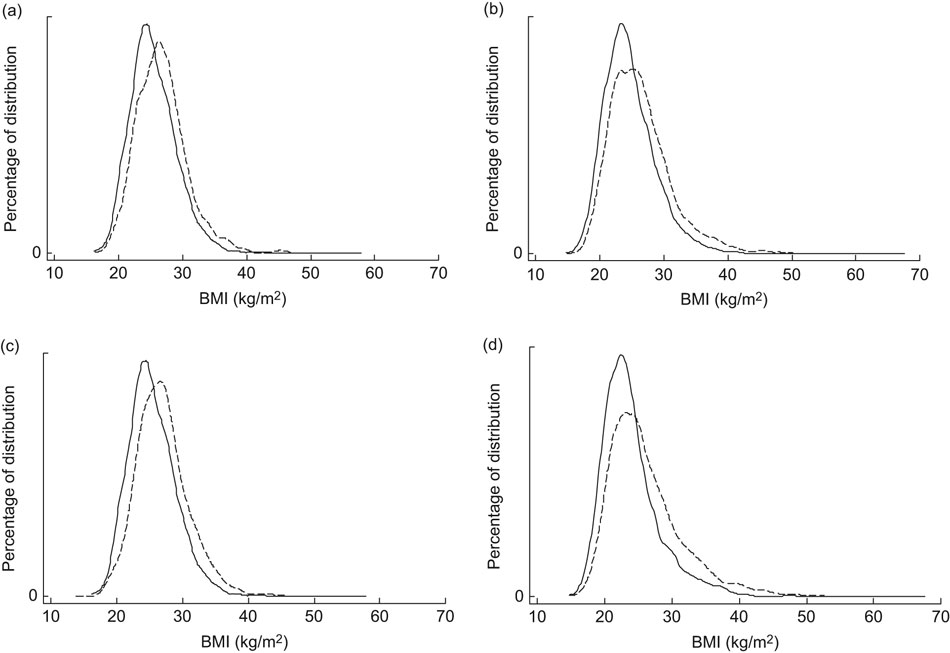
Figure 3 compares the 1980 BMI distributions with those of 2000. The shape of the line formed by the points demonstrates the nature of the shift. It shows that for all age and sex groups, there was upward shift of the entire BMI distribution and increased skewness. The absolute magnitude of the differences varied widely, from a decrease of 0·04 kg/m2 at the lower end of the distribution for males aged 25–34 years to an increase of 7·4 kg/m2 at the higher end of the distribution for females aged 55–64 years. In general, the magnitude of increase for the higher end of the distribution was greater for women than men, suggesting a greater increase in skew for women. Skew also increased when the data were analysed according to relative rather than absolute change between 1980 and 2000.
Tukey mean–difference plots of BMI change between 1980 and 2000 in urban Australian adults aged 25–64 years by sex and age group: (a) males, 25–34 years; (b) males, 35–44 years; (c) males, 45–54 years; (d) males, 55–64 years; (e) females, 25–34 years; (f) females, 35–44 years; (g) females, 45–54 years; (h) females, 55–64 years. Data are presented as fifty data points representing the BMI distribution split into fifty centiles

There was some variation in the degree of increase by sex and age groups. For women aged 35–44 and 55–64 years and men aged 35–44 years, the increase was substantially higher at the highest end of the distribution with relatively less variation in the increase elsewhere. There was little variation in the increase by BMI for men aged 45–54 and 55–64 years.
Table 2 illustrates the consequence of these changes for the prevalence of underweight, normal weight, overweight and obesity. The prevalence of obesity increased by 6·6 and 10·5 percentage points in men and women between 1980 and 2000, leading to a prevalence of 17·2 % in men and 19·3 % in women. The prevalence of overweight was higher in men than women in all time periods. The prevalence of obesity was higher in men in 1980, but by 2000 was higher in most age groups of women. Between 1995 and 2000 the prevalence of obesity decreased for all age groups except those aged 55–64 years.
Percentage of urban Australian adults aged 25–64 years in each BMI category in 1980 and 2000

Table 3 illustrates the consequences of the increase in skew for the different categories of obesity. As a percentage of those with a BMI ≥ 30 kg/m2, obese class I decreased from 90·1 % to 81·4 % in men and from 71·3 % to 60·4 % in women. The most rapidly increasing obesity class was class II for men and class III for women.
Percentage of urban Australian adults aged 25–64 years in each obesity category (based on BMI) in 1980 and 2000

Analyses of height and weight indicated that these BMI trends were driven largely by trends in weight. Mean height increased between 1980 and 2000 (1·8 cm for men and 1·4 cm for women) but this did not account for the changes observed in the BMI distribution; based on the observed increases in height across the distribution, less right skewness in BMI is expected. In contrast, mean weight increased markedly (by 5·7 kg in men and 6·4 kg in women) and there was an increase in the right skew of the weight distribution. Similar trends in skew and mean BMI between 1980 and 2000 to our whole-population results were found for Australian-born participants and people who had never smoked (data not shown).
Discussion
Between 1980 and 2000 the mean BMI of urban Australian adults increased. The age-adjusted increase was 1·4 kg/m2 in men and 2·1 kg/m2 in women. The increase in BMI was not uniform. It was greater at the higher end of the distribution than the lower end, ranging from a decrease of 0·04 kg/m2 to an increase of 7·4 kg/m2. Thus, the BMI distribution became increasingly skewed. The prevalence of obesity approximately doubled. As a percentage of total obesity, obesity class I decreased while obesity class III more than doubled.
There were substantial differences in the degree and rate of increase by age, sex and across time. The most rapid increase was in the early 1990s. After this time the rate of increase appears to have slowed in some groups. The only continued increase was in men and women aged 55–64 years.
The major potential limitation to our analysis is the comparability of the surveys from which the results are derived. The three RFPS surveys were similarly conducted and had relatively high response fractions, but the NNS and AusDiab studies were methodologically different and had lower response fractions (61 % and 37 %, respectively). These low response fractions could lead to either an under- or an over-representation of BMI levels. However an under-representation is most likely, as non-response has been linked to having a sedentary lifestyle and lower socio-economic status (also associated with higher body weight, in developed countries)(Reference Hill, Roberts, Ewings and Gunnell11, Reference Ven Loon, Tijhuis, Picavet, Surtees and Ormel12). Bias could also have been introduced from the different times at which data were collected: for example, the NNS data were collected in all regions between February 1995 and March 1996; whereas the AusDiab data were collected over a 21-month period, with 2 months in each region. Comparable future population BMI studies will be important.
To help overcome potential incomparability between surveys due to both differences in sampling and true changes in population demographics, we performed analyses stratified by key demographic variables. We found that differences in population demographics and the prevalence and intensity of smoking are unlikely explanations of the trends, as we observed similar trends in different age and sex groups, in the Australian-born subgroup (the best available proxy measure for ethnicity) and in populations of never smokers, and for these subgroups between 1980 and 1995 as for 1980 to 2000.
The slowing between 1995 and 2000 in the previously increasing BMI trend may be driven by methodological issues. However, our main conclusions – increasing mean BMI, increasing right skew and large increases in the more severe categories of obesity – also hold true for other time period comparisons (1980 to 1989 and 1980 to 1995).
Although self-reported body weight trends continued increasing to 2005(13), the recent slowing in the rate of increase in mean BMI has also been shown for some population groups in New Zealand and the USA(5, 14, Reference Ogden, Carroll, Curtin, McDowell, Tabak and Flegal15) and in a slowing of the annual rate of overweight/obesity increase based on measured BMI in Australian children(Reference Booth, Dobbins, Okely, Denney-Wilson and Hardy16). The link between the rate of BMI increase and the degree of increase in distributional skew is also supported by New Zealand findings(5).
The data are sourced from five cross-sectional surveys (they do not reflect a cohort of individuals) and describe changing population ‘snapshots’ of the BMI distribution. Longitudinal analysis of participants in the AusDiab study (1999/2000 to 2005) showed that gain in weight, BMI and waist circumference have been greatest in individuals of normal weight and in younger people from 2000 to 2005(Reference Barr, Magliano, Zimmet, Polkinghorne, Atkins, Dunstan, Murray and Shaw17).
There was some variation in the degree of increase by sex and age groups. The increase was substantially higher at the highest end of the distribution, with relatively less variation in the increase elsewhere, for women aged 35–44 and 55–64 years and men aged 35–44 years. This suggests that not all population subgroups have responded in the same way to the drivers of increased body weight. There was little variation in the increase for men aged 45–54 and 55–64 years.
The increase in right skew has implications for the ‘obese’ BMI category. The overall prevalence of obesity has increased, but the type of obesity becoming increasingly prevalent is that at the extreme end of the distribution. Similar findings have been shown in the USA(Reference Sturm18). These findings suggest that analyses focusing on the prevalence of total obesity are likely to underestimate the true obesity burden and highlight the importance of monitoring trends across the whole population distribution of BMI.
Challenges remain to understand the drivers of these patterns and to determine the most appropriate response. The major drivers of the BMI distributional shift are likely to be changing dietary and physical activity patterns due to the increasingly obesogenic environment in which we live(5). Our findings suggest that this environment is not acting equally across the population and that environmental measures to shift BMI distributions leftwards may be insufficient on their own to substantially reduce the burden of obesity(Reference Flegal and Troiano3, Reference Penman and Johnson19). Approaches to reducing the burden of obesity need to shift both the BMI distribution leftwards and target the higher BMI subgroups. In addition, it will be important to analyse potential social inequalities in these trends.
In conclusion, the mean BMI of urban Australian adults increased between 1980 and 2000 for all sex and age groups. The increase was fastest during the early 1990s, and thereafter stagnated or declined. Over the 20 years, there were much greater BMI increases at the higher end of the distribution. This resulted in an increasingly skewed distribution, and has resulted in a large increase in the prevalence of obesity. However, it is the prevalence of the more severe levels of obesity that has increased the most. It will be important to monitor the true increase in the burden of obesity by looking at changes in the different classes of obesity and the extent to which obesity interventions shift the BMI distribution leftwards and decrease the skew of the distribution.
Acknowledgements
H.L.W. was supported by a NHMRC/NHF PhD Scholarship. A.P. was supported by a VicHealth fellowship. Some support was also provided by NHMRC Grant No. 465130. There are no conflicts of interest to declare. H.L.W. analysed the data sets and wrote the article. R.W. provided statistical advice. R.W., M.M.H., D.J.M., M.d.C., C.M.R., J.J.M., J.S. and A.P. provided further interpretation of the article. A.P. supervised the analysis. We wish to thank the National Heart Foundation’s Risk Factor Prevalence Study Committee and the Australian Social Science Data Archive for access to the Risk Factor Prevalence Studies, the Australian Bureau of Statistics for access to the National Nutrition Survey, and the AusDiab Steering Committee for access to the AusDiab study. We are also grateful to the support and help of Lei Chen, Susan Shortreed, Adrian Cameron, David Dunstan and Paul Zimmet.


