

1. INTRODUCTION
Silver played a major role in the economy of late imperial China, a role all the more remarkable given that Chinese governments never issued a silver currency before 1889. Even in the absence of an official silver currency, over the course of the 15th century, the Ming dynasty (1368–1644) gradually adopted a fiscal system based on silver as the primary instrument of money payments to the state. From the 16th century onward, commercial growth heightened the demand for silver in market exchange and spurred the import of foreign silver, initially from Japan and soon from Spain's American colonies as well. Silver remained China's primary import to the end of the 19th century, although the scale of imports and their significance within China's domestic economy varied over time. China remained on a silver standard until the Republic of China's Nationalist government instituted a currency reform in 1935, long after the nearly universal adoption of the gold standard elsewhere in the world, that replaced silver coin with a new fiat paper currency.
Chinese and Japanese scholars have long recognised that the massive import of foreign silver from Japan and Latin America was a crucial force stoking the dramatic acceleration in the commercial growth of the late Ming era (Momose Reference Momose and Momose1935; Liang Reference Liang and Liang1939). Western scholars have acknowledged the stimulus foreign silver imparted to the Chinese economy, but they have tended to emphasise the adverse effects of China's incorporation into the global economy through its imports of foreign silver. An unhealthy dependency on foreign silver has been cited as a key factor in the fall of the Ming dynasty in 1644. In this view, interruptions in the global production and trade of silver in the mid-17th century caused devastating disruption to the Chinese economy and left the Ming state unable to resist domestic rebellion and foreign invasion (Atwell Reference Atwell1982, Reference Atwell1986, Reference Atwell2005; Wakeman Reference Wakeman1986). Similarly, it has been argued that the drain of silver abroad in the second quarter of the 19th century—essentially to pay for opium imports—triggered the cataclysmic Opium War of 1839–1842 and led to China's subordination to the European-dominated global capitalist economy (Greenberg Reference Greenberg1951; Moulder Reference Moulder1977).
But these characterisations of China's dependence on foreign silver and vulnerability to supply shocks ignore the shifting dynamics of China's domestic economy and the place of silver within it. The «crisis» theories mentioned above have been premised on the assumption that China's demand for silver remained constant over three centuries and ignore both the character of silver as a trade commodity as well as fluctuations in Chinese demand for silver. The scale of Chinese imports of silver—which, after 1670, consisted almost exclusively of silver mined in Latin America—varied over time. To understand these fluctuations and the significance of silver imports to China, we must consider the rhythms of economic trends within China and changes in the composition of its money supply as well as international bullion flows.
2. CHINA'S «SILVER CENTURY» (1550–1650)
The first Ming emperor, Hongwu (r. 1368–1398), was determined to expunge the preceding century of Mongol rule over China and eradicate what he regarded as the corrupting taint of Mongol customs. In his effort to restore the institutions and values of the agrarian society enshrined in the Confucian Classics, Hongwu repudiated the robust market economy that had developed in the Song dynasty (960–1276) and continued to flourish under the Mongol regime. In pursuit of this agenda, the emperor formulated fiscal policies predicated on a return to unilateral in-kind payments to the state, conscripted labour service, self-sufficient military farms and payments to officials and soldiers in goods rather than money (von Glahn Reference Von Glahn2016, pp. 285–289). Hongwu instituted a new type of inconvertible paper currency (baochao), while simultaneously banning the use of gold and silver (and for a period of time even state-issued bronze coin) as money. But the baochao notes proved an abject failure and by 1425 they ceased to function as viable currency (von Glahn Reference Von Glahn1996, pp. 70–73). The Ming state also lacked sufficient supplies of copper to mint bronze coin—the standard state-issued money since the founding of the first unified empires in the 3rd century bce—in sufficient quantities, and in the early 1430s suspended coinage altogether. As a result, the populace resorted to uncoined silver as the principal means of market exchange. Yet the upsurge in domestic silver mining that occurred during the first half of the 15th century proved short-lived, hampering commercial growth.
In keeping with the anti-market tenor of his fiscal policies, Emperor Hongwu also prohibited private maritime trade, restricting overseas contacts to a highly formulised system of tribute diplomacy that permitted only a small volume of commercial exchange conducted under close government scrutiny. But the maritime ban became increasingly difficult to enforce. Entrepreneurial seafarers from ports along China's southeastern coast were able to evade these restrictions due to lax enforcement and the covert support of local elites who financed overseas ventures.
Ming control over foreign trade through the tributary system was utterly upended in the 1530s, following the rapid development of silver mining in Japan. By 1540, Chinese traders were swarming to Japanese ports to acquire the silver so avidly treasured in China. This «silver rush» coincided with the arrival of Portuguese seafarers in East Asian waters. The first efforts of the Portuguese to negotiate trading privileges with the Ming government were rebuffed, but Portuguese traders soon joined with Chinese smugglers to circumvent the Ming maritime embargo and deliver Japanese silver to the Chinese market. In 1548, the Ming government launched a concerted effort to eradicate the «Japanese pirates» (as they dubbed the smugglers, although nearly all of them were Chinese) from their offshore island bases along the southeastern seacoast. Despite the capture of smuggler strongholds, however, the Ming was unable to interdict illicit commerce. In an effort to sever the alliance between Portuguese traders and the «Japanese pirates», in 1557 the Ming court granted the Portuguese the right to establish a trading settlement at Macau, with access to the Chinese market via Guangzhou. Finally, wearied by the mounting costs of policing its maritime frontier, in 1567 the Ming government repealed the maritime ban. Overseas Chinese trading voyages were subject to government regulation and direct trade between China and Japan was still prohibited, but the restoration of private trade set off a boom in intra-Asian commerce.
Word of the enormous profits to be made in delivering silver to China quickly spread throughout the Iberian merchant networks. The Englishman Ralph Fitch, who travelled to the Portuguese bases throughout the Indian Ocean between 1583 and 1591, reported that «when the Portugals go from Macau in China to Japan, they carry much white silk, gold, musk, and porcelains; and they bring from thence nothing but silver. They have a great carrack which goes thither every year, and she brings from thence every year about six hundred thousand cruzados; and all this silver of Japan, and two hundred thousand more in silver which they bring yearly out of India, they employ to their great advantage in China» (Hakluyt Reference Hakluyt1903–1905: V, p. 498 [spelling modernised by author]). The Spanish Crown, which had ceded the Spice Islands to the Portuguese in the Treaty of Tordesillas, sought to challenge Portuguese domination of the Japanese and Chinese markets by dispatching expeditions to the Philippine archipelago. Manila Bay had long been a trading post that attracted Chinese and Japanese seafarers, who exchanged silks, porcelain and metal goods for gold, beeswax and forest products. The Spanish force that subdued the Tagalog chieftains of Manila Bay in 1571 had been ordered to establish a port of call that would provide access to the rich China trade. The founding of the Spanish colony at Manila created a new route of access to American silver through the trans-Pacific galleon voyages, and Chinese traders quickly capitalised on this new opportunity. In 1575, more than a dozen Chinese junks made port at Manila, and by 1584 some 25–30 junks were arriving each year. In 1593, the Spanish Crown—now fearing a haemorrhage of silver from its American colonies to China—backpedalled by establishing rules restricting the galleon trade between Manila and Acapulco to two ships per year bearing a maximum of 500,000 pesos. But the vested interests of Manila's colonial settlers, as well as Mexican merchants and colonial authorities in the profits of the China trade, ultimately prevailed against royal inclinations to halt the galleon trade altogether (Bjork Reference Bjork1998).
The export of Latin American silver—both via the trans-Pacific galleon trade and through re-export of Spanish silver from European nations across the Indian Ocean—was driven in part by the mounting appetite of European consumers (and European colonials in Spanish America) for artisanal wares from China such as porcelain and silk. But as Fitch and other European merchants readily recognised, conveying silver to China was immensely lucrative. Chinese hunger for silver was expressed through its price (relative to gold and other commodities), which was far higher than in Europe or the Americas. As Adam Smith would later observe in The Wealth of Nations, «there is scarce any commodity which brings a better price [in China and India]; or which, in proportion to the quantity of labour and commodities which it costs in Europe, will purchase or command a greater quantity of labour and commodities [in Asia]». Because of the mutual advantages of this trade to Asians and Europeans alike, «the silver of the new continent seems in this manner to be one of the principal commodities by which the commerce between the two extremities of the old one is carried on, and it is by means of it, in a great measure, that those distant parts of the world are connected with one another» (Smith Reference Smith1937, pp. 206–207). Thus, the arbitrage profit generated by delivering silver to China was the mainspring for creating the first truly global trading system (Flynn and Giráldez Reference Flynn and Giráldez1995).
Stimulated by Chinese demand for silver, East Asian maritime trade thrived, spurring rulers throughout the region—with the notable exception of the Ming itself—to promote foreign trade as advantageous to their domestic economies (von Glahn Reference Von Glahn and Bentley2019). After securing unified control over Japan in 1602, the Tokugawa shogun Ieyasu embraced foreign commerce and negotiated trading arrangements with European merchants and Southeast Asian potentates. The arrival of the Dutch in the first decade of the 17th century under the aegis of the Dutch East India Company (VOC) introduced a new institution—the chartered trading company—that challenged and soon displaced Portuguese traders from East Asian maritime commerce. Like the Portuguese, the Dutch focused on procuring silver from Japan for the Chinese market.
Measuring the scale of silver imports to China is difficult given the lack of any archival records for trade or customs data from Ming China. The prevailing practice scholars have adopted to determine the magnitude of the silver trade is to estimate the flow of silver exports from the regions that delivered silver to the Chinese market. This technique is fraught with conjectures, as the diverse range of estimates for silver imports to China shows (Table 1). Most scholars at least agree that imports of silver from Japan were substantially greater than imports from Spanish America (whether via the Atlantic or the Pacific) during the «Silver Century» of 1540–1640. My own estimates, which arrive at a substantially lower total for Japanese exports of silver to China, suggest that the volumes of silver originating in Japan and Spanish America during this period were roughly equal. (It should be noted that these estimates do not fully account for smuggling, which occurred on a scale that defies any effort to calculate.) The customs revenue (almojarifazgo) data from Manila indicates that the peak of silver exports from the Philippines to China occurred during 1595–1616, a period that accounted for 70 per cent of total Philippine silver exports before 1645 (von Glahn Reference Von Glahn1996, p. 124, table 8). The great surge in silver imports to China after 1620 came from Japanese mines rather than Spanish American ones.
ESTIMATES OF SILVER IMPORTS TO CHINA, 1550–1645
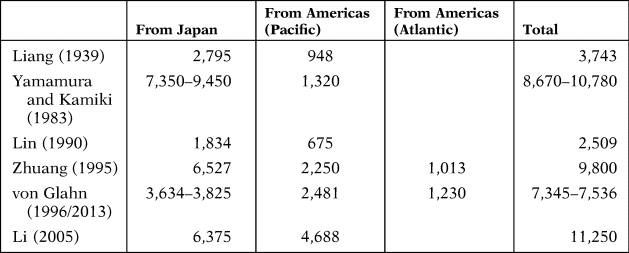
Note: All figures in metric tons.
Sources: Liang (Reference Liang and Liang1939): pp. 173–179; Yamamura and Kamiki (Reference Yamamura, Kamiki and Richards1983): pp. 351–353; Lin (Reference Lin1990): p. 146; Zhuang (Reference Zhang1995): p. 3; von Glahn (Reference Von Glahn1996): p. 140, table 13; von Glahn (Reference Von Glahn and So2013): p. 32, table 2.6; Li (Reference Li2005): p. 165.
The decline in trade between Manila and China after 1615 resulted from independent but convergent trends. In a memorial of 1609 Pedro de Baeza, a Spanish official who had served for 30 years in the East Indies, urged the Spanish Crown to exploit the immensely profitable opportunity to trade New World silver for Chinese goods, including gold: «forasmuch as throughout all the kingdom of China there is an enormous quantity of fine gold of more than twenty-two carats touch, if this was brought to New Spain, or to Castile, a profit of 75 or 80 per cent could be made» (cited in Boxer Reference Boxer1967, p. 425). The arbitrage profit to be made by exporting silver to China, Baeza argued, would fully offset Spain's chronic deficits in trans-Pacific trade. Yet Spanish colonial administrators in both Mexico and Manila deplored the loss of silver to China, which they estimated to be as much as 5 million pesos (equivalent to 128 tons, surely an exaggerated figure) per year, and sought to interdict this drain of silver out of the empire (Atwell Reference Atwell1982). In addition, aggressive actions by the VOC to wrest the Chinese market away from its Iberian rivals severely disrupted commercial traffic between Manila and China. The Dutch attempt in 1622 to seize Macau was repulsed, but after establishing Fort Zeelandia on Taiwan the following year, the VOC supplanted the Portuguese as the primary European intermediary in Sino-Japanese trade. Moreover, Spanish American silver had to compete with Japanese silver exports, which soared after 1610 (Figure 3).
Although some Ming statesmen were wary of the destabilizing effects of foreign trade, others believed that foreign silver was a commodity of great value to the Chinese economy. In 1630, during a brief renewal of the maritime ban, the Fujian native He Qiaoyuan urged the court to open China's doors to the rich profits that foreign trade yielded:
By the «Eastern Ocean» we mean Luzon, which is populated by the Portuguese [sic]. Their country contains silver mountains, the product of which the foreigners mint into silver coins in prodigious quantities. When our Chinese subjects journey to trade in the «Western Ocean» (i.e., continental Southeast Asia and the Indian Ocean) they trade the goods we produce for the goods of others. But when engaging in Luzon they have designs solely on silver coins…. A hundred jin of Huzhou silk yarn worth 100 taels of silver can be sold at a price of 200 to 300 taels there. Moreover, porcelain from Jingdezhen as well as sugar and fruit from my native Fujian all are avidly desired by the foreigners.
Although mistaken in thinking that the silver coin Chinese merchants brought from Manila was mined and minted in the Philippines, He was doubtless correct in underscoring the real economic benefits of silver imports both to Fujian and China as a whole. Foreign markets ensured employment for weavers, potters and merchants, whose waxing affluence augured higher standards of living for all (He Reference He1641, pp. 23.30b–34a). Indeed, the court quickly rescinded the ban.
But by 1640 the high tide of silver imports into China had crested. Tokugawa Ieyasu's successors, having firmly consolidated their rule over Japan, saw less advantage in overseas trade, particularly in light of the alarming success of the Jesuit missionaries who accompanied Portuguese traders in winning converts among the Japanese populace. Beginning in 1636, the shogunate enacted a series of measures (which in retrospect came to be called the «seclusion policies» [sakoku]) to constrict the exposure of their subjects to Europeans: it withdrew the overseas trading privileges of Japanese merchants, expelled Portuguese traders together with the Jesuits from Japanese soil, and confined Chinese and Dutch merchants to the single port of Nagasaki, where trade was supervised directly by shogunal officials. The dissolution of Portugal's alliance with Spain in 1640 severed trade between Manila and Macau, and the bloody suppression of the uprising by Manila's Chinese inhabitants in 1639 along with Dutch depredations sharply curtailed Philippine trade with China as well.
As mentioned earlier, some scholars contend that a steep decline in the import of foreign silver beginning in the late 1630s directly resulted in the demise of the Ming dynasty. The origins of this «crisis thesis» go back to the seminal studies of Spain's Philippine trade by Pierre Chaunu, who asserted that China's commercial ties to European trade networks drew it into orbit around a global economy «dominated by the powerful pulsations of the Atlantic zone» (Chaunu Reference Chaunu1962, p. 570; see also Chaunu and Chaunu Reference Chaunu and Chaunu1953). Historians of China, unduly influenced by this conception of a monolithic world economy, acceded to the premise that Ming China was beholden to uninterrupted infusions of foreign silver to maintain its economic prosperity. The most vigorous proponent of this view, William S. Atwell, contends that the downturn in silver imports in the final years of the Ming was the crucial factor in a «17th-century crisis» that culminated in the fall of the dynasty in 1644 (Atwell Reference Atwell1982, Reference Atwell1986, Reference Atwell2005).
However, the volume of silver imports into China during the last years of the Ming declined only relative to the very high level attained in 1635–1639. According to my calculation, the annual average of silver imports fell from 115 metric tons in 1636–1640 to 50 tons in 1641–1645 (von Glahn Reference Von Glahn1996, p. 232, table 23). But my estimate of an annual average of 70 tons of silver imports during the previous decade (1626–1635) is much closer to the 1641–1645 level. Even if we accept the 1636–1640 level of imports as the norm and conclude that there was a «deficit» of 325 tons during the period 1641–1645, this «deficit» amounted to only 4.3 per cent of the total quantity of silver (approximately 7,500 tons) imported during the previous century (and of course an even smaller proportion of the total silver stock if we accepted the higher estimates of silver imports shown in Table 1, not to mention existing domestic supplies). A 4.3 per cent decline in the total stock of silver most likely would have had only a modest impact on China's money supply and could not have caused the drastic effects ascribed to it by the crisis theorists.
More recently, the Taiwan scholar Li Longsheng has provided new quantitative evidence that supports scepticism about the claims for the catastrophic impact of diminished imports of silver on the late Ming economy. Based on the calculations of the value of Chinese exports (especially raw silk and silk cloth) and data on ship traffic, Li actually arrives at much higher figures for silver imports from Japan into China during the last years of the Ming. His data indicate that the level of silver imports to China remained high until 1641, and then fell by one-third the following year. Similarly, Li's estimates for silver imports from the Philippines show a large drop beginning only in 1643 (Table 2 and Figure 1). Li also concurs with my conclusion that the decline of silver imports resulted primarily from domestic social and economic turmoil in China—the outbreak of widespread peasant rebellions, as well as epidemic disease in many parts of China during the 1630s, is believed to have resulted in massive mortality—rather than an interruption in supply because of disturbances in the global economy (Li Reference Li2005, p. 19).
CHINESE EXPORTS OF GOODS AND IMPORTS OF SILVER, 1636–1644

Note: Figures in metric tons of silver. Li gives figures in liang, which have been converted to metric tons here.
Sources: Li (Reference Li2005): p. 166, tables 5-6.
CHINESE SILVER IMPORTS, 1636–1644.

Atwell himself did not attempt to quantify aggregate silver imports into China, and his analysis is grounded in a simplistic and flawed invocation of the quantity theory of money. In his view, the decline of silver imports, exacerbated by confiscatory taxation, caused a dramatic contraction in the circulation of money that stifled the dynamic commercial growth of the late Ming period. The resulting rise in the price of silver entailed a sharp fall in the prices of goods, eroding both commercial and agricultural incomes. But price movements in fact did not follow this trajectory. Rice prices soared in 1638–1642 as a result of catastrophic harvests and dire famine conditions. The prices of raw cotton and cotton cloth indeed fell during these years, but quickly recovered by the end of the 1640s, while export prices for silk textiles—China's most important export—remained stable throughout the 1640s (Kishimoto Reference Kishimoto1997, pp. 139–141; von Glahn Reference Von Glahn and So2013, p. 34). The enormous leap in silver-denominated rice prices is hardly consistent with claims that silver was withdrawn from circulation.
The argument for a scarcity of silver also is contradicted by another trend observed in the late Ming: the falling value of silver relative to gold. The gold price of silver steadily declined in China during the first half of the 17th century, sinking to the prevailing international level exactly at the moment the Ming dynasty fell (von Glahn Reference Von Glahn1996, p. 128, figure 4). Thus, the value of silver relative to gold reached its nadir precisely when, according to the crisis hypothesis, it should have peaked. The movement of the gold–silver exchange ratio, like the inflation in grain prices, is inconsistent with the claim of a silver shortage.
3 HIATUS: THE KANGXI DEPRESSION (1660–1690)
The real turning point in Chinese importation of foreign silver came after the fall of the Ming dynasty in 1644, in the last third of the 17th century. Quantitative information for the Manila galleon trade is limited, but ship traffic between Manila and China plunged after 1640. Extrapolating from almojarifazgo receipts, only about 140 tons of silver was exported from Manila to China during the half-century from 1640 to 1690 (Figure 2). Records of Japan's foreign trade, which contain actual silver export data for 1648–1672, reveal that silver exports to China (primarily in exchange for silk imports) remained steady at slightly under 40 metric tons annually from 1648 to 1657, then soared to an average of 75 tons annually during 1658–1666. In response to this drain of bullion, the Tokugawa shogunate abruptly prohibited all silver exports in 1668. Although the ban was relaxed in 1672, new obstacles to international trade imposed by the shogunate—including forcing foreign merchants to negotiate with a new state-organised cartel of silk buyers—depressed silver exports. During 1672–1683, Japanese silver exports fell to an average of 23 tons per year. Further restrictions imposed in 1683 and the debasement of Japanese silver currency enacted in 1695 brought silver exports to a virtual halt (Figure 3).
PHILIPPINE EXPORTS TO CHINA, 1600–1700 (EQUIVALENT IN METRIC TONS OF SILVER). EXTRAPOLATED FROM ALMOJARIFAZGO RECEIPTS.

JAPANESE SILVER EXPORTS TO CHINA, 1600–1700 (METRIC TONS).

Chinese imports of foreign silver also were impeded by the ban on foreign trade imposed by the new Qing dynasty (1644–1911) during 1661–1683 as part of its effort to bring to heel the Zheng clan of merchant-princes, who had established their own separatist regime in Taiwan. But enforcement of this interdiction, like the earlier Ming prohibition, was sporadic. More significantly, the onset from c. 1660 of a protracted economic torpor—which historians have dubbed the «Kangxi Depression», after the reigning Qing emperor—sharply curtailed the market demand that had sustained the high level of silver imports during the «Silver Century». The devastating civil wars of the 1630s-1640s (far more ruinous than the Qing conquest, which was relatively bloodless) induced a demographic collapse—roughly estimated at 20 per cent of the peak population of 192 million reached in 1630 (Cao Reference Cao2000, p. 451–452)—and economic turmoil that lingered long afterwards. From 1655, a general decline in prices, rents and land values set in that lasted until the 1690s. Rice and cotton prices declined in virtually perfect synchrony, showing that the depression affected agriculture and manufacturing in equal measure (von Glahn Reference Von Glahn and So2013, p. 41, figure 2.11).
From the perspective of some Chinese observers, the economic depression was a direct consequence of the interruption of foreign trade, and silver imports in particular, by the Qing maritime ban instituted in 1661. Around 1680, the governor of Jiangsu, Mu Tianyan, contrasted the current economic doldrums with the prosperity of the 1650s:
I still remember that in 1649–50, before maritime trade was proscribed, the marketplaces were filled with foreign goods. Buyers and sellers mostly used foreign silver coins as the medium of exchange, and thus these coins circulated widely in every province. But nowadays not a single foreign coin is to be had (cited in von Glahn Reference Von Glahn1996, p. 217).
Around the same time another prominent official, Jin Fu, warned the court of the deleterious effects of the maritime ban: «ever since the measures banning foreign trade and forcing the evacuation of the coastal population were enacted, not a single plank of wood has set out to sea. After the passage of twenty years, the circulation of silver shrinks day by day, and sellers cannot dispose of their mounting inventories of goods». Asserting that «silver indeed is the lever by which the treasures of the earth are controlled», Jin admonished the court to lift the ban on foreign trade and restore the prosperity China had enjoyed in the early years of the dynasty (cited in von Glahn Reference Von Glahn1996, p. 216).
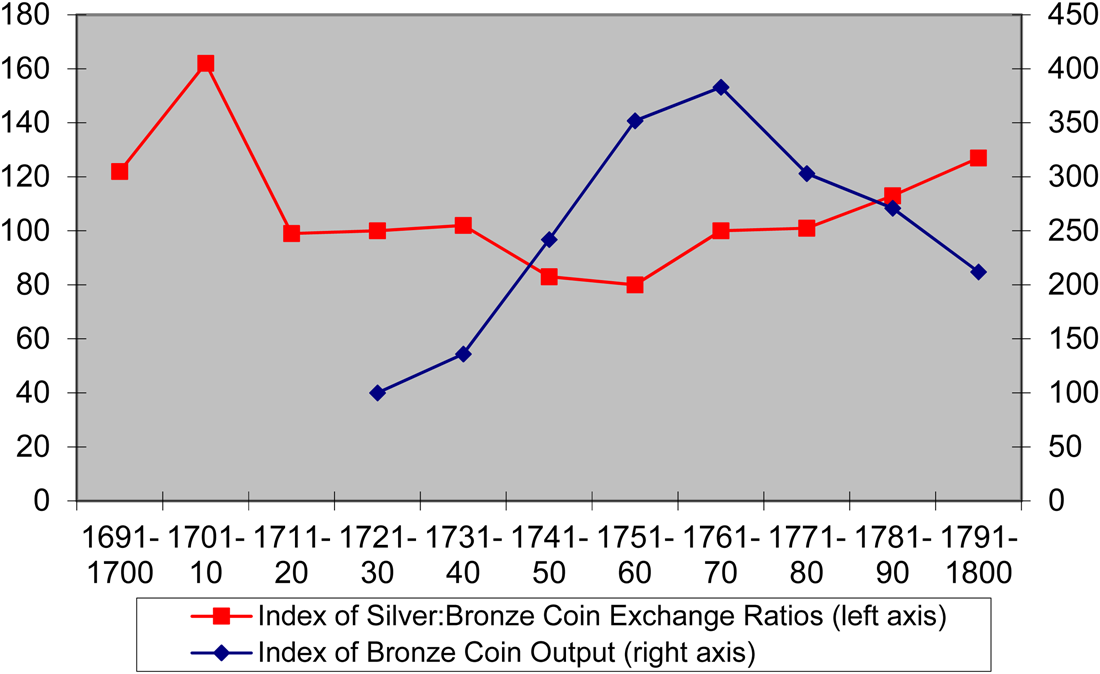
But we cannot accept at face value such assertions that the Kangxi Depression resulted from interruptions in the supply of silver to the Chinese market. The slump in prices began around 1655, a full decade before the cessation of silver imports (as Figure 3 shows, the 1655–1665 decade actually witnessed a pronounced increase in silver imports compared to the previous decade)Footnote 1. Moreover, the end of the maritime ban in 1683 brought no immediate relief. Economic doldrums persisted, and prices and interest rates only began to rise—the onset of a sustained, century-long inflationary trend—after 1700. Moreover, the economic efflorescence of the 18th century was sustained by a growing money supply fuelled mostly by a sharp increase in mint output of bronze coin rather than by silver imports (Figure 6).
The prolonged deflation of the Kangxi Depression should be understood in terms of a diminished demand for goods rather than a consequence of reduced silver imports. The falling labour/land ratio yielded higher wages and low rents, making farming less profitable and landownership a less attractive investment. As expectations of prosperity waned, investment in production declined. Ironically, despite a «shortage» of labour, unemployment in artisanal and manufacturing industries rose, weakening consumer demand even more and causing prices to fall even lower. Deflation discouraged spending, and the preference for holding money caused the value of bronze coin to rise in tandem with silver—indeed, even more dramatically.
4 REVIVAL OF SILVER IMPORTS IN THE 18TH CENTURY
As Figure 2 shows, silver imports from the Philippines rose once the Qing government lifted the maritime ban in 1683, following its conquest of the renegade regime in Taiwan. Contrary to long-abiding assumptions about the insularity of the Chinese empire, the Qing government adopted what one scholar has recently described as «open-door» policies towards foreign trade that severed trading privileges from the diplomatic protocols of the tributary system (Zhao Reference Zhao2013). With the exception of a brief interdiction (spurred by national security considerations) of maritime relations with Southeast Asia during 1717–1727, China's foreign trade flourished throughout the 18th century. The English author of an encyclopaedia of commerce published in London in 1751 described the disposition of the Chinese to engage in foreign trade in the following terms:
At present … by opening commerce with other counties, the Chinese have increased the means of enriching their own. They now not only suffer, but encourage both near and distant nations… to come and trade with them; and bring them the most valuable commodities; and, at the same time, allow their own people unto a great number of foreign parts, whether they carry their silks, porcelain, and other curious manufactures and knick-knacks, as well as their tea, medicinal roots, drugs, sugar, and other produce. They trade into most parts of East India; they go to Batavia, Mallaca, Ache, Siam, etc. No wonder then that it is so opulent and powerful, when all the four parts of the globe contribute to make it so (Postlethwayt Reference Postlethwayt1751, vol. 1, p. 492)Footnote 2.
In 1760, the Qianlong Emperor, angered by the impudence of a British merchant who audaciously dispatched a letter (written in Chinese) to the court seeking more liberal terms of trade, decreed that henceforth all European merchants would be confined to the port of Guangzhou (Canton) and must conduct business through a cartel of designated Chinese counterparts. Despite these restrictions, European trade with China boomed in the second half of the 18th century. The main obstacle to further growth of Sino-European trade was not political interference by the Qing government but the imposition of trade cartels in the form of «East Indies» chartered trading companies by all of the major European commercial nations.
Silver imports rose steadily along with the remarkable economic growth of China across the 18th century. The English East India Company (EIC), having abandoned efforts to crack the Dutch monopoly on Southeast Asian spices, achieved a dominant position in European trade with China (Figure 4). The EIC also became the main European supplier of silver to the Chinese market. Before 1785, imports of silver to China from Europe fluctuated with the vicissitudes of British foreign trade, with notable declines during the Seven Years' War and the American War of Independence. Overall, the inflow of foreign silver exhibited a steady and dramatic increase across the 18th century, from under 1 million pesos annually in 1719–1726 to nearly 3.5 million pesos (roughly 90 tons) per year during 1785–1791 (Figure 5). The year 1785 marked a key turning point in this inflow of foreign silver. Not only did the total volume of Western trade at Guangzhou double within the space of a few years, but following its independence from Britain, the fledgling U.S.'s merchant marine was liberated from the EIC monopoly and able to trade directly with China. American merchants enjoyed the advantage of ready access to Mexican silver. In addition, «country traders» (British merchants who circumvented the EIC monopoly by engaging in intra-Asian trade) began to rival the EIC in their share of the China trade (Figure 4). Finally, the EIC, buoyed by sharply rising sales of Indian cotton and opium to Chinese consumers, began to finance its China trade with bills drawn on London rather than payments in specie. As a result, the spectacular increase in silver imports to China at the turn of the 19th century was driven almost entirely by the exponential growth of Sino-American trade.
SHIPPING TONNAGE AT GUANGZHOU, 1719–1833.
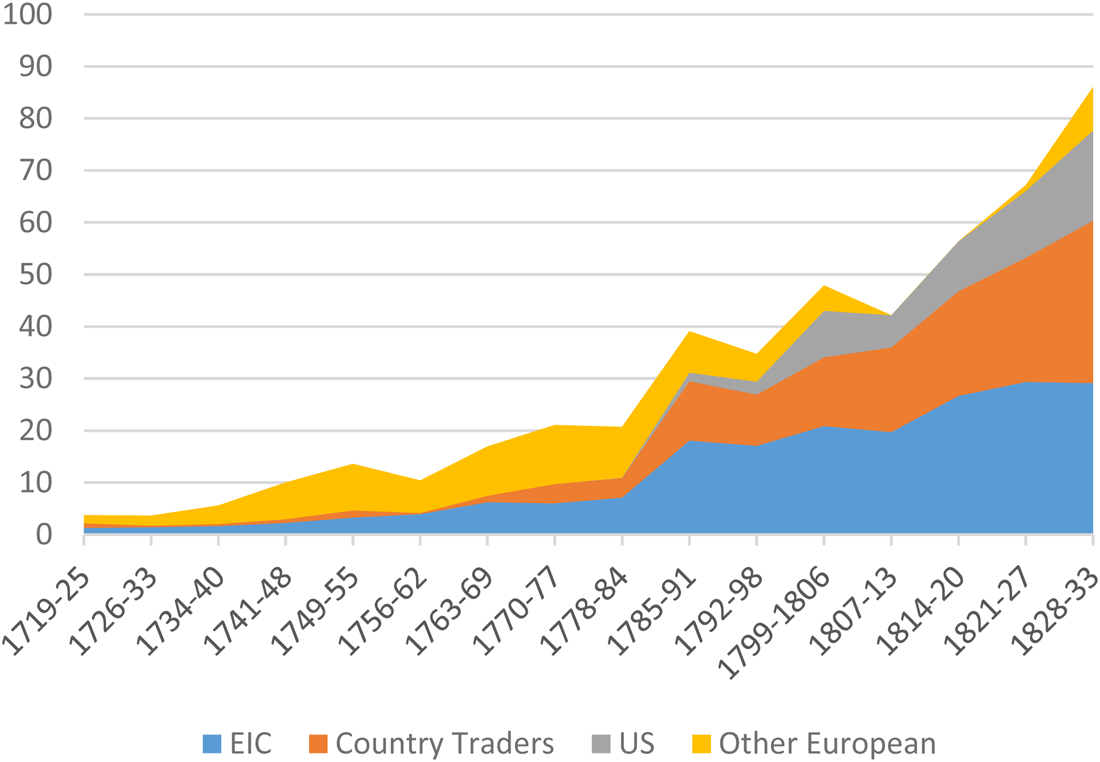
COUNTRY SHARE OF SILVER IMPORTS TO CHINA, 1719–1833.

The data presented in Figure 5 do not include the flow of silver across the Pacific via the galleon trade and smuggling, which also swelled in the 18th century. Ship traffic between Manila and China—increasingly centred on the port of Xiamen in Fujian—rose dramatically after the lifting of the Qing maritime ban, reaching its peak level between 1720 and 1740 (Ruiz Stovel Reference Ruiz Stovel2019). Unfortunately, we lack quantitative data for silver imports from the Philippines to China during the 18th century, especially since much if not most of the silver exported from Mexico was shipped clandestinely. The Extracto historial commissioned by the Spanish Crown in 1736 reported that commercial traffic between New Spain and the Philippines regularly exceeded the royally-decreed limit of 600,000 pesos for the galleons by 2 million pesos annually in the years before 1712, and rose to as many as 4 million pesos in the 1720s (Abreu Reference Abreu, Blair and Robertson1736, pp. 241, 293), at a time when silver imports into China via Europe averaged only 1 million pesos annually. Royal governors in Manila and Mexico reported that the contraband trade routinely exceeded 2 million pesos per year (Schurz Reference Schurz1959, pp. 189–190). After the British occupation of Manila (1762–1764), however, trade between the Philippines and China abruptly declined. Manila's overseas trade revived with the establishment of a direct route between Manila and Cadiz following the founding of the Royal Philippine Company in 1785 and the opening of the port of Manila to all European shipping in 1789. But as a consequence, the trans-Pacific galleon trade atrophied long before its official suspension in 1813 (Yuste López Reference Yuste López2007). The boom in imports of Latin American silver into China after 1785 occurred at a time when the galleon trade had been all but extinguished.
The rise in Chinese silver imports was of course a product of the surging output of silver at Latin American mines, notably in Mexico. In the 18th century, Mexico produced 80 per cent of the world's silver, and the pesos minted in Mexico were by far the most prevalent coin in international trade. Mexico's silver production rose from 4.4 million pesos per year c. 1700 to an average of 21 million pesos annually in the 1790s. The high tide of Mexican mint output occurred during the latter half of the reign of Carlos III (r. 1759–1788) and under his successor, Carlos IV (r. 1788–1808), reaching a peak annual output of 24 million pesos on the eve of Hidalgo's revolt in 1810 (Coatsworth Reference Coatsworth, Jacobsen and Puhle1986; Garner Reference Garner1988). Chinese imports of foreign silver coin paralleled the rising output of Mexican (and to a lesser extent Peruvian) mines.
As noted earlier, China experienced robust economic growth in the 18th century. The demographic recovery that began modestly around 1700 accelerated dramatically in mid-century, and by 1800 China's population had increased nearly threefold since the late 17th century. Prices rose as well, with land prices keeping pace with the inflation of rice prices (Table 3)Footnote 3. Increases in agricultural and industrial output promoted market integration and long-distance trade. Recent comparative studies have shown that long-distance trade in 18th-century China operated more efficiently than in most of Europe. Although the Yangzi Delta region lagged behind England in overall market efficiency, it achieved levels comparable to or surpassing continental Western Europe (Shiue and Keller Reference Shiue and Keller2007).
INDICES OF POPULATION, PRICES AND EXCHANGE RATIOS IN CHINA, 1600–1800
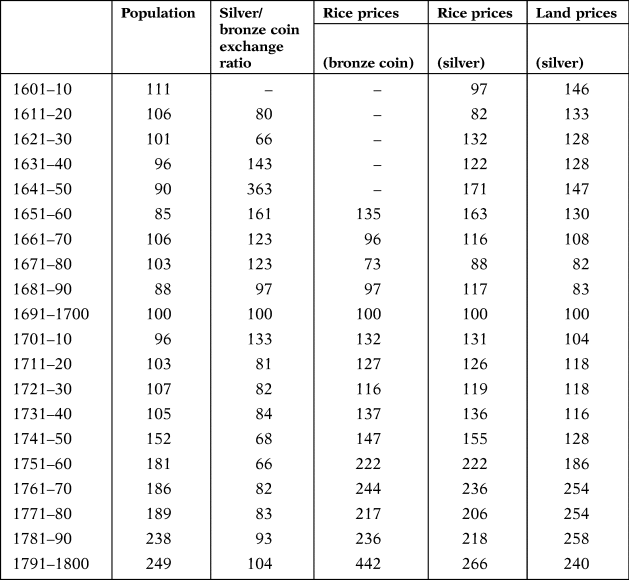
Note: 1691–1700 = 100.
Sources: von Glahn (Reference Von Glahn, Flynn, Giraldez and von Glahn2003): p. 191, table 9.1.
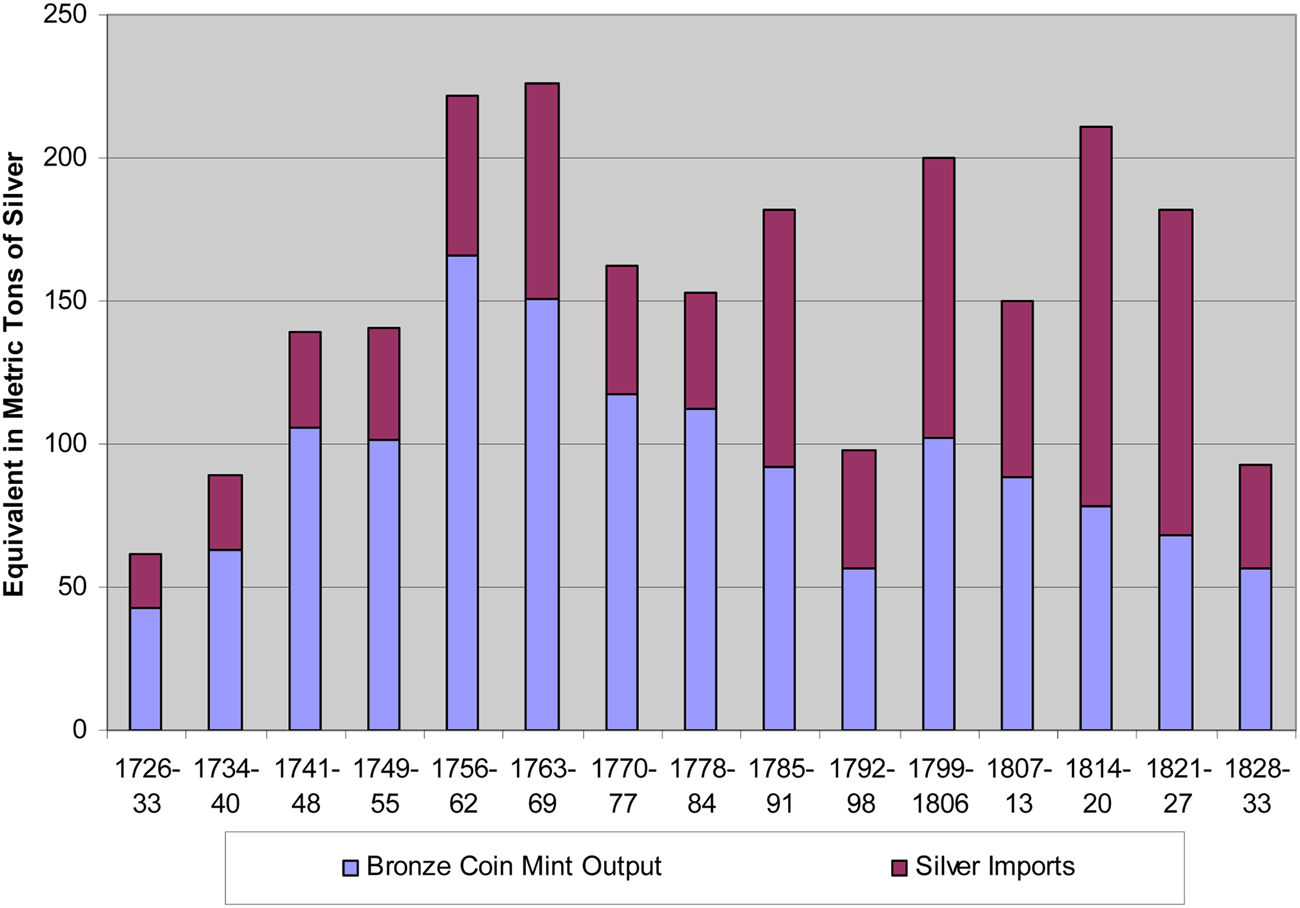
The influx of Latin American silver certainly helped to lubricate the wheels of commerce and sustain this protracted economic expansion. At the same time, the Qing government was able to tap newly-developed copper mines in southwestern China to increase the output of bronze coin at state mints nearly tenfold compared to the late 17th century. During 1740–1785, the average annual output of bronze coin was equivalent in value to 125 tons of silver at a time when silver imports averaged 50 tons per year (Figure 6). It was also precisely at this time that bronze coin rose in value relative to silver (Table 3, Figure 7)—exactly the opposite of what a crude quantity theory of money would predict. Rather than depressing its value, the abundance of bronze coin enhanced its reliability as a means of exchange and store of value. The demand for bronze coin was most acute in highly commercialised regions such as the Yangzi Delta, where bronze coin displaced silver as the monetary standard in the mid-18th century (Kuroda Reference Kuroda1987). Although bronze coin was always more convenient than uncoined silver ingots in everyday transactions, at this time we also see a preference for bronze coins for large-scale transactions such as sales of arable land and real estate (Kishimoto Reference Kishimoto1997, pp. 353–363).
GROWTH OF CHINA'S MONEY SUPPLY, 1726–1833 (ANNUAL AVERAGES).
INDICES OF SILVER:BRONZE COIN EXCHANGE RATIOS AND BRONZE COIN OUTPUT, 1691–1800 (1721–1730 = 100).
5. CREATION OF THE SILVER DOLLAR (YUAN) MONETARY STANDARD
In addition to the re-emergence of a bronze coin standard in private commerce in the 18th century (the state continued to employ an uncoined silver [sycee] unit of account in its fiscal accounts), Chinese began to use Spanish silver coins as means of exchange. Previously, imported silver coins were melted down and recast into ingots. Since this recasting was done by private assay shops and moneychangers rather than public authorities, a heterogeneous array of silver ingots of varying fineness proliferated across the vast territory of the Chinese empire. Commercial handbooks such as the Shanggu bianlan (Baedeker for Merchants, published in 1792) provided copious details on the differing sycee standards in scores of cities both large and small (Wu Reference Wu1822). The Spanish «Carolus dollars»—that is, pesos issued during the reigns of Carlos III and Carlos IV—that had begun to flood Chinese markets offered the convenience of highly uniform standards of weight and fineness, and thus were gradually adopted as means of exchange within the domestic economy.
Given their unfamiliarity with the iconography and inscriptions on peso coins, Chinese invented their own vernacular nomenclature to identify foreign coins. Prior to 1772, the Carlos III pesos featured a design, dating back to the Habsburg dynasty and Charles V in the 16th century, bearing on the obverse the royal coat-of-arms surmounted by the Spanish crown and on the reverse the two hemispheres of the New and Old Worlds underneath a crown and flanked by the pillars of Hercules. In China, these coins were dubbed «Double Pillar» or «Three Gong» coins. («Three Gong» because the Roman numeral III to Chinese eyes appeared as three consecutive gong 工 graphs; gong simply means «work» and had no semantic value in this context.) Carlos III changed the design of his coin in 1772, with a bust of the king replacing the twin hemispheres on the obverse while adding the pillars of Hercules to the Bourbon coat-of-arms on the reverse, a pattern followed by the Carlos IV coins as well. In China, these Carolus dollars were chiefly known as «Buddha Head» (fotoumian) coins, probably alluding more to the Spanish monarchs' identity as foreigners than any resemblance to the patriarch of the Buddhist religion.
Spanish coin first achieved success as a monetary standard in the southern coastal provinces of Guangdong and Fujian, where foreign trade was concentrated, in the mid-18th century. An examination of contracts for land sales and mortgages from Quanzhou, a major port in southern Fujian (adjacent to Xiamen, the hub of Sino-Philippine trade), reveals pronounced shifts in the preferred means of payments over time (Figure 8). Foreign silver coins began to replace sycee silver in Quanzhou in the 1730s. The «Buddha Head» coin is already mentioned in Quanzhou contracts in 1788, the year of its first issue, by which time foreign silver coins served as the means of payments in more than three-quarters of these land transactions. After 1810 sycee silver disappeared as a means of payment, and the majority of transactions specified payment in «Buddha Head» coins. From the 1830s, when China for the first time in centuries experienced a net outflow of silver, bronze coin reappeared as a means of payment, but more than two-thirds of contracts continued to be denominated in foreign silver coin. By the late 1860s, foreign coin (and the «Buddha Head» coin in particular) regained nearly complete dominance until the issue of China's own first official silver currency beginning in 1889.
MEANS OF PAYMENT IN QUANZHOU LAND SALE CONTRACTS, 1700–1900

By 1800, the Carolus dollar also had become established as the monetary standard in the markets of the Yangzi Delta. Zheng Guangzu, writing c. 1844, directly attributed the predominance of foreign silver coin in the major cities of the delta region to its utility as a medium of exchange:
Since 1683, when the embargo on maritime trade was repealed, merchants from various overseas countries have come to Guangdong and Fujian. Initially, though, only sycee silver was employed. We first hear of silver coins in common circulation in the early Qianlong reign (1736–95). After 1775, foreign silver coins began to appear in Suzhou and Hangzhou. At that time in my native prefecture of Suzhou coin-denominated remittance notes (qianpiao) were widely used along with fine sycee silver. Afterward the price of silver rose steadily, and foreign coins gradually displaced sycee silver. Among them were the «Horse-riding Swordsman» (i.e., the «Silver Rider» dukaton of the Dutch Republic), which weighed 0.94 liang Footnote 4 and had an exchange value of 900-plus bronze coins. The «Double Pillar» and «Buddha Head» coins both weighed 0.73 liang and had an exchange value of 700-plus bronze coins. From 1785 onward the «Buddha Head» coin was used exclusively. Subsequently foreign coins predominated because they were convenient to carry and exchange. Their value also increased. In the city of Suzhou the prices of all goods are fixed in silver coin (Zheng Reference Zheng1844, p. 6.44a).
Numerous contemporary observers confirm Zheng's assertion that foreign silver coin had become the dominant means of payment in market exchange (von Glahn Reference Von Glahn2007, pp. 56–57; Kishimoto Reference Kishimoto, Toyooka and Ōhashi2019, pp. 124–126). Yet at the same time, rural land sale contracts in the Yangzi Delta region continued to be denominated in bronze coin (as they had since the mid-18th century), while urban real estate sales in Suzhou and Shanghai were almost always transacted in sycee silver (Kishimoto Reference Kishimoto, Toyooka and Ōhashi2019, p. 124, table 10, p. 128, tables 11, 12). Thus domestic currencies continued to prevail in land sales (large but infrequent transactions, which perhaps best attest to the store of value function of money), even as imported silver coins demonstrated their superior versatility as means of exchange. Still, the circulation of foreign silver coins was restricted to the more commercialised southeastern coastal provinces, and they were hardly ever seen in the interior regions.
Ultimately, Carolus pesos—and subsequently Mexican Republican dollars—became so prevalent as the media of ordinary exchange that they became a new de facto monetary standard, expressed in Chinese as yuan (meaning «solid round coins», in contrast to Chinese bronze coins, with a perforated square hole at their centre) which gradually superseded the liang (or «tael») unit used for sycee ingots. The currency of the People's Republic of China today, the renminbi, is still denominated in yuan units, the term originally coined for the Carolus dollar.
6. NINETEENTH-CENTURY REVERSALS IN SILVER FLOWS
Chinese imports of foreign silver—overwhelmingly in the form of Spanish-American coins—rose sharply in the early decades of the 19th century, to roughly 4 million pesos (around 100 tons) per year (Figure 5). However, after 1827, the centuries-long inflow of foreign silver reversed, and for the next three decades, China suffered a net outflow of silver abroad (Table 4). It has long been argued that this «drain of silver» caused the acute economic distress that China experienced during the period 1820–1850 (the «Daoguang Depression», also named after the reigning emperor). Contemporary Chinese statesmen and a large body of modern scholarship have attributed the «drain of silver» to the dramatic increase in opium imports in the first half of the 19th century, although the volume of opium imports cannot account for more than half of the silver exports during 1827–1855. More recently, Man-houng Lin (Reference Lin2006) has proposed a different analysis that emphasises a global crisis in the production of precious metals and a worldwide economic depression that eroded demand Chinese exports such as tea. Neither of these explanations for the reversal in the flow of silver is satisfactoryFootnote 5. Instead, more attention must be paid to changes in the demand for particular types of money, both in China and in the global market.
NET FLOW OF SILVER FROM CHINA, 1818–1854

Note: All figures in millions of pesos.
Source: von Glahn (Reference Von Glahn and So2013): p. 50, table 2.10
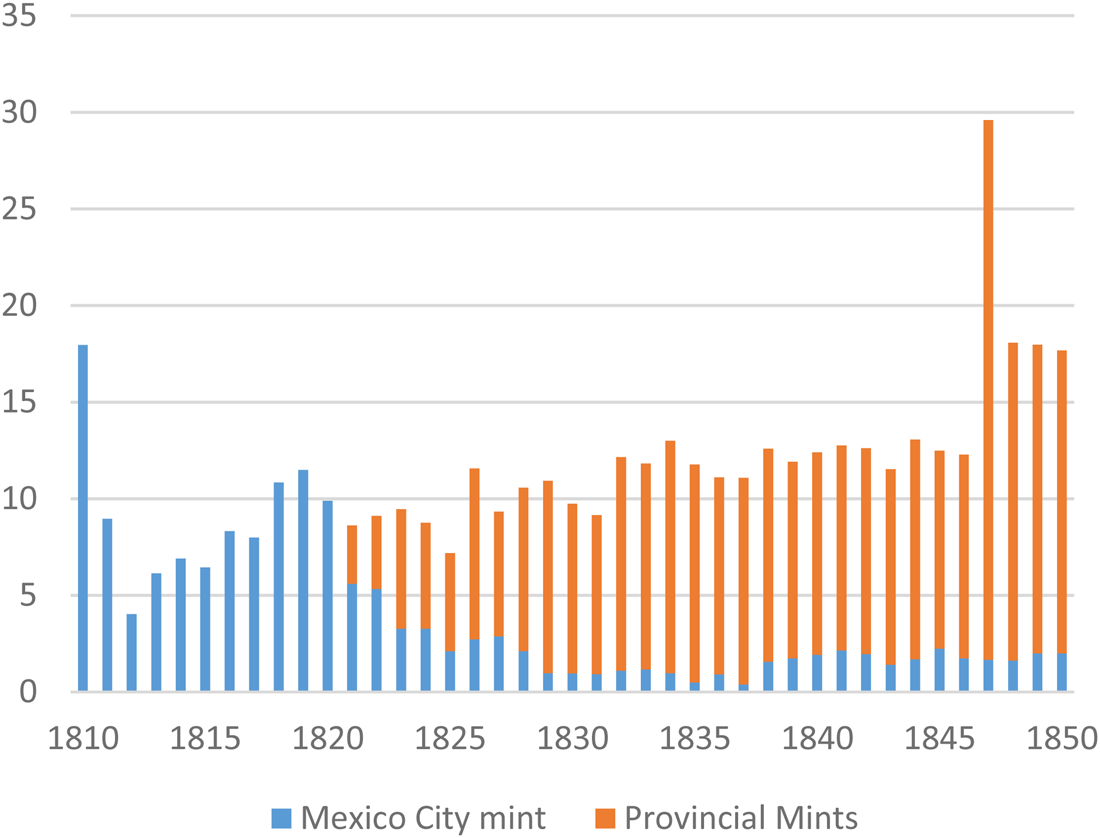
Man-houng Lin's argument that the silver crisis in China was precipitated by a marked decline in global production of silver is derived from Pierre Vilar's strongly bullionist analysis, in which economic cycles are tightly yoked to the flow of monetary metals (Lin Reference Lin2006, pp. 108–110, citing Vilar Reference Vilar1976). But as Alejandra Irigoin has demonstrated, the decreased flow of silver to China cannot be explained by a decline in Mexican silver production or coinage. The outbreak of Hidalgo's rebellion against Spain in 1810 initially resulted in a sharp fall in the output of Mexico's mints. During the decade of the 1810s, Mexican output of coin declined to about 40 per cent of its previous level, but still averaged 8 million pesos per year. After the founding of the Mexican Republic in 1821, mint production gradually rose from 9 million pesos annually in the 1820s to nearly 15 million per year in the 1830s and over 17 million annually in the 1840s (Figure 9). During the 1830s-1840s, when the net outflow of silver from China reached its peak, Mexican silver mining and coinage had recovered to its earlier levels. The significant difference was that in contrast to the uniform quality of Spanish imperial coins like the Carolus peso, the coins issued by the new Latin American republics varied widely in quality. Cash-strapped governments and private coiners readily resorted to adulterating the coin they issued. In Mexico, provincial mints—which minted the great majority of Republican dollars before 1857—were especially notorious for the poor quality of their coins (Irigoin Reference Irigoin2009).
OUTPUT OF MEXICO CITY AND PROVINCIAL MINTS, 1810–1850 (IN MILLIONS OF PESOS).
The marked deterioration in the quality and uniformity of Latin American coin after 1810 was especially noticeable in the irregularities in the designs stamped on the coins. Chinese merchant manuals published in the 1820s and after carefully discriminated among these provincial issues. Coins from the most prolific of the provincial Mexican mints, Guanajuato and Zacatecas (which produced 71 per cent of total Mexican coinage during 1821–1850), were stigmatised by Chinese merchants as «fishhook coins», in reference to their «G» and «Z» mint-mark monograms, which in Chinese eyes appeared similar to the Chinese graph for «fishhook» (written as gou 句). The Chinese merchant manuals uniformly agreed that initially the «fishhook» coins were sound, but over time their quality (in craftsmanship and metallic content) declined precipitously. Moreover, these coins were widely counterfeited in China, and thus became subject to steep discounting (von Glahn Reference Von Glahn2007).
We must keep in mind that a crucial feature of the silver market in China at this time was the marked difference in the currency circuits for imports and exports. Imports consisted almost exclusively of Spanish American coins (especially the Carolus pesos), while exports took the form of silver ingots destined for British India (some of this silver was minted into imitation Carolus pesos in India and then re-exported back to China). The cessation of the minting of Carolus pesos after the death of Carlos IV in 1808 and the steep discounts applied to other silver coins undoubtedly was one reason for the abatement of Chinese demand for foreign silver. But the chief reason for diminished silver imports between 1827 and 1857 was the Daoguang Depression, a protracted domestic economic crisis characterised by declining prices, real wages, land values and trade (von Glahn Reference Von Glahn2016, pp. 361–374, Reference Von Glahn, Pérez García and Sousa de Rocha2018).
To be sure, changes on the supply side also figured into the reversal of silver flows. As Figure 5 shows, after 1800 American merchants were by far the main suppliers of silver coin to the Chinese market, accounting for 83 per cent of total silver imports. The EIC ceased to import silver into China in the 1810s, but American merchants, who enjoyed a strongly favourable balance of trade with Spain's American colonies both before and after their independence, continued to carry great quantities of Mexican coin to China. The United States in 1792 had raised its mint price for silver above the prevailing world price (to an exchange rate of 15:1 with gold, in contrast to the European standard of 15.6:1), encouraging pesos minted in Mexico to flow into the United States. The ample supply of Mexican coin prompted the United States to cease minting its own dollars in 1806 and declare the Carolus dollar legal tender. Yet much of this imported silver was re-exported to finance U.S. trade with China. Between 1805 and 1834, American merchants exported 130 million silver pesos, one-third of Mexico's total coinage during that period, to China. But in 1834, the United States shifted monetary policy, lowering its price for silver below the international standard in order to draw in gold. Thus American merchants no longer had cheap silver to finance trade with China, and export of silver to China tailed off dramatically. However, despite the devaluation of silver, Mexican coins continued to flood the American market. Surging population growth and westward expansion fuelled the demand for even mediocre Mexican coin, despite the measures taken by the U.S. government to deter the circulation of low-quality coins. Only in the 1850s, after the gold strikes in California eased the demand for hard currency, did these measures bear fruit. The United States finally succeeded in demonetizing low-quality Mexican coins and removing them from circulation in 1857—coincidentally, the same year that China once again registered a net inflow of foreign silver (Schell Reference Schell2001, pp. 110–111; Irigoin Reference Irigoin2009, pp. 225–232).
The minting of Carolus dollars had ceased with the death of Carlos III in 1808, but preference for these coins in the Chinese market endured, resulting in a sharp appreciation in their value relative to the domestic bronze coin. In Suzhou, the hub of China's national market, the exchange rate of Carolus dollars relative to bronze coin, which had stabilised c. 1800 at around l:850, spiked to 1:1100–1200 in 1840, and then held steady around 1:1300–1400 throughout the 1840s. At the same time, we also find a strong appreciation of the Carolus dollar against sycee silver. The exchange rate that had prevailed since the late 18th century (0.72 tael) had overvalued the Carolus dollar (which contained only 0.684 liang of silver) by about 5 per cent. By 1840, Carolus dollars were being rated at 0.81–0.82 tael, or in other words a premium of 18–20 per cent. At its peak in 1855, the value of the Carolus dollar in the Yangzi Delta region exceeded 0.90 tael, or more than 30 per cent greater than its equivalent in silver bullion (von Glahn Reference Von Glahn2007, pp. 62–67).
Following the Qing defeat of the Taiping Rebellion in 1864, China entered a new phase of economic recovery and reconstruction. Global trade integration sharply increased the demand for Chinese export goods such as tea and silk, which—along with the substitution of domestic opium for imports from India—restored a positive balance in foreign trade. Imports of Mexican silver again surged. As in the past, the vast majority of the silver coins minted in Mexico was exported to China, a trend that accelerated after the United States adopted the gold standard in 1873 (Schell Reference Schell1996).
The flood of Mexican Republican dollars in the second half of the 19th century finally displaced the Carolus peso as the monetary standard in the major commercialised regions of China. The Mexican Republican dollar was adopted as the monetary standard in the British colony of Hong Kong in 1842, but it made little headway in Chinese markets before the resurgence of imported silver coin in the 1860s. Although Chinese and Western merchants in Shanghai had adopted the Shanghai tael, a purely abstract sycee money of account, as their monetary standard in 1857, Spanish and Mexican silver coins continued to serve as the life-blood of local commerce. From 1867 onward, the Mexican dollar traded at a premium of around 5 per cent above its official tariff (based on the Shanghai tael), and in some years of economic distress (1872, 1876, 1911–1912) its premium rose to 12 per cent or more (Zhang 2003). The 1889 gazetteer for Songjiang prefecture (which included the city of Shanghai) noted that the Carolus peso was becoming scarce, while «today merchants and shopkeepers without exception conduct business using the Mexican dollar as the monetary standard» (Songjiangfu xuzhi: 5.15a). Yet even after the Mexican dollar established its pre-eminence, the Carolus peso and its Chinese imitations were frequently used in retail trade. The Carolus peso also continued to trade at a premium in interior commercial centres such as Wuhu, the capital of Anhui province and a major hub of the tea trade, into the early decades of the 20th century (von Glahn Reference Von Glahn2007, p. 72).
Only in 1889 did the Chinese government—more specifically, the provincial administration in Guangdong—begin to issue its own yuan silver dollars (and also subsidiary copper coins), which the Qing court recognised as legal tender. The Guangdong dollar was minted according to the standards of weight and fineness established by the Mexican Republican dollar. However, the Qing court, stung by the dismal miscarriage of its abortive fiat currency experiment during the Taiping Rebellion, resisted appeals to reintroduce paper money. Both foreign and domestic banks issued their own banknotes, but the circulation of these bills was essentially limited to the major ports of foreign trade. By the end of the Qing dynasty, China still depended heavily on silver coin as its principal currency, while the various types of paper money in circulation altogether comprised only 12 per cent of the total money supply (Table 5). Imported Latin American coin comprised nearly half of the total money supply, and would retain its substantial place in the Chinese monetary system down to the demonetisation of silver and the inauguration of the fabi fiat currency by the Nationalist government in 1935.
ESTIMATES OF CHINA'S MONEY SUPPLY C. 1910

Note: Figures in millions of silver dollars.
Sources: Peng (Reference Peng1965): pp. 888–889; Yen-p'ing Hao (Reference Hao1986): p. 68, table 5.
7. CONCLUSION
World historians have placed great emphasis on Chinese demand for foreign silver and its effects on the world economy (Flynn and Giráldez Reference Flynn and Giráldez1995, Reference Flynn and Giráldez2002; Frank Reference Frank1998). This scholarship has given a different twist to earlier work on China's incorporation into the global economy, which decried the adverse effects of China's subordination to a monolithic system of international trade and its dependence on infusions of foreign silver. That body of scholarship considered the dynamics of the flow of silver into and out of China purely in aggregate terms, without distinguishing among the different types of silver, the commodity trades which they served, and the separate spheres of circulation for the various types of money employed by Chinese. Monetary diversity and heterogeneity of demand were abiding features of the monetary system of imperial China, which should caution us against economists' tendency to think of money as an undifferentiated aggregate. Kuroda Akinobu has rightly drawn attention to the «asymmetry» of monetary media in the premodern world, that is to say, «the difficulty of harmonizing heterogeneous demands for money and uneven supplies of currency» (Kuroda Reference Kuroda2008, p. 18; see also Kuroda Reference Kuroda2003). Kuroda particularly draws attention to the variation in the spatial range of money use in late imperial China, contrasting the monetary needs of local markets—dominated by highly seasonal demand for currency at harvest and tax collection times—with the needs of long-distance merchants for much more liquid monetary media. Bronze coin tended to disperse and settle in pools in local markets, remaining largely idle («stagnant» is Kuroda's term) most of the time. Silver instead was more mobile, flowing through higher-level currency circuits, and rarely settling in local markets (on this point see also Kishimoto Reference Kishimoto, Toyooka and Ōhashi2019). Yet silver, too, was subject to strong regional preferences, as can be seen in the dozens of distinct sycee tael standards that existed in 18th-century China, and the slow progression of the Carolus dollar yuan standard in the 19th century. When we recognise the different types of monetary demand at work in the Chinese economy, a more nuanced pattern of monetary circulation emerges that calls into question analytical models which reduce silver to a simple monetary quantum and treat the movement of silver merely as a reaction to shifts in commodity flows that served to restore equilibrium to the balance of payments in foreign trade.
Since the rise of silver as the principal form of money in China in the 15th century, the Chinese economy had relied on imports of foreign silver to provide the crucial elasticity to the money supply that fostered commercial growth. Indeed, the ties between the Chinese monetary system and international circuits of monetary exchange had a much longer history, dating back to the 12th century. But it is incorrect to conclude that the influx of foreign silver after 1540 created a dependency that subordinated the Chinese economy—which even in 1800 generated at least one-fifth of global economic output—to the vicissitudes of a hegemonic global economy dominated by Europe. The vectors of international silver flows underwent repeated and substantial alterations from the 16th to the 19th centuries, and the significance of foreign silver to the Chinese economy as well as the relationship of the Chinese economy to the global economy changed as well. Only through close attention to the demand for silver (and monetary media generally) within the Chinese economy can we begin to appreciate the reciprocal effects of the global trade in silver on the Chinese and Latin American economies, and how those effects changed over time.
ACKNOWLEDGEMENTS
This research has been sponsored and financially supported by GECEM (Global Encounters between China and Europe: Trade Networks, Consumption and Cultural Exchanges in Macau and Marseille, 1680-1840), a project hosted by the Pablo de Olavide University (UPO) of Seville (Spain). The GECEM project is funded by the ERC (European Research Council)-Starting Grant, ref. 679371, under the European Union's Horizon 2020 Research and Innovation Programme, www.gecem.eu. The P.I. (Principal Investigator) is Professor Manuel Perez-Garcia (Distinguished Researcher at UPO). This work was supported by H2020 European Research Council. This research has also been part of the academic activities of the Global History Network in China (GHN) www.globalhistorynetwork.com. Manuel Perez-Garcia is the director and founder of the GHN. I would like to thank the anonymous referees for their comments and suggestions.


 Open access