


Introduction
During the Pleistocene, Alpine glaciers repeatedly advanced into the mountain foreland, temporarily covering large parts of Northern Switzerland and neighboring regions (Fig. 1; Preusser et al., Reference Preusser, Graf, Keller, Krayss and Schlüchter2011). These glaciations had a significant geomorphic effect on their surroundings through glaciofluvial dissection and subglacial erosion of overdeepened basins, but also through accumulation of decameter-thick clastic deposits. The alternating phases of erosion and deposition (cf., Buechi et al., Reference Buechi, Graf, Haldimann, Lowick and Anselmetti2018) cause a major difficulty hindering Quaternary research in alpine environments, because the result is a fragmentary and incomplete geological record. This way, the remnants of entire glaciations may have been eroded and entirely obliterated by later ice advances (Hughes et al., Reference Hughes, Gibbard and Ehlers2019; Merritt et al., Reference Merritt, Gordon and Connell2019). Thus, the glacial stratigraphy and landscape history prior to the last glaciation remains intricate and poorly constrained not only in Northern Switzerland but in mountainous or polar terrestrial settings worldwide.
Quaternary glaciation history and related deposits in Northern Switzerland. (A) Sketch of timing and extent of ice advances (modified after Preusser et al., Reference Preusser, Graf, Keller, Krayss and Schlüchter2011; Schlüchter et al., Reference Schlüchter, Akçar, Ivy-Ochs and Reynard2021); MEG = most extensive glaciation, LGM = last glacial maximum, Hc = Holocene. (B) The corresponding, composite lithostratigraphic units, mainly glaciofluvial gravels, occur at different elevation levels (modified after Graf and Burkhalter, Reference Graf and Burkhalter2016). (C) Location of the study area (red box labeled ‘Figure 2’) in central Northern Switzerland (background: SRTM DEM, van Zyl, Reference van Zyl2001; JFTB = Jura fold-and-thrust-belt; URG = Upper Rhine Graben). The ice extent during the LGM (from Ehlers et al., Reference Ehlers, Gibbard and Hughes2011) is shaded white, and the main piedmont glacier lobes are labeled.

Previous studies have suggested the occurrence of up to 15 extensive glaciations of the Swiss Alps throughout the Pleistocene, but only five major phases of ice advance into the foreland could be pinpointed and their extents roughly mapped (Preusser et al., Reference Preusser, Graf, Keller, Krayss and Schlüchter2011; Graf and Burkhalter, Reference Graf and Burkhalter2016; Schlüchter et al., Reference Schlüchter, Akçar, Ivy-Ochs and Reynard2021). Four of them are attributed to the Middle Pleistocene, and are termed, from oldest to youngest, Möhlin, Habsburg, Hagenholz, and Beringen (Fig. 1; Graf, Reference Graf2009a; Preusser et al., Reference Preusser, Graf, Keller, Krayss and Schlüchter2011). While the Beringen Glacial has been correlated with reasonable confidence with marine oxygen isotope stage (MIS) 6 (ca. 150 ka; MIS after Lisiecki and Raymo, Reference Lisiecki and Raymo2005; Dehnert et al., Reference Dehnert, Lowick, Preusser, Anselmetti, Drescher-Schneider, Graf, Heller, Horstmeyer, Kemna and Nowaczyk2012; Lowick et al., Reference Lowick, Buechi, Gaar, Graf and Preusser2015), the chronostratigraphic positions of older glaciations are poorly constrained. It is also not entirely clear whether all of them represent separate full glaciations, or individual advances within a particular glaciation (cf., the threefold Late Pleistocene Birrfeld Glacial, Fig. 1; Preusser, Reference Preusser2004; Ivy‐Ochs et al., Reference Ivy‐Ochs, Kerschner, Reuther, Preusser, Heine, Maisch, Kubik and Schlüchter2008; Seguinot et al., Reference Seguinot, Ivy-Ochs, Jouvet, Huss, Funk and Preusser2018). Based on presumed correlative gravel deposits in the downstream-adjacent Upper Rhine Graben (Fig. 1), Preusser et al. (Reference Preusser, Büschelberger, Kemna, Miocic, Mueller and May2021) suggested a correlation of Habsburg with MIS 8 or 10 (ca. 270 ka or ca. 340 ka), and of Möhlin (the ‘most extensive glaciation’) with MIS 12 (ca. 420 ka; see also Dieleman et al., Reference Dieleman, Christl, Vockenhuber, Gautschi, Graf and Akçar2022b). Subdivision of the respective deposits was done through extensive and detailed fieldwork and further analyses (e.g., gravel petrographic and heavy mineral analysis) but gave rise to a patchwork of local morpho- and lithostratigraphic schemes that are not always straightforward to correlate (Graf, Reference Graf2009a).
Because geological archives are scarce, such uncertainties are not trivial to resolve. Promising approaches are the exploration of sedimentary records of previous lakes, often hosted in subglacial overdeepenings, that contain the most complete and best-resolved Quaternary successions in the region (e.g., Schlüchter, Reference Schlüchter1989; Nitsche et al., Reference Nitsche, Monin, Marillier, Graf and Ansorge2001; Preusser et al., Reference Preusser, Drescher‐Schneider, Fiebig and Schlüchter2005; Dehnert et al., Reference Dehnert, Lowick, Preusser, Anselmetti, Drescher-Schneider, Graf, Heller, Horstmeyer, Kemna and Nowaczyk2012; Buechi et al., Reference Buechi, Graf, Haldimann, Lowick and Anselmetti2018, Reference Buechi, Landgraf, Madritsch, Mueller, Knipping, Nyffenegger, Preusser, Schaller, Schnellmann and Deplazes2024; Schwenk et al., Reference Schwenk, Schläfli, Bandou, Gribenski, Douillet and Schlunegger2022a, Reference Schwenk, Stutenbecker, Schläfli, Bandou and Schlunegger2022b; Gegg et al., Reference Gegg, Anselmetti, Deplazes, Knipping, Madritsch, Mueller, Preusser, Vogel and Buechi2023; Schaller et al., Reference Schaller, Buechi, Schuster and Anselmetti2023; Schuster et al., Reference Schuster, Gegg, Schaller, Buechi, Tanner, Wielandt-Schuster, Anselmetti and Preusser2024), and of abandoned sandurs where glaciofluvial material was spared from erosion (e.g., Graf, Reference Graf2009a; Claude et al., Reference Claude, Akçar, Ivy-Ochs, Schlunegger, Rentzel, Pümpin, Tikhomirov, Kubik, Vockenhuber and Dehnert2017; Dieleman et al., Reference Dieleman, Christl, Vockenhuber, Gautschi, Graf and Akçar2022b; Pfander et al., Reference Pfander, Schlunegger, Serra, Gribenski, Garefalakis and Akçar2022). In the present study, we combined these two approaches, and present results from scientific drillings from an overdeepened trough, and from both drilling and outcrop investigations in a nearby paleochannel. Based on sedimentological analyses complemented by reflection seismics, we aim to reconstruct and refine the local- to regional-scale glaciation and landscape history, specifically throughout the Middle Pleistocene.
Study area and stratigraphy
The confluence area of the Aare, Reuss, and Limmat rivers in Northern Switzerland, frequently referred to as ‘Wasserschloss’, is a key site for the Quaternary geology of the northern Alpine foreland (Fig. 2; Dick et al., Reference Dick, Graf, Müller, Hartmann and Schlüchter1996). The ‘Wasserschloss’ is located about 50 km northwest of the Alpine front, at the eastern margin of the Jura Mountains (Fig. 1). The latter consist of Mesozoic sedimentary rocks (carbonates, marls, and siliciclastics) deposited in an epicontinental sea (Bitterli et al., Reference Bitterli, Graf, Matousek and Wanner2000; Bitterli-Dreher et al., Reference Bitterli-Dreher, Graf, Naef, Diebold, Matousek, Burger and Pauli-Gabi2007; Jordan et al., Reference Jordan, Wetzel, Reisdorf and McCann2008). In the early Paleogene, this sedimentary succession was uplifted on the forebulge of the approaching Alpine orogeny, while to the south of it, the Molasse Basin subsided (Pfiffner, Reference Pfiffner, Homewood and Allen1986; Burkhard and Sommaruga, Reference Burkhard and Sommaruga1998; Berger et al., Reference Berger, Reichenbacher, Becker, Grimm, Grimm, Picot, Storni, Pirkenseer, Derer and Schaefer2005). The deposition of heterogeneous Molasse sands, silts, and marls progressed northward, reached the southern part of the study area in the Oligocene, but stopped in the Late Miocene with the development of the Jura fold-and-thrust belt (JFTB; Burkhard, Reference Burkhard1990; Looser et al., Reference Looser, Madritsch, Guillong, Laurent, Wohlwend and Bernasconi2021; Madritsch et al., Reference Madritsch, Looser, Schneeberger, Wohlwend, Guillong and Malz2024). In the JFTB, the Mesozoic strata are folded and often steeply dipping, while they are little deformed and sub-horizontal farther north. The lithologically and structurally complex bedrock architecture gave rise to the study area’s varied topography, which is different from many other Quaternary sites of the Alpine foreland (Fig. 2; Ziegler and Fraefel, Reference Ziegler and Fraefel2009; Yanites et al., Reference Yanites, Becker, Madritsch, Schnellmann and Ehlers2017; Gegg et al., Reference Gegg, Deplazes, Keller, Madritsch, Spillmann, Anselmetti and Buechi2021).
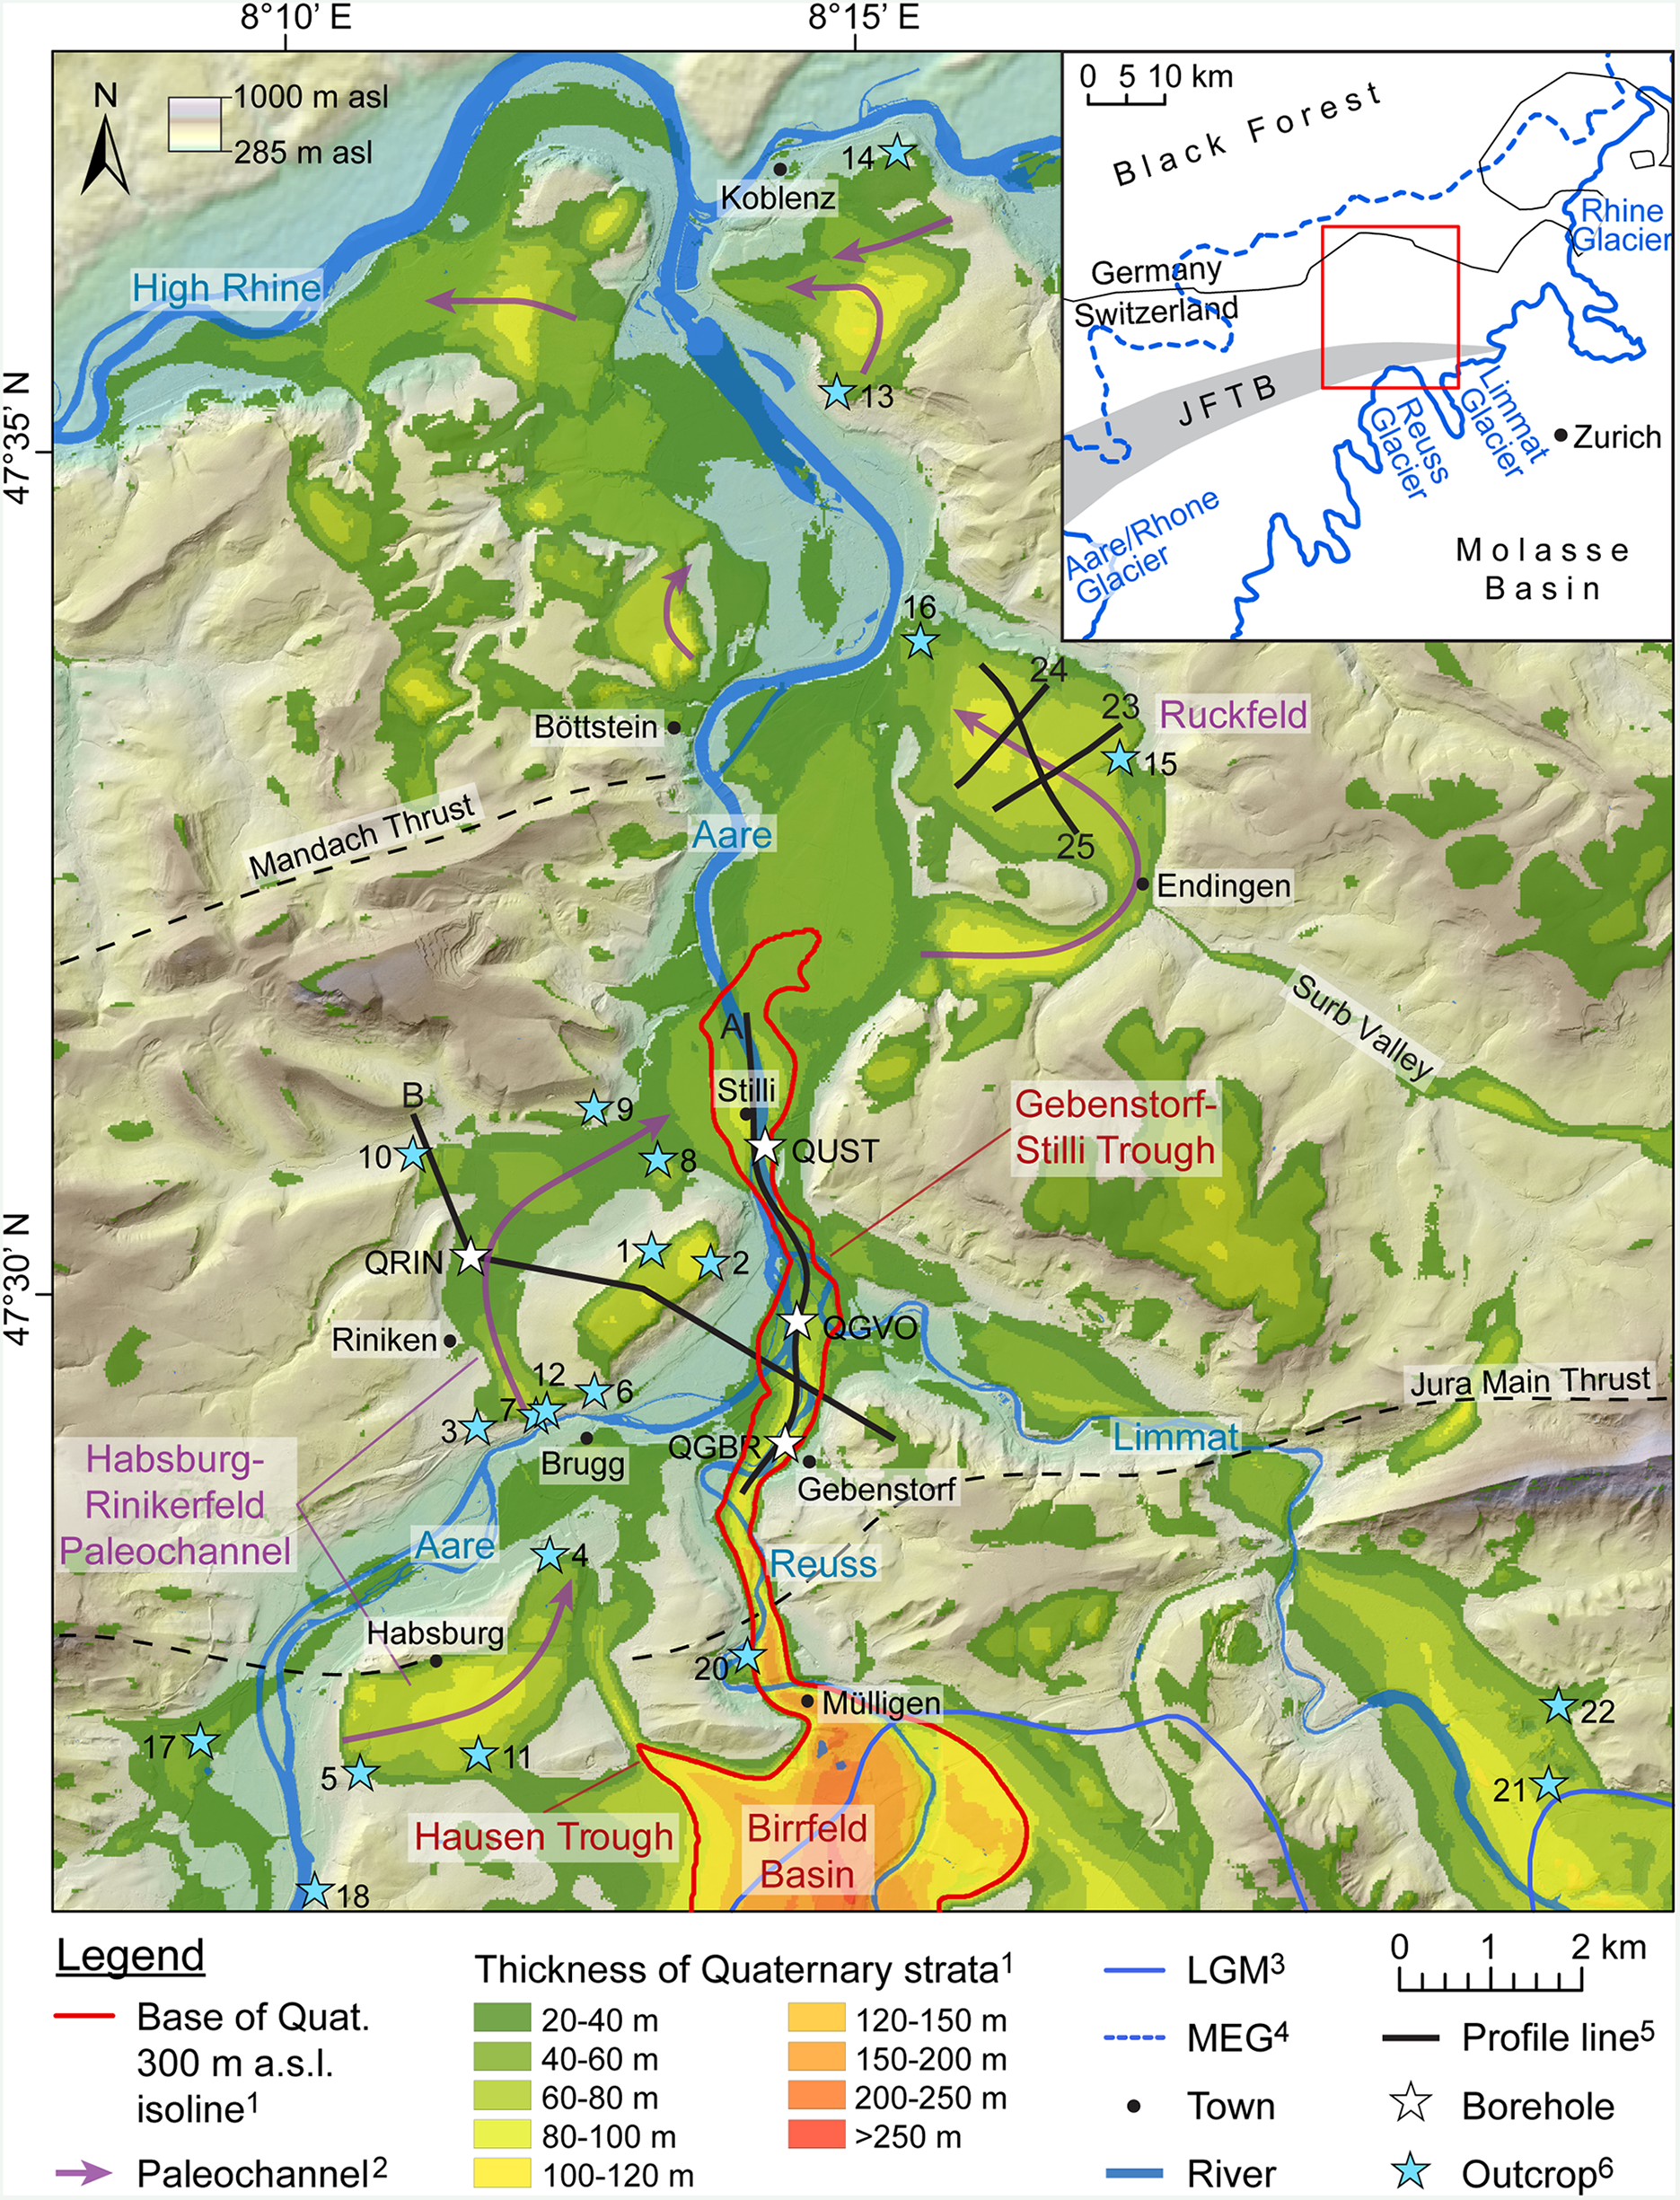
Overview map of the Wasserschloss area in Northern Switzerland (background: LiDAR DEM; Swisstopo, Reference Swisstopo2011). Inset shows the major geological units around the study area as well as the relevant paleoglacier lobes (see Figure 1). Legend notes: 1from Pietsch and Jordan (Reference Pietsch and Jordan2014), Gegg et al. (Reference Gegg, Deplazes, Keller, Madritsch, Spillmann, Anselmetti and Buechi2021), and references therein; 2after Graf (Reference Graf2009a); 3alpine ice extent of the last glacial maximum (Bini et al., Reference Bini, Buoncristiani, Couterrand, Ellwanger, Felber, Florineth, Graf, Keller, Kelly and Schlüchter2009); 4ice extent of the most extensive glaciation (Keller and Krayss, Reference Keller and Krayss2010); 5A and B refer to constructed sections (Figures 10 and 11, respectively); 23, 24, and 25 are seismic lines (Figure 9); 6outcrop numbers refer to Supplementary Table 2. Outcrops mentioned in the text: 5 (Götschtel), 6 (Hansfluhsteig), 9 (Haselloch), 10 (Alpberg), 13 (Hönger). Note: outcrop 19 lies slightly south of the map extent.
Regionally, the Quaternary was not only characterized by a trend of cooling climate and extensive ice advances, but also by repeated lowering of the fluvial base level (Schlunegger and Mosar, Reference Schlunegger and Mosar2011; Kuhlemann and Rahn, Reference Kuhlemann and Rahn2013; Yanites et al., Reference Yanites, Becker, Madritsch, Schnellmann and Ehlers2017). Remnants of two gravel units occurring at hill tops are referred to as ‘Höhere Deckenschotter’ (found at ∼520–600 m asl in the study area) and ‘Tiefere Deckenschotter’ (∼450–520 m asl), respectively, and represent the Early Pleistocene (Fig. 1; Akçar et al., Reference Akçar, Ivy‐Ochs, Alfimov, Schlunegger, Claude, Reber and Christl2017; Dieleman et al., Reference Dieleman, Christl, Vockenhuber, Gautschi and Akçar2022a; Thew et al., Reference Thew, Kälin, Cuenca-Bescós, Buechi, Penkman, Scheidt, Knipping, Maier, Urresti and Deplazes2024). Intercalated diamicts interpreted as tills suggest that the corresponding paleoglaciers already reached far into the foreland (Graf, Reference Graf1993, Reference Graf2009b). Along with a major base level drop, the Deckenschotter river valleys were abandoned, and a new drainage network established (Graf, Reference Graf2009a, b). In the Wasserschloss area, it consists of the Habsburg-Rinikerfeld Palaeochannel (HRPC; Fig. 2) and its northward continuation via the Ruckfeld area into the High Rhine Valley. Through this pathway, glaciofluvial drainage as well as glacial advances occurred repeatedly throughout most of the Middle Pleistocene (Graf, Reference Graf2009a; Gegg et al., Reference Gegg, Anselmetti, Deplazes, Knipping, Madritsch, Mueller, Preusser, Vogel and Buechi2023).
The main remnants of the Middle Pleistocene glaciations are glaciofluvial sediments referred to as Hochterrasse (high terrace) based on their position well above the modern valley bottom. An internal lithostratigraphic subdivision of the Hochterrasse has been achieved based on gravel petrographic and heavy mineral compositions, which show that gravel units of different provenance occur at similar elevations (Fig. 1; ∼350–420 m asl). In our study area, the Hochterrasse is thus subdivided into three units (Habsburg Gravel, Ruckfeld Gravel, and Remigen Gravel) which are named after their type locations (Bitterli-Dreher et al., Reference Bitterli-Dreher, Graf, Naef, Diebold, Matousek, Burger and Pauli-Gabi2007; Graf, Reference Graf2009a). These gravel units presumably represent three out of the four regionally identified Middle Pleistocene glaciations (Habsburg, Hagenholz, Beringen), and are correlated with the morphostratigraphically defined Upper, Middle, and Lower Hochterrasse, respectively, of the Lower Aare Valley farther downstream (Matousek et al., Reference Matousek, Wanner, Baumann, Graf, Nüesch and Bitterli2000). Occasional intercalated tills and glaciotectonic deformation in the Remigen Gravel and basal diamicts in the HRPC suggest that at least two of the Middle Pleistocene ice advances reached into the study area (Graf, Reference Graf2009a; Gegg et al., Reference Gegg, Anselmetti, Deplazes, Knipping, Madritsch, Mueller, Preusser, Vogel and Buechi2023).
The Middle Pleistocene presumably also marked the onset of overdeepening in the midlands of Northern Switzerland (i.e., the subglacial carving of basins into the bedrock below the fluvial base level; Cook and Swift, Reference Cook and Swift2012; Dürst Stucki and Schlunegger, Reference Dürst Stucki and Schlunegger2013; Gegg et al., Reference Gegg, Deplazes, Keller, Madritsch, Spillmann, Anselmetti and Buechi2021; Gegg and Preusser, Reference Gegg and Preusser2023; Buechi et al., Reference Buechi, Landgraf, Madritsch, Mueller, Knipping, Nyffenegger, Preusser, Schaller, Schnellmann and Deplazes2024; Tomonaga et al., Reference Tomonaga, Buechi, Deplazes and Kipfer2024). In the study area, these overdeepenings consist of the Birrfeld Basin and its two branch basins, the Hausen Trough and the Gebenstorf-Stilli Trough (GST; Fig. 2; Nitsche et al., Reference Nitsche, Monin, Marillier, Graf and Ansorge2001; Jordan, Reference Jordan2010; Gegg et al., Reference Gegg, Deplazes, Keller, Madritsch, Spillmann, Anselmetti and Buechi2021). These basins were eroded into the bedrock under high subglacial water pressure and became infilled with subglacial diamicts and gravels as well as with (mainly proglacial) lake deposits (Bitterli-Dreher et al., Reference Bitterli-Dreher, Graf, Naef, Diebold, Matousek, Burger and Pauli-Gabi2007; Graf, Reference Graf2009a; Gegg et al., Reference Gegg, Buechi, Ebert, Deplazes, Madritsch and Anselmetti2020, Reference Gegg, Deplazes, Keller, Madritsch, Spillmann, Anselmetti and Buechi2021). Forming a connection between the Birrfeld and the HRPC, the Hausen Trough is presumably older than the GST, which lies below the current Reuss/Aare Valley. Erosion of the GST (under strong bedrock control; Gegg et al., Reference Gegg, Deplazes, Keller, Madritsch, Spillmann, Anselmetti and Buechi2021) may have enabled abandonment of the HRPC and establishment of the modern drainage configuration (Graf, Reference Graf2009a; Gegg et al., Reference Gegg, Anselmetti, Deplazes, Knipping, Madritsch, Mueller, Preusser, Vogel and Buechi2023). The Lower Pleistocene Niederterrasse (Low Terrace) gravel that represents the last glacial cycle, or Birrfeld Glacial (Ivy-Ochs et al., Reference Ivy‐Ochs, Kerschner, Reuther, Preusser, Heine, Maisch, Kubik and Schlüchter2008; Graf, Reference Graf2009a; Preusser et al., Reference Preusser, Graf, Keller, Krayss and Schlüchter2011; Graf and Burkhalter, Reference Graf and Burkhalter2016), is generally restricted to the present-day river valleys (∼310–350 m asl; Graf et al., Reference Graf, Bitterli-Dreher, Burger, Bitterli, Diebold and Naef2006; Gaar et al., Reference Gaar, Graf and Preusser2019).
Methods
Drilling and field campaign
This project comprises four sites where fully cored scientific drillings were undertaken in 2018 in context of the Quaternary investigation program of the Swiss National Cooperative for the Disposal of Radioactive Waste (Nagra). Three boreholes are located along the axis of the GST: QGBR (47°29′00″N, 8°14′11″E; final depth 123.5 m; Gegg et al., Reference Gegg, Kuster, Deplazes, Madritsch and Buechi2019a); QGVO (47°29′43″N, 8°14′18″E; final depth 77.0 m; Gegg et al., Reference Gegg, Kuster, Amschwand, Huber, Deplazes, Madritsch and Buechi2019b); and QUST (47°30′46″N, 8°14′3″E; final depth 86.4 m; Gegg et al., Reference Gegg, Kuster, Schmid, Lemke, Deplazes, Madritsch and Buechi2019c). QRIN (47°30′08″N, 8°11′28″E; final depth 52.7 m; Gegg et al., Reference Gegg, Kuster, Schmid and Buechi2018, Reference Gegg, Anselmetti, Deplazes, Knipping, Madritsch, Mueller, Preusser, Vogel and Buechi2023) was targeted at the HRPC, and is a composite profile of two neighboring boreholes. The 10-cm-diameter drill cores, ∼350 m in total, were retrieved by pneumatic hammering and wireline coring using a triple tube core barrel where the core is recovered in a plastic liner, allowing for excellent core quality. All boreholes recovered the entire Quaternary succession and penetrated at least 10 m into the bedrock to guarantee confident bedrock identification. After core recovery, a natural gamma log was acquired. Drilling was further complemented by an extensive field campaign investigating and sampling more than 20 outcrops in the study area (see Fig. 2; Supplementary Table 2), as well as by the integration of lithological logs of previously drilled boreholes collected in Nagra’s respective internal database.
Initial core logging and sampling
Bulk density, p-wave velocity, and magnetic susceptibility were measured in 5-mm depth-resolution from the sealed cores prior to opening using a Geotek multi-sensor core logger (MSCL; Schultheiss and Weaver, Reference Schultheiss and Weaver1992) at the Institute of Geological Sciences, University of Bern. Afterwards, the cores were split, with one half shielded from light to allow later luminescence sampling, while the other half was further processed. This included photographing with the MSCL-mounted line-scan camera, as well as detailed sedimentological and structural descriptions. Undrained shear strength was determined with a pocket vane tester (max. readout 250 kN/m2) in meter intervals where the sediment was sufficiently cohesive (i.e., rich in fines). Where the sediment was suitably fine grained, we also prepared smear slides and collected bulk sediment samples (∼40 g of material) in sub-meter intervals for geochemical analysis. In selected, high-quality core sections at a spacing of ∼5 m, we sampled all clasts >15 mm diameter from entire core halves to assess the gravel petrographic composition.
Compositional analysis
Gravel petrography was specifically selected as a tool to distinguish contributions from up to five glacial catchments that are potential sediment sources (Aare, Reuss, and Limmat, potentially also Rhone and Rhine; Figs. 1 and 2). The respective glaciers originated in the High Alps and traversed largely the same major geological units. Consequently, the petrographic spectra of their gravels are generally similar (mostly gray ‘Helvetic’ limestones; Graf, Reference Graf2009a). Still, some index lithologies exist (after Hantke, Reference Hantke1978; Graf, Reference Graf2009a). These include dark porphyritic volcanics and reddish sandstones and conglomerates (‘Verrucano’) from the area south of Walensee (Den Brok et al., Reference Den Brok, Caduff and Kempf2021) that are indicators for the Limmat catchment as well as lighter, reddish rhyolitic volcanics (‘Windgällenporphyr’) indicative of the Reuss catchment (Hantke and Brückner, Reference Hantke and Brückner2011). Characteristic greenish ‘Julier’ granites are further indicators of the Rhine catchment (Hantke, Reference Hantke1978; Graf, Reference Graf2009a).
Greenish volcanogenic ‘Taveyannaz’ sandstones (Lu et al., Reference Lu, Winkler, Rahn, von Quadt and Willet2018) are not index lithologies sensu stricto but occur more frequently in gravels from both Reuss and Limmat. Similarly, Graf (Reference Graf2009a) reported notably larger amounts of quartzites in gravels from the Aare (or combined Aare–Rhone) glacier that he attributed to reworking of fan deposits in the Molasse Basin (Schlüchter, Reference Schlüchter1975; Schlunegger et al., Reference Schlunegger, Matter and Mange1993; Berger et al., Reference Berger, Reichenbacher, Becker, Grimm, Grimm, Picot, Storni, Pirkenseer, Derer and Schaefer2005). The Rhone and Rhine systems originate farther into the Alpine interior and thus deliver additionally various ophiolites (Hantke, Reference Hantke1978; Schwenk et al., Reference Schwenk, Stutenbecker, Schläfli, Bandou and Schlunegger2022b). In addition to such rather rare clasts with an index character, non-index lithologies can be very valuable for discrimination of gravel units. This is the case if datasets that comprise a large number of samples collected arbitrarily and counted by a single operator are evaluated by appropriate statistical means (Graf, Reference Graf2009a; Gegg et al., Reference Gegg, Griebling, Jentz and Wielandt-Schuster2024).
We identified all clasts >15 mm in diameter from selected core halves, and all clasts >20 mm from volumetric samples collected in the field (including two reference samples each from the tributaries’ Niederterrasse gravels for comparison) and attributed them to one of 13 lithology groups (Supplementary Table 1). The minimum clast diameters were chosen so that usually >100 clasts could be obtained per sample (cf., Graf, Reference Graf2009a; Gegg et al., Reference Gegg, Griebling, Jentz and Wielandt-Schuster2024). We performed endmember analyses on the petrographic data using the R packages EMMAgeo (Dietze and Dietze, Reference Dietze and Dietze2019; fully unsupervised ‘Robust’ approach and ‘Deterministic’ approach where only the number of endmembers is defined by the user) and RECA (Seidel and Hlawitschka, Reference Seidel and Hlawitschka2015; few input parameters have to be defined by the user). In addition, following log-ratio transformation, the data were evaluated by principal component (PCA, variance-covariance matrix) and cluster analysis (Ward’s method, Euclidean distance matrix) in Past 3 (Hammer et al., Reference Hammer, Harper and Ryan2001). In sand- or fine-grain-dominated sections, the water content (WC) of bulk sediment samples was measured by weighing and freeze-drying. Geochemical composition (i.e., total inorganic carbon [TIC], total organic carbon [TOC], total sulfur [TS], and total nitrogen [TN]) was determined by combustion of small sample amounts (few mg) and combustion gas analysis in a thermal conductivity detector (Boyle, Reference Boyle, Last and Smol2001; Meyers and Teranes, Reference Meyers, Teranes, Last and Smol2001). This was done using a Thermo Scientific Flash 2000 Smart elemental analyzer (details on the procedure in Krotz and Giazzi, Reference Krotz and Giazzi2018). TIC was converted to CaCO3 content by multiplication with a stoichiometric factor of 8.33 (= MCaCO3/MC).
2D seismic acquisition
Three high-resolution 2D reflection seismic lines were acquired on the Ruckfeld gravel plain by Nagra in 2016: 16-QAU_23, 16-QAU_24 (both oriented SW–NE), and 16-QAU_25 (oriented SE–NW; Fig. 2). The seismic lines are 1.5–2.2 km long, and were recorded using a combination of Inova Univib vibrators and explosives excited every 5 m as sources, and a geophone spacing of 2.5 m. The Mesozoic bedrock and the overlying Quaternary strata were imaged in time domain. The migrated data were visualized in IHS KingdomSuite and DMNG SeiSee and interpreted with respect to available drilling and surrounding regional-scale reflection seismic data (Madritsch et al., Reference Madritsch, Meier, Kuhn, Roth, Zingg, Heuberger, Naef and Birkhäuser2013).
Results
Lithostratigraphy
Base of Quaternary
All drillings into the GST reached the pre-Quaternary bedrock (QGBR: 111.5 m depth at 225.8 m asl; QGVO: 64.9 m depth at 266.1 m asl; QUST: 76.0 m depth at 255.2 m asl; Figs. 3–5; Gegg et al., Reference Gegg, Deplazes, Keller, Madritsch, Spillmann, Anselmetti and Buechi2019a-c, Reference Gegg, Deplazes, Keller, Madritsch, Spillmann, Anselmetti and Buechi2021). In the overlying Quaternary strata (Fig. 6), and in a variety of outcrops in the study area, we distinguish four lithofacies associations (LFA 1–4), which are characterized in the following. A detailed description of the succession recovered at QRIN is provided in Gegg et al. (Reference Gegg, Kuster, Schmid and Buechi2018, Reference Gegg, Anselmetti, Deplazes, Knipping, Madritsch, Mueller, Preusser, Vogel and Buechi2023).
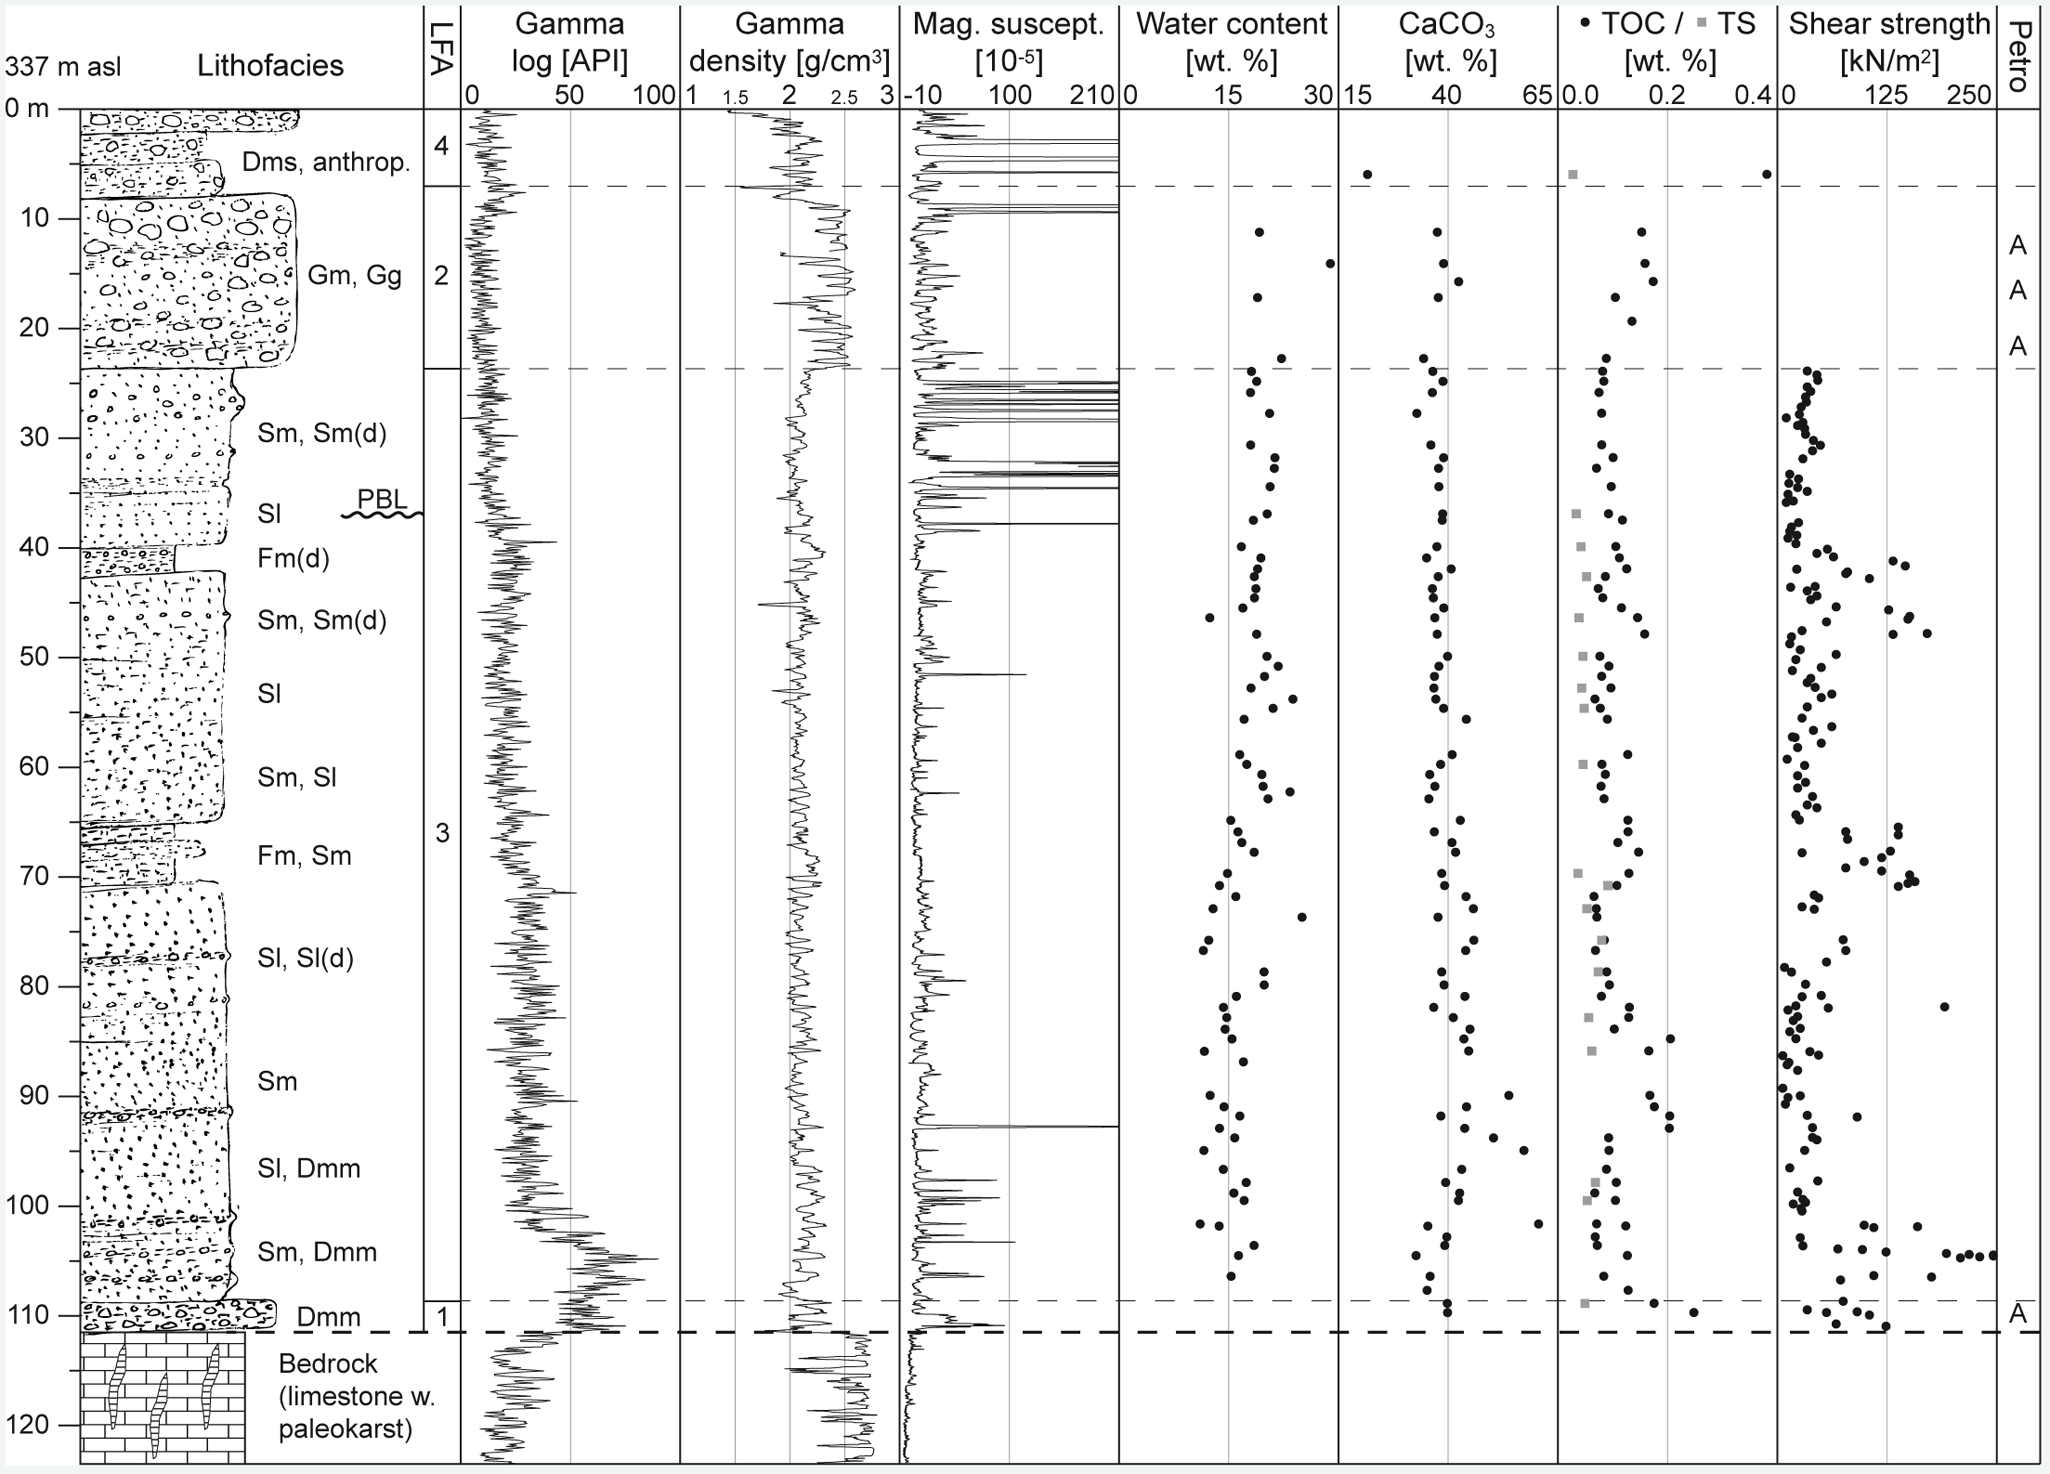
Composite plot of borehole QGBR. Lithofacies codes are based on Miall (Reference Miall and Miall1977) and Eyles et al. (Reference Eyles, Eyles and Miall1983): D = diamict, S = sand, F = fines, G = gravel, -m = massive, -mm = matrix-supported and massive; -ms = matrix-supported and stratified; -l = laminated, -g = graded, (d) = with dropstones. LFA = lithofacies association; PBL = lowest local Pleistocene base level (300 m asl; Graf, Reference Graf2009a); anthrop. = anthropogenic; Petro = dominant gravel petrographic signal (A = Aare, see Figures 7 and 8).
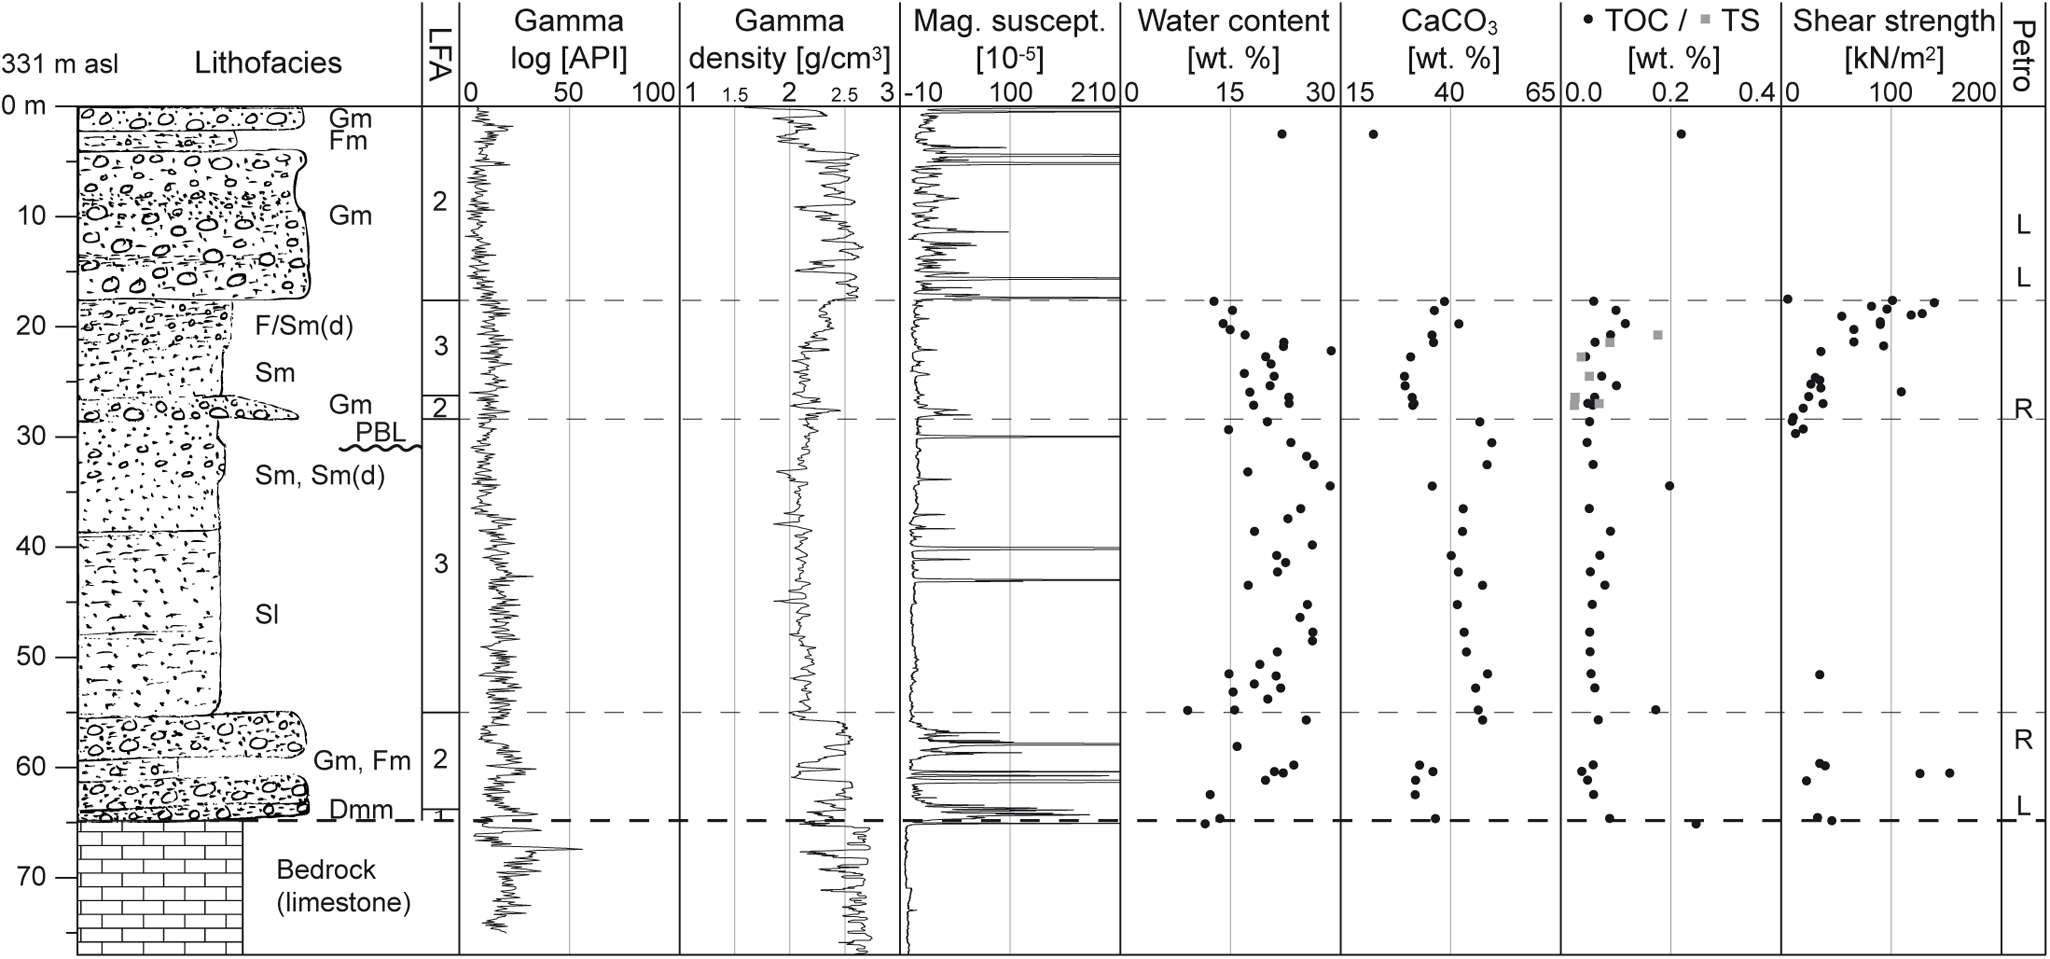
Composite plot of borehole QGVO. Lithofacies codes are based on Miall (Reference Miall and Miall1977) and Eyles et al. (Reference Eyles, Eyles and Miall1983): D = diamict, S = sand, F = fines, G = gravel, -m = massive, -mm = matrix-supported and massive, -l = laminated, (d) = with dropstones. LFA = lithofacies association; PBL = lowest local Pleistocene base level (300 m asl; Graf, Reference Graf2009a); Petro = dominant gravel petrographic signal (L = Limmat, R = Reuss, see Figures 7 and 8).
Composite plot of borehole QUST. Lithofacies codes are based on Miall (Reference Miall and Miall1977) and Eyles et al. (Reference Eyles, Eyles and Miall1983): D = diamict, S = sand, F = fines, G = gravel, -m = massive, -mm = matrix-supported and massive; -g = graded, (d) = with dropstones. LFA = lithofacies association; PBL = lowest local Pleistocene base level (300 m asl; Graf, Reference Graf2009a); Petro = dominant gravel petrographic signal (A = Aare, L = Limmat, R = Reuss, see Figures 7 and 8).

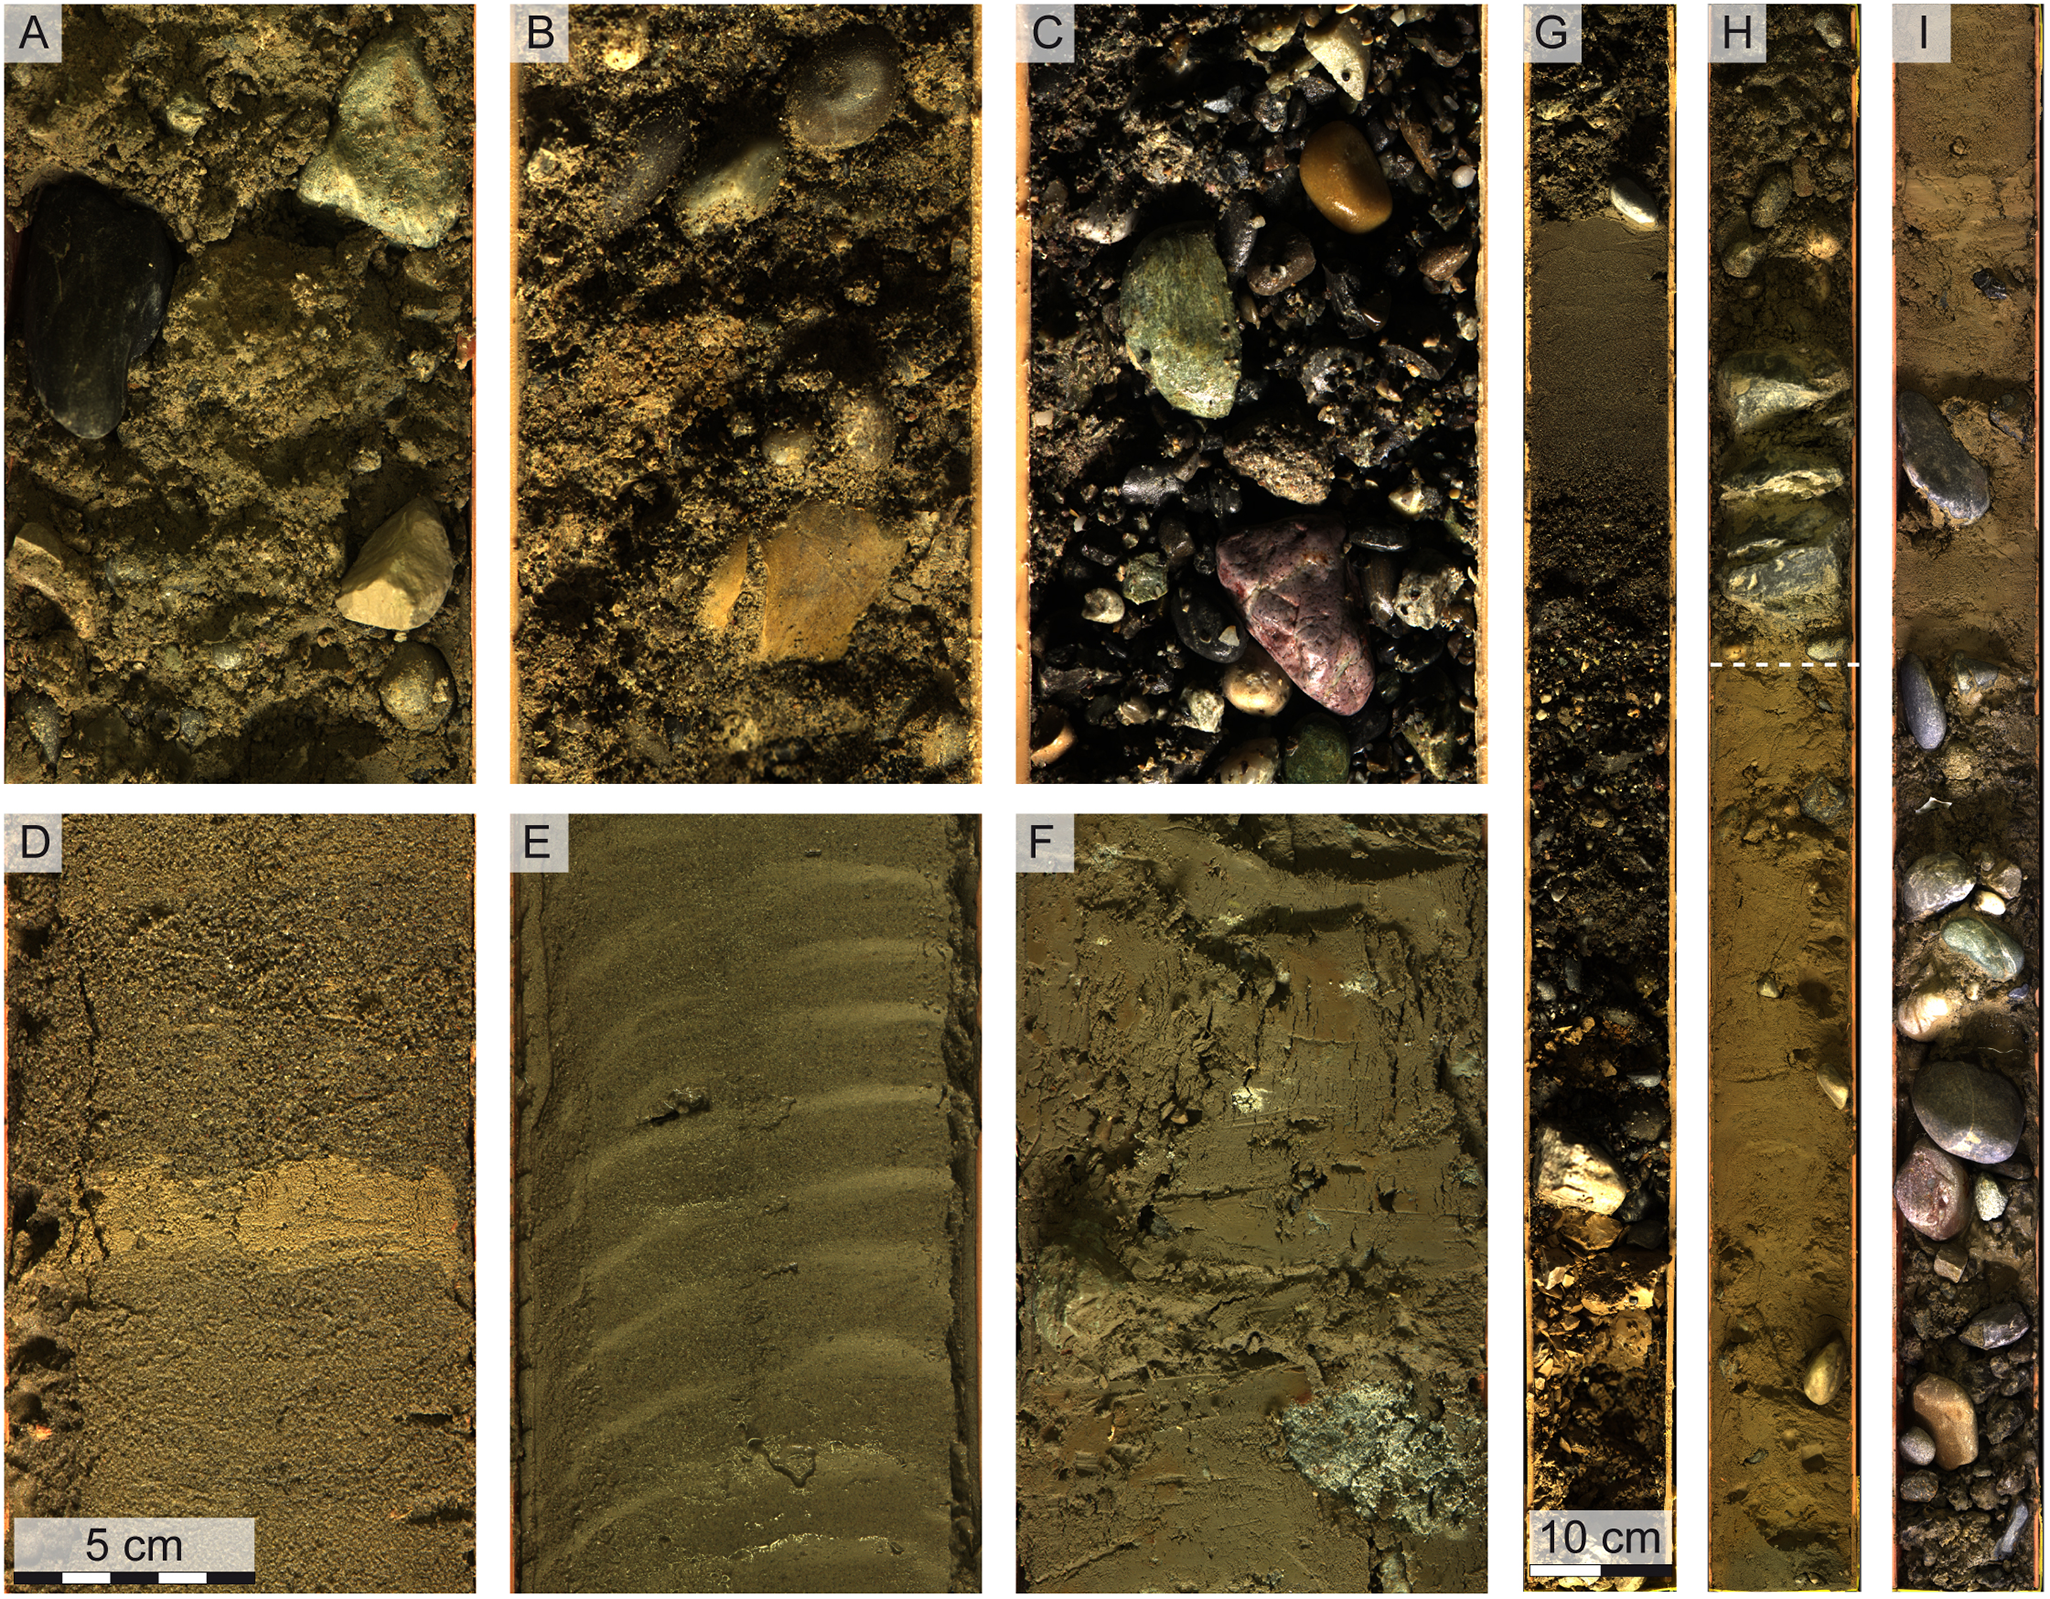
Core photos representing lithofacies associations 1–3 (LFA 1–3); waste deposit LFA 4 not displayed; width of all images is 10 cm. (A) LFA 1, massive sandy diamict with (sub-)angular clasts at the base of QGVO (∼64.4 m depth). (B) LFA 2a, poorly sorted, sand-rich gravel with (sub-)rounded clasts (QUST, 65.6 m). (C) LFA 2b, moderately sorted, fine to medium gravel (QUST, 16.5 m). (D) LFA 3a, massive sand with fine-grained interbed (QGVO, 34.4 m). (E) LFA 3b, silty sand with rhythmic bedding (QGBR, 55.6 m). (F) LFA 3c, clayey sand with dispersed clasts, diamictic (QGBR, 101.9 m). (G) Fining-upward cycle within LFA 2, from cobble to sand size (QUST, 13–14 m). (H) Boundary between LFA 2 (top) and 3 (bottom; QGVO, 17–18 m). (I) Coarse LFA 2 interbed within LFA 3 (QGVO, 27–28 m). Photos of all core sections are provided in Gegg et al. (Reference Gegg, Kuster, Deplazes, Madritsch and Buechi2019a–c).
LFA 1: basal diamicts
At the base of the GST infill, we encountered diamicts overlying the bedrock (LFA 1). These are soft to stiff, massive, and 2.7 m thick in QGBR, 0.7 m thick in QGVO, and 1.3 m thick in QUST. The diamicts consist of mostly angular gravel clasts and cobbles embedded in a yellowish gray to olive (partly blueish in QGBR, as a result of reworking of an underlying paleokarst infill; Gegg et al., Reference Gegg, Buechi, Ebert, Deplazes, Madritsch and Anselmetti2020) and clayey to sandy matrix. The diamicts are generally relatively poor in matrix and partly clast-supported (Fig. 6A). In QGBR and QGVO, LFA 1 contains occasional striated clasts, which were not encountered in QUST, where instead soft clumps occur that might be reworked marl bedrock. Basal diamicts are characterized by low water content (< 15%), intermediate to high bulk density (2.0–2.5 g/cm3), and intermediate gamma signals (30–50 API, 50–70 API in QGBR). Magnetic susceptibility shows distinct peaks, with the exception of QUST, where the signal within the basal diamict is generally low. These peaks may relate to individual clasts, but we also occasionally observe fragments of the drill bit or core catcher, which create strong artificial peaks.
LFA 2: sandy gravels
Different units of sandy gravels occur in all studied cores (LFA 2) and generally consist of dm- to m-scale beds that are frequently graded and of yellowish to brownish gray color. Gravels overlying the basal diamicts in QGVO (64.2–55.8 m depth) and QUST (especially the bottom ∼20 m) are mostly poorly sorted with a significant silt and sand component (LFA 2a, Fig. 6B), and contain massive or crudely bedded sand intercalations up to ∼1 m thick. In QGVO, these basal gravels also contain a few striated clasts, as does an interbed of poorly sorted gravel with cobbles at 28.3–26.5 m depth (Fig. 6I). The shallower gravels in QGBR (23.6–8.0 m depth), QGVO (17.4–0.0 m), and QUST (top ∼20 m) consist of both poorly sorted intervals and well-sorted open-framework gravels as well as pure dm-scale sand layers, sometimes as fining-upward sections (LFA 2b, Fig. 6C, G). Individual clasts are predominantly rounded. LFA 2 deposits generally have a high density (∼2.5 g/cm3), low gamma signals (frequently < 25 API), and distinct, natural or artificial (see above) peaks in magnetic susceptibility. Water contents range from ∼15% to 30%.
Our study includes a variety of outcrops in active and abandoned gravel pits and artificial or natural cuts (see Fig. 2). The respective deposits have been attributed to the Tiefere Deckenschotter, Hochterrasse, and Niederterrasse (Matousek et al., Reference Matousek, Wanner, Baumann, Graf, Nüesch and Bitterli2000; Graf et al., Reference Graf, Bitterli-Dreher, Burger, Bitterli, Diebold and Naef2006). Coordinates and brief descriptions of the studied outcrops are given in Supplementary Table 2, together with a list of samples collected in the field. At all sites, sandy gravels occur at a variety of exposure extents and conditions. In some larger outcrops, a complex sedimentary architecture can be observed, including distinct bedding planes, cross-bedded gravel and sand lenses, and graded sections. The gravels in several exposures are overlain by glaciogenic diamicts.
LFA 3: massive and bedded sands and silts
The successions of QGBR (108.8–23.6 m depth) and QGVO (55.8–17.4 m depth) largely consist of soft, yellowish to olive gray silty sands (LFA 3) that occur in three different subunits (LFA 3a–c). Whereas the sands of LFA 3a are massive (Fig. 6D), those of LFA 3b exhibit a well-developed and sometimes rhythmic bedding (Fig. 6E). LFA 3b is characterized by 1–5 cm thick, olive-gray, coarse layers alternating with up to 2-cm-thick, lighter yellowish gray, silt-dominated layers. These bedded deposits are frequently deformed, including drilling-related drawdowns at the core edges, but also convolution of the layering that may be unrelated to drilling deformation but caused, for example, by slumping. Layers with infrequent dispersed gravel clasts occur throughout QGBR, and in the top half of QGVO (above 35 m depth). QGBR further recovered occasional dm- to m-scale interbeds that are silt dominated and, both below 80 m and above 45 m depth, frequently contain outsized clasts (LFA 3c, Fig. 6F). Such a diamictic section also occurs at the top of LFA 3 in QGVO (22.3–17.4 m depth, Fig. 6H).
Densities of LFA 3 sediments are generally intermediate (2.0–2.2 g/cm3), and magnetic susceptibility is low, with the exception of individual peaks especially in the top ∼15 m of QGBR, which likely relate to outsized clasts. In QGBR, pocket vane testing revealed three distinct intervals (∼40–50 m, ∼65–70 m, and ∼100–110 m) where shear strength is elevated from background values below 100 kN/m2 up to 170 kN/m2, and in the deepest interval to >250 kN/m2 (Fig. 3). These correspond to occurrences of LFA 3c. The upper LFA 3 section of QGVO (26.4–17.4 m) shows upwards-increasing shear strength from ∼20 to ∼140 kN/m2 (Fig. 4). Gamma signals are low (< 25 API) throughout QGVO and in the upper part of QGBR, where they increase downward to > 50 API. Water contents scatter between 15% and 30% in QGVO and show an upward-increasing trend from 10–15% to 15–20% in QGBR.
LFA 4: waste deposit
At the top of the succession, QGBR recovered 8.0 m of olive gray to black silty diamicts (LFA 4). Brick and metal fragments identify these as anthropogenic waste deposits, which are not of further relevance to this study (cf., Graf et al., Reference Graf, Bitterli-Dreher, Burger, Bitterli, Diebold and Naef2006).
Sediment composition
Geochemistry
Geochemical data are shown on Figures 3 and 4. LFA 3 sediments of QGBR and QGVO are characterized by TOC and TS values generally below 0.2% and 0.1%, respectively, while nitrogen was not detectable. CaCO3 content is typically ∼40% but drops abruptly to ∼30% above the LFA 2 interbed of QGVO at 26.5 m depth.
Gravel petrography
Gravel petrographic data are provided in Supplementary Tables 3 and 4 (drill cores, including QRIN, and outcrops, respectively). Gray limestone clasts are generally most abundant, representing one-half to two-thirds of most samples, followed by clastic sedimentary rocks (sandstones and conglomerates; less than one-third), quartzites sensu lato (including vein quartz, cherts, and radiolarites; less than one-third), and crystalline clasts (< 10%). An exception is one sample from the cover diamicts of QRIN (6.5–7.5 m depth), which differs from all other samples as it contains > 50% (as opposed to < 20%, and often < 5%) of light beige limestones of the JFTB (Gegg et al., Reference Gegg, Anselmetti, Deplazes, Knipping, Madritsch, Mueller, Preusser, Vogel and Buechi2023). These limestones represent local erosion and reworking instead of indicating the glacier source area and were thus omitted from the following analyses.
The results of the automatic endmember (EM) analyses using the EMMAgeo (‘Robust’ and ‘Deterministic’ approaches; Dietze and Dietze, Reference Dietze and Dietze2019) and RECA (Seidel and Hlawitschka, Reference Seidel and Hlawitschka2015) R packages are shown on Supplementary Figure 1. The automatic, ‘Robust’ EMMAgeo-approach modeled three EMs, corresponding to the threefold confluence situation of Aare, Reuss, and Limmat (Fig. 2), consequently three EMs were also used for all analyses where their number has to be specified by the user. For RECA, we used a convexity threshold of −6, and weighing exponent of 1, as recommended by Seidel and Hlawitschka (Reference Seidel and Hlawitschka2015). The model performance was tested with assumed true EM taken from the Niederterrasse of the respective river valleys. The contributions of these reference samples were best reproduced by the Robust EMMAgeo model; therefore, we use the results of this approach for further interpretation (Fig. 7).
Results of endmember (EM) modeling using the Robust EMMA approach of Dietze and Dietze (Reference Dietze and Dietze2019). (A) The model produces a quartz-rich EM (EM1, white) that is tentatively correlated with an Aare input (as suggested by Graf, Reference Graf2009a), a siliceous Alpine limestone-rich EM (EM2, gray) tentatively correlated with a Reuss input, and a third EM rich in non-siliceous Alpine limestone (EM3, black) that is tentatively correlated with a Limmat input. For lithology group abbreviations, see Figure 8 or Supplementary Table 2. (B) EM scores of individual samples indicate contributions from the respective catchments. The correlations are supported by the EM scores of reference samples from the Late Pleistocene Niederterrasse (bottom; NT-A-x from the Aare, NT-R-x from the Reuss, and NT-L-x from the Limmat Valley). The calculated EM scores generally agree well with principal component analysis (PCA; Figure 8) and clustering results (Supplementary Figure 2), as well as previous studies.
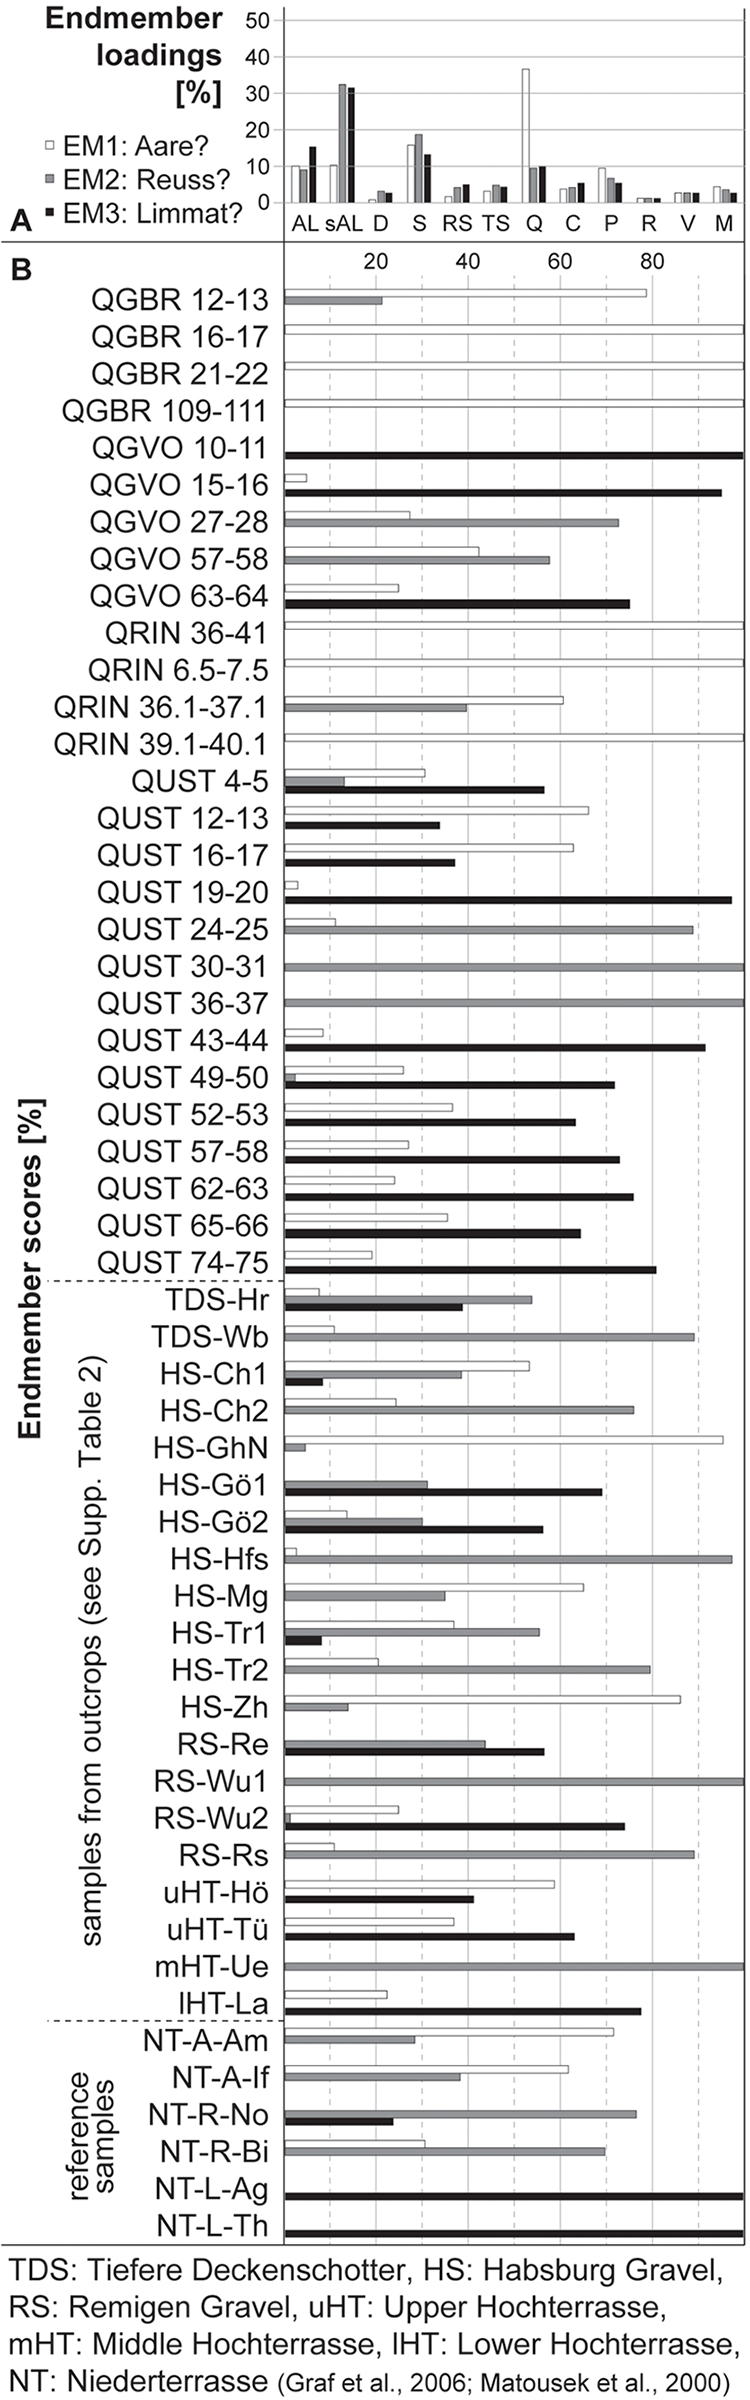
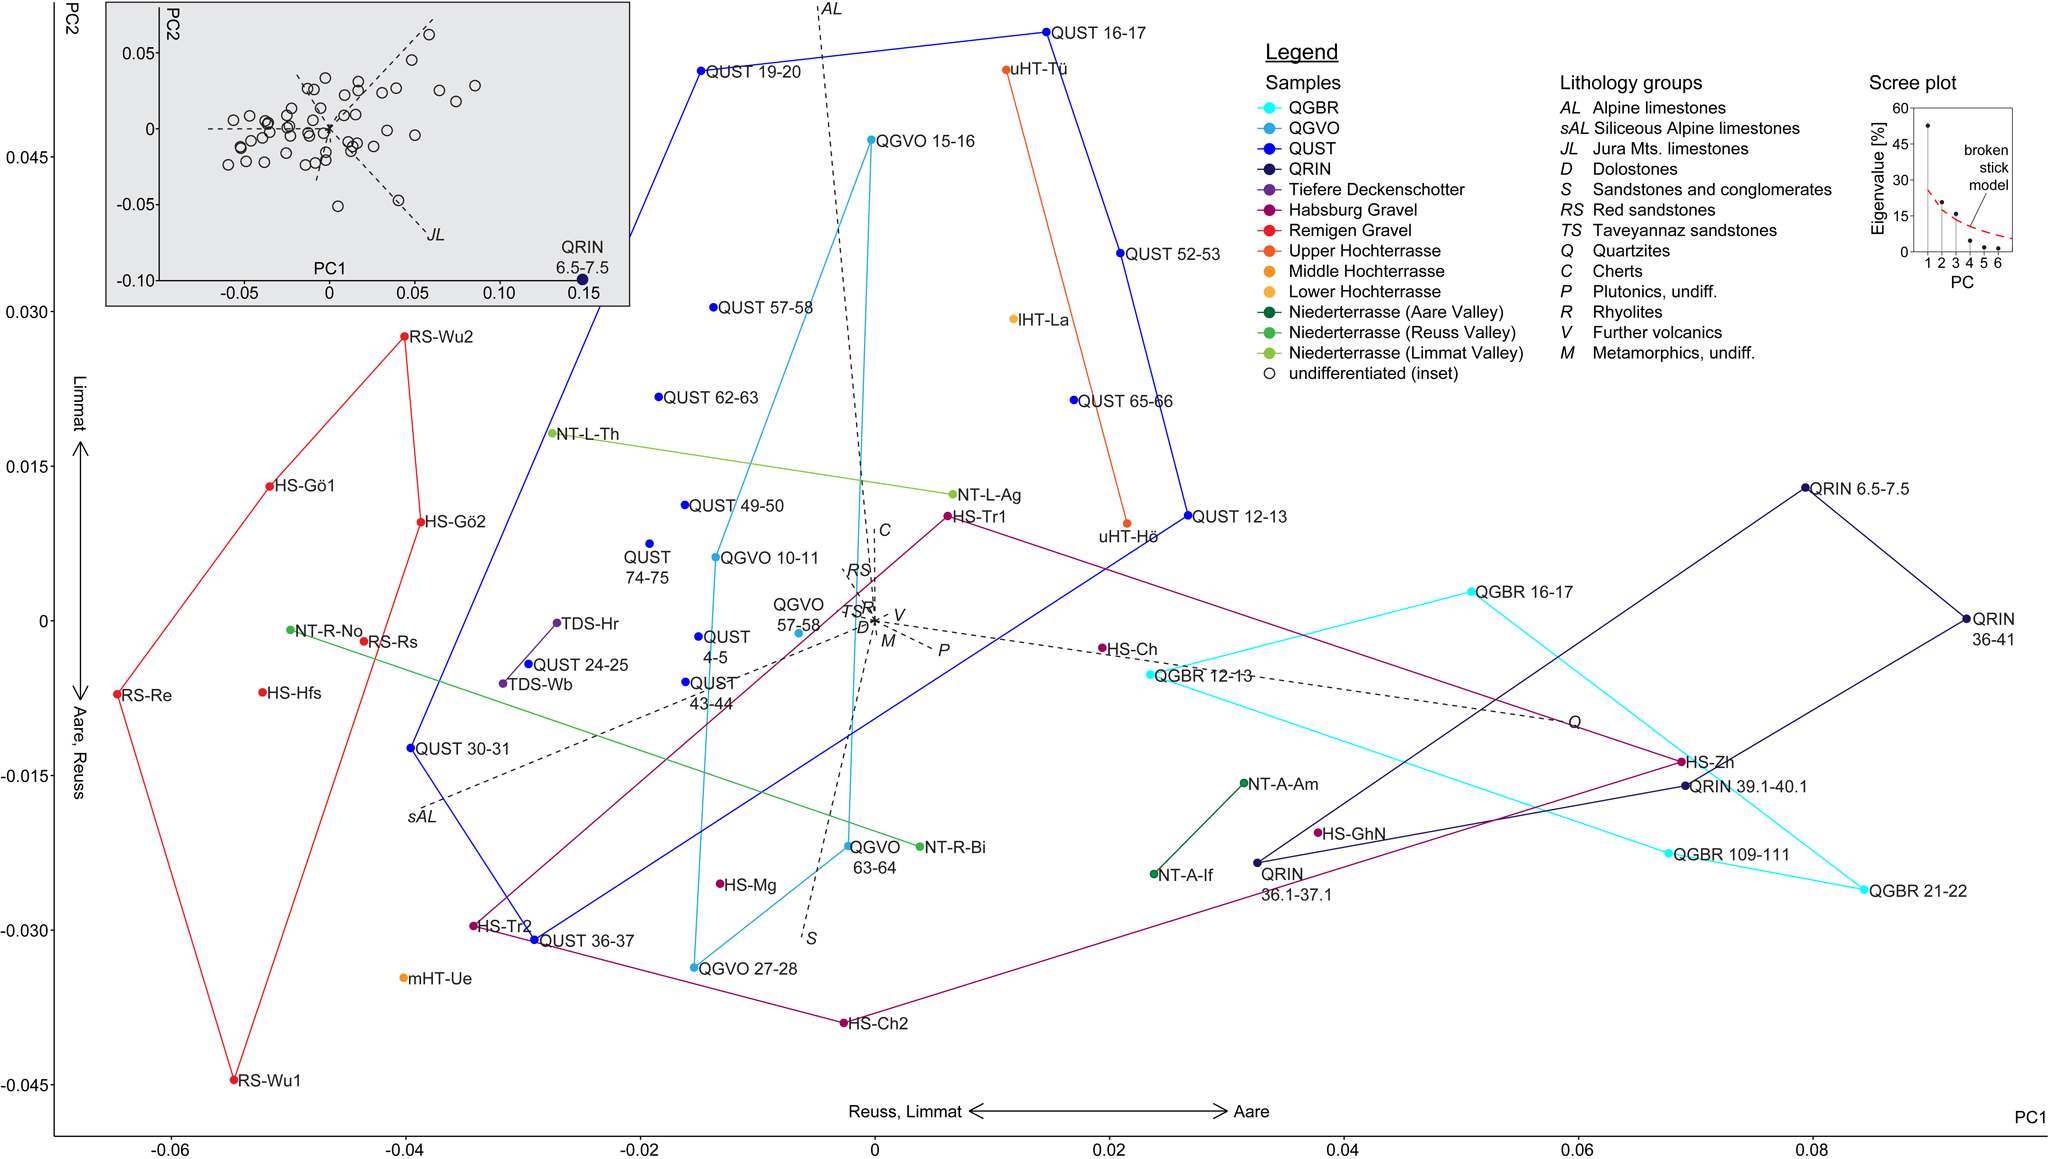
An Aare-dominated petrography, characterized mainly by high quartzite contents (EM1), is thus inferred for all samples of QGBR and QRIN, while the samples of QGVO and QUST contain more prominent Reuss/Limmat components (higher limestone contents, EM2 and EM3, respectively; Fig. 7). Specifically, most samples of QGVO and QUST are dominated by a Limmat signal (especially rich in non-siliceous limestones), except mainly for the gravel interbed of QGVO at ∼28 m depth and the interval at ∼40–25 m depth of QUST, which show a Reuss-dominated petrography. In accordance with Graf (Reference Graf2009a), our data further indicate a rather variable-mixed Aare/Reuss provenance for the Habsburg Gravel, and a well-distinguishable Reuss/Limmat provenance for the Remigen Gravel in the HRPC. The composition of the Hochterrasse farther downstream the Aare Valley indicates mixed provenances. A Reuss/Limmat-dominated petrography is inferred for two samples of the Tiefere Deckenschotter of Bruggerberg, in agreement with the findings of Graf (Reference Graf1993). These results are in good agreement with principal component (PCA, Fig. 8) and cluster analyses (Supplementary Fig. 2). In the PCA, inferred Aare provenance corresponds mainly to a high PC1 score (i.e., frequent quartzites), Limmat provenance to a high PC2 score (i.e., frequent limestones), and Reuss provenance to a low score of both components (i.e., frequent sandy and siliceous limestones; Fig. 8). Interestingly, the Niederterrasse samples, assumed to represent true EM, do not lie at the most extreme positions in the PCA plot.
Results of principal component analysis (PCA) excluding locally derived limestones from the Jura Mountains. Component 1 (PC1) distinguishes samples with high quartzite content (high PC1) from samples with a high content of siliceous Alpine limestones (low PC1); both lithology groups have a correlation coefficient of −0.64. High PC1 scores indicate a relatively increased Aare contribution, while lower PC1 scores indicate a relatively increased Reuss/Limmat contribution, as suggested by reference samples (green) from the Niederterrasse of the respective river valleys (Graf, Reference Graf2009a). PC2 separates samples predominantly rich in Alpine limestones from samples rich in sandstones (correlation coefficient −0.29), indicative of increased Limmat and Aare/Reuss contributions, respectively. Inset: PCA of the full petrographic dataset including Jura Mountains limestones clearly separates one sample from the cover diamicts of QRIN (QRIN 6.5–7.5) from all other samples based on its high content of these rocks (> 50% as opposed to < 20%; see also Gegg et al., Reference Gegg, Anselmetti, Deplazes, Knipping, Madritsch, Mueller, Preusser, Vogel and Buechi2023).
The Limmat provenance is especially well supported by index lithologies (> 1% red sandstones, presence of non-rhyolitic volcanics; Supplementary Tables 3, 4). Noteworthy evidence for contributions from the Rhine and Rhone catchments in the shape of the according index lithologies was not identified.
Seismic data
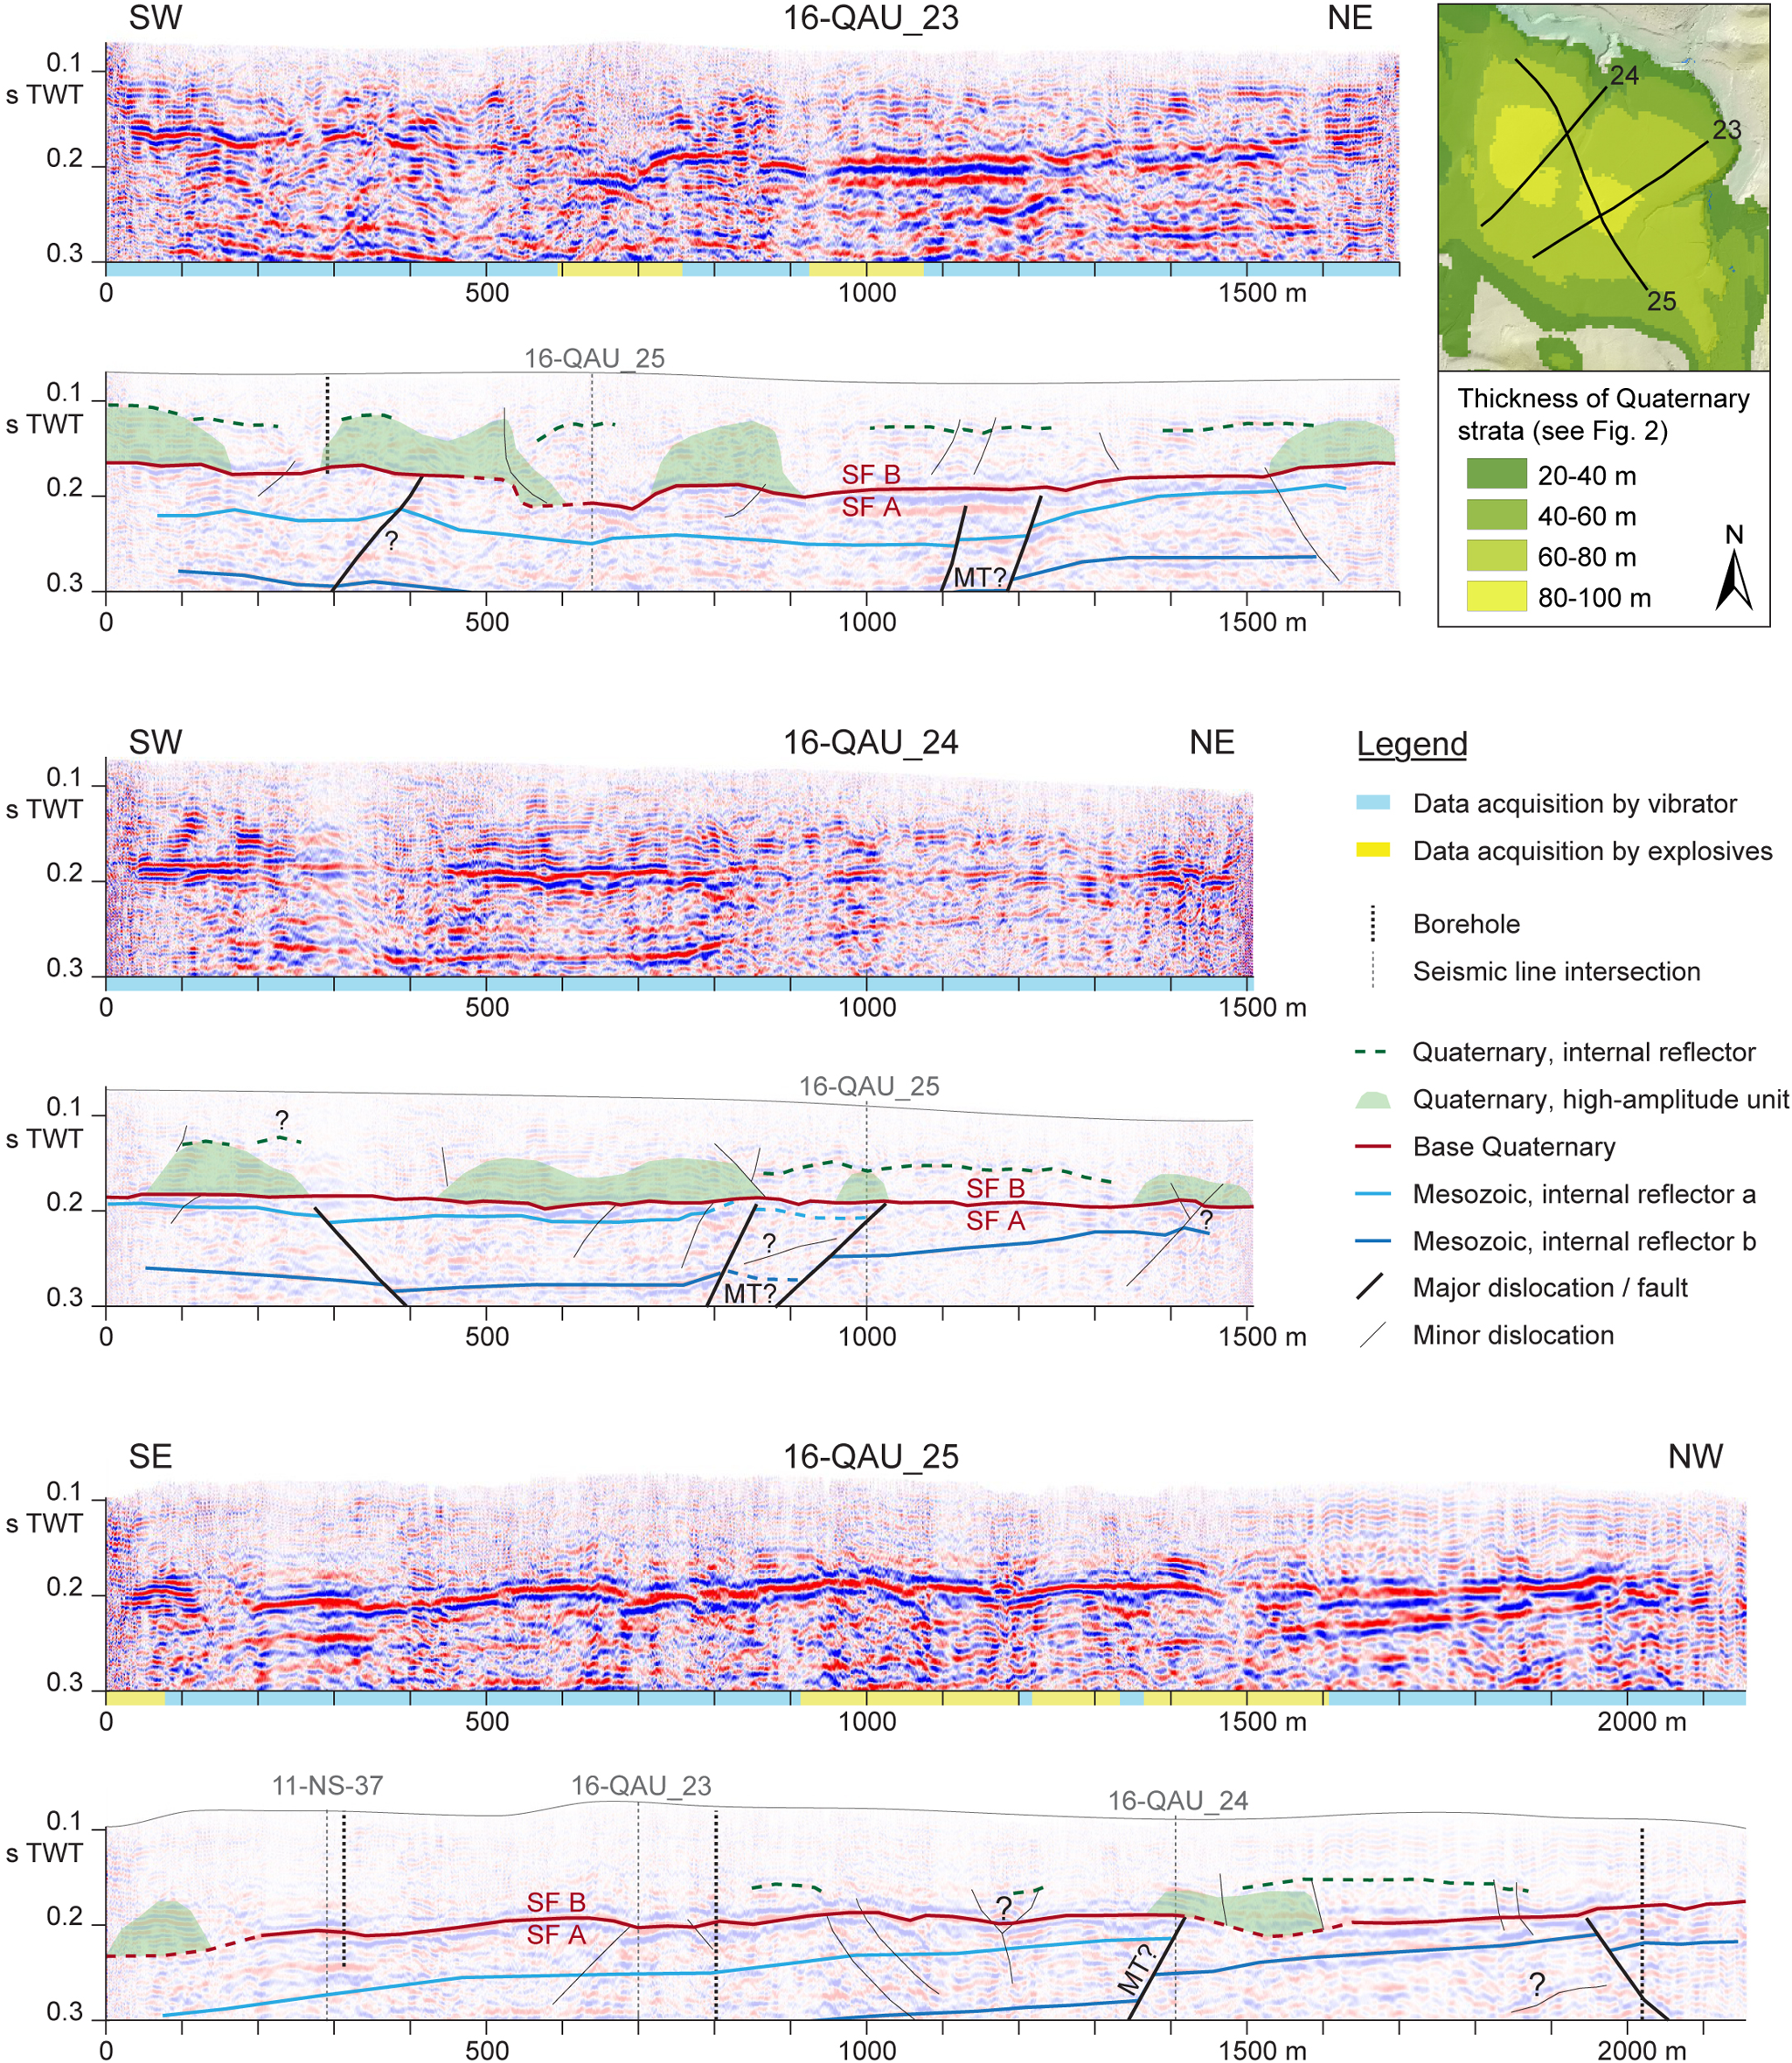
The subsurface of the Ruckfeld comprises two main seismic facies (SF A and SF B; Fig. 9). The lower SF A consists of horizontal to slightly southward-dipping continuous reflections with moderate to high amplitudes that are in several places affected by smaller (i.e., kinks) and larger dislocations (i.e., visible offsets). At ca. 0.2 s two-way travel time (TWT), a sharp horizontal boundary forms an angular unconformity. The strata above, SF B, are characterized by mostly lower-amplitude, frequently discontinuous and hummocky reflections. On lines 16-QAU_23 and 16-QAU_24, a relatively continuous and distinct internal horizontal reflection that subdivides SF B can be observed. While the upper part of SF B is largely seismically transparent, several discontinuous units of high-amplitude reflections as well as smaller-scale discontinuities and dislocations occur in the lower part.
Seismic sections 16_QAU-23, 16_QAU-24, and 16_QAU-25 with interpretation. SF = seismic facies, MT = Mandach Thrust (see Figure 2), seismic line 11-NS-37 from Madritsch et al., Reference Madritsch, Meier, Kuhn, Roth, Zingg, Heuberger, Naef and Birkhäuser2013. Within the Quaternary, 0.1 s two-way travel time (TWT) corresponds to ∼65 m depth (Jäckli, Reference Jäckli2012).
Discussion
Evolution of the overdeepened Gebenstorf-Stilli Trough (GST)
Subglacial erosion and onset of sedimentation
The GST is one of two northward extensions of the Birrfeld Basin and has been excavated over the course of an ice advance over the Birrfeld and the JFTB along the present-day lower Reuss Valley (Fig. 2; Graf, Reference Graf2009a; Gegg et al., Reference Gegg, Deplazes, Keller, Madritsch, Spillmann, Anselmetti and Buechi2021). Gegg et al. (Reference Gegg, Deplazes, Keller, Madritsch, Spillmann, Anselmetti and Buechi2021) showed that trough formation was strongly controlled by the specific local bedrock lithology (incision efficiency and depth), and potentially structure (localization). After its incision, the GST was filled with diverse deposits reflecting its development after incision (Fig. 10).
Overlying the basal bedrock unconformity, the Gebenstorf Trough diamict comprises a few meters of massive diamict and/or gravel (LFA 1, 2). Such deposits occur commonly at the base of overdeepening-fill successions, but their nature and formative process have been disputed (e.g., Gegg and Preusser, Reference Gegg and Preusser2023). Striated clasts in QGBR and QGVO identify the diamict as an ice-derived deposit. In QGBR, the lowermost 0.5 m are stiff and compact, which indicates direct loading by glacier ice. In contrast, the other basal diamicts are looser and softer. This is characteristic rather of water-lain glaciogenic diamicts (i.e., deposits originating mainly from melt-out and reworking by subglacial mass movements and/or subglacial water flow) than of overconsolidated subglacial tills dominated by processes such as lodgment (Schlüchter, Reference Schlüchter1997; Evans et al., Reference Evans, Phillips, Hiemstra and Auton2006). The relatively matrix-poor, sometimes clast-supported character of the Gebenstorf Trough diamict is a further indicator of modification by flowing water through winnowing of fines (e.g., Boulton and Paul, Reference Boulton and Paul1976). We therefore refrain from the term ‘till’ and use the purely descriptive term ‘diamict’ (although the diamict probably contains some isolated occurrences of actual till sensu Eyles et al., Reference Eyles, Eyles and Miall1983, like at the very base of the QGBR infill). We explain the properties of this diamict, as well as its comparably small thickness (cf., Wyssling and Wyssling, Reference Wyssling and Wyssling1978; Pomper et al., Reference Pomper, Salcher, Eichkitz, Prasicek, Lang, Lindner and Götz2017; Buechi et al., Reference Buechi, Graf, Haldimann, Lowick and Anselmetti2018, Reference Buechi, Landgraf, Madritsch, Mueller, Knipping, Nyffenegger, Preusser, Schaller, Schnellmann and Deplazes2024; Schwenk et al., Reference Schwenk, Schläfli, Bandou, Gribenski, Douillet and Schlunegger2022a) by efficient flushing of debris from the glacier base during erosion and ice occupation of the GST. Although only a little material was available, contributions from the catchments of Aare, Reuss and Limmat could be identified in petrography samples of the Gebenstorf Trough diamict (Figs. 3–5, 7, 8). The combined drainage area of these three catchments delivered large amounts of melt water that passed through the narrow cross-section of the GST, while its sediment load may have been retained to a large degree by the Birrfeld Basin and overdeepened areas farther up in the tributary catchments, especially that of the Reuss River (Alley et al., Reference Alley, Cuffey, Evenson, Strasser, Lawson and Larson1997, Reference Alley, Cuffey and Zoet2019; Pietsch and Jordan, Reference Pietsch and Jordan2014; Gegg et al., Reference Gegg, Deplazes, Keller, Madritsch, Spillmann, Anselmetti and Buechi2021). Deposition of the Gebenstorf Trough diamict reflects the cessation of this efficient flushing and thus the transition to (sub-)glaciolacustrine conditions of the ice-decay phase rather than the pleniglacial phase.
Lacustrine phase
Above the basal diamicts, the several-decameter-thick massive to bedded Gebenstorf Sand (LFA 3) represents the majority of the overdeepening infill (Fig. 10; to the north it interfingers with coarser delta deposits, see below). This sand is interpreted as a glaciolacustrine deposit based on its uniform, entirely detrital sedimentology, very low content of organic material with TOC generally less than 0.2%, and no macro- or microfossils encountered (cf., Graf, Reference Graf2009a; Anselmetti et al., Reference Anselmetti, Drescher-Schneider, Furrer, Graf, Lowick, Preusser and Riedi2010; Dehnert et al., Reference Dehnert, Lowick, Preusser, Anselmetti, Drescher-Schneider, Graf, Heller, Horstmeyer, Kemna and Nowaczyk2012). The dominant preservation of sedimentary bedding further indicates a cold, inorganic environment without burrowing organisms throughout its deposition (Zolitschka et al., Reference Zolitschka, Francus, Ojala and Schimmelmann2015). Dispersed outsized fragments are interpreted as melt-out debris from icebergs or from a floating, decaying glacier tongue. A distinct glacially derived component, especially in the basal Gebenstorf Sand, is further suggested by elevated gamma signals (> 50 API), which indicate increased, reworked clay mineral content (Serra and Sulpice, Reference Serra and Sulpice1975).
Longitudinal section A (from Gegg et al., Reference Gegg, Deplazes, Keller, Madritsch, Spillmann, Anselmetti and Buechi2021, altered; see Figure 2 for location) along the GST. Profile B (Figure 11) intersects at ∼4 km.
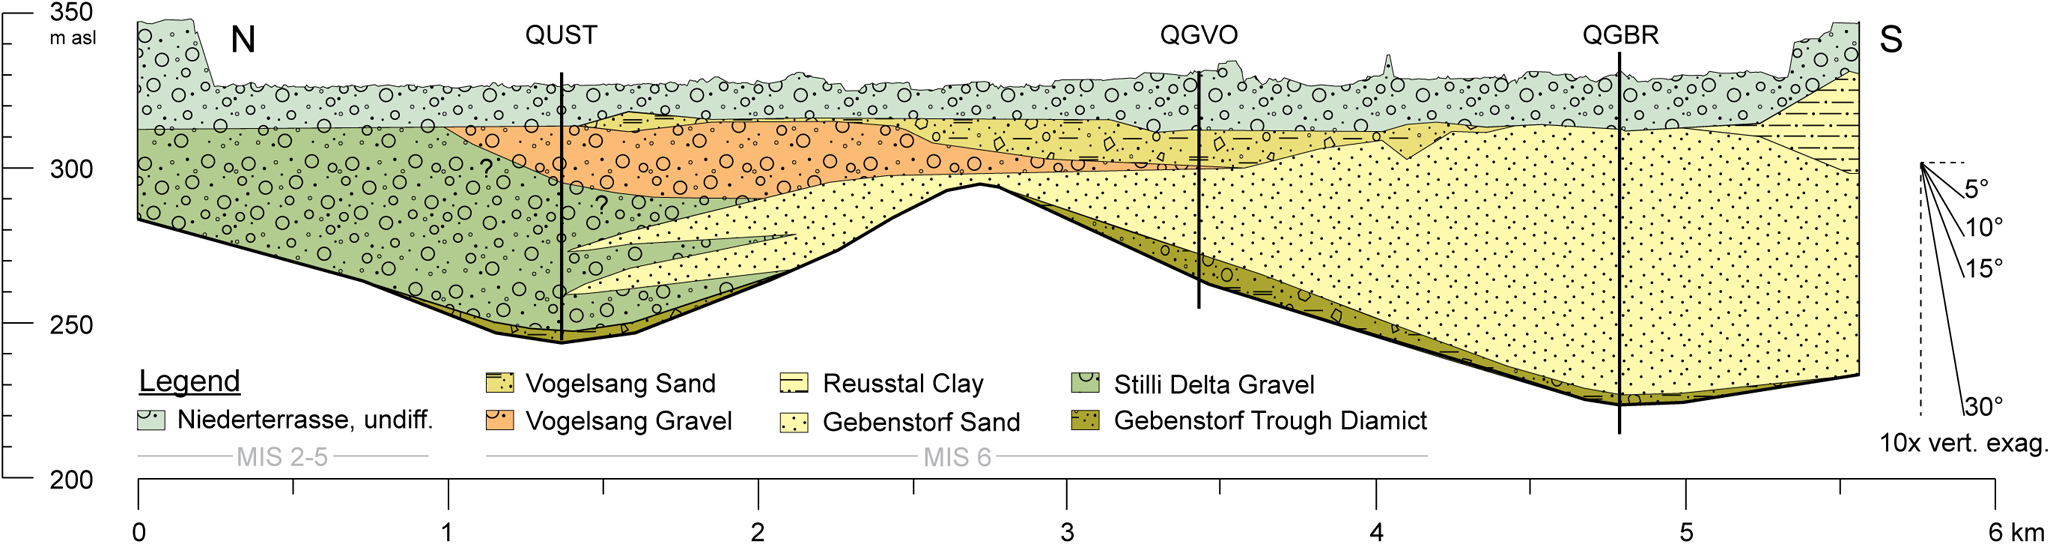
In contrast to the majority of other records of overdeepened basin fills that also comprise thick units of basinal fines (e.g., Schlüchter, Reference Schlüchter1989; Dehnert et al., Reference Dehnert, Lowick, Preusser, Anselmetti, Drescher-Schneider, Graf, Heller, Horstmeyer, Kemna and Nowaczyk2012; Buechi et al., Reference Buechi, Graf, Haldimann, Lowick and Anselmetti2018, Reference Buechi, Landgraf, Madritsch, Mueller, Knipping, Nyffenegger, Preusser, Schaller, Schnellmann and Deplazes2024), that of the GST is entirely sand-dominated. A finer-grained Reusstal Clay occurs only south of the studied section, and stratigraphically higher up (Fig. 10; Graf et al., Reference Graf, Bitterli-Dreher, Burger, Bitterli, Diebold and Naef2006; Graf and Burkhalter, Reference Graf and Burkhalter2016). This clay represents the continuation of the fining-upward succession in the Gebenstorf-Stilli Trough (Buechi et al., Reference Buechi, Landgraf, Madritsch, Mueller, Knipping, Nyffenegger, Preusser, Schaller, Schnellmann and Deplazes2024) that was originally probably also present, but later eroded, in the GST, which would correspond to an ancient lake level of at least ∼330 m asl. The preserved sandy infill of the trough indicates a comparatively glacier-proximal setting with high sediment input from three Alpine catchments. Deformed and/or massive LFA 3 sections point towards instability due to rapid deposition and consequent soft-sediment deformation but could also be related to drilling (Mills, Reference Mills1983; Pisarska-Jamrozy and Weckwerth, Reference Pisarska-Jamrozy and Weckwerth2013). However, especially in QGBR, the majority of the basin infill is well bedded, with darker, sand-dominated layers alternating with lighter and thinner, silt-dominated layers (Fig. 6E). Such rhythmic alternations are encountered throughout the entire succession in relatively constant thickness of a few cm. They are tentatively interpreted as clastic varves (Peach and Perrie, Reference Peach and Perrie1975; Leonard, Reference Leonard1986; Zolitschka et al., Reference Zolitschka, Francus, Ojala and Schimmelmann2015), and suggest an emplacement of the lacustrine sequence during a single, continuous phase over few thousand years at most. This interpretation is supported by the generally uniform sedimentology as well as the only slightly and gradually changing geochemistry, as reflected by the CaCO3 and TOC content (Fig. 3). However, repeatedly occurring intervals that are distinctly enriched in fines (and consequently of higher shear strength; Fig. 3) and/or contain dropstones may indicate decadal- to centennial-scale oscillations of a glacier front farther south that influenced sediment input into the basin (as observed elsewhere, e.g., Smedley et al., Reference Smedley, Chiverrell, Ballantyne, Burke, Clark, Duller, Fabel, McCarroll, Scourse and Small2017; Chiverrell et al., Reference Chiverrell, Smedley, Small, Ballantyne, Burke, Callard, Clark, Duller, Evans and Fabel2018).
Origin of gravels at the distal trough end
Overlying the Gebenstorf Trough diamict, QUST recovered exclusively sandy gravel with occasional sand interbeds. Logs of several dozen previous boreholes in the study area confirm that the distal GST infill is generally gravelly (Stilli Delta Gravel; Fig. 10). Based on seismic and drilling data, we assume a total volume of these coarse-grained sediments of ∼5×10⁷ m3 (Gegg et al., Reference Gegg, Deplazes, Keller, Madritsch, Spillmann, Anselmetti and Buechi2021). Two groundwater exploration boreholes (47°30′20″N, 8°14′11″E and 47°30′39″N, 8°14′04″E) further reveal an interdigitation of the Stilli Delta Gravel with the Gebenstorf Sand, and thus a simultaneous deposition of both facies (Fig. 10). The distal gravels of the GST must have been emplaced in a (glacio-)deltaic setting, which agrees well with the thick-bedded and frequently graded architecture (e.g., Gilbert et al., Reference Gilbert, Cable, Thiel, Christiansen and Elberling2017).
The petrographic composition of the gravels throughout QUST is dominated by far-travelled, Alpine lithologies (≥ 90%; see Supplementary Table 3, Gegg et al., Reference Gegg, Deplazes, Keller, Madritsch, Spillmann, Anselmetti and Buechi2021), precluding an origin from local erosion in the Mesozoic rocks cropping out in the vicinity. Counterintuitively, the Stilli Delta Gravel must have been deposited from upstream by glacial and/or glaciofluvial transport toward the distal trough end. Near the trough base, a (sub)glacial origin of the coarse-grained material, being transported towards the terminal slope of the overdeepening by water flow along the glacier base, cannot be excluded (Mullins and Hinchey, Reference Mullins and Hinchey1989). However, farther up the sequence, the gravels interfinger with well-sorted and well-bedded lacustrine sands that are not compatible with an overlying glacier. The petrography of the Stilli Delta Gravel in QUST shows a strong Limmat signal (Figs. 7 and 8), indicating that it was delivered from the Limmat catchment laterally into the overdeepening, forming a gravel delta at the distal trough end, in front of the lacustrine sands.
This hypothesis is plausible considering the bedrock morphology: large parts of the Aare and Reuss valleys farther south, for example the Birrfeld Basin (Fig. 2), are overdeepened and therefore prone to retain coarse-grained sediment. In contrast, overdeepened sections in the Limmat Valley occur only ∼20 km upstream of the study area (Jordan, Reference Jordan2010; Pietsch and Jordan, Reference Pietsch and Jordan2014), and any coarse-grained material delivered into the valley in between, for example as melt-out during ice retreat, likely would have been transported into the GST. This input of Limmat-derived material, however, probably did not occur at its present-day confluence point with the Aare but farther north, at the exit of the Surb Valley (Fig. 2), as demonstrated by Graf (Reference Graf2009a) based on gravel petrographic analyses.
Glacial re-advance
In contrast to the seemingly continuous sedimentology in QGBR and QUST, the Gebenstorf Sand is sharply overlain by a ∼2-m-thick gravelly intercalation (Vogelsang Gravel) in QGVO at ∼28 m depth (Figs. 6I and 9). This interbed coincides with an abrupt up-section decrease in CaCO3 and a significant increase in fines as well as outsized gravel clasts (Fig. 4) that signal a drastic change in the basin sedimentation. A striated dark limestone clast at the top of the gravel bed together with the diamictic character of the overlying LFA 3 deposits (Vogelsang Sand; Fig. 10) indicates renewed glacier proximity. This points towards a re-advance very close to, and possibly over, the site of QGVO (although a reworking of older deposits in the vicinity, for example by a mass movement affecting the Tiefere Deckenschotter at Bruggerberg, cannot entirely be excluded, cf. Fig. 11). Although this facies change also is observed in several previous boreholes near QGVO, it is missing in the record of QGBR, which is located few km farther upstream, where no clear indication for a renewed ice contact is found. Therefore, it would seem plausible that the sedimentological break in QGVO is the result of a lateral advance into the GST that did not reach the site of QGBR. However, its petrographic composition (Figs. 7 and 8) indicates that the Vogelsang Gravel has a rather Reuss-dominated petrography, indicating an axial advance along the Reuss Valley and over the GST, thus affecting also QGBR. Its petrographic composition further allows identification of the Vogelsang Gravel in the record of QUST: between ∼25 and ∼40 m depth, the strong Limmat signal that is otherwise characteristic for the gravels in this borehole is interrupted by a phase of deposition of Reuss-facies gravels (Figs. 5, 7, 8). This strongly suggests a later advance of the Reuss glacier into the GST that carved out a second inlaid basin that was quickly filled during its retreat (Fig. 10). Whether this re-advance occurred during the same glacial cycle and only briefly after deposition of the underlying Gebenstorf Sand, or after a considerable hiatus, cannot be determined from the sedimentary facies.
Post-lacustrine phase
The (glacio-)lacustrine infill of the GST is sharply truncated and overlain by ∼15 m of Late Pleistocene Niederterrasse gravel (Fig. 10; Graf et al., Reference Graf, Bitterli-Dreher, Burger, Bitterli, Diebold and Naef2006). Interglacial deposits and/or soil have not been recovered in between, although the top of the underlying LFA 3 in QGVO shows a slightly more brownish color that may be due to temperate weathering (Fig. 6H). The Niederterrasse has a prevailing Aare signature at QGBR, a Limmat signature at QGVO, and a mixed Aare-Limmat signature at QUST (Figs. 7 and 8). Borehole data indicate that the Niederterrasse fills distinct channels incised into the glaciolacustrine deposits (Fig. 10; Gegg et al., Reference Gegg, Deplazes, Keller, Madritsch, Spillmann, Anselmetti and Buechi2021). Several previous boreholes at the northern end of the GST recovered limestone blocks at ∼320 m asl (317.2 m asl or 13.9 m depth in QUST), which indicates an important event horizon within the lower part of the Niederterrasse. Finally, anthropogenic waste in the cover diamicts of QGBR identifies this material as a recent waste deposit (Graf et al., Reference Graf, Bitterli-Dreher, Burger, Bitterli, Diebold and Naef2006).
Evolution of the Habsburg-Rinikerfeld Palaeochannel
At the base of the HRPC, borehole QRIN recovered ∼3.5 m of an overconsolidated subglacial till that is matrix-rich but also contains frequent striated clasts (Rinikerfeld Basal Till; Gegg et al., Reference Gegg, Anselmetti, Deplazes, Knipping, Madritsch, Mueller, Preusser, Vogel and Buechi2023). It is overlain by ∼2 m of poorly sorted gravels, and both have the same Aare-dominated petrographic composition (Figs. 7, 8, 11). They are in turn overlain by a lacustrine sequence (Rinikerfeld Paleolake) that develops from an ice-contact toward a periglacial and lastly a cold-temperate setting. Geotechnical evidence suggests that this sequence, which is capped by colluvial deposits, was overridden by a later ice advance (Mueller et al., Reference Mueller, Preusser, Buechi, Gegg and Deplazes2020; Gegg et al., Reference Gegg, Anselmetti, Deplazes, Knipping, Madritsch, Mueller, Preusser, Vogel and Buechi2023).
The main depositional units encountered in the HRPC however are the Habsburg Gravel and Remigen Gravel, two units attributed to two separate Middle Pleistocene glaciations (Fig. 11). These glaciofluvial units can be distinguished based on their petrographic compositions. The older Habsburg Gravel has a clear Aare (/Reuss) provenance (Figs. 7 and 8; Bitterli-Dreher et al., Reference Bitterli-Dreher, Graf, Naef, Diebold, Matousek, Burger and Pauli-Gabi2007; Graf, Reference Graf2009a). Based on petrographic data, we thus identify the gravel underlying the paleolake in QRIN as Habsburg Gravel, and we further show that the Rinikerfeld Basal Till has the same Aare-dominated composition (Fig. 7). The two depositional facies, till and gravel, could represent two different glacial cycles, as has previously been assumed, whose ice advances shared the same provenance. However, it appears more likely that both were deposited by the same glacier and during the same glaciation, and that this glaciation advanced into and possibly well beyond the Rinikerfeld.
The Remigen Gravel occurs locally on top of the Habsburg Gravel, sometimes in the shape of an incised channel fill (Figs. 11 and 12; Graf, Reference Graf2009a, Preusser et al., Reference Preusser, Graf, Keller, Krayss and Schlüchter2011) and has a Reuss- (/Limmat-) dominated petrography. We thus identify deposits north of Brugg (Hansfluhsteig, HS-Hfs; Fig. 2) that were previously attributed to the Habsburg Gravel (Graf et al., Reference Graf, Bitterli-Dreher, Burger, Bitterli, Diebold and Naef2006) as Remigen Gravel based on their composition (Figs. 6 and 7). The same applies to gravels cropping out in the Götschtel pit farther south (HS-Gö1/-2; Habsburg Gravel in Graf et al., Reference Graf, Bitterli-Dreher, Burger, Bitterli, Diebold and Naef2006, but already attributed to the Remigen Gravel in Graf, Reference Graf2009a). Previous boreholes recorded intercalated diamictic deposits within the Remigen Gravel east of the former gravel pit at Alpberg (RS-Re). These were identified as tills (Remigen Till 1) by the site geologist and thus indicate an intermittent ice advance at least to the northern margin of the Rinikerfeld during deposition of the Remigen Gravel (Fig. 11).
Cross-section B (see Figure 2 for location) through the study area illustrating the stratigraphy of the HRPC (see Gegg et al., Reference Gegg, Anselmetti, Deplazes, Knipping, Madritsch, Mueller, Preusser, Vogel and Buechi2023) and the overdeepened GST. Profile A (Figure 10) intersects at ∼5.5 km.
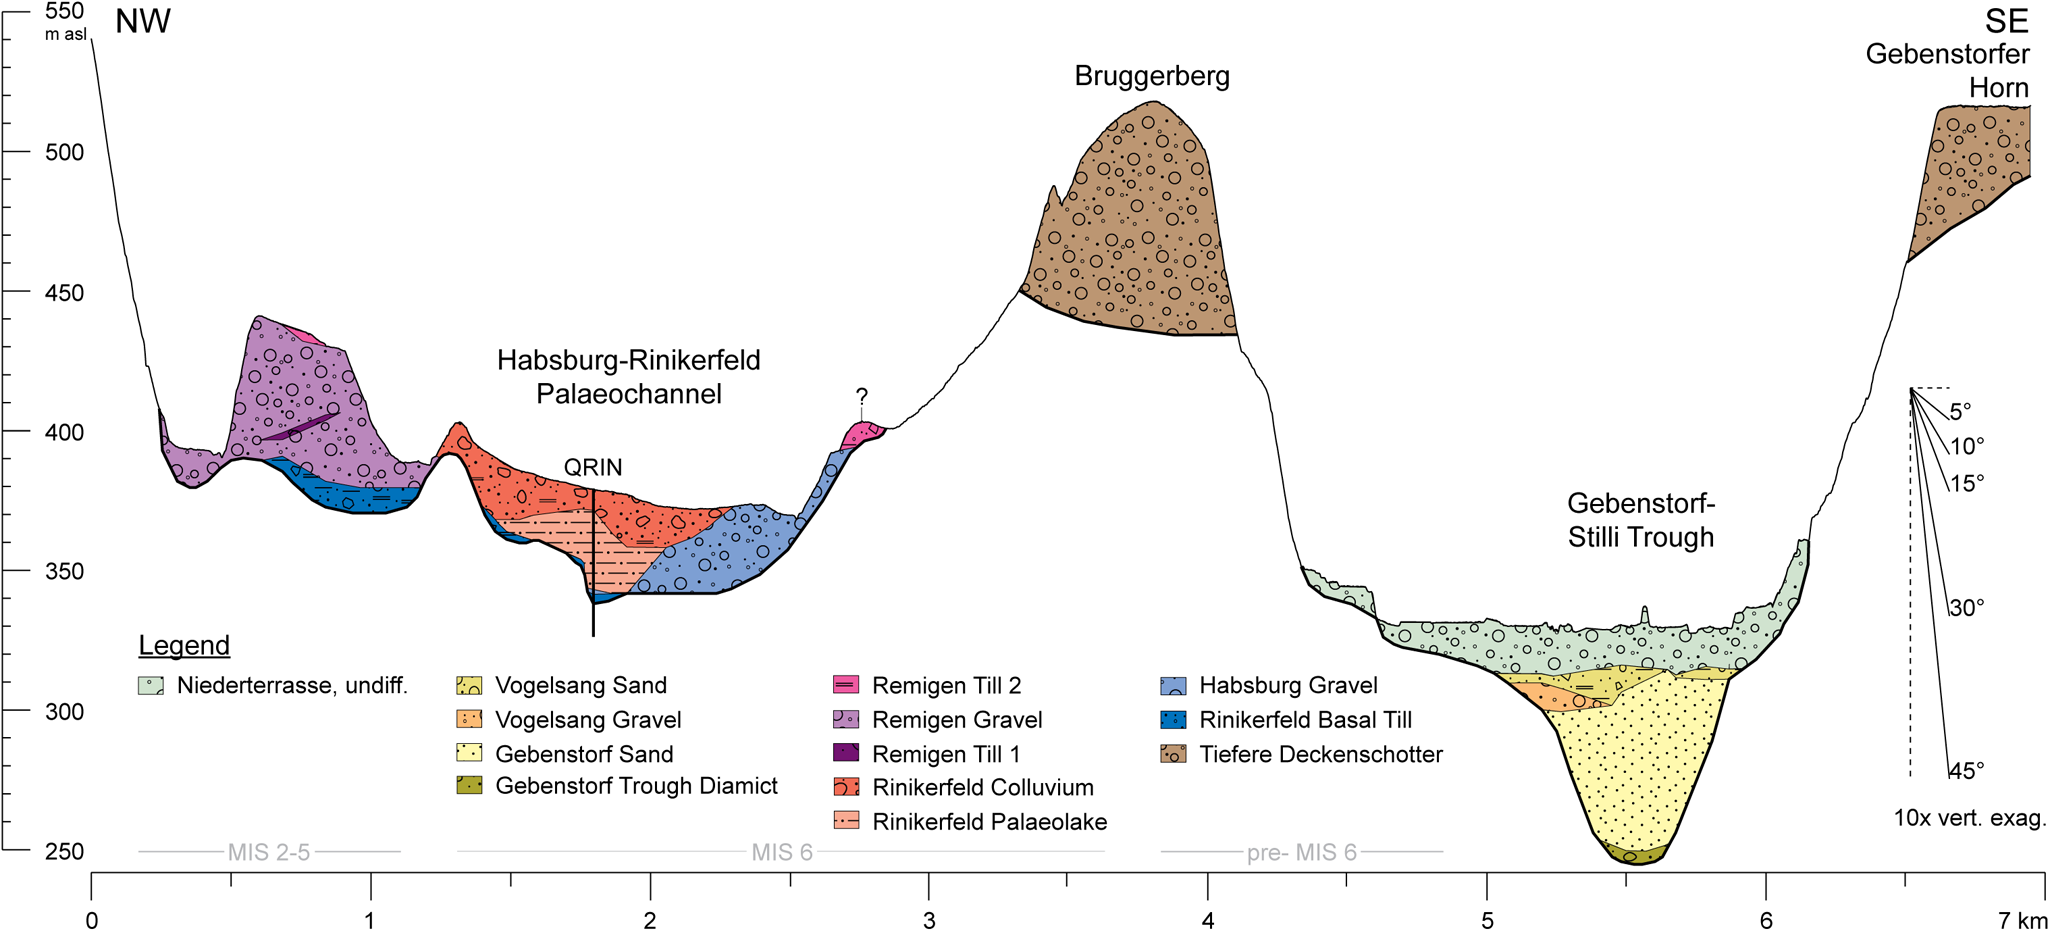
Schematic longitudinal profile through the study area, from the JFTB in the south (right) to the High Rhine in the north (left; see Figure 2). Polygons represent the positions of the different glaciofluvial units, labels refer to outcrops as listed in Supplementary Table 1. Base of Quaternary from Pietsch and Jordan (Reference Pietsch and Jordan2014) and Gegg et al. (Reference Gegg, Deplazes, Keller, Madritsch, Spillmann, Anselmetti and Buechi2021).
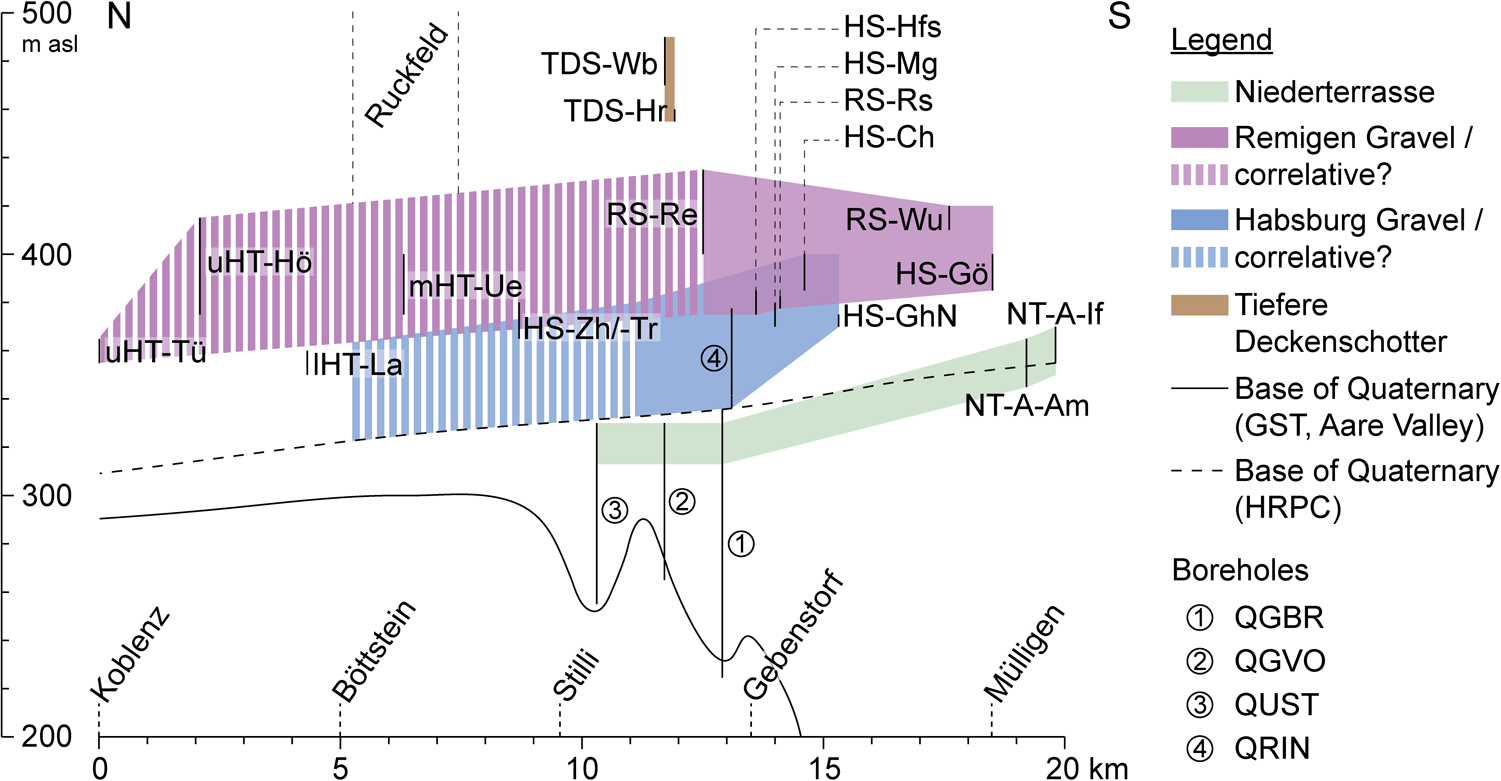
The Remigen Gravel also was overridden by a later ice advance, as indicated by a till cap exposed in the Alpberg pit (Remigen Till 2) as well as by glaciotectonic deformations and crushed clasts in the Götschtel pit. Evidence of ice contact in the form of striated clasts and entire polished conglomerate blocks is also encountered at the top of the Upper Hochterrasse in the Hönger gravel pit farther north (uHT-Hö, Fig. 2; see also Bugmann, Reference Bugmann1961; Graf, Reference Graf2009a). This unit was interpreted as a correlative of the Habsburg Gravel by Graf (Reference Graf2009a), but with a different, mixed Aare/Reuss/Limmat/Rhine petrography, the latter being supported by our compositional data (Figs. 7 and 8). Based on the outcrop elevations and the ice contact at the top of both units, we suggest that the Upper Hochterrasse might correlate rather to the Remigen Gravel, while the elevation of the Habsburg Gravel corresponds better to the Middle and Lower Hochterrasse (Fig. 12). A paleosol between gravel and till remnants at the Hönger outcrop that was suggested by Bugmann (Reference Bugmann1961) could not be confirmed.
Concerning petrographic compositions, it is noteworthy that a considerable number of samples from both HRPC and GST have more ‘extreme’ gravel spectra (i.e., higher PC scores) than the assumed true EMs from the Niederterrasse of Aare, Reuss, and Limmat (Fig. 8). This may in part be due to the small number of reference samples that do not represent the variability of the true EMs well. Higher amounts of quartzites compared to the Aare reference samples could further be explained by post-depositional weathering of less-resistant clasts, which likely applies to the sample from Haselloch (HS-Zh, Supplementary Table 4). For the fresher-looking samples from QGBR and QRIN, this is probably not the case. Following Graf (Reference Graf2009a), their enrichment of quartzites might indicate a relatively higher rate of reworking of material from molasse-fan deposits in the proximal foreland (Schlunegger et al., Reference Schlunegger, Matter and Mange1993; Berger et al., Reference Berger, Reichenbacher, Becker, Grimm, Grimm, Picot, Storni, Pirkenseer, Derer and Schaefer2005) compared to the supply rate of new debris from the Alps (see also Schlüchter, Reference Schlüchter1975). However, the opposite would have to be the case to explain the amounts of Alpine limestones (considered freshly delivered material; cf., Schlüchter, Reference Schlüchter1975) in some samples that are larger than the Limmat reference samples (Fig. 8). The deposits might represent different phases (e.g., advance or retreat) during a glacial cycle, where erosion rates, and potentially their spatial pattern, can vary significantly (cf., Koppes et al., Reference Koppes, Sylwester, Rivera and Hallet2010; Aitken et al., Reference Aitken, Roberts, Ommen, Young, Golledge, Greenbaum, Blankenship and Siegert2016).
In summary, we observe clear evidence for two separate glaciofluvial gravel units in the HRPC, the older (Habsburg Gravel) deposited on top of a subglacial till bed, whereas the younger (Remigen Gravel) contains intercalated till and/or a till cover at a few locations (Fig. 11). The stratigraphic architecture of the Ruckfeld few km farther downstream (Fig. 2) fits seamlessly into this pattern. In concert with regional-scale seismic data, we interpret SF A as Mesozoic strata that, north of the JFTB, occur in a largely undisturbed, subhorizontal pattern (Fig. 9; major internal reflections a and b of the Mesozoic likely represent the base of the Upper Jurassic Wildegg Formation and Middle Jurassic Klingnau Formation, respectively; cf., Madritsch et al., Reference Madritsch, Meier, Kuhn, Roth, Zingg, Heuberger, Naef and Birkhäuser2013). SF B represents Quaternary strata that unconformably overlie the Mesozoic bedrock at ca. 0.2 s TWT. The base of the Quaternary is slightly irregular but shows no evidence of overdeepening (cf., Graf, Reference Graf2009a); the largest depression at ∼600 m along line 16-QAU_23 is likely an incised fluvial channel.
In some places, a horizontal internal reflection separates the Pleistocene into a lower and an upper part. The lower part contains distinct units of higher-amplitude irregular reflectors that are filled in with largely seismically transparent material. We interpret the former as till bodies (i.e., moraine ridges or a dissected ice-decay landscape) covered by glaciofluvial outwash. Comparable seismic facies are connected to similar lithologies for example in the Tannwald Basin in southwestern Germany (∼100 km ENE; Burschil et al., Reference Burschil, Buness, Tanner, Wielandt-Schuster, Ellwanger and Gabriel2018, SF A; Schuster et al., Reference Schuster, Gegg, Schaller, Buechi, Tanner, Wielandt-Schuster, Anselmetti and Preusser2024). Some minor dislocations can be observed, often adjacent to the presumed till bodies, and thus are considered a result of sagging after melting of dead ice, or of later glaciotectonic deformation. We further suggest correlation of the lower subunit with the Habsburg Gravel and underlying till, and correlation of the upper, mostly transparent subunit with the Remigen Gravel of the HRPC (with a more or less extensive loess cover; Preusser and Graf, Reference Preusser and Graf2002; Fig. 12), supporting a two-phase aggrading origin of the Ruckfeld gravel plain, as suggested by Bitterli et al. (Reference Bitterli, Graf, Matousek and Wanner2000). It is noteworthy that the Ruckfeld is located directly above the northernmost thrust of the JFTB (Mandach Thrust; Fig. 2; Bitterli-Brunner, Reference Bitterli-Brunner1987; Madritsch et al., Reference Madritsch, Looser, Schneeberger, Wohlwend, Guillong and Malz2024). While some indications of Early Pleistocene activity have been reported (Graf, Reference Graf1993; Bitterli et al., Reference Bitterli, Graf, Matousek and Wanner2000), no clear dislocation of the Middle Pleistocene glaciofluvial deposits of the Ruckfeld along this fault can be identified.
Chronology
A tentative sequence of glacial advances and geomorphic events across the study area was proposed by Bitterli-Dreher et al. (Reference Bitterli-Dreher, Graf, Naef, Diebold, Matousek, Burger and Pauli-Gabi2007) and Graf (Reference Graf2009a). It is here compared with results from this study together with luminescence age estimates by Mueller et al. (Reference Mueller, Preusser, Buechi, Gegg and Deplazes2020, Reference Mueller, Gegg, Fülling, Buechi, Deplazes and Preusser2024) as well as detailed investigations of the QRIN profile by Gegg et al. (Reference Gegg, Anselmetti, Deplazes, Knipping, Madritsch, Mueller, Preusser, Vogel and Buechi2023). Previously, it was suggested that the HRPC was formed prior to, and occupied by glacier ice during, the Möhlin Glacial (‘most extensive glaciation’), which likely represents MIS 12 (Preusser et al., Reference Preusser, Büschelberger, Kemna, Miocic, Mueller and May2021; Dieleman et al., Reference Dieleman, Christl, Vockenhuber, Gautschi, Graf and Akçar2022b). The paleolake deposits in the Rinikerfeld have been tentatively attributed to the retreat phase of this glaciation. Two later proposed ice advances of lesser extent, termed Habsburg and Hagenholz (MIS 10–8?), resulted mainly in the accumulation of glaciofluvial gravels along the HRPC and its northward continuation. These are Habsburg Gravel and Upper Hochterrasse, and Ruckfeld Gravel and Middle Hochterrasse, respectively (Bitterli-Dreher et al., Reference Bitterli-Dreher, Graf, Naef, Diebold, Matousek, Burger and Pauli-Gabi2007; Graf, Reference Graf2009a). The Rinikerfeld Basal Till from QRIN thus represents the first documented phase of glacial occupancy in the HRPC, and our gravel petrographic data indicate that it was deposited by the same glacier, and thus during the same glaciation, as the Habsburg Gravel (Figs. 7 and 8; Gegg et al., Reference Gegg, Anselmetti, Deplazes, Knipping, Madritsch, Mueller, Preusser, Vogel and Buechi2023). Unfortunately, no sand layers or lenses suitable for luminescence dating were encountered in either QRIN or one of the outcrops of the Habsburg Gravel. We consider it not unlikely that these deposits represent the Möhlin Glacial/MIS 12 (e.g., Graf, Reference Graf2009a), but also a later phase (Habsburg/MIS 10?; e.g., Preusser et al., Reference Preusser, Graf, Keller, Krayss and Schlüchter2011) cannot be excluded (Figs. 1, 13A, B). The Rinikerfeld Paleolake however is clearly younger (see below).
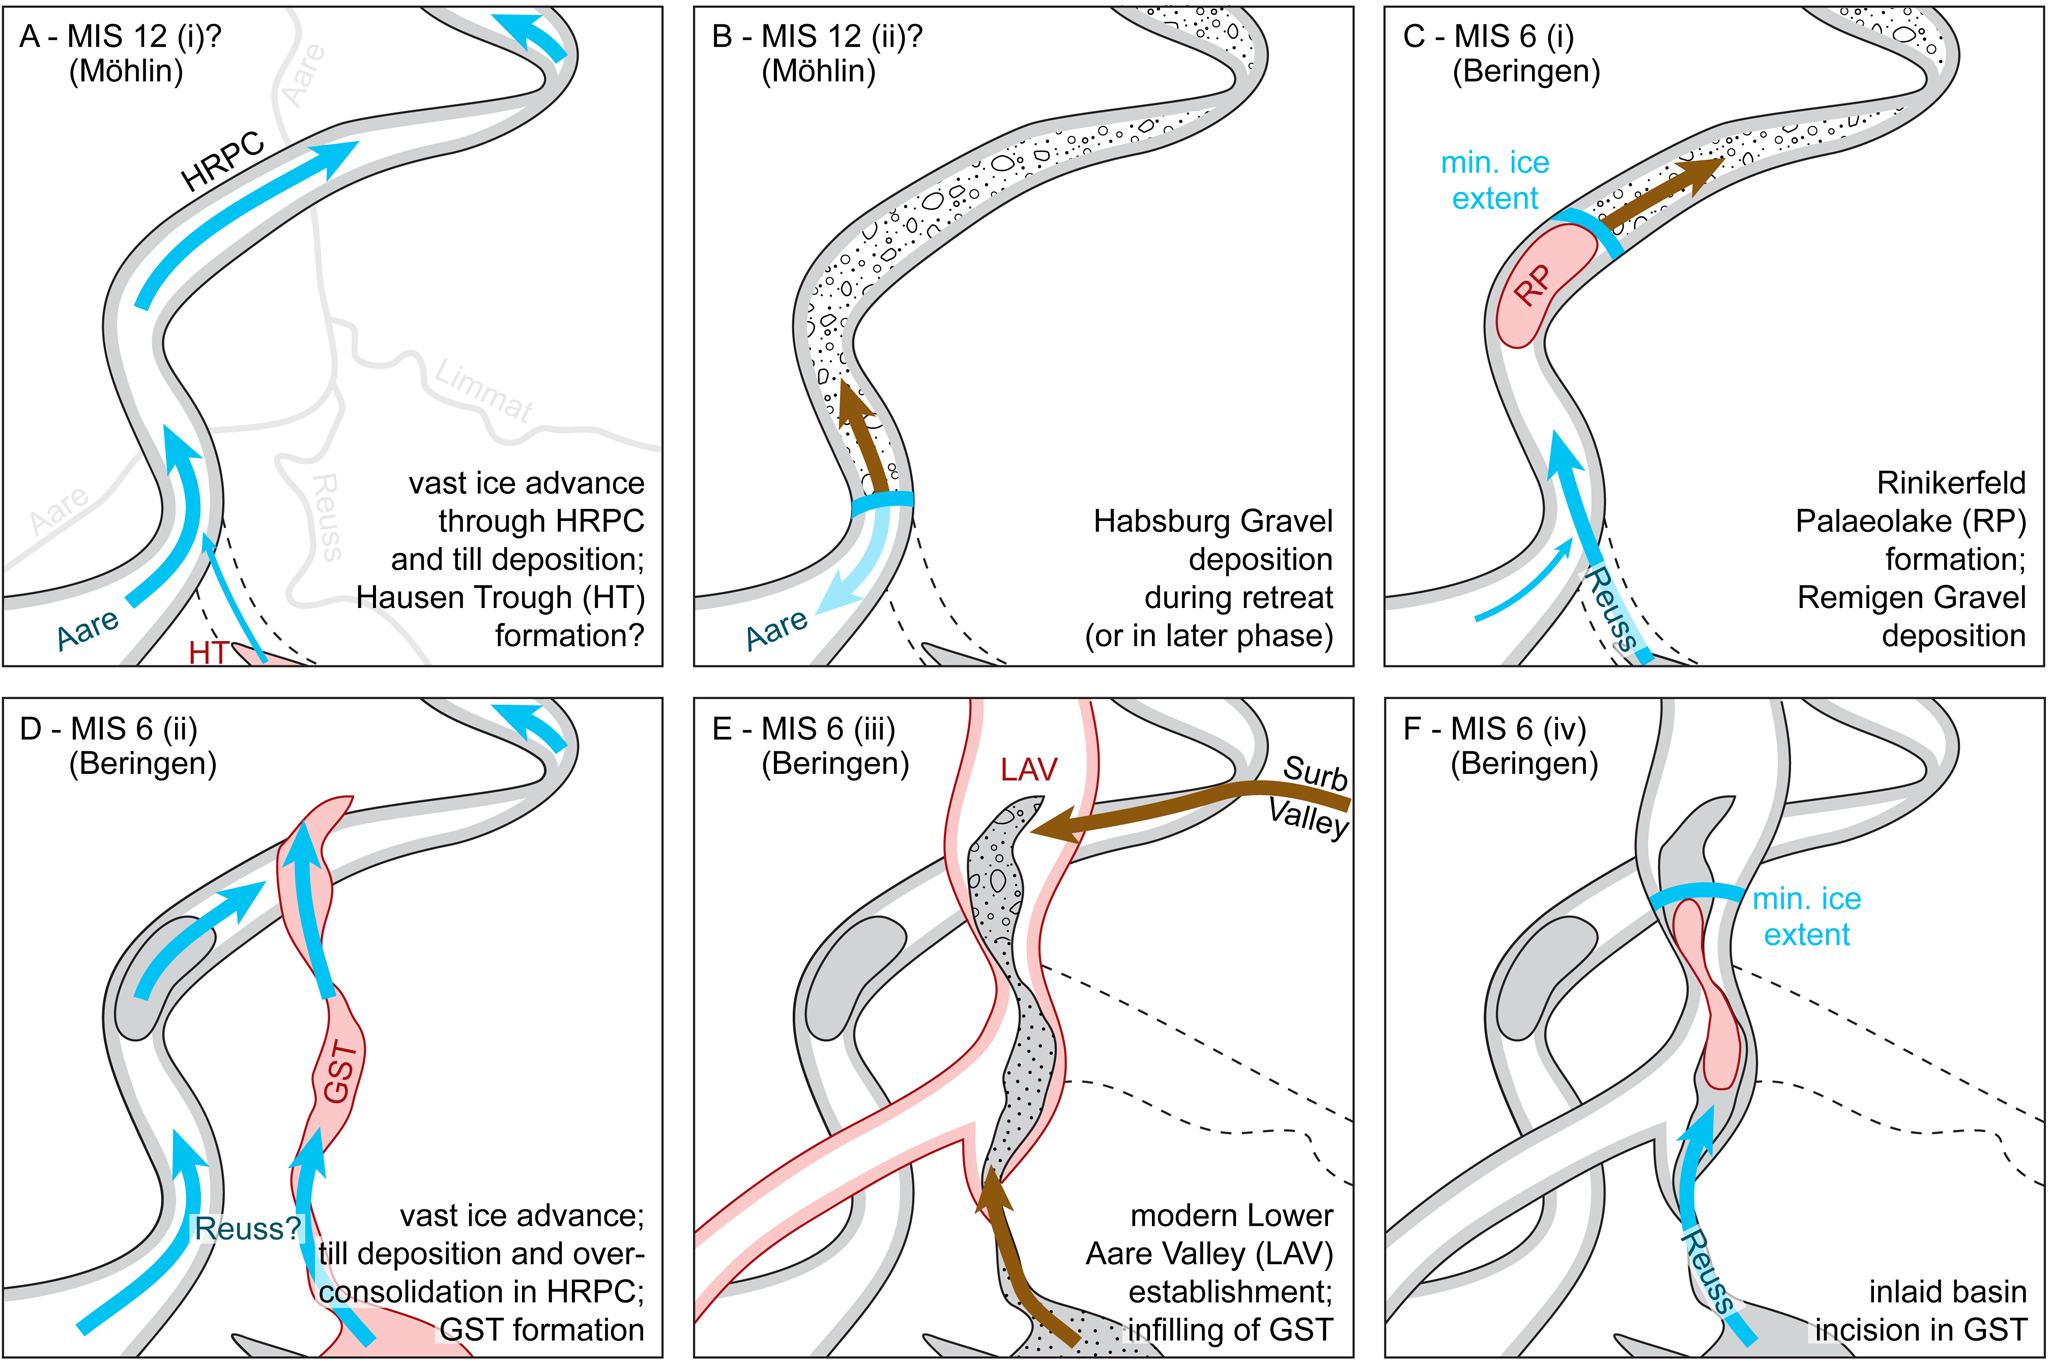
Schematic sketch of the Wasserschloss area’s proposed evolution during the Middle Pleistocene. (A) Advance by a paleo-Aare glacier along the HRPC, possibly in MIS 12 (Möhlin Glacial/‘most extensive glaciation’) left a sporadic basal till layer behind. Present-day rivers are plotted in light gray for orientation (see Figure 2). (B) The Habsburg Gravel was deposited either by the same glacier during its retreat (brown arrow) or, alternatively, in a later glaciation such as MIS 10. (C) Advance of a paleo-Reuss glacier into the HRPC in early MIS 6 (Beringen Glacial) resulted in lake formation in the Rinikerfeld and deposition of the Remigen Gravel. (D) Later during the same glaciation, an extensive ice advance overrode the study area, leading to overconsolidation of the Rinikerfeld Palaeolake, till deposition on top of the Remigen Gravel, and likely incision of the GST. (E) Infilling of the GST started with onset of glacier retreat. With the GST established, drainage was significantly lowered (∼50 m below the HRPC) and rerouted. The modern Limmat Valley (dashed) was probably not active as gravel of Limmat provenance was being delivered into the GST via the Surb Valley (Graf, Reference Graf2009a). (F) An inlaid overdeepened basin attests to the re-advancement of a paleo-Reuss glacier over the GST.
The Beringen Glacial (MIS 6) reached far north into the High Rhine Valley and reflects the last phase of glaciofluvial drainage through the HRPC, before development of the current Wasserschloss (Bitterli-Dreher et al., Reference Bitterli-Dreher, Graf, Naef, Diebold, Matousek, Burger and Pauli-Gabi2007; Graf, Reference Graf2009a; Preusser et al., Reference Preusser, Graf, Keller, Krayss and Schlüchter2011). The paleolake deposits in the Rinikerfeld recently have been shown to reflect a phase of ice retreat during early MIS 6 (Fig. 13C; Mueller et al., Reference Mueller, Preusser, Buechi, Gegg and Deplazes2020, Reference Mueller, Gegg, Fülling, Buechi, Deplazes and Preusser2024; Gegg et al., Reference Gegg, Anselmetti, Deplazes, Knipping, Madritsch, Mueller, Preusser, Vogel and Buechi2023). Mueller et al. (Reference Mueller, Gegg, Fülling, Buechi, Deplazes and Preusser2024) provided minimum depositional ages corresponding to MIS 5 for outcrops of the Remigen Gravel (HABS = Götschtel gravel pit/outcrop 5, > 100 ± 12 ka; RINI = Alpberg gravel pit/outcrop 10, > 92 ± 13 ka; see Fig. 2 and Supplementary Table 2). We suggest that deposition of the Remigen Gravel may have started during the same early MIS 6 ice advance (∼Hagenholz sensu Keller and Krayss, Reference Keller and Krayss2010) and continued with the following second MIS 6 ice advance (in agreement with Bitterli-Dreher et al., Reference Bitterli-Dreher, Graf, Naef, Diebold, Matousek, Burger and Pauli-Gabi2007; Graf, Reference Graf2009a; Preusser et al., Reference Preusser, Graf, Keller, Krayss and Schlüchter2011). Both the Rinikerfeld Paleolake as well as the Remigen Gravel (and the proposed correlative deposits of the Ruckfeld and Upper Hochterrasse) show good evidence of being overridden by a later ice advance despite their position well outside the maximum Late Pleistocene glacier extent (e.g., Preusser et al., Reference Preusser, Graf, Keller, Krayss and Schlüchter2011). A similar situation in the form of an early ice advance followed by a phase of glaciofluvial or glaciolacustrine deposition and a second, extensive ice advance later during the same glacial period was suggested for overdeepening-fill profiles in the Wehntal (Anselmetti et al., Reference Anselmetti, Drescher-Schneider, Furrer, Graf, Lowick, Preusser and Riedi2010; Dehnert et al., Reference Dehnert, Lowick, Preusser, Anselmetti, Drescher-Schneider, Graf, Heller, Horstmeyer, Kemna and Nowaczyk2012) and Lower Glatt Valley (Buechi et al., Reference Buechi, Graf, Haldimann, Lowick and Anselmetti2018), both also dated to MIS 6. This vast second Beringen advance marks the last phase of glacial (or glaciofluvial) occupancy in the HRPC (Fig. 13D).
While the initial formation of the overdeepened Birrfeld Basin (Fig. 2) probably started during the Habsburg Glacial at the latest, incision of the GST is also attributed to the Beringen Glacial. It has been argued that formation of the GST would have caused abandonment of the HRPC (Bitterli-Dreher et al., Reference Bitterli-Dreher, Graf, Naef, Diebold, Matousek, Burger and Pauli-Gabi2007; Graf, Reference Graf2009a; Gegg et al., Reference Gegg, Anselmetti, Deplazes, Knipping, Madritsch, Mueller, Preusser, Vogel and Buechi2023). MIS 5 minimum ages have been reported for the glaciolacustrine/glaciodeltaic infill of the GST at QGBR (91.6 m depth; > 92 ± 22 ka) and QUST (33.2 m depth, > 104 ± 14 ka) in Mueller et al. (Reference Mueller, Gegg, Fülling, Buechi, Deplazes and Preusser2024). An incision during the second Beringen advance is indeed the most likely scenario for formation of the GST. This was followed by its infilling with sediments upon the beginning of ice decay as well as re-adjustment of the local drainage network (Fig. 13E). A second inlaid basin within the GST (Fig. 10) finally attests to a third Beringen ice advance into the study area (Fig. 13F). This complex sequence of events agrees with luminescence data from the Klettgau area (Lowick et al., Reference Lowick, Buechi, Gaar, Graf and Preusser2015) that indicate up to four phases of deposition along the High Rhine during MIS 6.
The last glacial cycle, regionally referred to as Birrfeld Glacial, spans the majority of the Late Pleistocene (Preusser, Reference Preusser2004; Ivy-Ochs et al., Reference Ivy‐Ochs, Kerschner, Reuther, Preusser, Heine, Maisch, Kubik and Schlüchter2008) and, in our study area, is represented by glaciofluvial Niederterrasse gravel along the current river valleys. It comprises three phases of ice build-up in the Central Alps, with the final one peaking at ca. 25 ka (MIS 2; Gaar et al., Reference Gaar, Graf and Preusser2019; Kamleitner et al., Reference Kamleitner, Ivy-Ochs, Manatschal, Akçar, Christl, Vockenhuber, Hajdas and Synal2023). Gaar et al. (Reference Gaar, Graf and Preusser2019) present luminescence ages from Niederterrasse deposits in the Aare Valley and Birrfeld/Reuss Valley that correspond to this regional last glacial maximum. Cosmogenic nuclide data from moraines in the same area (Reber et al., Reference Reber, Akçar, Ivy-Ochs, Tikhomirov, Burkhalter, Zahno, Lüthold, Kubik, Vockenhuber and Schlüchter2014) as well as radiocarbon data of mammoth tusks and other macrofossils found in several gravel pits (Graf, Reference Graf2009a) yield similar ages.
In contrast, luminescence dating of two Niederterrasse samples from QGBR (11.2 m depth, ca. 90 ka) and QUST (13.2 m depth, > ca. 50 ka) by Mueller et al. (Reference Mueller, Gegg, Fülling, Buechi, Deplazes and Preusser2024) resulted in ages corresponding to late MIS 5 and MIS 3 or earlier, respectively. This is perhaps unexpected but not unrealistic, because two earlier Late Pleistocene ice advances occurred during MIS 5d and MIS 4 (Fig. 1; Ivy-Ochs et al., Reference Ivy‐Ochs, Kerschner, Reuther, Preusser, Heine, Maisch, Kubik and Schlüchter2008; Preusser et al., Reference Preusser, Graf, Keller, Krayss and Schlüchter2011). Glaciofluvial outwash corresponding to a cold phase in MIS 5d was previously identified farther upstream in the Aare Valley (Thalgut; Preusser and Schlüchter, Reference Preusser and Schlüchter2004), in the Glatt (Gossau; Preusser et al., Reference Preusser, Geyh and Schlüchter2003) and Klettgau valleys (Lowick et al., Reference Lowick, Buechi, Gaar, Graf and Preusser2015), and potentially also in the Reuss Valley (Gaar et al., Reference Gaar, Graf and Preusser2019). MIS 4 deposits are known from the Rhone piedmont glacier area (Preusser et al., Reference Preusser, Blei, Graf and Schlüchter2007) and in the Reuss Valley in close vicinity to our study area (Preusser and Graf, Reference Preusser and Graf2002; Gaar et al., Reference Gaar, Graf and Preusser2019). The occurrence of the same older Upper Pleistocene gravels in the Wasserschloss area, in shallow depth and close to the present-day river course, emphasizes that the corresponding ice advances produced considerable amounts of sediment. However, reworking of MIS 5d- or MIS 4-aged gravels without sufficient light exposure to reset the luminescence signal during MIS 2 cannot be excluded.
Conclusions
We presented results from an extensive drilling and field campaign targeted at the (Middle) Pleistocene sedimentary archives in the Wasserschloss area, the confluence of the Aare, Reuss, and Limmat rivers in Northern Switzerland. These archives occur in the Habsburg-Rinikerfeld Palaeochannel (HRPC), which is part of a now elevated, older drainage network that is only sporadically preserved, and in the overdeepened Gebenstorf-Stilli Trough (GST) that underlies the current river path. In the HRPC an early Middle Pleistocene occupancy by a glacier with a dominant Aare signature in its deposits, potentially during MIS 12, is recorded by basal till and glaciofluvial outwash. In a later phase, most likely during MIS 6, another glacier advanced into the HRPC twice, leaving behind sporadic occurrences of lake deposits, till, and large amounts of glaciofluvial gravel with a dominant Reuss signature. Presumably during the extensive second advance, subglacial erosion sculpted the GST, a new pathway that was subsequently infilled by thick glaciodeltaic to glaciolacustrine sands and gravels. These were finally overridden and partly re-excavated by a third MIS 6 ice advance. This complex pattern of at least two separate ice advances appears to be characteristic of the penultimate glaciation in the midlands of Northern Switzerland and beyond. The incision of the GST triggered local re-arrangement of the river system, with abandonment of the HRPC and development of the modern Wasserschloss morphology. In the Late Pleistocene, glaciofluvial gravels were deposited along the modern river valleys in three distinct phases (MIS 5d, MIS 4, and MIS 2).
The study area stands out from the majority of other Quaternary sites in the Swiss Alpine foreland due to its local geological and topographic settings. While many well-studied localities are situated in the Molasse Basin, the GST and HRPC lie within the easternmost Jura Mountains. In these diverse but generally rather erosion-resistant Mesozoic rocks, pronounced relief developed with morphologically well-defined and comparatively stable valleys. As a result, the Pleistocene ice advances and meltwater streams were not only topographically constrained but also repeatedly directed along the same pathways. One consequence of the repeated occupation of the same valleys is a complex, interwoven stratigraphy whose components are difficult to identify and resolve. This study emphasizes the potential of gravel petrographic analyses that can help distinguish genetic units and build a relative stratigraphy even where chronostratigraphic approaches are difficult. A second consequence is a preservation potential for glacial deposits (sensu lato) that locally is even smaller than in other areas, as multiple phases of glacial and/or glaciofluvial reactivation of the same valleys effectively obliterate older remnants. Consequently, we encountered mainly sediments that we attribute to the regionally extensive penultimate glaciation (Beringen Glacial, MIS 6), although some relicts presumably represent an older stage that might be the ‘most extensive glaciation’ (Möhlin Glacial, likely MIS 12). We suggest that the regional and over-regional Quaternary record can still be further expanded, and the landscape history better understood by detailed sedimentological and petrographic analyses combined with state-of-the-art geochronology.
Supplementary material
The supplementary material for this article can be found at https://doi.org/10.1017/qua.2024.61.
Acknowledgments
This study was facilitated by the Swiss National Cooperative for the Disposal of Radioactive Waste (Nagra). We would also like to kindly thank Hansruedi Graf, Angela Landgraf, Hendrik Vogel for valuable input and recommendations, and Julijana Gajic for performing the geochemical analyses. We thank Dominik Amschwand, Marius Huber, Andrea Kuster, Kim Lemke, Dominik Schmid, and Stephanie Talker for support during field and laboratory work. The initial manuscript benefitted from constructive recommendations by Laura Stutenbecker, an anonymous reviewer, as well as editor Nicholas Lancaster.
Competing interests
The authors declare none.


 Open access