




Background
In 2024, 7.8 million Canadians (19%) were aged 65 years or older (Statistics Canada, 2024a). Because older people receive health care that costs approximately 4.4 times more than younger cohorts, their care constitutes nearly 50% of total health expenditure (Gibbard, Reference Gibbard2018). As the number of older people is projected to increase through 2075, at the fastest rate of any age group (Statistics Canada, 2025), costs will continue to grow. Investing in home and community services to help older people age well and remain at home is known to reduce expensive acute and long-term care demands (National Seniors Council, 2024). For example, a 2024 Canadian Institute for Health Information (CIHI) report estimated that 1 in 10 residents newly admitted to a long-term care facility could have remained at home if sufficient supports and services were in place (CIHI, 2024). Given that nearly all older Canadians express a preference to age in place (Sinha, Reference Sinha2020), this type of investment also holds strong public support.
Governments and community agencies are responding in several ways. For example, comprehensive geriatric assessments (CGAs) serve individuals at risk of functional decline or during a health crisis using a medical lens; social prescribing (SP) initiatives link individuals to non-medical supports within the community to tackle social determinants of health; and community-based needs assessments (CBNAs) facilitate public and private sectors to design or tailor health and social programs based on communities’ aggregated needs. The ACTing Collectively project was a proof-of-concept study that combined components of CGAs, SP, and CBNAs. A structured interview, the ACT® Assess, identified participating older peoples’ concerns and a linked resource dataset was used to offer a choice of local health and social services and resources. Aggregating answers elevated their voices to inform public and community policies and service planning.
CGAs, now the gold standard in geriatric settings, are widely used in primary and community-based care (Kshatri et al., Reference Kshatri, Janssen, Shenkin, Mansingh, Pati, Palo and Pati2025; Parker et al., Reference Parker, McCue, Phelps, McCleod, Arora, Nockels, Kennedy, Roberts and Conroy2018). These multidimensional assessments inform multidisciplinary, integrated care plans designed to address older peoples’ concerns (Parker et al., Reference Parker, McCue, Phelps, McCleod, Arora, Nockels, Kennedy, Roberts and Conroy2018), especially when older people transition between health care settings, following a health crisis, or with increasing frailty or disability (Morrisby et al., Reference Morrisby, Joosten and Ciccarelli2018). An umbrella review of systematic reviews found that the use of CGAs in community settings significantly reduced mortality and long-term care admission among general and frail older people (Ambagtsheer et al., Reference Ambagtsheer, Thompson, Tucker, Schultz, Beilby and Visvanathan2023).
SP is a phenomenon of global interest, intended to leverage the known, positive impact of social factors, such as appropriate housing, financial security, and transportation, and combat negative conditions such as social isolation (Morse et al., Reference Morse, Sandhu, Mulligan, Tierney, Polley, Chiva Giurca, Slade, Dias, Mahtani, Wells, Wang, Zhao, De Figueiredo, Meijs, Nam, Lee, Wallace, Elliott, Mendive and Husk2022). Using a deliberate and individualized process to connect people to community-based resources or activities, SP builds social support, strengthens trust in service, and improves clients’ mental health and ability to manage chronic conditions (Bhatti et al., Reference Bhatti, Rayner, Pinto, Mulligan and Cole2021), and is an effective approach for people experiencing social isolation and loneliness (Paquet et al., Reference Paquet, Whitehead, Shah, Adams, Dooley, Spreng, Aunio and Dubé2023).
CBNAs aggregate and synthesize community-level data to inform community organizations, local service providers, and policy makers about programs and services needed and sought by residents (Ravaghi et al., Reference Ravaghi, Guisset, Elfeky, Nasir, Khani, Ahmadnezhad and Abdi2023). These assessments aggregate and analyze individual responses to make community-level recommendations so that concerns extend beyond individuals themselves and reach organizational, social, and policy levels, ultimately helping older people to live well at home (National Seniors Council, 2024).
Each of these three initiatives have weaknesses. First, CGAs and CBNAs often focus on health care and home services (e.g. home maintenance, basic activities of daily living, medical care) and overlook psychological concerns or social determinants of health, such as loneliness, finances, transportation, and accommodations (Beran, Reference Beran2015). Second, many CBNAs are based on census or institutional data or input from caregivers, health care providers, and service managers (Ravaghi et al., Reference Ravaghi, Guisset, Elfeky, Nasir, Khani, Ahmadnezhad and Abdi2023). Thus, older peoples’ needs are indirectly, rather than directly heard. Third, while some CGAs, SP initiatives, and CBNAs collect information directly from older people, there is evidence that individuals are likely to avoid, decline to respond to, or provide vague responses to sensitive, challenging, or difficult topics, such as incontinence, bereavement, and elder abuse, especially in open-ended interviewing contexts (Silverio et al., Reference Silverio, Sheen, Bramante, Knighting, Koops, Montgomery, November, Soulsby, Stevenson, Watkins, Easter and Sandall2022). Fourth, all these initiatives tend to follow traditional views of older people as passive service receivers, with less attention paid to how they actively seek community resources to age in place. Interestingly, while older people identify barriers to aging in place, they may not always take action to reduce those barriers. In one study, older people sought resources for less than 25% of their unmet needs (Walters et al., Reference Walters, Iliffe and Orrell2001). A more recent study also reported discrepancies in expressed concerns and prioritized areas for action while managing chronic conditions, such as taking medications and distress in health-related problems (Hessler et al., Reference Hessler, Fisher, Bowyer, Dickinson, Jortberg, Kwan, Fernald, Simpson and Dickinson2019).
Studies explicitly examining older peoples’ proactive interest in local resources to prevent or address concerns related to living or aging in place are scarce. Yet, past studies examining perceived barriers to remaining at home, unmet needs, and areas requiring assistance shed some light on common concerns and associated factors. For example, home improvement and maintenance, mobility, and safety at home are the most expressed barriers for older people who wish to remain living at home (Brim et al., Reference Brim, Fromhold and Blaney2021). Heavy and light housework were the most frequently unmet needs reported in a large-scale New Zealand survey (Wilkinson-Meyers et al., Reference Wilkinson-Meyers, Brown, McLean and Kerse2014). Older people with greater need for assistance and more unmet needs were more likely to experience mobility difficulty, be a care provider, and/or be female (Wilkinson-Meyers et al., Reference Wilkinson-Meyers, Brown, McLean and Kerse2014). Home maintenance concerns were also closely associated with financial concerns, especially for those who were older, female, had greater care needs, had lower income or financial means, or were living alone/had never been married (Fret et al., Reference Fret, Mondelaers, De Donder, Switsers, Smetcoren, Verté, Dury, Dierckx, Lambotte, Duppen, Kardol, Hoeyberghs, De Witte, De Roeck, Engelborghs, De Deyn, Van der Elst, De Lepeleire, Schoenmakers and Schols2020). A Canadian national survey found that 41% of adults aged 50 years or older are at risk of being socially isolated and 58% are experiencing loneliness (Iciaszczyk et al., Reference Iciaszczyk, Gallant, Bronstein, Brierley and Sinha2024). While women are more likely to experience loneliness, higher education and better income security are protective factors for social isolation and loneliness (Bull et al., Reference Bull, Iciaszczky and Sinha2023).
Therefore, the overall goals of the ACTing Collectively project were to describe older peoples’ health and social concerns at the community level, to identify those concerns for which they seek resources (prioritized concerns), and to identify potential gaps in local resources. This paper reports on the first two goals. Specific objectives of this paper are to:
-
• describe the extent and type of health and social concerns expressed by community-dwelling older people living in three Nova Scotian communities,
-
• describe the extent and types of concerns for which they prioritized resources, and
-
• identify the underlying personal factors related to the number, type, and prioritization of concerns for which to seek resources.
Methods
Study design
The ACTing Collectively project was a proof-of-concept, cross-sectional study using a convenience sample. The project was approved by the Nova Scotia Health Research Ethics Board. All requirements to protect participants’ privacy and confidentiality were followed. The Strengthening the Reporting of Observational Studies in Epidemiology (STROBE) statement guided reporting (Von Elm et al., Reference Von Elm, Altman, Egger, Pocock, Gøtzsche and Vandenbroucke2007).
Setting
The study took place in three communities (one regional municipality and two rural counties) in Nova Scotia, one of the four Atlantic Canadian provinces. In 2021, older people in these three areas accounted for over 25% of the population of the three counties (Statistics Canada, 2024a). The level of economic dependency, situational vulnerability, and health care costs in these areas was higher than the provincial averages (Kephart et al., Reference Kephart, Asada, Atherton, Burge, Campbell, Campbell, Dowling, Dyer, Lawson, Lethbridge, Levy and Terashima2016; Statistics Canada, 2024b). In Canada, access to primary care providers (i.e. family physicians and nurse practitioners), who are the first point of contact for people in need of non-urgent care or referral, is publicly funded for residents (with few exceptions) via provincial health insurance. However, between July 2023 and October 2024, approximately 13% of Nova Scotians were on the ‘Need a Family Practice Registry’ (Nova Scotia Health, 2024), complicating access to health care resources for a large number of people. In Nova Scotia, a virtual care option, functioning like a walk-in clinic, was available to those without a primary care provider. In addition to primary care, the province operates two free telephone information services – ‘211’, which provides information on non-commercial formal and informal resources, and ‘811’, which provides health advice. Each participating community expressed interest in and then agreed to participate in the project; a local community coordinator was assigned to assist with recruitment, attend regular project meetings, and provide the researchers with local knowledge and connections.
Participants
Participants were recruited by community coordinators, via seniors’ groups, local, municipal, and provincial health and social care organizations. Flyers, infographics, and articles in newsletters distributed or posted on social media and in local public venues (e.g. libraries, seniors’ clubs) were also used. During the participant recruitment period, a monthly project newsletter was sent to interested organizations and individuals to encourage ongoing recruitment. Local community coordinators recruited potential participants through word-of-mouth and via organized, in-person community events. Newspaper articles and local television and radio interviews about the study supplemented recruitment efforts. Participants were encouraged to disseminate information about the project to eligible family members and friends. Based on advice from the community coordinators, recruitment materials emphasized the opportunity to plan for the future, learn about local resources, and help the community learn about the needs of older people (Boutilier et al., Reference Boutilier, Warner, Wolfe, Askari, Moody, Ghanouni and Packer2025).
Individuals were eligible to participate if they (1) were aged 65 years or older and lived independently (community-dwelling), (2) lived in one of the three collaborating communities, and (3) were able to understand and speak English or French. The exclusion criteria meant that individuals with (1) cognitive or psychological impairments preventing comprehension of the assessment questions (assessed by the ability to follow instructions), or (2) who were living in a long-term care facility. Family members could answer the assessment questions on behalf of participants who met the eligibility criteria if communication barriers, such as hearing impairment, prevented their participation.
Interested individuals contacted the research team to confirm their eligibility and provide informed, voluntary consent. Next, they selected their preferred assessment method (in-person, telephone, or online via Zoom for Healthcare) and appointments were scheduled with trained assessors.
Instruments
ACT® Assess
The ACT® Assess (Age Care Technologies, 2025) includes a semi-structured interview of 56 short questions with a locally curated database of resources linked to each question. Questions are asked in a conversational manner to ease participants’ anxiety or embarrassment and increase their willingness to respond to sensitive topics. The questions identify older peoples’ concerns across six domains: Looking After Yourself, Getting Around, Safety and Relationships, Accommodation and Finances, Mental Health, and Staying Healthy. Response options range from two to five and responses are entered into the digital platform by the assessors in real-time. Participants can ‘skip the question’ if desired. Brief narrative responses can also be recorded in the digital ACT® Assess platform; however, these qualitative data are not reported in this paper.
Upon answering and entering responses to all 56 questions, ACT® Assess automatically generates a list of all concerns (defined as a problem, worry, or negative situation) raised during the interview. Participants are given the opportunity to select or ‘prioritize’ any of these concerns to review local resources from the database linked to each concern. Upon viewing and discussing available resources, participants select resources of interest to populate an Individualized Action Plan summarizing their prioritized concerns and chosen resources. There are no limits on the number of prioritized concerns or resources selected. Resources chosen are not reported in this paper.
Sociodemographic characteristics and chronic conditions
Participants’ sociodemographic characteristics, and the number and perceived impact of their chronic conditions were collected by the assessor, then entered into an electronic form using software (i.e. Opinio) supported by the researchers’ institution.
Data collection
Participant recruitment was carried out and assessment/interview data were collected between October 2022 and May 2024. The ACT® Assess was administered by trained assessors, including members of the research team, community coordinators, and local volunteers with varying backgrounds. Assessors required sufficient digital literacy to use the ACT® platform, and all had experience working with older people. Assessors from rural areas and those who spoke the local Acadian French dialect increased the capacity to reach and assess participants with this background. All assessors received manuals developed by the research team and completed synchronous Zoom training sessions developed by the research team, supplemented by ACT® training tools. The training sessions included assessment simulations. Assessors signed confidentiality agreements upon completion of training and before conducting assessments.
Statistical analysis
Participants’ sociodemographic and health-related characteristics were summarized using means (standard deviation [SD] and range) for continuous variables, and number (percentage, %) for dichotomous or categorical variables. The count of concerns and prioritized concerns, as well as the percentage of concerns prioritized in each ACT® Assess domain and in total, were calculated; the mean (SD) or median (inter-quartile range, IQR) are reported as appropriate. Item-based descriptive analysis was done to highlight items with the most and least concerns or prioritized concerns raised by participants.
Age was the only continuous sociodemographic variable; others were categorized. Gender was dichotomized as ‘male’ or ‘female’ (no participant chose ‘other gender’); education as ‘completed less than secondary education’ or ‘completed postsecondary education or higher’; marital status into ‘married’ or ‘single, separated, divorced, or widowed’; and living arrangement into ‘living alone’ or ‘living with others’. Ethnicity was based on self-identification and dichotomized as ‘European’ or ‘not European’ (yes or no). ‘Providing care to others’ and ‘receiving care from others’ were binary variables with yes or no responses. Two variables related to chronic conditions were categorized into three groups. Number of chronic conditions was grouped as ‘no chronic condition’, ‘1 condition’, or ‘2 or more conditions’. The impact of chronic conditions was categorized as ‘no impact to a little bit of impact’, ‘moderate impact’, or ‘quite a bit to extreme impact’. Finally, data from these two questions were used to create a combined, four-category variable, called ‘number and impact of chronic condition(s)’. The three ‘impact’ categories were supplemented by a fourth category accounting for participants without a chronic condition. Integrated data from the two related variables reduced collinearity issues and overcame the problem of missing data on ‘impact of chronic condition’ for those without chronic conditions.
Four ACT® Assess questions, all in the Mental Health domain, were recoded or removed from the analysis. Pain was defined as a concern if rated as ‘moderate or worse’ (n = 106, 48% of participants). ‘Mild pain’ was regrouped with ‘no pain’. This was based on literature that shows that pain of moderate or greater severity has adverse effects on older people (Shega et al., Reference Shega, Andrew, Kotwal, Lau, Herr, Ersek, Weiner, Chin and Dale2013). Three other ACT® Assess questions, included to screen for cognitive ability (for example, ‘what is today’s date?’), were excluded from the analysis because they do not capture self-assessed concerns. A separate ACT® question asking participants to self-assess their memory was retained. With the three screening questions removed, and pain recoded, the total number of potential concerns was 53.
To examine differences in the number of concerns and prioritized concerns across domains, parametric analysis of variance (ANOVA) or nonparametric Kruskal-Wallis H test was used as appropriate. Pairwise post-hoc analysis using Bonferroni correction was then calculated; adjusted p-values are reported.
Participant characteristics associated with the total number of concerns/prioritized concerns at both aggregated and domain levels were identified using a two-step analysis. First, correlated personal and health-related characteristics for each outcome (i.e. number of concerns and prioritized concerns in total and by domain, and the percentage of concerns prioritized) were identified using univariate analysis. A p-value ≤0.25 was considered sufficient to select potential predictive factors for inclusion in the multivariate models (Chowdhury & Turin, Reference Chowdhury and Turin2020). Second, generalized linear models (GLMs) with Poisson loglinear or negative binominal log link function were applied to identify which of the included predictive factors were significantly associated with the outcomes, controlling for other associated variables in the models. These GLMs were chosen to handle the counted outcomes that were not normally distributed. The choice of Poisson loglinear or negative binominal regression was determined by dispersion (Schober & Vetter, Reference Schober and Vetter2021). Models for prioritized concerns only included participants with at least one concern identified in the relevant domain because prioritized concerns were only selected from the previously raised concerns.
A high proportion (35%) of missing data for age affected analysis of four domain scores (i.e. concerns in Getting Around and Staying Healthy, and prioritized concerns in Looking After Yourself and Safety and Relationships). These missing data were considered missing at random. Multiple imputations using the multivariate imputation by chained equations (MICE) were used to impute age for analysis of these four outcomes. Other missing values in the predictive variables (all <5% of the sample and missing completely at random) were not imputed and all the GLMs were done with complete cases to reduce bias introduced by cross data imputation (Sterne et al., Reference Sterne, White, Carlin, Spratt, Royston, Kenward, Wood and Carpenter2009). To resolve the collinearity issue between marital status and living arrangements (Spearman’s rho = .855, p < .001), the regression model with the variable generating higher pseudo-R square value was retained. The main effects of each predictive variable were examined; their exponential coefficient and 95% confidence intervals are reported. The significance level was p = .05. Deviance residual plots were used to examine the model fit.
One personal factor, ‘receiving care from others’, was specifically examined to gauge the concerns raised by older people perceived to rely, at least to some extent, on care from others. ‘Receiving care from others’ was left to the interpretation of the respondents, therefore, the nature of this support (paid or unpaid for example) was not known. These concerns were identified using chi-square test or Fisher’s exact test by cross tabulating the two binary variables: receiving care (Y/N) and raised as a concern (Y/N) for each of the 53 items. To compare differences in the concerned items between older people who received care from others and those who did not, the total number of concerns from all the items that were significantly associated with receiving care were calculated for each group.
Statistical analyses were completed using the IBM SPSS version 29 and R 4.4.2 with MICE, MASS packages.
Results
Participants’ sociodemographic characteristics and chronic conditions
Over the recruitment period, 288 individuals expressed interest; 66 later declined or did not participate in the assessment, resulting in 222 enrolled participants (Table 1). The mean age was 75.8 years old (SD = 6.0, range = 65–93 years old); about 74% were female and 69% had completed postsecondary education or higher. Around one in five participants (20%) were providing care to others and one in eight (13%) were receiving care. Among the 169 participants (78%) with at least one chronic condition, 63% (n = 106) reported moderate to extreme impact on their everyday life, representing 48% of the total sample (Table 1).
Sociodemographic and health-related characteristics of participants (n = 222)

Table 1. Long description
The table consists of two columns: Participant characteristics and Number (%).
* Age (n = 145): The mean age is 75.84 with a S D of 5.98. 65 to 74 years old accounts for 65 (45%); 75 years old or more accounts for 80 (55%).
* Sex: Male 58 (26%); Female 164 (74%).
* Education level: Completed less than secondary education 68 (31%); Completed postsecondary education or higher 154 (69%).
* Marital status: Married 112 (50%); Not married (single, separated, divorced, or widowed) 110 (50%).
* Living arrangement: Living alone 95 (43%); Living with others 127 (57%).
* Ethnicity (multiple responses possible): European 177 (81%); Acadian 51 (23%); Indigenous 7 (3%); Others 7 (3%).
* Providing care to others (n = 213): Yes 45 (21%); No 168 (79%).
* Receiving care from others: Yes 28 (13%); No 194 (87%).
* Number of chronic conditions (n = 218): 0 conditions 48 (22%); 1 condition 89 (41%); 2 or more conditions 81 (37%).
* Number and impact of chronic conditions (n = 217): No chronic condition 48 (22%); No impact to a little bit of impact 63 (29%); Moderate impact 45 (21%); Quite a bit to extreme impact 61 (28%).
Overall number of concerns and those prioritized for resource selection
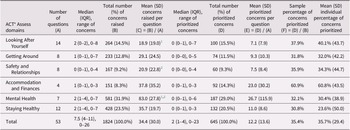
In total, 1,824 concerns were identified by 221 participants; only one participant identified no concerns (Table 2). Participants reported an average of 8.2 concerns (SD = 5.0, median = 7.5, IQR = 4–11, range = 0–26). Thirty-two percent of the concerns (n = 581) were in the Mental Health domain (Table 2, Column B), with an average of 83 people registering concerns per question in this domain (Table 2, Column C). By comparison, the Staying Healthy domain, the domain with the second highest number of concerns, registered only 23.5% of the overall concerns (n = 428 concerns) with an average of 36 people raising concerns per question. The Accommodation and Finances domain registered the fewest concerns with only 8.3% (n = 151) of the total, though the number of people reporting concerns per question (n = 38) was similar to other domains. Average concerns raised in the Mental Health domain were significantly higher than those in the Looking After Yourself domain (Kruskal-Wallis H test = 28.04, Bonferroni adjusted p = .001) and the Safety and Relationships domain (H = 26.55, p = .013), but not higher than other domains.
Descriptive statistics of concerns and prioritized concerns of older people by six ACT® Assess domains and overall total (n = 222)

Table 2. Long description
The table consists of 10 columns and 7 rows of data. The columns are: ACT® Assess domains, Number of questions = A, Median and interquartile range and range of concerns, Total number and percentage of concerns raised = B, Mean and standard deviation of concerns raised per question = C: C equals column B over column A, Median and interquartile range and range of prioritized concerns, Total number and percentage of prioritized concerns = D, Mean and standard deviation of prioritized concerns per question = E: E equals column D over column A, Sample percentage of concerns prioritized = F equals D over B, and Mean S D individual percentage of concerns prioritized.
* Looking After Yourself: 14 questions, 264 concerns or 14.5 percent, 100 prioritized or 15.5 percent, 37.9 percent of concerns prioritized.
* Getting Around: 8 questions, 233 concerns or 12.8 percent, 74 prioritized or 11.5 percent, 31.8 percent of concerns prioritized.
* Safety and Relationships: 8 questions, 167 concerns or 9.2 percent, 60 prioritized or 9.3 percent, 35.9 percent of concerns prioritized.
* Accommodation and Finances: 4 questions, 151 concerns or 8.3 percent, 92 prioritized or 14.3 percent, 60.9 percent of concerns prioritized.
* Mental Health: 7 questions, 581 concerns or 31.9 percent, 187 prioritized or 29.0 percent, 32.1 percent of concerns prioritized.
* Staying Healthy: 12 questions, 428 concerns or 23.5 percent, 132 prioritized or 20.5 percent, 30.8 percent of concerns prioritized.
* Total: 53 questions, 1824 concerns or 100.0 percent, 645 prioritized or 100.0 percent, 35.4 percent of concerns prioritized.
Abbreviations: SD = standard deviation; IQR = interquartile range.
1 Statistically significant difference between Looking After Yourself and Mental Health domains using the Kruskal-Wallis test and post hoc Bonferroni pairwise comparison.
2 Statistically significant difference between Safety and Relationship and Mental Health domains using the Kruskal-Wallis test and post hoc Bonferroni pairwise comparison.
When asked to select and prioritize concerns to learn about resources, one-fifth of the participants (44/222) prioritized no concerns at all (Table 2). The remaining 178 participants (80.2%) prioritized 645 concerns (mean = 3.6 per participant, SD = 3.0, median = 3, IQR = 2–4, range = 1–23). The greatest number of prioritized concerns were again concentrated in the Mental Health domain with 187 of 645 (29.0%) prioritized concerns falling in this domain (Table 2, Column D), followed by the Staying Healthy domain (20.5%, n = 132). There were no statistically significant differences in the number of prioritized concerns across domains.
A different story was found, however, when the proportion of people with concerns, rather than the proportion of total participants, was examined. Only 32.1% of concerns in the Mental Health domain were prioritized compared to between 30.8% and 60.9% in other domains (Table 2, Column F). Over 60% of the participants with concerns in the Accommodation and Finances domain were interested in learning about corresponding resources, 1.6–2.0 times higher than other domains (30.8%–37.9%).
Common concerns and highly prioritized concerns
A more granular analysis was possible by looking at item-level responses. Seventeen of the 53 items (32.1%) posed concerns for at least 20% of participants (Figure 1). Of these, the four most common concerns (reported by over 40% of participants) were in the Mental Health domain: loneliness (48.6%), bodily pain of a moderate or greater severity (47.7%), sleep problems (47.3%), and bereavement (43.7%). Other frequent concerns were spread across the other five domains, though there were slightly more concerns identified in the Staying Healthy domain than the other four. Interestingly, 16 of the remaining 36 potential concerns (44.4%) were concerns for 5% or fewer participants (n < 12). The majority of these 16 items fell in the Looking After Yourself domain (7 items), followed by the Safety and Relationships domain (4 items).
Concerns identified by 20% or more of the total participants and percentage of participants who prioritized these concerns (n=222).

Figure 1. Long description
The Y-axis represents percentages from 0.0 percent to 100.0 percent. The X-axis is divided into six numbered ACT® Assess categories. Black bars represent Concern and gray bars represent Prioritized concern.
* Category 1 Looking After Yourself. House maintenance: 26.1 percent concern, 10.8 percent prioritized. Bladder incontinence: 24.3 percent concern, 8.6 percent prioritized.
* Category 2 Getting Around. Feet problems: 34.2 percent concern, 14.0 percent prioritized. Falling: 24.8 percent concern, 8.1 percent prioritized.
* Category 3 Safety and Relationships. Feeling like a burden: 32.9 percent concern, 11.7 percent prioritized.
* Category 4 Accommodation and Finances. Financial benefits and allowances: 34.7 percent concern, 30.2 percent prioritized. Monthly finances: 26.1 percent concern, 8.1 percent prioritized.
* Category 5 Mental Health. Loneliness: 48.6 percent concern, 14.9 percent prioritized. Bodily pain: 47.7 percent concern, 23.0 percent prioritized. Sleeping: 47.3 percent concern, 18.5 percent prioritized. Bereavement: 43.7 percent concern, 5.4 percent prioritized. Memory loss: 32.4 percent concern, 12.2 percent prioritized. Depression: 22.1 percent concern, 6.3 percent prioritized.
* Category 6 Staying Healthy. Weight: 31.1 percent concern, 13.5 percent prioritized. Skin: 25.2 percent concern, 9.9 percent prioritized. Exercising: 25.2 percent concern, 6.8 percent prioritized. Appearance: 24.3 percent concern, 4.1 percent prioritized.
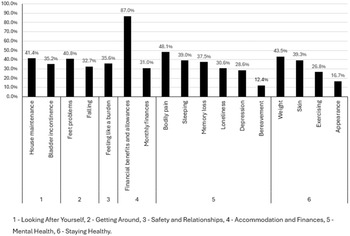
When prioritizing concerns to identify resources, one specific item stood out – financial benefits and allowances. Of participants with this concern, 87% prioritized it, a stark contrast to other highly prioritized concerns, including bodily pain (48.1%), weight control (43.5%), house maintenance (41.4%), and foot problems (40.8%) (Figure 2). Notably, no single ACT® Assess domain dominated prioritized selections, but bereavement was the least prioritized concern, selected by only 12.4% of those who reported it as a concern.
Prioritized concerns as a percentage of those who identified a concern (only concerns identified by 20% or more of participants are shown).

Figure 2. Long description
The Y-axis represents percentages from 0.0 percent to 100.0 percent in increments of 10.0 percent. The X-axis is divided into six numbered sections with specific labels for each bar.
Section 1 Looking After Yourself
- House maintenance: 41.4 percent
- Bladder incontinence: 35.2 percent
Section 2 Getting Around
- Feet problems: 40.8 percent
- Falling: 32.7 percent
Section 3 Safety and Relationships
- Feeling like a burden: 35.6 percent
Section 4 Accommodation and Finances
- Financial benefits and allowances: 87.0 percent
- Monthly finances: 31.0 percent
Section 5 Mental Health
- Bodily pain: 48.1 percent
- Sleeping: 39.0 percent
- Memory loss: 37.5 percent
- Loneliness: 30.6 percent
- Depression: 28.6 percent
- Bereavement: 12.4 percent
Section 6 Staying Healthy
- Weight: 43.5 percent
- Skin: 39.3 percent
- Exercising: 26.8 percent
- Appearance: 16.7 percent
The highest concern is Financial benefits and allowances at 87.0 percent, while the lowest is Bereavement at 12.4 percent.
The relationship between participant factors, concerns, and prioritized concerns
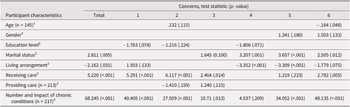
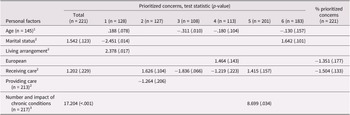
Personal factors associated with concerns and prioritized concerns identified using univariate analysis are presented in Tables 3 and 4. ‘Not being married’, ‘receiving care from others’, and reporting ‘greater impact of chronic conditions’ were associated with having both more concerns and prioritized concerns. Having a ‘greater number of chronic conditions’, ‘greater impact of the conditions’, and ‘receiving care from others’ were positively associated with having more concerns in almost all ACT® domains. ‘Receiving care from others’ was also significantly associated with prioritized concerns in the five ACT® domains. No other participant characteristics (i.e. age, gender, education level, living arrangement, ethnicity, providing care or not) were consistently associated with concerns or prioritized concerns by domain.
Concerns: Univariate association between participant characteristics and concerns by total number and by domain (only significant values of p = .25 are shown)

Table 3. Long description
A table titled Concerns: Univariate association between participant characteristics and concerns by total number and by domain. The columns include Participant characteristics, Total concerns, and six specific ACT® Assess domains: 1 - Looking After Yourself, 2 - Getting Around, 3 - Safety and Relationships, 4 - Accommodation and Finances, 5 - Mental Health, and 6 - Staying Healthy. Data is presented as test statistic with p-value in open and close parenthesis. Only significant values of p = .25 are shown.
* Age (n equals 145): Significant associations in Domain 2 is .132 (.115); Domain 6 is minus .164 (.048).
* Gender: Significant associations in Domain 5 is 1.341 (.180); Domain 6 is 1.503 (.133).
* Education level: Significant associations in Domain 1 is minus 1.763 (.078); Domain 2 is minus 1.216 (.224); Domain 4 is minus 1.806 (.071).
* Marital status: Significant associations in Total is 2.811 (.005); Domain 3 is 1.645 (0.100); Domain 4 is 3.207 (.001); Domain 5 is 3.657 (less than .001); Domain 6 is 2.505 (.012).
* Living arrangement: Significant associations in Total is minus 2.162 (.031); Domain 1 is 1.503 (.133); Domain 4 is minus 3.352 (less than .001); Domain 5 is minus 3.309 (less than .001); Domain 6 is minus 1.779 (.075).
* Receiving care: Significant associations in Total is 5.220 (less than .001); Domain 1 is 5.291 (less than .001); Domain 2 is 6.117 (less than .001); Domain 3 is 2.464 (.014); Domain 5 is 1.219 (.223); Domain 6 is 2.782 (.005).
* Providing care (n equals 213): Significant associations in Domain 2 is minus 1.410 (.159); Domain 3 is 1.240 (.215).
* Number and impact of chronic conditions (n equals 217): Significant associations in Total is 68.245 (less than .001); Domain 1 is 40.405 (less than .001); Domain 2 is 27.509 (less than .001); Domain 3 is 10.71 (.013); Domain 4 is 4.537 (.209); Domain 5 is 34.052 (less than .001); Domain 6 is 48.135 (less than .001).
Statistical tests used include Spearman's rho, Mann-Whitney U Standardized Test Statistic, and Kruskal-Wallis Test Statistic.
Statistical tests: 1Spearman’s rho (p), 2Mann-Whitney U Standardized Test Statistic (p), 3Kruskal-Wallis Test Statistic (p)
Note: 1 ACT® Assess domains – Looking After Yourself, 2 – Getting Around, 3 – Safety and Relationships, 4 – Accommodation and Finances, 5 – Mental Health, 6 – Staying Healthy.
Prioritized concerns: Univariate association between participant characteristics and prioritized concerns by total number and by ACT® Assess domains (only significant values of p = .25 are shown)

Table 4. Long description
The table is structured with Personal factors in the first column and Prioritized concerns (test statistic and p-value) across columns for Total and Domains 1 through 6. Only significant values of p = .25 are shown.
* Domain 1: Looking After Yourself
* Domain 2: Getting Around
* Domain 3: Safety and Relationships
* Domain 4: Accommodation and Finances
* Domain 5: Mental Health
* Domain 6: Staying Healthy
Key data points include:
* Age (n equals 145): Significant associations in Domain 1 (0.188, p equals .078), Domain 3 (-0.311, p equals .010), Domain 4 (-0.180, p equals .104), and Domain 6 (-0.130, p equals .157).
* Marital status: Significant associations in Total (1.542, p equals .123), Domain 1 (-2.451, p equals .014), and Domain 6 (1.642, p equals .101).
* Living arrangement: Significant associations in Domain 1 (2.378, p equals .017).
* European: Significant associations in Domain 4 (1.464, p equals .143) and % prioritized concerns (-1.351, p equals .177).
* Receiving care: Significant associations in Total (1.202, p equals .229), Domain 2 (1.626, p equals .104), Domain 3 (-1.836, p equals .066), Domain 4 (-1.219, p equals .223), Domain 5 (1.415, p equals .157), and % prioritized concerns (-1.504, p equals .133).
* Providing care (n equals 213): Significant associations in Domain 2 (-1.264, p equals .206).
* Number and impact of chronic conditions (n equals 217): Significant associations in Total (17.204, p less than .001) and Domain 5 (8.699, p equals .034).
Statistical tests used include Spearman's rho, Mann-Whitney U Standardized Test Statistic, and Kruskal-Wallis Test Statistic.
Statistical tests: 1Spearman’s rho (p), 2Mann-Whitney U Standardized Test Statistic (p), 3Kruskal-Wallis Test Statistic (p)
Note: 1 – ACT® Assess: Looking After Yourself, 2 – Getting Around, 3 – Safety and Relationships, 4 – Accommodation and Finances, 5 – Mental Health, 6 – Staying Healthy.
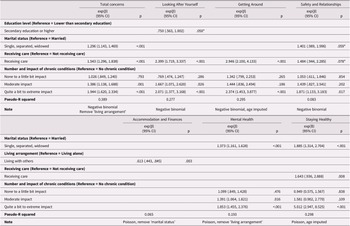
Results of the GLMs demonstrated that, after controlling for all other associated characteristics, ‘not being married’ (i.e. single, separated, or widowed), ‘receiving care from others’, and ‘having moderate or greater impact of chronic conditions’ were associated with more total concerns (Table 5: p < .05 = significantly related; p < .08 = marginally related). Analysis at the domain level showed that older people experiencing ‘quite a bit to extreme impact of conditions’ had about five more concerns in the Staying Healthy domain compared to those who ‘do not have any chronic condition’ (Exp(B) = 5.01, 95% CI = 2.95–8.53, p < .001). People reporting ‘quite a bit to extreme impact of conditions’ and who were ‘receiving care from others’ were likely to have two more concerns in the Looking After Yourself and Getting Around domains (Exp(B) = 2.07–2.95, 95% CI = 1.38–4.13, ps < .001). ‘Not being married’ was associated with more concerns in the Mental Health and Staying Healthy domains (Exp(B) = 1.37–1.89, 95% CI = 1.16–2.70, ps < .001). Interestingly, the only personal characteristic related to the total number of concerns in the Accommodation and Finances domain was ‘living alone’, but the effect on the number of concerns was not strong (Exp(B) = 0.61, 95% CI = 0.44–0.85, p = .003).
Concerns: Factors predicting total number of concerns and concerns by domain (n = 222)

Table 5. Long description
The table presents regression results using E x p B and 95 percent confidence intervals, along with p-values.
1. Total Concerns: Significant predictors include being single, separated, or widowed (E x p B 1.296, p less than .001), receiving care (E x p B 1.543, p less than .001), and chronic conditions with moderate impact (E x p B 1.386, p equals .001) or extreme impact (E x p B 1.944, p less than .001). Pseudo-R squared is 0.389.
2. Looking After Yourself: Significant predictors include secondary education or higher (E x p B .750, p equals .050), receiving care (E x p B 2.399, p less than .001), and chronic conditions with moderate (E x p B 1.667, p equals .026) or extreme impact (E x p B 2.071, p less than .001).
3. Getting Around: Significant predictors include receiving care (E x p B 2.946, p less than .001) and chronic conditions with extreme impact (E x p B 2.374, p less than .001).
4. Safety and Relationships: Significant predictors include being single, separated, or widowed (E x p B 1.401, p equals .059), receiving care (E x p B 1.484, p equals .078), and extreme chronic condition impact (E x p B 1.871, p equals .017).
5. Accommodation and Finances: Significant predictors include living with others (E x p B .613, p equals .003).
6. Mental Health: Significant predictors include being single, separated, or widowed (E x p B 1.373, p less than .001), and chronic conditions with moderate (E x p B 1.391, p equals .016) or extreme impact (E x p B 1.853, p less than .001).
7. Staying Healthy: Significant predictors include being single, separated, or widowed (E x p B 1.885, p less than .001), receiving care (E x p B 1.643, p equals .008), and extreme chronic condition impact (E x p B 5.012, p less than .001).
* These personal factors are marginally associated with the ACT® Assess domains (p = 0.50–0.80). CI = confidence interval. exp(β) = exponent of the regression coefficient or adjust incident rate ratio.
In addition to being associated with the total number of concerns, ‘receiving care from others’ was significantly or marginally associated with five domains. It was not related to the count of concerns in the Mental Health (e.g. loneliness, bodily pain, sleeping, bereavement, memory loss, depression) domain or the Accommodation and Finances domain.
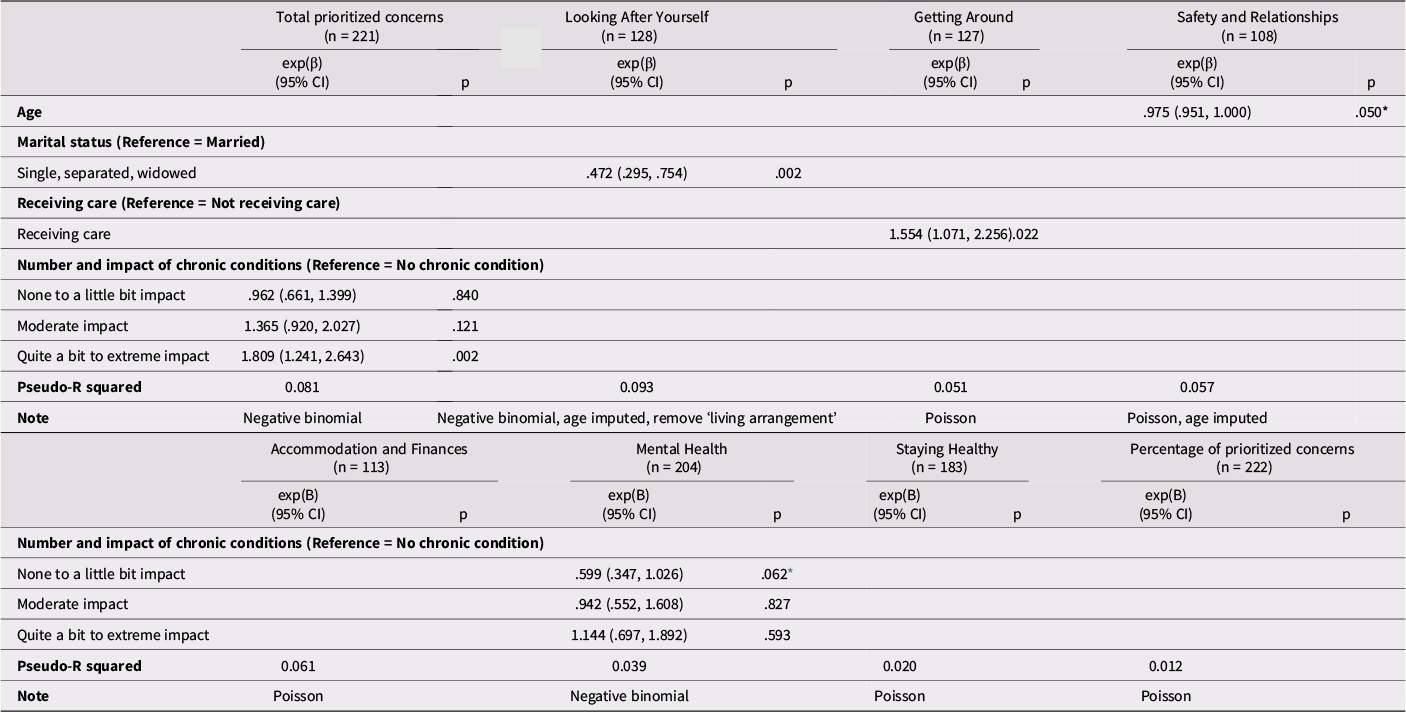
Far fewer associations were found between participant characteristics and their prioritized concerns (Table 6). Older people reporting ‘quite a bit to extreme’ impact of their chronic conditions were more likely to have a higher number of prioritized concerns (Exp(B) = 1.81, 95% CI = 1.24–2.64, p = .002). At the domain level, only two clear associations emerged. Older people ‘receiving care from others’ were more likely to prioritize resources for Getting Around (Exp(B) = 1.54, 95% CI = 1.07–2.27, p = .022), but not in other domains. Interestingly, ‘not being married’ was significantly associated with fewer prioritized concerns and less interest in finding resources in the Looking After Yourself domain, yet the effect was not strong (Exp(B) = 0.47, 95% CI = 0.30–0.75, p = .002).
Prioritized concerns: Factors predicting total number and concerns by domain

Table 6. Long description
The data is presented in two tables. Each domain includes columns for E X P B with 95 percent confidence intervals and p-values.
Table 1 covers:
* Total prioritized concerns (n equals 221): Quite a bit to extreme impact of chronic conditions shows E X P B 1.809, p equals .002. Pseudo-R squared is 0.081.
* Looking After Yourself (n equals 128): Single, separated, or widowed status shows E X P B .472, p equals .002. Pseudo-R squared is 0.093.
* Getting Around (n equals 127): Receiving care shows E X P B 1.554, p equals .022. Pseudo-R squared is 0.051.
* Safety and Relationships (n equals 108): Age shows E X P B .975, p equals .050. Pseudo-R squared is 0.057.
Table 2 covers:
* Accommodation and Finances (n equals 113): Pseudo-R squared is 0.061.
* Mental Health (n equals 204): None to a little bit impact of chronic conditions shows E X P B .599, p equals .062. Pseudo-R squared is 0.039.
* Staying Healthy (n equals 183): Pseudo-R squared is 0.020.
* Percentage of prioritized concerns (n equals 222): Pseudo-R squared is 0.012.
Notes indicate the use of Negative binomial or Poisson distributions for different models.
* These personal factors are associated or marginally associated with the ACT® domains (p = 0.50–0.80). CI = Confidence Interval. exp(β) = exponent of the regression coefficient or adjust incident rate ratio.
Twenty-eight participants (13%) reported that they were ‘receiving care from others’. Twenty ACT® items (37.7%) were associated with receiving care. Among individuals receiving care, 52.6% of their total concerns were raised in these 20 items (203/386), compared to only 34.0% by those not receiving care (489/1438). Most of these concerns were in the Looking After Yourself (7/20, 35.0%) and Getting Around domains (5/20, 25%) and 9 out of 20 were concerns identified by less than 10% of all participants (22 participants). Thus, older people receiving care had distinct concerns related to activities of daily living and mobility that were rarely a concern of their peers.
Discussion
This study aimed to identify concerns of community-dwelling older people and their interest in learning about local services and resources to address those concerns. Three key findings emerged. First, almost all participants reported at least one concern, including those who were relatively healthy, financially secure, and well-educated. Concerns related to mental health were by far the most common, exceeding concerns related to daily functioning, mobility, safety, housing, and finances. Second, while a substantial proportion of participants reported concerns in the Mental Health domain – particularly loneliness, pain, sleep problems, and bereavement – many did not prioritize these for resource exploration. In contrast, financial benefits and allowances (within the Accommodation and Finances domain), though less frequently reported as a concern, were highly prioritized: 87% of those with this concern sought resources. Third, regression models identified only a few personal factors associated with the number and type of concerns, or interest in resources. ‘Not being married’, ‘receiving care from others’, and experiencing ‘greater impact from chronic conditions’ were significantly associated with higher numbers of concerns. These same characteristics also predicted domain-specific interest in resources – for example, those receiving care were more likely to prioritize supports for mobility.
The semi-structured, conversational nature of the ACT® Assess likely contributed to the high rate of concerns reported. Its design enabled participants to share their situation in non-confrontational, flexible terms – worries, difficulties, or need for assistance – allowing a wide capture of issues related to both health and social determinants of health that are often missing in assessments of older people (Kshatri et al., Reference Kshatri, Janssen, Shenkin, Mansingh, Pati, Palo and Pati2025). This is a notable strength of the assessment and may explain the breadth of concerns reported.
Of the 222 participants, 221 reported at least one concern – on average, more than eight per person. This represents a substantial level of concern, especially given this study’s relatively conservative, well-resourced and healthy volunteer sample. The high frequency of concerns, however, does align with a 2019 study in primary care where participants (mean age of 55.4 years), when asked about 12 self-management problems, selected an average of six (50%) problems (Hessler et al., Reference Hessler, Fisher, Bowyer, Dickinson, Jortberg, Kwan, Fernald, Simpson and Dickinson2019). The present sample, largely composed of women, those with postsecondary education, and people of European descent, likely underrepresents more vulnerable populations in the community, given the communities where participants were recruited have high levels of economic dependency and situational vulnerability (Kephart et al., Reference Kephart, Asada, Atherton, Burge, Campbell, Campbell, Dowling, Dyer, Lawson, Lethbridge, Levy and Terashima2016; Statistics Canada, 2024b). This suggests that the true level of concern in the broader population may be even higher.
The prominence of mental health concerns in this study reflects wider societal trends. Loneliness, bereavement, and sleep difficulties are well-documented challenges in later life and have been exacerbated by the COVID-19 pandemic (Bull et al., Reference Bull, Iciaszczky and Sinha2023; Teichman et al., Reference Teichman, Mitchell, Riadi, Chaudhury, Banerjee and Odom2024). Data collection in this study began approximately seven months after local public health restrictions on social contact due to COVID-19 ended. Though physical or bodily pain is not often considered a mental health concern, it is included in the ACT® Assess Mental Health domain. Bodily pain was highly prevalent among respondents and is known to impact quality of life and mood (Shega et al., Reference Shega, Andrew, Kotwal, Lau, Herr, Ersek, Weiner, Chin and Dale2013). While these concerns were frequently reported, participants were less likely to seek resources to address them – particularly in the case of bereavement, where only 12% of those with concerns pursued additional resources. These findings could reflect stigma around mental health that manifests as reluctance to seek help or having low expectations for the success of interventions (Sickel et al., Reference Sickel, Seacat and Nabors2014).
Indeed, this study demonstrated that acknowledging a concern did not equate to an interest in pursuing resources to manage them. This study found that only one-third of concerns were prioritized by participants. How participants determined which concerns would be prioritized was not always clear. While some concerns were very common, few older people chose to look for resources. Other concerns were not as common, but when identified, a large proportion of older people were interested in learning about resources. For example, less than 5% of participants (n < 12) reported concerns related to 13 questions in the domains of Accommodation and Finances, Looking After Yourself, and Safety and Relationships (out of 26 questions, 50%). Even though concerns in these domains were not common, older people who had these concerns were likely to prioritize them and ask for resources. Participants’ comments shed some light on the reasons. Some participants had already received adequate assistance through formal (e.g. family doctor, health care professionals) or informal (e.g. family members, neighbors) channels. Others expressed satisfaction with their existing management strategies or considered certain issues to be a normal part of aging. In some cases, previous negative experiences or low expectations of services may have deterred them from seeking alternatives. Other reasons known to alter interest in finding resources are related to health literacy, health beliefs, and trust and expectations of the system (Levesque et al., Reference Levesque, Harris and Russell2013).
The high frequency of concerns in the Mental Health domain, but the reluctance to prioritize these concerns creates a dilemma for community agencies and policy makers. This is consistent with previous research in primary care, where patients frequently identified distress managing their health problems (> two-thirds of the sample) but rarely prioritized them for discussion (18%) or action (2.6%) (Hessler et al., Reference Hessler, Fisher, Bowyer, Dickinson, Jortberg, Kwan, Fernald, Simpson and Dickinson2019). With a high number of concerns, but a reluctance to speak up or take action, new strategies to prevent decline and increase individuals’ desire to seek resources and support are needed. Raising awareness of available resources, reducing stigma, and improving perceptions of service usefulness may help close this gap.
The Levesque et al. (Reference Levesque, Harris and Russell2013) access framework offers a useful lens to examine factors that affect how people access health and social care services. Using the terms supply and demand in five key dimensions, the model suggests ways that health care services can be designed to increase patient access (i.e. supply-side). Enhancing older peoples’ ability to recognize their concerns as legitimate, understand where and how to access resources, and feel empowered to act may increase their motivation to and engagement in seeking services (i.e. demand-side). This framework has been used in several empirical studies that show the importance of reducing system barriers and offering timely and affordable services to facilitate actions to address concerns (Mohd Rosnu et al., Reference Mohd Rosnu, Singh, Mat Ludin, Ishak, Abd Rahman and Shahar2022; Pass et al., Reference Pass, Kennelty and Carter2019). Analyzing the facilitators and barriers using Levesque’s conceptual model may enhance the understanding of why some resources (e.g. mental health programs/services) are underutilized. This type of analysis, however, was beyond the scope of this study and is recommended as a valuable future research direction.
Another important finding relates to the predictable difference in type of concern based on self-assessed receipt of care from others. While most participants raised issues related to mental health, mobility, or safety, those receiving care were more likely to report challenges with self-care and daily functioning – concerns more typical of individuals at higher risk for institutionalization (Chyr et al., Reference Chyr, Drabo and Fabius2020). This suggests a possible trajectory: older people may first experience social, relational, mental health, psychosocial, and environmental concerns, followed by functional decline requiring hands-on assistance. The emerging literature on frailty and social vulnerability also hints at this trajectory. A recent review supports that social factors may accelerate the progression of frailty and its associated negative health effects (Hanlon et al., Reference Hanlon, Wightman, Politis, Kirkpatrick, Jones, Andrew, Vetrano, Dent and Hoogendijk2024). Engaging social supports and community services could address this potential progression. Early attention to less tangible but highly prevalent concerns may delay or prevent the need for more intensive care later. This also raises a broader point: while many community-based interventions target physical risks (e.g. fall prevention, nutrition), fewer comprehensively address social and emotional well-being. The findings suggest that investment in upstream supports – such as SP, peer programs, and resource navigation – could have long-term value by helping older people remain at home and in their community.
Several limitations should be acknowledged. First, the sample of convenience likely underrepresents older people with limited mobility, or who are experiencing social isolation. Despite a variety of recruitment strategies, the sample skewed toward women, those with higher education, and those of European descent. Second, the proportion of missing data on the age variable was high but not substantive (Jakobsen et al., Reference Jakobsen, Gluud, Wetterslev and Winkel2017). While multiple imputations were used, this still introduces uncertainty. Third, older people in this study were free to self-assess whether they received care from others. No distinction between paid and unpaid care was imposed; doing so may have changed the results but might have also altered older peoples’ lived experiences of receiving care. Finally, the Hawthorne effect, which introduces bias as participants can change their behaviour or responses in the research context, may have influenced participants’ willingness to prioritize concerns during the assessment, especially given the interactive, conversational format. However, the fact that 20% of participants did not prioritize any concerns suggests that social desirability did not fully drive responses and participants chose concerns for which they were interested in knowing about resources.
Conclusion
Older people living in the community reported an average of eight or more concerns (out of a possible 53 concerns). Over 40% reported mental health concerns related to loneliness, pain, sleep, and bereavement. However, their reluctance to prioritize these concerns creates a dilemma for community agencies and policy makers focused on providing up-stream preventive services and resources. This finding is particularly important given that mental health concerns seem to pre-date concerns related to mobility and self-care. Older people with more chronic conditions, greater impact of health conditions, and those receiving care from others reported more concerns than those with less or milder health conditions. Those receiving care from others demonstrated a distinct pattern of concern. Knowing the concerns and the pattern of those concerns provides insight into how best to assist older people to age in place and underscores the value of initiatives, such as SP and CGAs, in health and social care.
Acknowledgements
We thank all participants and assessors who took time to participate in this study. We appreciate the invaluable support and knowledge shared by the community coordinators, municipalities, and community groups from the three participating communities. Other provincial project partners to be acknowledged are the Nova Scotia Department of Seniors and Long-term Care, Nova Scotia Health, 211 Nova Scotia, Canadian Association of Retired Persons – Nova Scotia Chapter, Northwood Care – Research and Innovation, Building Research for Integrated Primary Care Nova Scotia, and Dalhousie University. This work was funded by Nova Scotia Health Research and Innovation (grant number NSH 1026544) and the Department of Seniors and Long-term Care.



 Open access

