





1. Introduction
A series of investigations on aeroelasticity in the last decade has highlighted the critical role played by boundary layer transition on the aerodynamic forces experienced by the aerofoil during unsteady motion. Experiments done in moderately high Reynolds number compressible (Mai & Hebler Reference Mai and Hebler2011; Hebler, Schojda & Mai Reference Hebler, Schojda and Mai2013) as well as incompressible (Lokatt Reference Lokatt2017; Negi, Hanifi & Henningson Reference Negi, Hanifi and Henningson2021) regimes have shown that in natural laminar flow aerofoils, the laminar–turbulent transition point may have a sensitive dependence on the operating conditions, and small changes in angle of attack can result in large variations of the suction side transition location. The emergence of aerodynamic force nonlinearities was found to be linked intimately with this variation of the laminar–turbulent transition location. Of course, such sensitive dependence on operating conditions is not restricted to high Reynolds numbers, but may also be observed in the transitional regime, as has been documented by Pascazio et al. (Reference Pascazio, Autric, Favier and Maresca1996), Nati et al. (Reference Nati, De Kat, Scarano and Van Oudheusden2015) and Negi et al. (Reference Negi, Vinuesa, Hanifi, Schlatter and Henningson2018), where small-amplitude pitch oscillations produced large variations in the boundary layer characteristics. The work of Negi et al. (Reference Negi, Vinuesa, Hanifi, Schlatter and Henningson2018, Reference Negi, Hanifi and Henningson2021) investigates these two regimes for the same aerofoil, and together they provide a fascinating contrast between the effects of small-amplitude forced pitch oscillations of an aerofoil in two different Reynolds number regimes. In the moderately high Reynolds number  ${Re_{c}=750\,000}$ (studied in Negi et al. Reference Negi, Hanifi and Henningson2021), the unsteady flow dynamics could be qualitatively understood through quasi-steady assumptions leading to phase-lagged behaviour of the unsteady boundary layer. On the other hand, the transitional regime at $Re_{c}=100\, 000$, investigated in Negi et al. (Reference Negi, Vinuesa, Hanifi, Schlatter and Henningson2018), displayed a richer dynamic behaviour of the unsteady boundary layer that was far from quasi-steady.
Within a single oscillation cycle, the flow over the suction side of the aerofoil was seen to alternate between turbulent and (mostly) laminar flow states. Different competing mechanisms for transition existed during the cycle, with the flow transitioning over the trailing-edge laminar separation when the boundary layer is mostly laminar. This gave way to a more upstream transition due to the breakdown of Kelvin–Helmholtz rolls that were shed from the incipient leading-edge laminar separation bubble (LSB), which starts to form during the pitch-up phase of the oscillation cycle. The transition moves upstream as the leading-edge LSB grows larger, and the flow eventually transitions over the shear layer of this leading-edge LSB. The reverse process happens in the pitch-down phase of the oscillation, with the leading-edge LSB shrinking in size, and the flow transition slowly moving downstream again.
A large focus of the investigation in Negi et al. (Reference Negi, Vinuesa, Hanifi, Schlatter and Henningson2018) was on the upstream motion of the transition. In particular, it was found that the transition point initially moves upstream relatively smoothly, but at a certain instant has an abrupt change. At that instant, one can identify two independent spatial locations of transition, one on the leading-edge LSB, and one further downstream (due to the breakdown of the Kelvin–Helmholtz rolls), separated by a region of laminar flow. In an attempt to shed more light on the mechanism behind this abrupt change in transition, the authors analysed the local stability characteristics of the leading-edge LSB, and found that the LSB changes character from being convectively unstable to being absolutely unstable, with a small pocket of local absolute instability found at the rear of the LSB. This was found to occur just before the abrupt change in transition, and it was hypothesised that this change of character might be responsible for the emergence of this new transition location.
While the data from the full nonlinear simulations indicated a qualitative agreement with the local analysis, the methodology has a few drawbacks. First, the local analysis ignores the streamwise variation of the flow, which can have a significant impact on the growth rates of perturbations. Second, the local one-dimensional wall-normal profiles were obtained via a spanwise averaging of the flow field. These variations may again contribute to the growth rate of perturbations. Finally, the local analysis in Negi et al. (Reference Negi, Vinuesa, Hanifi, Schlatter and Henningson2018) focused on spanwise homogeneous perturbations (invoking Squire's theorem); however, the visualisation of the final abrupt breakdown shows an initial localised breakdown, followed by the emergence of smaller-scale structures. This could mean that the absolute instability found by the authors is possibly a precursor stage to the final breakdown, with a secondary instability setting in before breakdown. This conjecture is further supported by the fact that the absolute growth rates reported appear to be too low for the rapid breakdown observed in the nonlinear simulations.
Considering the limitations on the local analysis, a global analysis of the flow case is needed to overcome the restrictive assumption of spatial homogeneity in the streamwise direction, and confirm the conclusions drawn in Negi et al. (Reference Negi, Vinuesa, Hanifi, Schlatter and Henningson2018). A straightforward extension would be to perform a global linear stability analysis on instantaneous snapshots of the basic state, and determine whether the local spectrum in time supports an unstable global mode at the time predicted in the reference. Unfortunately, this approach has a number of drawbacks. On the one hand, in contrast to classical stability analyses, the baseflow trajectory considered in this work is unsteady, and there is ambiguity regarding the appropriate instant to be used for the stability analysis. Furthermore, the search for an unstable global eigenmode carries an implicit bias common to all stability analyses focusing on eigenspectra, which is the assumption of an (effectively) infinite time horizon for the growth of perturbations. While this assumption is usually appropriate in the case of fixed points and even periodic orbits by considering the stability of Poincaré sections (i.e. Floquet theory), the applicability becomes at least questionable in the case of an arbitrarily time-dependent basic state such as the pitching aerofoil considered by Negi et al. (Reference Negi, Vinuesa, Hanifi, Schlatter and Henningson2018). In fact, over short time horizons, non-normal operators such as the linearised Navier–Stokes operator can give rise to considerable algebraic growth due to the interaction of highly non-orthogonal eigendirections. This transient or non-modal growth may be so rapid that modal growth is practically irrelevant.
In classical (quasi-)steady stability analysis, the linear operator is assumed to be time-invariant, and its non-normality has the potential to lead to a transient episode of non-modal growth before virtually all perturbations align with the leading eigendirection. In the transient case, however, the changing baseflow leads to a drift in the linear operator. In practice, this means that a linear perturbation effectively never fully aligns with the dominant direction, which is constantly changing, and crucially that the resulting misalignment can be seen as regeneration of conditions for repeated transient growth. In the extreme case, modal growth – and thus the spatial structure and growth rates of (instantaneous) eigendirections obtained from the spectral analysis of a single baseflow snapshot – may by themselves never be practically relevant for the evolution of the transient flow. The degree of misalignment between an instantaneous perturbation and the instantaneous eigendirection is not a constant but depends on the one hand on the rate of change of the baseflow and the sensitivity of the operator to it, and on the other hand on the time scales of the linear growth mechanisms (modal or non-modal) present in the flow. The former dictates how fast the spectral characteristics change, whereas the latter provides the speed limit for the perturbation's evolution and alignment. In order to be able to correctly identify and interpret the stability characteristics of transient flows, the baseflow therefore needs to be scrutinised at regular intervals, allowing us to assess these rates of change.
1.1. Transient global linear stability analysis
In practice, global linear stability analyses of complex three-dimensional flows are difficult and costly, such that the classic approach using extended spectral analyses of baseflow snapshots at sufficiently high frequency is not feasible. The realisation that time-dependent, non-quasi-steady flows are governed by their temporal variation is the motivation to develop a transient linear stability analysis that chooses a different trade-off between resolution of the linear spectrum and temporal resolution. Instead of resolving the full or even large parts of the linear spectrum at a few instants, we accurately follow the variation of the most unstable part of the linear tangent space along the nonlinear, time-dependent baseflow trajectory, which contains the dynamically relevant linear structures for the flow evolution. The obvious drawback is that by spanning only a (relatively) small subspace, the categorisation of linear structures as modal or non-modal from classical stability analysis becomes difficult, because it necessarily requires knowledge of the full spectrum. In spite of this, we argue that due to the inadequacy of the quasi-steady assumption, this distinction becomes less significant in practice compared to having access to the instantaneously most amplified structures over time that, together with the external time-dependence, effectively drive the evolution of the basic state.
When analysing and interpreting the results of transient linear stability analysis, it is also important to consider that the paradigm shift requires a generalisation of the concept of baseflow since, unlike in the classical linear stability of an (unstable) fixed point, the transient baseflow is fundamentally not separable from the instabilities that develop on it and alter it. Nevertheless, the appearance of new instabilities due to baseflow variations can be identified by comparing the change of the baseflow to the spatial structure predicted by the mode. Furthermore, the finite time horizon of the transient stability analysis also relaxes the unconditional primacy of the instantaneously least stable mode, as growth rates and structures can change rapidly and several unstable modes can coexist over finite times, both influencing the flow state. In this context, it is important to note that the basic state considered in this work is not fully laminar, due to the boundary layer transition leading to turbulent regions, but is also far from fully turbulent and chaotic. It is precisely the transient transitional nature of the basic state that makes it an intriguing flow case whose comparatively slow temporal variation warrants linearisation and the detailed analysis of the structures in the linear tangent space to understand the underlying dynamics.
1.2. Optimally time-dependent framework
In view of the requirements for the transient global linear stability analysis of a time-dependent baseflow, the optimally time-dependent (OTD) framework, proposed recently by Babaee & Sapsis (Reference Babaee and Sapsis2016), provides us with a numerically efficient algorithm for the purpose. The framework has two main features that make it particularly well suited for the present analysis. First, the OTD framework is global, i.e. does not rely on the assumption of spatial homogeneity central to the local approach, and can therefore take into account the spatial variation of the baseflow, in particular the considerable non-parallelism of the LSB. Second, the method is based on the time-integration of the viscous linear perturbation problem designed to converge to and subsequently follow the instantaneously most unstable subspace of the tangent space to the nonlinear baseflow trajectory. The OTD framework constructs an orthonormal basis spanning and subsequently tracking the most unstable subspace of the linear tangent space. We stress that the approach is both global, i.e. makes no assumptions regarding the spatial structure of the perturbations, and also agnostic of the time dependence of both the baseflow and the perturbations, which need not be the same. From this OTD basis of the linear tangent space, we can construct the OTD modes that allow us to track the spatio-temporal variation of the most salient linear instabilities in the time-dependent boundary layer in reaction to changes in the baseflow due to the formation and subsequent breakdown of the LSB. The mathematical details of the framework are presented in § 2.2.
Since its proposal, the OTD framework has seen a number of applications in the analysis of chaotic dynamical systems (Farazmand & Sapsis Reference Farazmand and Sapsis2016; Babaee et al. Reference Babaee, Farazmand, Haller and Sapsis2017) and the computation of finite-time Lyapunov exponents (Babaee et al. Reference Babaee, Farazmand, Haller and Sapsis2017; Blanchard & Sapsis Reference Blanchard and Sapsis2019a; Kern et al. Reference Kern, Beneitez, Hanifi and Henningson2021; Beneitez et al. Reference Beneitez, Duguet, Schlatter and Henningson2023), reduced-order modelling and control (see e.g. Blanchard, Mowlavi & Sapsis Reference Blanchard, Mowlavi and Sapsis2018; Blanchard & Sapsis Reference Blanchard and Sapsis2019b), sensitivity computation in dynamical systems (Donello, Carpenter & Babaee Reference Donello, Carpenter and Babaee2022), and edge tracking (Beneitez et al. Reference Beneitez, Duguet, Schlatter and Henningson2020). The majority of these studies mainly took advantage of the method's appealing numerical properties, in spite of the fact that the physical significance of the OTD modes was already visible in the application of the framework to the case of jet in crossflow in the original publication (Babaee & Sapsis Reference Babaee and Sapsis2016), which was unfortunately not discussed in great detail. The visualisations show how the four OTD modes are strongly localised on the shear layers close to the exit of the jet, and in particular the vortex sheet that is the origin of the strong instability in the jet that leads to the eventual roll-up of the shear layer, which is confirmed by a classical global stability analysis that identifies this region as the centre of the wavemaker (Chauvat et al. Reference Chauvat, Peplinski, Henningson and Hanifi2020). Although this is not mentioned, the OTD modes also capture structures on top of the hairpin vortices that appear downstream of the jet exit, and indicate secondary instability that cannot be studied in the classical stability analysis of the steady fixed point. There is some irony in the choice of physically relevant test cases for the OTD framework in the original publication, namely plane Poiseuille flow and jet in crossflow, in that they are autonomous and thus are not well suited to showcase a unique feature of the OTD modes, which is the fact that they can follow the time-dependent linear dynamics for non-autonomous flows where the fundamental assumptions underlying classical stability analysis break down.
This potential was explored in detail by Kern et al. (Reference Kern, Beneitez, Hanifi and Henningson2021) using the canonical non-autonomous case of two-dimensional pulsating plane Poiseuille flow, where the OTD mode structures were seen to correspond to the instability modes of plane Poiseuille flow modulated by the superimposed pulsations. The temporal periodicity of the flow case combined with its geometrical simplicity that admits an analytical solution even in the non-autonomous case – the direct comparison between the instantaneous eigendirections of the local operator (i.e. the quasi-steady analysis at each point in time) and the asymptotic linear solutions (the Floquet eigendirections) – was considered in Kern, Hanifi & Henningson (Reference Kern, Hanifi and Henningson2022). One of the key results of the analysis was to show the increasing misalignment between the instantaneous eigendirections governed by the external time dependence via the baseflow and the perturbations, whose time scales are independent of the external pulsation time scale but are instead governed by the time scales of linear growth mechanisms, in this case the transient growth via the Orr mechanism in particular. The key fact here is that the leading OTD modes will always capture the dominant perturbation dynamics and thus the physically relevant structures, although their exhaustive interpretation in terms of modal and non-modal growth requires extensive knowledge of the full spectrum of the linear operator.
Very recently, Beneitez et al. (Reference Beneitez, Duguet, Schlatter and Henningson2023) have applied the OTD framework to the temporal evolution of the edge trajectory in the Blasius boundary layer featuring unsteady streaks requiring a transient framework for a linear stability analysis. Their analysis recovered unsteady counterparts of the outer modes akin to the secondary instability modes identified by Vaughan & Zaki (Reference Vaughan and Zaki2011) that dominate the dynamics in the tangent space. Furthermore, a new type of structure was discovered, which is thought to play a role in streak switching and the lateral propagation of the localised edge state (Beneitez et al. Reference Beneitez, Duguet, Schlatter and Henningson2023). Also here, the generalisation of the linear stability concept avoiding the quasi-steady assumption allows for a less restricted analysis, which provides new insights into the instability mechanisms of transient flows.
The above successful applications of the OTD framework to various time-dependent flows have inspired us to apply the method to the flow case considered by Negi et al. (Reference Negi, Vinuesa, Hanifi, Schlatter and Henningson2018) to track the linear instabilities involved in the evolution of the LSB over time. The present study is aimed at extracting physically relevant structures leading up to the breakdown of the LSB using the transient OTD framework. The chosen approach naturally captures linear phenomena that would appear under the quasi-steady assumption where it is appropriate. A detailed comparison of the two approaches is beyond the scope of this paper, but given the results obtained using the transient linear stability analysis framework presented here, the authors believe that an analysis similar to the one performed for pulsating Poiseuille flow (Kern et al. Reference Kern, Beneitez, Hanifi and Henningson2021, Reference Kern, Hanifi and Henningson2022) would be an interesting extension of the present work to quantify the impact of the time dependence on the stability characteristics.
The remainder of the paper is organised as follows. After introducing the problem and the mathematical models including the OTD framework in § 2, the numerical approach including solvers and meshing is described in § 3. The results of the analysis are presented in § 4, together with a discussion. A summary and concluding remarks are gathered in § 5.
2. Problem definition
The formation and evolution of an LSB on the ED36F128 natural laminar flow aerofoil (Lokatt Reference Lokatt2017; Lokatt & Eller Reference Lokatt and Eller2017) subject to forced small-amplitude pitch oscillations is considered at a chord-based Reynolds number  $Re = 100\,000$ using the set-up from Negi et al. (Reference Negi, Vinuesa, Hanifi, Schlatter and Henningson2018). The sinusoidal aerofoil motion with a reduced frequency $k = \varOmega b/U_0 = 0.5$ based on the semi-chord length $b$ and the free-stream velocity $U_0$ around the pitch axis located at $(x_0,y_0) = (0.35,0.034)$ is defined in terms of the instantaneous angle of attack given by
 \begin{equation} \alpha(t) = \alpha_0 + \Delta \alpha \sin(\varOmega t) , \end{equation}
where the mean angle of attack is  $\alpha _0 = 6.7^\circ$, the oscillation amplitude is $\Delta \alpha = 1.3^\circ$, and $\varOmega$ is the oscillation frequency. The domain is periodic in the spanwise direction, which has an extent of $\Delta z = 0.25$ chords.
The focus of the present study is the dynamics of the LSB, which exists during only part of the oscillation cycle. In order to capture both the formation and growth as well as the eventual breakdown of the bubble, we restrict the analysis to the third pitching cycle of the simulation in Negi et al. (Reference Negi, Vinuesa, Hanifi, Schlatter and Henningson2018) close to the maximum pitching angle corresponding to the time interval  $t/T_{osc} \in [ 2.650, 3.363 ]$ with oscillation period $T_{osc} = 2{\rm \pi}$. This corresponds to approximately 4.5 convective time units $c/U_0$.
2.1. Governing equations
The nonlinear basic flow over the aerofoil is governed by the fully three-dimensional, time-dependent incompressible Navier–Stokes equations
 \begin{equation} \frac{\partial \boldsymbol{U}_b}{\partial t} + (\boldsymbol{U}_b \boldsymbol{\cdot} \boldsymbol{\nabla}) \boldsymbol{U}_b ={-} \boldsymbol{\nabla} P + \frac{1}{Re}\,\nabla^2 \boldsymbol{U}_b, \quad \boldsymbol{\nabla} \boldsymbol{\cdot} \boldsymbol{U}_b = 0 , \end{equation}
where  $\boldsymbol {U}_b = (U_x,U_y,U_z)$ is the three-dimensional velocity field, and $P$ is the pressure. The equations are non-dimensionalised with the free-stream velocity $U_0$ and the chord length $c= 2b$ to obtain a chord-based Reynolds number $Re= 100\,000$.
The instantaneous stability characteristics of the resulting baseflow  $\boldsymbol {U}_b$ are analysed by considering the evolution of a three-dimensional global linear perturbation on top of the basic state, the dynamics of which follows the linearised Navier–Stokes equations
 \begin{equation} \frac{\partial \boldsymbol{u}}{\partial t} + ( \boldsymbol{U}_b \boldsymbol{\cdot} \boldsymbol{\nabla})\boldsymbol{u} + (\boldsymbol{u} \boldsymbol{\cdot} \boldsymbol{\nabla}) \boldsymbol{U}_b ={-} \boldsymbol{\nabla} p + \frac{1}{Re}\, \nabla^2 \boldsymbol{u} + \boldsymbol{f}_{ext}, \quad \boldsymbol{\nabla} \boldsymbol{\cdot} \boldsymbol{u} = 0 , \end{equation}
where  $\boldsymbol {u}$ is the three-dimensional linear perturbation velocity field, $p$ is the associated perturbation pressure, and $\boldsymbol {f}_{ext}$ is an external forcing term for the linear problem. The linear equations employ the same non-dimensionalisation as their nonlinear counterparts.
The pressure has no evolution equation in the incompressible limit but instead assumes the appropriate value to satisfy the continuity constraint. Consequently, by projecting the perturbation velocity field onto the closest divergence-free space via the Helmholtz–Hodge decomposition, the linearised equations (2.3) are recast in dynamical system form
 \begin{equation} \frac{\partial \boldsymbol{q}}{\partial t} = \mathcal{L} \boldsymbol{q} + \boldsymbol{f} , \end{equation}
where  $\mathcal {L}$ represents the full linear operator (excluding pressure) acting on the three-dimensional solenoidal part $\boldsymbol {q} = (u,v,w)$ of the velocity field, and $\boldsymbol {f}$ is the divergence-free part of the external forcing $\boldsymbol {f}_{ext}$.
We note explicitly that the linearisation is performed continuously along the time-dependent baseflow trajectory, implying that not only  $\boldsymbol {q}$ but also $\mathcal {L}$, directly dependent on $\boldsymbol {U}_b$, is implicitly time-dependent. The basic state considered here is never steady, although the intrinsic unsteadiness of the Navier–Stokes equations may be negligible in certain laminar flow conditions, due to the externally forced pitching motion.
2.2. The linear problem and the OTD framework
Given an orthonormal set of  $r$ basis vectors $\mathcal {Q} = \{ \boldsymbol {q}_{i} \}^r_{i = 1}$, the OTD framework formulates and solves an optimisation problem to find the rate of change of $\mathcal {Q}$ that minimises the Euclidean distance to the action of the linear operator $\mathcal {L}$ under the constraint of maintaining orthonormality with respect to the standard energy norm
 \begin{equation} \langle \boldsymbol{q}_i ,\boldsymbol{q}_j \rangle = \int_\varOmega \boldsymbol{q}_j^H\boldsymbol{q}_i \, {\rm d}\varOmega , \end{equation}
where the integration is carried out over the full domain of the linear problem, and  $(\cdot )^H$ denotes complex conjugate transposition. The evolution equation for the individual basis vectors $\boldsymbol {q}_i$ given by the solution of this constrained optimisation problem given by Babaee & Sapsis (Reference Babaee and Sapsis2016) reads
 \begin{equation} \frac{\partial \boldsymbol{q}_i}{\partial t} = \mathcal{L} \boldsymbol{q}_i - \sum_{j=1}^{r} [ \langle \mathcal{L} \boldsymbol{q}_i, \boldsymbol{q}_j \rangle - \varphi_{ij} ] \boldsymbol{q}_j , \quad i = 1, \ldots, r , \end{equation}
where  $\varphi _{ij}$ is an arbitrary function satisfying $\varphi _{ij} = -\varphi _{ji}$. Following the work of Blanchard & Sapsis (Reference Blanchard and Sapsis2019a), we choose $\varphi _{ij}$ to be
 \begin{equation} \varphi_{ij} = \begin{cases} -\langle \mathcal{L} \boldsymbol{q}_j ,\boldsymbol{q}_i\rangle & \text{if } j < i,\\ 0 & \text{if } j=i, \\ \langle \mathcal{L} \boldsymbol{q}_j ,\boldsymbol{q}_i\rangle & \text{if } j > i, \\ \end{cases} \quad \text{with} \ j = 1, \ldots, r , \end{equation}
such that the evolution equations (2.6) become equivalent to continuous Gram–Schmidt orthonormalisation of the basis vectors. The resulting expression for the forcing term is given by
 \begin{equation} \boldsymbol{f}_i ={-} \langle \mathcal{L} \boldsymbol{q}_i, \boldsymbol{q}_i \rangle \boldsymbol{q}_i - \sum_{j=1}^{i-1} [ \langle \mathcal{L} \boldsymbol{q}_i, \boldsymbol{q}_j \rangle + \langle \mathcal{L} \boldsymbol{q}_j, \boldsymbol{q}_i \rangle ] \boldsymbol{q}_j , \quad i = 1 , \ldots r , \end{equation}
which is injected into the linear equations (2.4) for each of the  $r$ basis vectors.
The basis vectors evolving according to (2.6) are time-dependent and orthonormal, and span a flow-invariant subspace of the linear tangent space called OTD subspace (Babaee & Sapsis Reference Babaee and Sapsis2016). Following other authors (e.g. Farazmand & Sapsis Reference Farazmand and Sapsis2016), we assume that the convergence of the OTD subspace to the most unstable subspace of the tangent space, proven for hyperbolic fixed points (Babaee & Sapsis Reference Babaee and Sapsis2016), holds also in the case of the trajectory considered in this work, which has an arbitrary time dependence.
The chosen formulation using the specific rotation matrix (2.7) implies that adding more modes does not change existing basis vectors but allows a more accurate interpretation of the growth within the subspace in term of modal and non-modal growth, by adding more information about possible interactions with newly spanned directions that may be non-orthogonal (Kern et al. Reference Kern, Hanifi and Henningson2022). Furthermore, tracking additional modes has the benefit of more accurately tracking the most unstable directions, which are effectively shielded from the dynamics outside of the subspace by the most stable modes (Babaee et al. Reference Babaee, Farazmand, Haller and Sapsis2017). Since subspace sizes rigorously based on spectral properties of the full linear operator (Blanchard et al. Reference Blanchard, Mowlavi and Sapsis2018; Kern et al. Reference Kern, Beneitez, Hanifi and Henningson2021) are unfeasible for complex flows, the subspace dimension must be chosen heuristically and is typically severely limited by the available computational resources (Beneitez et al. Reference Beneitez, Duguet, Schlatter and Henningson2023). In this work, an OTD subspace size  $r=16$ was chosen (corresponding to 8 complex conjugate eigenmodes) as a trade-off between spanning the largest possible linear subspace of the tangent space and the computational cost of solving additional linear problems in parallel with the evolution of the nonlinear baseflow trajectory.
3. Numerical methods
3.1. Segregated simultaneous coupled nonlinear and linear simulations
The nonlinear simulations of the pitching aerofoil use the same set-up as Negi et al. (Reference Negi, Vinuesa, Hanifi, Schlatter and Henningson2018), using the open-source high-order spectral element code Nek5000 (Fischer, Lottes & Kerkemeier Reference Fischer, Lottes and Kerkemeier2008). The numerical domain is divided into hexahedral elements inside which the governing equations are discretised by Galerkin projection onto a set of Lagrange interpolants on Gauss–Lobatto–Legendre points following the  $\mathbb {P}_N$– $\mathbb {P}_{N-2}$ formulation of the spectral element method (Maday & Patera Reference Maday and Patera1989) using 11th (9th) order polynomial bases for the velocity (pressure) expansion in each coordinate direction within each element. The equations are integrated in time using a third-order backward differencing scheme (BDF3) treating the viscous term implicitly. The nonlinear terms are computed explicitly via a third-order extrapolation (EXT3) with over-integration. The highest frequencies in the solution are filtered using a relaxation-term filtering (Schlatter, Stolz & Kleiser Reference Schlatter, Stolz and Kleiser2004) to ensure stability, in particular in the far field, but there is no modelling of subgrid stresses, which are resolved in the near-wall regions. In the boundary layers and in the regions of transitional flow close to the LSB, the mesh is fine enough such that the filtering is negligible and the simulations are equivalent to a direct numerical simulation in all relevant aspects (Negi et al. Reference Negi, Vinuesa, Hanifi, Schlatter and Henningson2018). The aerofoil motion is included using the arbitrary Lagrangian–Eulerian framework (Ho & Patera Reference Ho and Patera1990) with local mesh deformation involving a smooth radial blending function to transition from the solid-body rotation of the aerofoil to the stationary far-field boundaries. The C-type mesh of the domain extends radially 2 chords upstream and 4 chords downstream of the aerofoil. The spanwise extent is 0.25 chords with periodic boundary conditions, whereas the energy-stabilised boundary condition due to Dong (Reference Dong2015) is used at the outflow. The inlet boundary conditions are extracted from an auxiliary unsteady RANS calculation superimposed with turbulent fluctuations corresponding to a turbulence intensity ${\text {Tu} = 0.1\,\%}$ generated using Fourier modes with random phase shifts similar to the method used in Brandt, Schlatter & Henningson (Reference Brandt, Schlatter and Henningson2004). Details of the numerical set-up are given in Negi et al. (Reference Negi, Vinuesa, Hanifi, Schlatter and Henningson2018).
The spanwise extent of the computational domain is comparatively large, corresponding to about 25 times the boundary layer thickness. This domain size is more than sufficient to capture boundary layer instabilities that typically have spanwise extents of the same order as the boundary layer thickness, but may not be able to accurately resolve larger spanwise coherent structures such as stall cells (see e.g. Broeren & Bragg Reference Broeren and Bragg2001). Although the flow evolution involves an LSB that extends over up to 20 % of the chord, as well as trailing-edge separation (in particular over the last 20 % of the aerofoil chord), both of which are typical in pre-stall flows, the present aerofoil configuration is far from stall such that the corresponding structures are not expected to appear. The facts that the boundary layer dynamics and the associated aerodynamic loads over the entire oscillation cycle are predicted accurately by the simulations in Negi et al. (Reference Negi, Vinuesa, Hanifi, Schlatter and Henningson2018), and the linear instabilities computed in the present work match the nonlinear behaviour of the baseflow, serve as an a posteriori confirmation of the adequacy of the computational domain.
The baseflow simulations are repeated using full restarts from the simulations of Negi et al. (Reference Negi, Vinuesa, Hanifi, Schlatter and Henningson2018) in order to compute the linearisation around the time-dependent trajectory maintaining the third-order accuracy in time. The discretisation of the three-dimensional baseflow problem leads to a total of  $200 \times 10^6$ spatial degrees of freedom. The large size of the problem implies that saving the baseflow field or the linearisation to disk for a separate integration of the linear equations is inefficient. Therefore, linearisation of the nonlinear baseflow and solution of the associated perturbation equations are performed on the fly by solving the nonlinear and linear problems simultaneously to avoid storing intermediate data, and improving efficiency and reducing the data storage footprint.
The focus of the present analysis is the dynamics of the LSB on the aerofoil suction side. Therefore, the OTD basis is not constructed for the entire baseflow domain but is instead restricted to a small region of interest close to the leading edge of the aerofoil, concentrating the available computational resources on the relevant part of the domain, and considerably reducing the overall cost of the linear solves. This separation is achieved using the segregated simultaneous coupled nonlinear and linear framework developed in Kern et al. (Reference Kern, Beneitez, Hanifi and Henningson2021) that was successfully applied to open aerodynamic flows in Kern (Reference Kern2023). Based on the idea of the overlapping grid methodology of NekNek (Merrill et al. Reference Merrill, Peet, Fischer and Lottes2016), the nonlinear and linear problems are solved in separate instances of Nek5000. The segregation of the problems allows for topologically different meshes for each session under the condition that the linear domain is a subset of the nonlinear domain. The baseflow solution is interpolated onto the linear subdomain using the standard spectrally accurate interpolation routines available in Nek5000, and communicated to the twin session using the efficient communication protocols provided in NekNek. Since the present application solves different problems in each session, there is only a one-way dependence from the baseflow to the linear problems, thus avoiding the costly iterations at each step between the sessions, which are required within the NekNek framework to converge the solution of the same problem on separate overlapping meshes. The linear problems are solved using the same spectral element formulation and polynomial order as the nonlinear simulation.
The method as well as the implementation are in principle able to handle an arbitrary number of basis vectors. In practice, the size of the OTD subspace is limited by the computational cost of computing and storing these vectors. The localised mesh for the linear simulations contains about 90 % fewer elements than the mesh for the baseflow computations. As the memory footprint scales approximately linearly with the mesh size, the present simulations have an approximate memory requirement of 2 TB (800 GB nonlinear,  $16 \times 80$ GB linear). The linear and nonlinear simulations were run simultaneously on 64 nodes of the Tetralith cluster from National Supercomputer Centre in Linköping, Sweden, with a $40/24$ split of the nodes between the nonlinear/linear instances to obtain good load balancing. Each compute node has 32 cores and 96 GB of memory (6 TB in total).
3.2. Meshing and initial conditions for the linear domain
The mesh for the baseflow domain is the same as in Negi et al. (Reference Negi, Vinuesa, Hanifi, Schlatter and Henningson2018). The hexahedral linear subdomain is meshed using a high-quality body-fitted mesh covering the suction side of the aerofoil in the streamwise interval  $x/c \in [ 0.01, 0.4 ]$, including the full LSB at all considered time instants. The linear mesh covers the full span of the nonlinear simulation, and inherits the spanwise periodicity. Homogeneous Dirichlet boundary conditions are enforced on all other boundaries. The wall-normal extent of the mesh orthogonal to the surface was chosen to vary smoothly from $\Delta y = 0.05c$ at the inlet to $\Delta y = 0.1c$ at the outlet in order to minimise the boundaries at which the baseflow exits the domain, which can lead to non-physical reflections. At the boundaries at which outflow is unavoidable, in a similar fashion to comparable global stability analyses (Peplinski, Schlatter & Henningson Reference Peplinski, Schlatter and Henningson2015; Chauvat et al. Reference Chauvat, Peplinski, Henningson and Hanifi2020), a sponge region is introduced to smoothly force the perturbations to zero towards the boundary. Extensive tests on two-dimensional precursor simulations of the same aerofoil geometry were used to design the mesh resolution for the linear domain and ensure independence of the results from the sponge parameters. The spatial domain for the linear solves in comparison to the baseflow mesh is shown in figure 1, indicating also the extent of the sponge region. The spatial resolution within the domain is chosen similar to or higher than that of the baseflow domain, to maintain accuracy. The mesh in the subdomain has 90 % fewer elements than the baseflow mesh, and can be optimised for performance so that the cost per time step for each linear solve is 25 times lower than for the nonlinear step. A roughly equal time per time step in both sessions running in tandem is achieved by tuning the distribution of the allocated computational cores between the sessions. In order to avoid the initial transients from overshadowing the dynamics of interest, the OTD basis initialised with random noise is first integrated for approximately $30\,\%$ of the total simulation time to allow the subspace to align to the tangent space, and then re-injected at the initial time. The OTD basis needs to be periodically re-orthonormalised to maintain accuracy in spite of the errors due to finite-precision arithmetic inherent in numerical integration.
Sketch of the three-dimensional bounding box and mesh of the subdomain (red) relative to the aerofoil. The shaded area in the subdomain mesh indicates the location of the sponge region covering the entire span. Only spectral elements are shown, and both simulations are run at polynomial order  $N = 11$.

3.3. Recovering the OTD modes
The discretised evolution equations for the OTD basis  ${{\boldsymbol{\mathsf{Q}}}} = [ q_1 \, | \, \cdots \, | \, q_r ] \in \mathbb {R}^{n \times r}$, where $n$ denotes the number of spatial degrees of freedom, can be written compactly in matrix form as
 \begin{equation} \frac{\partial {\boldsymbol{\mathsf{Q}}}}{\partial t} = {\boldsymbol{\mathsf{L}}}{\boldsymbol{\mathsf{Q}}} - {\boldsymbol{\mathsf{Q}}}({\boldsymbol{\mathsf{Q}}}^{\rm T}{\boldsymbol{\mathsf{L}}}{\boldsymbol{\mathsf{Q}}} - {\boldsymbol{\varPhi}}) , \end{equation}
where  ${{\boldsymbol{\mathsf{L}}}} \in \mathbb {R}^{n \times n}$ is the discretised full linear operator, and ${\boldsymbol {\varPhi }} = [ \varphi _1 \, | \, \cdots \, | \, \varphi _r ] \in \mathbb {R}^{r \times r}$ is the skew-symmetric internal rotation matrix (2.7).
As part of the time-integration of the basis vectors, we compute the orthogonal projection of the full operator  ${{\boldsymbol{\mathsf{L}}}}$ onto the subspace spanned by the columns of ${{\boldsymbol{\mathsf{Q}}}}$, defining the reduced operator
 \begin{equation} {{\boldsymbol{\mathsf{L}}}}_r = {{\boldsymbol{\mathsf{Q}}}}^{\rm T}{{\boldsymbol{\mathsf{L}}}}{{\boldsymbol{\mathsf{Q}}}} \in \mathbb{R}^{r \times r}, \end{equation}
which is a dynamically consistent reduction of the full operator (Farazmand & Sapsis Reference Farazmand and Sapsis2016). Since the basis vectors themselves have no physical interpretation, we extract physically relevant spatial structures from the OTD subspace by performing an eigendecomposition of the reduced operator as a proxy for the full linear dynamics, to obtain
 \begin{equation} {{\boldsymbol{\mathsf{L}}}}_r = {{\boldsymbol{\mathsf{V}}}} {\boldsymbol{\varLambda}} {{\boldsymbol{\mathsf{V}}}}^{{-}1} , \end{equation}
where  ${{\boldsymbol{\mathsf{V}}}} = [ v_1 \, | \, \cdots \, | \, v_r ] \in \mathbb {C}^{r\times r}$ contains the eigenvectors, and ${\boldsymbol {\varLambda}} = \text {diag}(\lambda _i) \in \mathbb {C}^{r\times r}$ is the diagonal matrix of associated eigenvalues ordered by decreasing real part, and subsequently projecting the basis vectors onto the resulting eigendirections. The columns of the projection matrix ${{\boldsymbol{\mathsf{U}}}} = [ u_1 \, | \, \cdots \, | \, u_r ] \in \mathbb {C}^{n\times r}$ computed as
 \begin{equation} {{\boldsymbol{\mathsf{U}}}} = {{\boldsymbol{\mathsf{Q}}}} {{\boldsymbol{\mathsf{V}}}} \end{equation}
are the OTD modes that capture the spatial structure of physically relevant instabilities within the OTD subspace.
In order to follow specific modes during the simulation, it is useful to track the corresponding eigenpairs over time. Since eigenvalue algorithms generally do not produce spectra in any particular order, but the reduced operator is sufficiently small to compute all eigenvalues at negligible cost, the eigenvalues can be tracked as a post-processing step. By computing the eigenvalue spectra of the reduced operator every 10 time steps, the frequency is high enough compared to the variation of the spectra in time, so that a linear-extrapolation-based nearest neighbour search is sufficient to accurately track the eigenvalues in the complex plane.
4. Results
4.1. Overview of the baseflow
In this subsection, we give a brief overview of the nonlinear dynamics of the baseflow in the time interval considered in this work. For a more detailed analysis of the full oscillation, we refer to Negi et al. (Reference Negi, Vinuesa, Hanifi, Schlatter and Henningson2018).
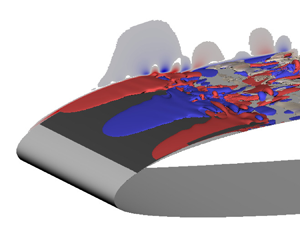
The present simulation covers the formation, growth and ultimately breakdown of an LSB close to the leading edge of the aerofoil. Over the course of this evolution, both the transition location on the suction side as well as the mechanism changes, as shown by the snapshots of the baseflow in figure 2. While the transition is initially typical of boundary layers in low free-stream disturbance environments, involving the breakdown of quasi-two-dimensional rolls developing downstream, the transition towards the end of the simulation is very abrupt and localised close to the reattachment point of the LSB. To put the visualisations into context, the space–time diagram of the span-averaged wall shear-stress over the suction side of the aerofoil is shown in figure 3. The spanwise-coherent rolls are a dominant feature and appear progressively farther upstream throughout the simulation. Simultaneously, the evolution of the LSB close to the leading edge is very prominent. The breakdown of the LSB and abrupt transition visible in the snapshot is also reflected in the increased level of unsteadiness in the wall shear at the rear of the LSB towards the end of the simulation. The figure also shows the domain in which the linear equations are solved, covering the extent of the bubble centred around the streamwise location of the average LSB reattachment point. The rest of the paper will focus exclusively on the domain covered by the linear simulation.
Visualisation of the boundary layer transition at two different instants using  $\lambda _2$-structures coloured by streamwise velocity ( $U_x \in [-0.6,1.8]$, blue to red): (a) $t/T_{osc} = 3.19$, $\alpha = 7.91^\circ$, and (b) $t/T_{osc} = 3.34$, $\alpha = 7.75^\circ$.

Space–time plot of the span-averaged wall shear-stress distribution on the aerofoil suction side. The black line indicates vanishing wall shear-stress. The black box indicates the space–time extent of the subdomain, and the shaded area at the outlet corresponds to the sponge region. The dashed lines indicate the instants corresponding to the snapshots in figure 2.

A visualisation of the complete nonlinear baseflow evolution considered in this paper, including the variation of the instantaneous angle of attack compared with the oscillation period and the span-averaged wall shear-stress on the aerofoil suction side, is available in the supplementary movie available at https://doi.org/10.1017/jfm.2024.407.
4.2. Evolution of the OTD subspace
Over the entire considered time interval, a 16-dimensional OTD basis is evolved alongside the nonlinear baseflow. The spectrum of the reduced operator, as well as its instantaneous numerical abscissa, are computed with high frequency to track the evolution of the OTD subspace over the course of the simulation. The resulting time histories of the growth rates within the 16-dimensional OTD subspace are shown in figure 4 together with the space–time plot of the wall shear-stress within the subdomain, revealing complex dynamics that very clearly reflect the changes in the baseflow. Note that the orientation of the space–time plot is changed to have time along the  $x$-axis, and that the plots are separated into two consecutive parts for improved readability.
Time traces of the real growth rates of the eigenvalues of  ${{\boldsymbol{\mathsf{L}}}}_r$ as well as the numerical abscissa compared to the span-averaged wall shear-stress in the subdomain (the flow is from bottom to top). The time series has been split in two segments for clarity. The shaded area in the wall shear-stress plots indicates the extent of the sponge region. Note the different scalings of the $y$-axis for the plots of the eigenvalue traces. For the time instants marked by solid vertical lines, the leading OTD mode is shown in figure 5. The dashed line marks the onset of absolute instability according to Negi et al. (Reference Negi, Vinuesa, Hanifi, Schlatter and Henningson2018).

Isosurfaces of the  $u$-velocity (red/blue, $u = \pm 20$) of the leading OTD mode at time instants marked in figure 4, together with a slice showing $|u|>0.5$ to indicate the extent of the mode. The black surface is the isocontour of zero streamwise baseflow velocity ( $U_x = 0$) as a proxy for the LSB location, and for $x/c>0.25$, the $\lambda _2$-structures of the baseflow are shown (beige). The flow is from left to right.

The first point to make is that the most unstable subspace is always globally unstable with at most a few stable modes. Care must be taken when relating the OTD growth rates to the full system. There is indeed a risk for misinterpretation of non-modal growth with respect to the full operator as modal growth within the subspace that is unaware of non-orthogonal eigendirections of the full linear operator that it does not span. This topic is considered in more detail in Kern et al. (Reference Kern, Hanifi and Henningson2022) for the case of pulsatile plane Poiseuille flow. Especially, the modal growth rates recovered by a small OTD subspace should therefore not be considered accurate values, in particular in the context of the necessary spatial truncation of the subdomain that does not fully contain the modes. Nevertheless, the relative variations of the growth rate as well as the spatial structure of the recovered OTD modes are representative of the true linear dynamics of the flow. The initial slow stabilisation of the subspace prior to the formation of the LSB is likely due to transients related to the injection of the OTD basis vectors aligned with the linear dynamics at  $t/T_{osc} \approx 3.2$.
For a few selected time instants, the leading OTD mode is visualised in figure 5 in order to reconstruct the events leading up to the breakdown of the LSB. Before the formation of the bubble, all OTD modes are concentrated near the outlet ( $t_1$) and correspond to oblique waves. At $t_2$, the leading mode begins to move upstream, heralding the imminent formation of the LSB. By $t_3$, we can see the formation of strongly amplified quasi-two-dimensional wavepackets in the middle of the subdomain, soon followed by the emergence of the LSB as the boundary layer separates at approximately $10\,\%$ chord but rapidly reattaches before transition. As the LSB grows, the leading OTD mode follows the reattachment point. By $t_4$, the core of all modes lies downstream of the reattachment point, and their structure consists mainly of quasi-two-dimensional rolls with considerably increased spatial growth rate. Interestingly, already at this time, the OTD modes extend all the way to the initial separation point and exhibit spanwise inhomogeneity within the LSB in spite of its small wall-normal extent. This loss of two-dimensionality in the LSB is very similar to the global instabilities studied by Theofilis, Hein & Dallmann (Reference Theofilis, Hein and Dallmann2000). At $t_5$, the growth of the spanwise rolls in the nonlinear solution leads to considerable unsteadiness in the baseflow at the rear of the subdomain, evidenced by the appearance of vortices identified by $\lambda _2$-structures. In this period, the OTD modes intermittently localise on the nonlinear rolls, but return to the LSB once the rolls are swept out of the subdomain. After $t_6$, the primary quasi-two-dimensional instability waves are always present within the linear subdomain, and begin to break down. The OTD modes now also capture secondary instabilities of the nonlinear rolls ( $t_7$), leading to considerably more spatial complexity. The coexistence of the two types of instability within the subdomain leads to more variability in the instantaneous growth rates and increased non-modal growth potential within the OTD subspace, although the average growth rate is not affected.
The local analyses of spanwise-averaged boundary layer profiles in Negi et al. (Reference Negi, Vinuesa, Hanifi, Schlatter and Henningson2018) found that the reverse flow profiles at the rear of the LSB become absolutely unstable at approximately  $t/T_{osc} = t_{abs} = 3.32$. It is at approximately this time ( $t>t_7$) that the amplitude of the mode increases enough within the LSB to be apparent in the isosurfaces of the streamwise velocity, showing that a significant part of the instability is localised on the LSB. Note that the perturbations within the bubble have essentially the same spatial structure dictated by the size of the bubble, with negligible wall-normal component, but differ mainly in their growth rate. There is no discernible change in the OTD subspace near $t_{abs}$. The higher growth rates are due to intermittent localised secondary instabilities on the transitioning rolls just before they are swept out of the domain, and do not seem to be related to the bubble. In Negi et al. (Reference Negi, Vinuesa, Hanifi, Schlatter and Henningson2018), the streamwise wavenumber for which the extension along the imaginary axis passes through the pinch point corresponds to $k_x \approx 80$, i.e. a wave with a streamwise wavelength of $\lambda _x \approx 8\,\%$ chord. This wavelength is similar to the streamwise extent of the mode within the bubble (the entire separated region spans approximately $18\,\%$ of the chord). This similarity indicates that the OTD mode is likely the global counterpart of the absolutely unstable local mode found in the reference that leads to an accelerated growth of disturbances within the bubble.
Within a very short time span, the core of the dominant mode in the LSB grows considerably, and its three-dimensional structure becomes more complicated. Beginning just before  $t_8$, a very localised structure emerges, emanating from the rear of the LSB in the middle of the span initiating the bubble breakdown. By $t_9$, the leading mode is completely focused on the region of rapid transition due to the bubble breakdown and the instabilities that grow on top of the resulting flow patterns. The radically different structure of this highly amplified mode indicates that it represents a very different mechanism compared to the previous instabilities in the bubble. Indeed, these growth rates are much higher than those predicted in the reference for the absolute instability that generated the disturbances on top of which these modes develop. The instability seems to form simultaneously from single vortical filaments, one of them clearly evolving into a hairpin-like structure ( $t_9$). The growth rate spike is due to a single mode that seems largely orthogonal to the rest of the modes, judging by the low numerical abscissa in comparison to the modal growth. Once the LSB breakdown has begun, the transition is near instantaneous at the location of the instability core, and the spatial structure of all OTD modes becomes very complex while being localised away from the outflow. Interestingly, the growth rates within the subspace drop after the spike at $t_9$ and stabilise at about half three times the value of the previous average. At this point, the transition in the bubble is very rapid, as we can see from the spatial distribution of turbulence kinetic energy shown for $t_{10}$ in figure 6(a). From $t_8$ to $t_9$, the entire OTD subspace concentrates on the bubble reattachment point, with few structures downstream and virtually no growth in the front of the bubble. It is likely that the previous instabilities in this region still exist but are outperformed in terms of growth rate by the absolute instability, and thus drop out of the (small) OTD subspace.
Evolution of the size of the LSB and energy content in the fundamental spanwise Fourier component of vertical velocity over time. (a) Span-averaged turbulence intensity at  $t_{10}$ (colour, after the onset of breakdown) and LSB size over time (colour-coded lines of zero tangential velocity, if present). Axes not to scale. The turbulence intensity is computed based on an average over the span and a short time window ( $\Delta t = 1.6 \times 10^{-4} \, T_{osc}$). The cross indicates the location at which the data for figure 7 are collected. (b) Space–time plot of the magnitude of the fundamental spanwise Fourier component of $U_y$ along the dotted line in (a). The flow is from left to right. The time instants $t_1,\ldots,t_{10}$ and $t_{abs}$ in figure 4 (black lines) as well as the contour of zero span-averaged wall shear-stress (grey line) are shown for reference.

Time traces of spatial Fourier components of the baseflow and leading OTD mode at the location marked with a cross in figure 6(a). A moving average with a window corresponding to the period of the dominant vortex shedding time scale ( $\Delta t_w = 8.9\times 10^{-3}\, T_{osc}$) is applied to the data. The vertical line in each plot indicates the onset of absolute instability according to Negi et al. (Reference Negi, Vinuesa, Hanifi, Schlatter and Henningson2018). (a) Variation over time of the magnitude of selected spanwise Fourier components (wavenumber $k_z$) of the streamwise baseflow velocity ( $U_x$). The grey lines indicate exponential growth rates $\sigma$ for reference. (b) Variation over time of the relative magnitude of selected spanwise Fourier components (wavenumber $k_z$) of the streamwise component of the leading OTD mode ( $u_1$) with respect to the total magnitude (dashed line).

4.3. Characterisation of the LSB breakdown
The transient linear instability analysis using the OTD framework can be complemented by analyses of the nonlinear baseflow dynamics. Figure 6(a) shows the evolution of the span-averaged size of the separation bubble by tracking the wall-normal distance of the point of vanishing tangential velocity component. Comparing the size of the LSB at different instants, we can clearly see the gradual thickening of the bubble, which accelerates after  $t_7$. A spatial Fourier analysis in the spanwise direction of the velocity signal in the bubble shown in figure 6(b) further clarifies the picture. The figure shows the space–time diagram of the magnitude of the Fourier component corresponding to the fundamental spanwise wavenumber ( $k_z = 1$) of the vertical velocity close to the reattachment point of the LSB, a choice motivated by the fact that the flow at the considered location is essentially spanwise independent prior to the growth of the instability, and the fundamental wavenumber component is dominant in the corresponding mode throughout the considered time interval (see figure 7b). The plots for other wavenumbers are qualitatively similar. The data initially show downstream propagation of disturbances modulated by the spanwise rolls, whereas the disturbances are also seen to propagate upstream after $t_{abs}$, which further supports the conclusion that the instability becomes absolute at this point. Figure 7 shows the evolution in time of the magnitude of selected Fourier components of the baseflow velocity. In an effort to remove the modulation by the spanwise rolls, the plotted signals are moving averages over one period of the fundamental vortex shedding. Note that the component corresponding to $k_z = 0$ (dotted line, spanwise average) is dominant in the baseflow at all times, which confirms the overall spanwise invariance of the flow in the LSB. The dip in the data at approximately $t/T_{osc}=3.27$ corresponds to the interval between $t_5$ and $t_6$ when the rear shear layer of the rapidly growing LSB, which exhibits considerable unsteadiness and spanwise modulation, passes through the point of analysis (see figure 6). The spanwise modulation of the baseflow begins slowly with the formation of the LSB, mainly confined to the low wavenumbers that are also visible in the OTD modes. The magnitude of the Fourier components corresponding to the fundamental spanwise wavenumber grows steadily past $t_{abs}$ for all velocity components, with average growth rates consistent with the exponential modal growth rates within the OTD subspace. Indeed, the dominant spanwise structure in the OTD modes is similar within the LSB. Note here that the precise spanwise wavenumber distribution is dictated by the width of the computational domain. The results here suggest that there is a considerable propensity for very long wavelength instabilities (compared to the LSB height) within the separation bubble. Near $t_{abs}$, we observe an acceleration of the growth at higher spanwise wavenumbers, starting from insignificant amplitudes of the order of the pressure tolerance quickly filling up the spectrum. Indeed, within $3\,\%$ of the oscillation period, the highest considered wavenumbers experiencing near-exponential growth that is an order of magnitude faster than that of the fundamental amplify to turbulent saturation during the LSB breakdown.
The exponential growth together with the fact that the fastest growing wavenumber range,  $k_z \in [ 16, 32 ]$, corresponds to wavelengths $\lambda _z \approx 0.8\unicode{x2013}1.6\,\%$ chord, which compares very well with the height of the LSB at this instant (see figure 6a), may suggest that the growth is due to secondary instability of the baseflow in the LSB, which is undergoing in situ modulation due to the onset of absolute instability. The hypothesis of secondary instability is further supported by the fact that the accelerated growth begins shortly after the fundamental spanwise velocity fluctuations of the baseflow reaches amplitudes of $1\,\%$ of the free-stream velocity. For Tollmien–Schlichting-type instabilities that are also present in the LSB, this is a common threshold for the onset on secondary instability (Herbert Reference Herbert1988). Furthermore, the leading OTD mode reflects the gradual change of the dominant instability. At the same point as for the baseflow, figure 7(b) shows the spatial Fourier analysis of the streamwise velocity component of the leading OTD mode over time. The magnitudes of each wavenumber component (colours) are normalised by their sum (dashed line), showing how the mode evolves over time. We observe that the fundamental spanwise wavenumber is dominant throughout, in line with the visualisations in figure 5, and that the leading mode increasingly localises at the rear of the LSB as the simulation progresses, revealed by its increasing amplitude. At approximately $t/T_{osc} = 3.3$, higher wavenumbers up to $k_z \approx 16$ are increasingly represented, while, interestingly, the highest considered wavenumbers appear in the perturbation only after $t/T_{osc} = 3.34$, when they also appear in the baseflow.
The increased spanwise modulation, which changes the baseflow at the location where it becomes absolutely unstable, sets off a cascade of instabilities that accelerates the disturbance growth at higher wavenumbers. These instabilities rapidly lead to the inevitable breakdown of the LSB, and abrupt transition to turbulence.
4.4. Interpretation of the OTD modes on time-dependent baseflows
Classical linear stability analysis is applied to steady nonlinear basic states, which typically require artificial stabilisation. If the baseflow is linearly unstable, then the resulting modes describe the initial spatial structure of perturbations that would appear in the nonlinear simulation if it were left to evolve unimpeded. This situation is fundamentally different from the transient linear stability analysis performed in this study. Here, the basic state is the naturally evolving nonlinear flow, which reacts to instabilities as they appear and develop. As a consequence, in particular in the case of absolute instabilities, their direct impact on the evolving basic state needs to be considered when interpreting the linear stability results. In this context, the instantaneous linear instabilities captured by the OTD modes can be used as predictors of the spatio-temporal evolution of the baseflow. By definition, they describe the development of instabilities from arbitrarily small amplitudes, long before they appear in the nonlinear basic state, where they are often difficult to isolate and analyse.
During the initial stages of the simulation, the boundary layer close to the leading edge is laminar, and its change with time is largely a result of the changing pressure gradient due to the pitching motion. In this regime, the OTD modes describe primary linear instabilities. Early on, the leading OTD mode detects increased instability due to the adverse pressure gradient that subsequently leads to the formation of the LSB (see figure 5b). As the OTD modes localise close to the reattachment point of the newly formed LSB, their structure resembles the convectively growing spanwise rolls that indeed dominate the attached boundary layer flow downstream.
As the LSB increases in size, also the instability within the LSB grows and finally becomes absolutely unstable. Since the disturbances now grow in place without being convected away, they soon pollute the laminar baseflow at the location of the bubble. The instabilities captured by the OTD modes therefore increasingly contain also secondary instabilities of these disturbances, evidenced by the relative increase of the amplitude of higher wavenumbers shown in figure 7(b). This path of instabilities leading up to the breakdown of the LSB is strikingly similar to results of Rodríguez, Gennaro & Souza (Reference Rodríguez, Gennaro and Souza2021), who consider the classical linear stability of a steady LSB. The mixing of primary and secondary instabilities, which makes the interpretation much less straightforward, is exacerbated by the breakdown of the nonlinear rolls within the OTD domain, themselves also linearly unstable. At this point, the baseflow changes rapidly, and the competing mechanisms can no longer be clearly separated.
5. Conclusions
The nonlinear evolution of flow around the ED36F128 natural laminar flow aerofoil subject to small-amplitude pitch oscillations was computed using a well-resolved large-eddy simulation capturing the formation, growth and breakdown of an LSB in the boundary close to the leading edge on the aerofoil suction side. Simultaneously, the instantaneous global linear dynamics of the most unstable part of the tangent space with respect to the resulting time-dependent nonlinear baseflow trajectory was tracked using the OTD framework. A 16-dimensional linear subspace was computed alongside the basic state trajectory using a localised formulation of the OTD framework considering only the flow in the vicinity of the LSB.
The global transient linear stability analysis via the OTD modes complements and expands upon earlier efforts studying the linear instabilities of the evolving LSB using local analysis, which determined that the span-averaged velocity profiles close to the reattachment point of the LSB become absolutely unstable shortly before the bubble breaks down (Negi et al. Reference Negi, Vinuesa, Hanifi, Schlatter and Henningson2018). The global nature of the OTD framework relaxes the assumptions on spatial homogeneity needed for local analysis, in particular during the breakdown, and allows the spatial structure of the instabilities to be tracked more accurately.
At the instant at which Negi et al. (Reference Negi, Vinuesa, Hanifi, Schlatter and Henningson2018) predicts the onset of absolute instability, the leading OTD mode at the rear of the LSB is likely the global counterpart of the absolutely unstable local mode. This conclusion is based on similarities in the wavelengths as well as the good agreement between the corresponding linear growth rate of the OTD mode and the actual growth of velocity disturbances in the fundamental spanwise wavenumber in the basic state. The prediction of absolute instability is further supported by the fact that disturbances are seen to propagate upstream from the pocket of instability. The in situ growth of disturbances in the LSB quickly generates the necessary conditions for secondary instability of the baseflow. The rapid growth of higher disturbance harmonics that they entail within the separation bubble is hypothesised to be the catalyst for the rapid breakdown of the LSB shortly after the onset of absolute instability.
The present study shows how the transient linear stability analysis using the OTD subspace reveals valuable information about the precursor instabilities in space and time that subsequently bring about changes in the nonlinear baseflow. The leading modes identify both the imminent formation of the LSB and the spanwise rolls that grow in the boundary layer. Also, the spanwise inhomogeneity of the LSB is predicted early on by the OTD modes, which also reflect the rapid appearance of higher spanwise harmonics once the LSB is absolutely unstable. The OTD framework allows the linear instabilities to be traced back to their origins so that the emergence of complicated flow structures can be explained, which is often impossible using only the nonlinear basic state.
Supplementary movie
A supplementary movie is available at https://doi.org/10.1017/jfm.2024.407.
Funding
Financial support for this work was provided by the European Research Council under grant agreement 694452-TRANSEP-ERC-2015-AdG. The computations were performed on resources by the Swedish National Infrastructure for Computing at the PDC Center for High Performance Computing at the Royal Institute of Technology as well as the National Supercomputer Centre at Linköping University.
Declaration of interests
The authors report no conflict of interest.


 Open access

