

Introduction
Saxicolous ‘lecideoid’ lichens (Hertel Reference Hertel1984) are genera and species usually described originally under the generic name Lecidea sensu Zahlbruckner (Reference Zahlbruckner1925) and comprise crustose species with apothecia lacking a thalline margin and with non-sepate ascospores. As such they are a heterogenous, non-monophyletic group and, although some do belong to the genus Lecidea s. str. (Lecideaceae Chevall.), most belong to other genera and/or families, such as Porpidia Körb, Poeltidea Hertel & Hafellner and Cyclohymenia McCune & M. J. Curtis (Lecideaceae), Carbonea (Hertel) Hertel and Lecidella Körb. (Lecanoraceae Körb.). In addition to their morphological similarities, lecideoid lichenized fungi are strongly associated with green microalgal photobionts of the cosmopolitan class Trebouxiophyceae (Hertel Reference Hertel1984, Reference Hertel2007; Buschbom & Mueller Reference Buschbom and Mueller2004; Schmull et al. Reference Schmull, Miadlikowska, Pelzer, Stocker-Wörgötter, Hofstetter, Fraker, Hodkinson, Reeb, Kukwa and Lumbsch2011; Ruprecht et al. Reference Ruprecht, Brunauer and Printzen2012a, Reference Ruprecht, Søchting and Türk2016; Fryday & Hertel Reference Fryday and Hertel2014; Zhao et al. Reference Zhao, Zhang, Zhao, Wang, Leavitt and Lumbsch2015).
The family Porpidiaceae was erected by Hertel & Hafellner (Hafellner Reference Hafellner1984) to accommodate the genus Porpidia along with other genera formerly included in the Lecideaceae that had a Porpidia-type ascus structure. However, Buschbom & Mueller (Reference Buschbom and Mueller2004) showed that Lecidea was phylogenetically nested within the Porpidiaceae and so the latter family was included in the synonymy of the Lecideaceae (Lecideales) by Lumbsch & Huhndorf (Reference Lumbsch and Huhndorf2010), and this is still the case in the current issue of Outline of Ascomycota: 2017 (Wijayawardene et al. Reference Wijayawardene, Hyde, Lumbsch, Liu, Maharachchikumbura, Ekanayaka, Tian and Phookamsak2018). The genera Lecidea s. str. (Hertel Reference Hertel1984), Porpidia and Poeltidea as well as Cyclohymenia and Farnoldia Hertel are all assigned to this family, although Farnoldia appears to occupy a peripheral position. The other genus investigated here, Lecidella was also originally included in the Lecideaceae but the species of this genus have an ascus structure very similar to the Lecanora-type and so the genus was included in the Lecanoraceae by Hafellner (Reference Hafellner1984), which is still its current position (Wijayawardene et al. Reference Wijayawardene, Hyde, Lumbsch, Liu, Maharachchikumbura, Ekanayaka, Tian and Phookamsak2018).
The inconspicuous morphology of ‘lecideoid’ lichens complicates their systematic treatment. Large taxonomic groups are often distinguishable by just a small number of microscopic traits, such as spore size and septation or ascus-type, but species-level identification can be difficult, often relying on subtle characters such as excipulum pigmentation and structure or the secondary metabolites produced. The fundamental taxonomic work on lecideoid lichens (Hafellner Reference Hafellner1984; Hertel Reference Hertel1984; Gowan Reference Gowan1989; Knoph & Leuckert Reference Knoph and Leuckert1994; Inoue Reference Inoue1995; Castello Reference Castello2003; Knoph et al. Reference Knoph, Rambold, Triebel, Kainz and Nash2004; Fryday Reference Fryday2005; Fryday & Hertel Reference Fryday and Hertel2014) has mostly used morphological and chemical characters, but lacks molecular genetic data. Extensive collections, especially from the Southern Hemisphere, are very often older than 50 years which precludes the use of molecular methods because of the common problem of DNA degradation in mycobiont specimens older than 20 years. During the last decade, molecular re-evaluations have helped to redefine the species concepts behind these diverse groups but were mostly focused on the Northern Hemisphere (Buschbom & Mueller Reference Buschbom and Mueller2004; Schmull et al. Reference Schmull, Miadlikowska, Pelzer, Stocker-Wörgötter, Hofstetter, Fraker, Hodkinson, Reeb, Kukwa and Lumbsch2011; Orange Reference Orange2014; Zhao et al. Reference Zhao, Zhang, Zhao, Wang, Leavitt and Lumbsch2015, Reference Zhao, Zhang, Miao and Zhao2016; McCune et al. Reference McCune, Curtis and Di2017) and Antarctica (Ruprecht et al. Reference Ruprecht, Lumbsch, Brunauer, Green and Türk2010, Reference Ruprecht, Lumbsch, Brunauer, Green and Türk2012b). However, Hale et al. (Reference Hale, Fisher, Keuler, Smith and Leavitt2019) recently demonstrated a biogeographical connection between the Lecidea species of western North America and the southern polar regions, helping to provide a better understanding of distribution and speciation patterns in this group. Nevertheless, intermediate latitudes in the Southern Hemisphere remain understudied and recently published results (Ruprecht et al. Reference Ruprecht, Søchting and Türk2016) have emphasized the extent of the knowledge gap in southern South American lecideoid lichens, not only from the mycobiont perspective but also from that of the associated green microalgae.
The use of DNA sequence data and phylogenetic methods has revealed that cosmopolitan genera often show locally differentiated subgroups or cryptic species, which can be influenced by ecological factors and may be restricted to isolated areas (Walser et al. Reference Walser, Holderegger, Gugerli, Hoebee and Scheidegger2005; Leavitt et al. Reference Leavitt, Fankhauser, Leavitt, Porter, Johnson and St Clair2011; Lumbsch & Leavitt Reference Lumbsch and Leavitt2011; Branco et al. Reference Branco, Gladieux, Ellison, Kuo, LaButti, Lipzen, Grigoriev, Liao, Vilgalys and Peay2015; Kraichak et al. Reference Kraichak, Lücking, Aptroot, Beck, Dornes, John, Lendemer, Nelsen, Neuwirth and Nutakki2015). Lichens, as well as non-lichenized fungi, with an arctic-alpine distribution in the Northern Hemisphere are, however, a notable exception to this pattern, often comprising relatively homogenous genetic entities, mostly at the species level, with widespread distributions. A number of studies, such as those on Porpidia flavicunda (Ach.) Gowan (Buschbom Reference Buschbom2007), Flavocetraria cucullata (Bellardi) Kärnefelt & A. Thell and F. nivalis (L.) Kärnefelt & A. Thell (Geml et al. Reference Geml, Kauff, Brochmann and Taylor2010) as well as for several different types of fungi (Geml Reference Geml and Fontaneto2011), indicate continuing intercontinental gene-flow in species that are present in both the Northern and Southern Hemispheres. However, trans-equatorial dispersal is also shown for other, similar lineages, such as the lichenized fungal genus Lichenomphalia Redhead et al. (Geml et al. Reference Geml, Kauff, Brochmann, Lutzoni, Laursen, Redhead and Taylor2012) or the species Cetraria aculeata (Schreb.) Fr. (Fernández-Mendoza & Printzen Reference Fernández-Mendoza and Printzen2013). For the algal partners, although the distribution of green-algal photobionts of the genus Trebouxia Puymaly extends across broad intercontinental regions, especially in the Northern Hemisphere (Leavitt et al. Reference Leavitt, Kraichak, Nelsen, Altermann, Divakar, Alors, Esslinger, Crespo and Lumbsch2015), a pattern of trans-equatorial dispersal with low diversification is common (Muggia et al. Reference Muggia, Zellnig, Rabensteiner and Grube2010; Ruprecht et al. Reference Ruprecht, Brunauer and Printzen2012a), with one exception in the most extreme areas of continental Antarctica (Ruprecht et al. Reference Ruprecht, Brunauer and Printzen2012a). However, for the mycobionts, strong diversification and endemism in the Southern Hemisphere is expected based on morphology, resulting in the development of several distinct species and genera, such as Lecidea aurantia Fryday, L. cambellensis Fryday (Fryday & Hertel Reference Fryday and Hertel2014) or L. cancriformis C. W. Dodge & G. E. Baker (Castello Reference Castello2003), Poeltidea (Hertel Reference Hertel1984), Gondwania Søchting et al., Shackletonia Søchting et al. (Arup et al. Reference Arup, Søchting and Frödén2013) and Protousnea (Motyka) Krog. (Calvelo et al. Reference Calvelo, Stocker-Wörgötter, Liberatore and Elix2005).
The most probable scenarios for disjunct distributions are that they can be caused 1) by vicariance and mid-distance dispersal, as shown in the genus Chroodiscus (Lücking et al. Reference Lücking, Papong, Thammathaworn and Boonpragob2008) through the vicinity and interconnection of continental shelves, or 2) by transition from the Arctic to Patagonia in the Pleistocene, resulting in cryptic specialization, as shown in the bipolar lichen Cetraria aculeata (Fernández-Mendoza & Printzen Reference Fernández-Mendoza and Printzen2013), or 3) by glacial refugia during the last ice ages at the southern end of South America (Paula & Leonardo Reference Paula and Leonardo2006). A good example of this last scenario is the highly differentiated and endemic lichen species Porpidia navarina U. Rupr. & Türk, which is known only from one of the southernmost islands (Isla Navarino) that was ice free during the Last Glacial Maximum (Douglass et al. Reference Douglass, Singer, Kaplan, Ackert, Mickelson and Caffee2005; Ruprecht et al. Reference Ruprecht, Søchting and Türk2016). Additionally, evolutionary processes such as adaptation and subsequent specialization to the harsh climate conditions in Antarctic cold deserts (Ruprecht et al. Reference Ruprecht, Lumbsch, Brunauer, Green and Türk2010, Reference Ruprecht, Lumbsch, Brunauer, Green and Türk2012b; Schroeter et al. Reference Schroeter, Green, Pannewitz, Schlensog and Sancho2011) can also lead to high local differentiation in global species and endemism in the southern polar regions.
Lichens are ideal model-systems to test these hypotheses because several genera and species are globally distributed and form locally differentiated subgroups (Fernández-Mendoza et al. Reference Fernández-Mendoza, Domaschke, García, Jordan, Martín and Printzen2011). Additionally, at least double the information is available compared to other organisms because lichens consist of a symbiotic relationship between two or more independently distributed partners. This main symbiotic relationship is formed by a fungus (mycobiont) and green algae and/or cyanobacteria (photobiont). Furthermore, a diverse community of associated bacteria (Grube et al. Reference Grube, Cernava, Soh, Fuchs, Aschenbrenner, Lassek, Wegner, Becher, Riedel and Sensen2015; Aschenbrenner et al. Reference Aschenbrenner, Cernava, Berg and Grube2016), algae (Peksa & Škaloud Reference Peksa and Škaloud2011; Ruprecht et al. Reference Ruprecht, Brunauer and Türk2014; Moya et al. Reference Moya, Molins, Martinez-Alberola, Muggia and Barreno2017), endolichenic or lichenicolous fungi and basidiomycete yeasts (Lawrey & Diederich Reference Lawrey and Diederich2003; Arnold et al. Reference Arnold, Miadlikowska, Higgins, Sarvate, Gugger, Way, Hofstetter, Kauff and Lutzoni2009; Spribille et al. Reference Spribille, Tuovinen, Resl, Vanderpool, Wolinski, Aime, Schneider, Stabentheiner, Toome-Heller and Thor2016) are part of the lichen thallus.
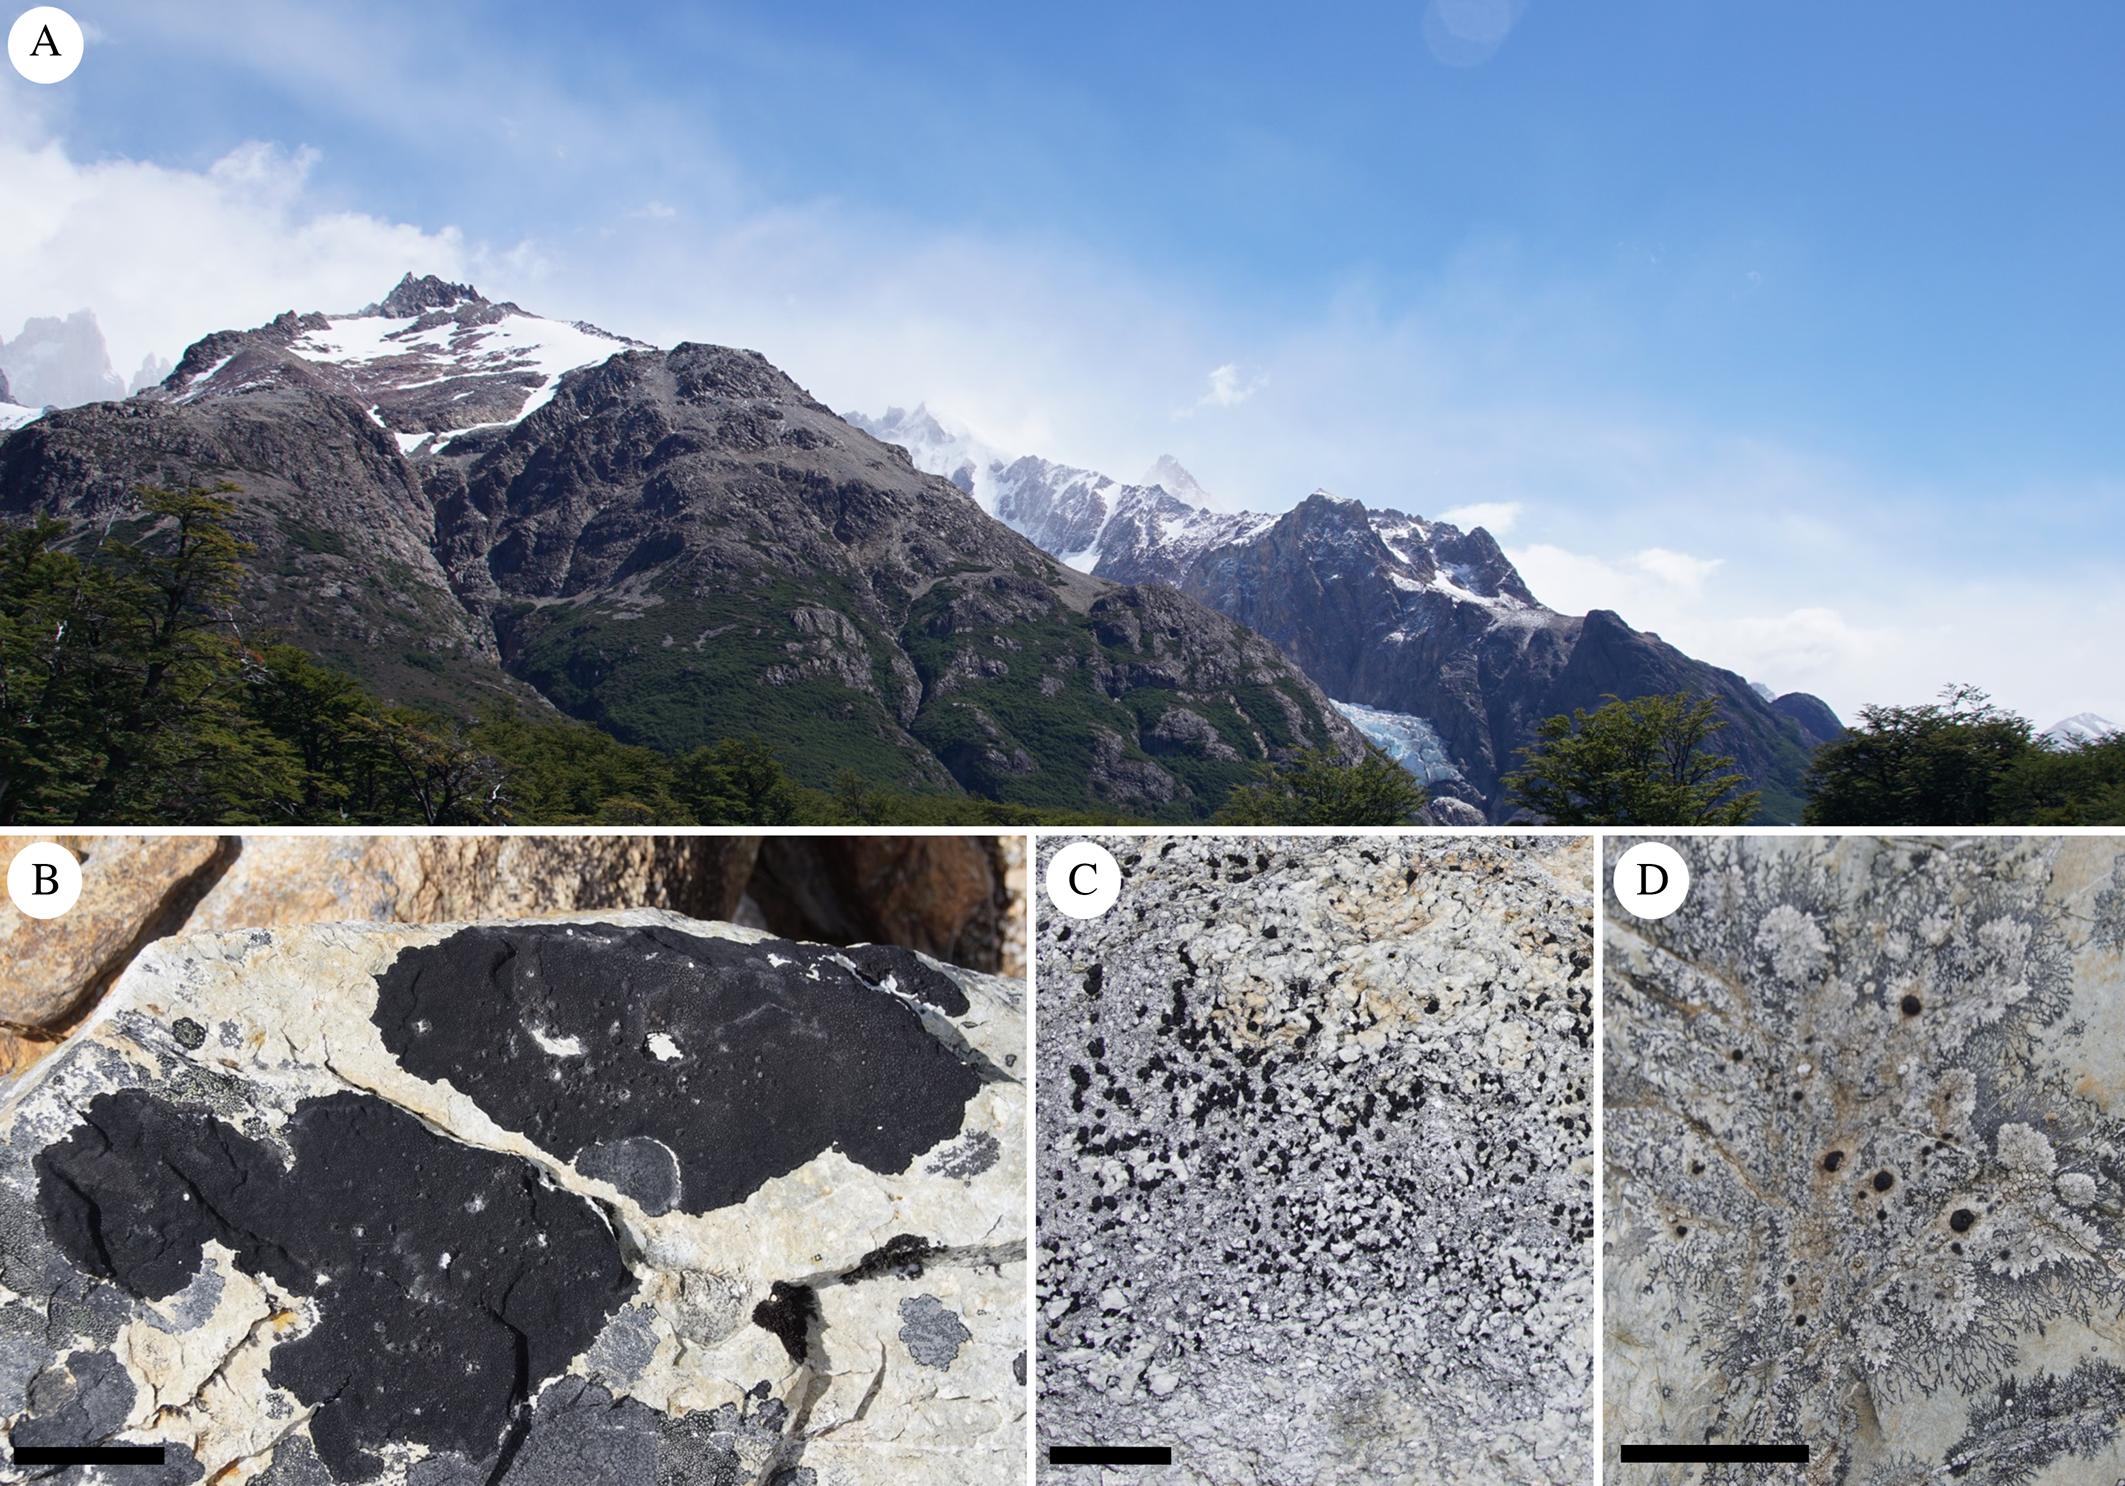
This study focuses on the geographically isolated, tapering southern end of the South American continent (southern Patagonia, including the islands around Tierra del Fuego and Cape Horn). Due to climatic conditions equivalent to Maritime Antarctica, the southern subpolar region (or subantarctic subregion, which is characterized by an absence of arboreal vegetation and is located between the Antarctic Divergence and Subtropical Convergence: Morrone Reference Morrone2000; Brummitt Reference Brummitt2001) is included as part of the Antarctic floral kingdom (Takhtajan & Cronquist Reference Takhtajan and Cronquist1986). The subantarctic subregion extends northwards through the continent at increasing elevations along the mountain ranges of the southern Andes (Morrone Reference Morrone2000). To the south, Maritime Antarctica is the closest landmass, separated by c. 900 km of ocean and the Antarctic Circumpolar Current (Allison et al. Reference Allison, Johnson, Marshall and Munday2010; McCave et al. Reference McCave, Crowhurst, Kuhn, Hillenbrand and Meredith2014). These areas are colonized by specialized cold-adapted organisms, which often act as pioneer vegetation (Hertel Reference Hertel1984; Caccianiga & Andreis Reference Caccianiga and Andreis2004; Bilovitz et al. Reference Bilovitz, Nascimbene and Mayrhofer2015). Among other organisms, the globally distributed saxicolous lecideoid lichens are one of the most frequent components of the biota, forming diverse communities on rocks and boulders, mainly in treeless areas above a temperate rainforest (Fig. 1; Hertel Reference Hertel2007; Goffinet et al. Reference Goffinet, Rozzi, Lewis, Buck and Massardo2012; Ruprecht et al. Reference Ruprecht, Søchting and Türk2016).
A, classical subantarctic subregion above tree level: Parque Nacional Los Glaciares, Argentina. B, saxicolous crustose lichens on siliceous rock, Lecidea auriculata, L. kalbii, Poeltidea perusta, Rhizocarpon geographicum. C, Lecidea lapicida. D, Poeltidea sp. 1. Scales: B = 10 cm; C & D = 10 mm. In colour online.
In the current study, we wish to explore the genetic diversity of the two dominant symbionts (myco- and photobiont), along with their distribution and diversification along a latitudinal gradient in southern South America. These were newly estimated with three marker datasets for each symbiont, based on both tree-based and non-tree based clustering methods, including distance-based clustering, model-based phylogenies and coalescent analyses. To accomplish this, both symbionts of saxicolous lecideoid lichen specimens from southern South America were placed in a global context using sequence information from the first author's project framework, from collaborating partners and from international databases (e.g. GenBank). Additionally, newly generated sequences of species that had previously only been described morphologically were included, as well as sequences of uncertain position in the genera Lecidea s. str. (Hertel Reference Hertel1984), Porpidia, Poeltidea, Lecidella (mycobiont) and Asterochloris Tschermak-Woess and Trebouxia (photobiont).
Material and Methods
Collecting sites and material
One hundred and eighty-five saxicolous lecideoid lichen samples were collected in southern South America along a latitudinal gradient following the subantarctic climatic subregion by increasing elevation from south (Cerro Bandera, Isla Navarino, Chile, 55°S, 620 m a.s.l.) to north (Cerro Catedral, Bariloche, Argentina, 41°S, 2100 m a.s.l.) and including some areas at a lower elevation in southern Chile.
The specimens were collected from siliceous rock in areas above the tree line that were dominated by subantarctic climatic conditions with an annual mean temperature (BIO1) of 0 to 7.8 °C and an annual precipitation (BIO12) of 320 to 1640 mm (Karger et al. Reference Karger, Conrad, Bohner, Kawohl, Kreft, Soria-Auza, Zimmermann, Linder and Kessler2017; Fig. 2, Supplementary Material Files S1-1 & S1-2a, available online).
World map showing the locations of the included accessions obtained from GenBank and from our own database. Pink circles show the collection points of the mycobiont and green circles of the photobiont accessions. The enlarged map (inset) shows the sampling sites from this study in southern South America.

All our specimens collected from southern South America (sSA) are deposited in the Herbarium of the University of Salzburg (SZU).
DNA amplification and sequencing
Total DNA was extracted from individual thalli using the DNeasy Plant Mini Kit (Qiagen) according to the manufacturer's instructions. The lichen material was scraped off with a sterilized scalpel from the centre of the thallus and included apothecia. The PCR mix contained 0.5 units of GoTaq DNA polymerase, 0.2 nM of each of the four dNTPs, 0.3 μM of each primer and c. 1 ng genomic DNA.
For each symbiont, three markers were amplified and sequenced with the primers presented in Supplementary Material File S1-3, with conditions as described in Ruprecht et al. (Reference Ruprecht, Brunauer and Türk2014) and Ruprecht et al. (Reference Ruprecht, Søchting and Türk2016). Unpurified PCR products were sent to Eurofins Genomics/Germany for sequencing.
Mycobiont
The internal transcribed spacer region of the nuclear ribosomal DNA (ITS) was amplified for all specimens. Furthermore, the mitochondrial small subunit (mtSSU) and the large subunit of DNA-dependent RNA polymerase 2 (RPB1) were amplified for the Lecidea/Porpidia/Poeltidea group (see Supplementary Material File S1-3).
Photobiont
To obtain a first overview of the different taxa at species and/or genus level of the associated green microalgae available to the mycobiont, a broad screening along the internal transcribed spacer region of the nuclear ribosomal DNA (ITS) was performed using the different primer pairs ITS1T and ITS4T (Kroken & Taylor Reference Kroken and Taylor2000), ITS-sense-A and ITS-antisense-A (Ruprecht et al. Reference Ruprecht, Brunauer and Türk2014) and NS7m and LR1850 (Bhattacharya et al. Reference Bhattacharya, Friedl and Damberger1996) as described in Ruprecht et al. (Reference Ruprecht, Søchting and Türk2016). Also, for Trebouxia a chloroplast marker, a variable protein-coding gene including an intergenic spacer region (psbJ-L), and a fragment of the mitochondrial cytochrome oxidase subunit 2 gene (COX2) were chosen (Supplementary Material File S1-3). Additionally, all three markers were sequenced from four Trebouxia cultures (2 × S02/Antarctica, A02/Antarctica and A12/Sweden; Supplementary Material File S1-2d) provided by S. Ott (Düsseldorf), to calibrate the concatenated dataset.
Phylogenetic analyses
Sequences were assembled and edited using Geneious Pro 6.1.8 (www.geneious.com), and aligned with MAFFT v7.017 (Katoh et al. Reference Katoh, Misawa, Kuma and Miyata2002) using pre-set settings (algorithm, auto select; scoring matrix, 200PAM/k = 2; gap open penalty, 1.34–0.123).
Maximum likelihood analyses (ML) were performed using the IQ-TREE web server (Trifinopoulos et al. Reference Trifinopoulos, Nguyen, von Haeseler and Minh2016) with default settings (ultrafast bootstrap analyses, 1000 BT alignments, 1000 max. iterations, min. correlation coefficient: 0.99, SH-aLRT branch test with 1000 replicates) and presented as a consensus tree. The respective evolutionary models were selected with the implemented model finder (Kalyaanamoorthy et al. Reference Kalyaanamoorthy, Minh, Wong, von Haeseler and Jermiin2017) of the program IQ-TREE (Supplementary Material File S1-4).
The Bayesian phylogenies were inferred using the Markov chain Monte Carlo (MCMC) procedure as implemented in the program MrBayes 3.2 (Ronquist & Huelsenbeck Reference Ronquist and Huelsenbeck2003). The analysis was performed assuming the general time reversible model of nucleotide substitution including estimation of invariant sites and a discrete gamma distribution with six rate categories (GTR + I + Γ; Rodriguez et al. Reference Rodriguez, Oliver, Marin and Medina1990). Two runs with 5 million generations, each starting with a random tree and employing four simultaneous chains, were executed. Every 1000th tree was saved into a file. Subsequently, the first 25% of trees was deleted as the ‘burn-in’ of the chain. A consensus topology with posterior probabilities for each clade was calculated from the remaining 3751 trees. The phylogenies of the mycobiont of the Lecidea/Porpidia/Poeltidea group were rooted with Farnoldia jurana subsp. jurana (Schaer.) Hertel, and for Lecidella with species of the closely related genera Lecanora Ach., Rhizoplaca Zopf and Carbonea; the algal phylogenies were midpoint rooted. All phylogenies were visualized with the program Figtree v1.4.3 (Rambaut Reference Rambaut2014).
OTU- and cluster delimitation
For each phylogenetically coherent group (Lecidea/Porpidia/Poeltidea, Lecidella, Asterochloris and Trebouxia), the ITS marker was used to generate operational taxonomical units (OTUs) using automatic barcode gap discovery (ABGD; Puillandre et al. Reference Puillandre, Lambert, Brouillet and Achaz2012) to additionally define the well-supported intraspecific (cryptic) subgroups with a distance-based method. The default settings were used, except that ‘X’ (relative gap) = 0.9 and the distance JC69 were chosen. OTUs with a sequence similarity lower than 97.5% were divided into subunits using phylogenetic criteria based on Leavitt et al. (Reference Leavitt, Kraichak, Nelsen, Altermann, Divakar, Alors, Esslinger, Crespo and Lumbsch2015) for Trebouxia (Supplementary Material File S1-5).
An alternative cluster delimitation specifically looking for boundaries between population and species-level processes was implemented by a recursive multi-tree application of the general mixed Yule-coalescent model (bGMYC; Pons et al. Reference Pons, Barraclough, Gomez-Zurita, Cardoso, Duran, Hazell, Kamoun, Sumlin and Vogler2006; Reid & Carstens Reference Reid and Carstens2012; Fujisawa & Barraclough Reference Fujisawa and Barraclough2013) on the ITS phylogeny of Lecidea/Porpidia/Poeltidea to define species-clades and/or species-complexes on a higher scale. For this purpose, substitution model adequacy was estimated using ML reconstructions in IQ-TREE (Minh et al. Reference Minh, Nguyen and von Haeseler2013; Kalyaanamoorthy et al. Reference Kalyaanamoorthy, Minh, Wong, von Haeseler and Jermiin2017), resulting in the selection of a TIM2 transition model with empirical frequencies and a Ratefree (Yang Reference Yang1995; Soubrier et al. Reference Soubrier, Steel, Lee, Sarkissian, Guindon, Ho and Cooper2012) model with 4 relaxed gamma categories. Time explicit phylogenetic reconstructions were carried out in Beast v2.5.1 (Bouckaert et al. Reference Bouckaert, Heled, Kuhnert, Vaughan, Wu, Xie, Suchard, Rambaut and Drummond2014) using a strict clock, the suitability of which was previously assessed in MEGA (Tamura et al. Reference Tamura, Peterson, Peterson, Stecher, Nei and Kumar2011), and a constant size coalescent prior, which is the most conservative tree model in terms of including false positives. A maximum clade credibility tree was calculated in TreeAnnotator (Bouckaert et al. Reference Bouckaert, Heled, Kuhnert, Vaughan, Wu, Xie, Suchard, Rambaut and Drummond2014) using most recent common ancestor (mrca) dates. The bGMYC analyses were carried out as implemented in the homonymous R package. A single GMYC analysis was iteratively run on a subset of 1000 trees chosen randomly from the posterior distribution, using a chain length of 50 000 sampling steps, a burn-in of 40 000 and a thinning parameter of 100. The results of all GMYC analyses are summarized in a matrix of pairwise co-assignment probabilities for each haplotype. To obtain a consensus partition we processed the co-assignment matrix using an arbitrarily chosen co-assignment threshold of 0.5, and a less arbitrary approach making use of k-medoid clustering (Kaufman & Rousseeuw Reference Kaufman and Rousseeuw1990) and optimum average silhouette width as validation criterion to estimate the optimum number of clusters (Ortiz-Alvarez et al. Reference Ortiz-Alvarez, de los Rios, Fernández-Mendoza, Torralba-Burrial and Pérez-Ortega2015). For the latter we used the function pamk as implemented in the R package ‘fpc’ (Henning Reference Henning2014) on the co-assignment matrix converted into its dissimilarity correlate. Clustering validation was carried out using the function clValid from the homonymous R package (Brock et al. Reference Brock, Datta, Pihur and Datta2008); the discrepancy between stability metrics highlights the discrepancy between the number of clusters and the number of sequences per cluster.
Results
Phylogenetic analyses, OTU and cluster delimitation
Four overall phylogenies for the saxicolous genera Lecidea/Porpidia/Poeltidea (Lecideaceae), Lecidella (Lecanoraceae), Asterochloris and Trebouxia (Trebouxiophyceae) were estimated using the ITS marker (Figs 3–6, Supplementary Material Files S2-1a & b, available online). Additionally, two multi-marker trees for Lecidea/Porpidia/Poeltidea (ITS/mtSSU/RPB1; Supplementary Material File S2-2) and Trebouxia (ITS/psbJ-L/COX2; Supplementary Material File S2-3) were also estimated.
Collapsed phylogeny on OTU-level including all available relevant taxonomically identified sequences of the genera Lecidea, Porpidia, Poeltidea and Cyclohymenia using the marker ITS. Voucher information included in the OTUs is provided in Supplementary Material File S2-1a and the complete tree is shown in S2-1b (available online). Further information is also available in Supplementary Material Files S1-2a & S1-2c. Alphanumeric codes represent OTUs and numbers in brackets indicate the number of sequences comprising that OTU (see also Supplementary Material File S1-5). The biogeographic distribution (NH, Northern Hemisphere; C, cosmopolitan; sSA, southern South America; Ant, Antarctica) has been added beside the OTUs. New sequences of specimens from sSA are in bold italics and those from other parts of the world are in bold. The vertical bars beside the phylogeny show the affiliation to clusters and genera. The bootstrap values with ≥ 95 support of ML analyses were directly mapped on the Bayesian tree with ≥ 0.90 (grey) and ≥ 0.95 (black) support posterior probability values (branches in bold). In colour online.

Phylogeny of the genus Lecidella with accessions from sSA (see Supplementary Material File S1-2a, available online) integrated in the species concept and most of the published accessions (Zhao et al. Reference Zhao, Zhang, Zhao, Wang, Leavitt and Lumbsch2015; see also Supplementary Material File S1-2c) using the marker ITS. OTU numbers precede voucher numbers and the published species names from GenBank, as well as the biogeographic distribution information, for each OTU is included (NH, Northern Hemisphere; C, cosmopolitan; sSA, southern South America; Ant, Antarctica). New sequences of specimens from sSA are in bold italics and those from other parts of the world are in bold. The vertical bars beside the phylogeny show the affiliation to the clades. The bootstrap values with ≥ 95 support of ML analyses were directly mapped on the Bayesian tree with ≥ 0.90 (grey) and ≥ 0.95 (black) support posterior probability values (branches in bold). In colour online.

Phylogeny of the genus Asterochloris including all available relevant taxonomically identified sequences using the marker ITS (see Supplementary Material Files S1-2a & S1-2c, available online). OTU numbers precede voucher numbers and the published species names from GenBank as well as the biogeographic distribution information for each OTU is included (NH, Northern Hemisphere; C, cosmopolitan; sSA, southern South America; Ant, Antarctica). New sequences of specimens from sSA are marked in bold italics. The vertical bars beside the phylogeny show the affiliation to the genera. The bootstrap values with ≥ 95 support of ML analyses were directly mapped on the Bayesian tree with ≥ 0.90 (grey) and ≥ 0.95 (black) support posterior probability values (branches in bold). In colour online.

Phylogeny of the genus Trebouxia with accessions from sSA integrated into the species concept and most of the published accessions of Leavitt et al. (Reference Leavitt, Kraichak, Nelsen, Altermann, Divakar, Alors, Esslinger, Crespo and Lumbsch2015) using the marker ITS (see Supplementary Material Files S1-2b & S1-2d, available online). OTU numbers precede voucher numbers and the published species names from GenBank as well as the biogeographic distribution information for each OTU is included (NH, Northern Hemisphere; C, cosmopolitan; sSA, southern South America; Ant, Antarctica). New sequences of specimens from sSA are in bold italics and those from other parts of the world are in bold. The vertical bars beside the phylogeny show the affiliation to the clades. The bootstrap values with ≥ 95 support of ML analyses were directly mapped on the Bayesian tree with ≥ 0.90 (grey) and ≥ 0.95 (black) support posterior probability values (branches in bold). In colour online.

In all cases the ML analyses (IQ-TREE web server; Trifinopoulos et al. Reference Trifinopoulos, Nguyen, von Haeseler and Minh2016) of the six phylogenies recovered the same tree topology as the MrBayes analysis (Ronquist & Huelsenbeck Reference Ronquist and Huelsenbeck2003). Therefore, we present here only the Bayesian tree with support values of the ML analyses.
For the multi-marker trees, no conflict was found with the single marker trees, thus they are not shown.
OTUs with a sequence similarity lower than 97.5% were divided into subunits using phylogenetic criteria based on Leavitt et al. (Reference Leavitt, Kraichak, Nelsen, Altermann, Divakar, Alors, Esslinger, Crespo and Lumbsch2015) for Trebouxia. This concept was used as analogous to an appropriate delimitation method for cryptic (molecular) diversification on a molecular basis to show the biogeographical distribution of the OTUs (Tables 1–3). These parameters were used for all four overall phylogenies based on the ITS marker. The sequence similarity values of the OTUs with at least three accessions are summarized in Supplementary Material File S1-5. The biogeographical distribution of the locally differentiated OTUs was added beside the OTU, voucher and species information in the figures.
Geographical distributions of selected mycobiont species and OTUs, arranged in groups according to shared distributions at different levels of clustering. Subtotals of numbers of species, specimens (n) and OTUs according to shared distributions are presented, with the total given below. Species and OTUs with different distributions (globally/sSA) are marked in bold. Accessions occurring in Antarctica and sSA are summarized as southern polar. * = species that were found in two different categories and were included only once in the total sum. See Supplementary Material File S1-2a (available online) for further information on the listed specimens.

Geographical distributions of selected photobiont species and OTUs, arranged in groups according to shared distributions at different levels of clustering. Subtotals of numbers of specimens (n) and OTUs according to shared distributions are presented, with the total given below. See Supplementary Material File S1-2a (available online) for further information on the listed specimens.

Summary of sampling sites in southern South America (sSA) with latitude, altitude, climate variables BIO 1 (annual mean temperature) and BIO 12 (annual precipitation) using CHELSA (Karger et al. Reference Karger, Conrad, Bohner, Kawohl, Kreft, Soria-Auza, Zimmermann, Linder and Kessler2017), and a comparison of proportions of locally differentiated OTUs and/or endemic mycobiont and photobiont species. AR = Argentina, CL = Chile.

Assignment of unknown accessions to mycobiont species was also based on morphological data, but these data are not included here. Extending the analyses to include morphological characters would increase their complexity and result in an unacceptable decrease in clarity, while also resulting in either the molecular or morphological datasets, or more probably both, not receiving the full treatment they deserve. Therefore, the analysis of the morphological data, along with the taxonomic consequences resulting from the analyses of both datasets, will be dealt with in a separate publication.
Lecidea/Porpidia/Poeltidea–ITS
(Fig. 3, Supplementary Material Files S2-1a & b). This molecular phylogeny includes all relevant taxonomically identified sequences of the genera Lecidea, Porpidia, Poeltidea and Cyclohymenia provided by the project framework of the first author or downloaded from the NCBI database (GenBank) to place the newly generated sequences of this study into a global context. Redundant sequences in terms of characters and distribution were not included. The final data matrix for the phylogeny comprised 204 single nrITS sequences with a length of 598 characters and includes sequences of specimens of the genera Lecidea (157) Porpidia (42), Poeltidea (3) and Cyclohymenia (2); it was rooted with Farnoldia jurana subsp. jurana as outgroup. Figure 3 displays the collapsed tree at OTU level, the voucher information included in the OTUs is provided in Supplementary Material File S2-1a and the complete tree is shown in S2-1b. The phylogenetically delimited groups revealed were assigned to OTU-, species-, cluster- and genus level.
All three analyses (distance-based, model-based and bGMYC) showed similar topologies, but at different levels. The groups gained with a distance approach (OTUs) were used to show intraspecific and/or cryptic speciation; model-based approaches were used for the assignment at species level; clusters based on bGMYC were used for grouping closely related species or dividing highly heterogeneous species.
Altogether, 121 OTUs (87 Lecidea, 30 Porpidia, 1 Cyclohymenia, 3 Poeltidea) were classified. These OTUs were assigned to species-groups (25 Lecidea, 18 Porpidia, 1 Cyclohymenia, 2 Poeltidea) and clusters (19 Lecidea, 8 Porpidia, 1 Cyclohymenia, 3 Poeltidea).
The backbone of this phylogeny is not supported but at least four main groups can be recognized (Fig. 3). The first group, with low support, is formed solely by species of the genus Lecidea s. str. However, it can be considered a consistent group because it is strongly supported by the three-marker phylogeny (Supplementary Material File S2-2). The Southern Hemisphere lineage (Porpidia navarina) is situated outside the Lecidea group and next to the second group, which is an intermixed group of Lecidea and Porpidia species including two well-supported accessions of the genus Cyclohymenia. The third group is formed solely by species of the genus Porpidia and the fourth by the Southern Hemisphere genus Poeltidea.
The Lecidea group forms 17 clusters. The well-supported, heterogeneous and cosmopolitan species cluster L01 is formed by the L. atrobrunnea (Ramond ex Lam. DC.) Schaer. clade with one southern polar OTU (Lcd05) and a well-supported sister group containing Lecidea sp. 1 (Lcd09a, b; endemic to sSA), L. promiscens Nyl. (cosmopolitan) including three sSA OTUs (Lcd10-12), and L. swartzioidea Nyl. (Northern Hemisphere). Cluster L02 includes L. confluens (Weber) Ach. and an accession from GenBank (Porpidia speirea (Ach.) Kremp; Schmull et al. Reference Schmull, Miadlikowska, Pelzer, Stocker-Wörgötter, Hofstetter, Fraker, Hodkinson, Reeb, Kukwa and Lumbsch2011). The placement of this latter accession in the Lecidea s. str. group could be caused by an incorrect species assignment (Lecidea confluens and P. speirea are morphologically quite similar and mainly distinguished by the ascus-type). This assumption is supported by two accessions of P. speirea from China that are included in the phylogeny and are part of cluster P03. This agrees with the findings of Buschbom & Mueller (Reference Buschbom and Mueller2004), who described this species as closely related to P. tuberculosa (Sm.) Hertel & Knoph, which was confirmed in this phylogeny.
Cluster L03 (Lecidea sp. 2) forms a highly supported and very homogenous clade, comprising specimens from Antarctica, the Arctic and sSA, and is formed by a single cosmopolitan OTU (Lcd18).
Cluster L04 is formed by the cosmopolitan L. andersonii Filson complex and Lecidea sp. 3 clade related to L. laboriosa Müll. Arg. (Northern Hemisphere), a Californian specimen of Lecidea violascens H. Magn. and an undetermined specimen from the Austrian Alps (Lecidea sp. UR00280, Lcd34). The first group contains distinct OTUs of Antarctic, North American and Chinese species of L. polypycnidophora U. Rupr. & Türk, the cosmopolitan L. andersonii, the Antarctic Lecidea sp. UCR1 and two not assignable accessions from North America. The second group (Lecidea sp. 3 clade) is formed solely of species from southern South and North America, including OTUs (Lcd27-32) containing specimens from both areas.
Several well-distinguished species form strongly supported clusters, such as the variable accessions from the Northern Hemisphere and maritime Antarctica of the L. silacea Ach. clade together with an unidentified specimen from sSA (Lecidea sp. UR00130, Lcd 40, cluster L05) and L. fuscoatrina Hertel & Leuckert (cluster L06), followed by L. plana (J. Lahm) Nyl. (Northern Hemisphere; cluster L07), L. lithophila (Ach.) Ach. (Northern Hemisphere, maritime Antarctica; cluster L08), and by the Northern Hemisphere species L. leucothallina Arnold, L. obluridata Nyl. and an unidentified accession (MK990108, Lcd46) from North America (cluster L09).
Two recently described species, Lecidea aptrootii M. Khan et al. (Khan et al. Reference Khan, Khalid and Lumbsch2018) and L. uniformis McCune (McCune et al. Reference McCune, Curtis and Di2017), are molecularly very closely related to the accession of L. fuscoatra (L.) Ach. var. grisella (Flörke) Nyl. (Zhao et al. Reference Zhao, Zhang, Miao and Zhao2016), a taxon which was recognized by Aptroot & Van Herk (Reference Aptroot and Van Herk2007) at the species level as L. grisella. Together with L. fuscoatra, they form the strongly supported cluster L10. This is sister to cluster L11, which includes the Antarctic (OTU Lcd58) and, so far, endemic species L. cancriformis and closely related, but heterogeneous, accessions solely from sSA (Lcd52-60). Another new and endemic species from sSA (Lecidea sp. 4, Lcd61-64) forms cluster L12, and an unidentified specimen (UR00096, Lcd65) forms the highly supported cluster L13.
Cluster L14 is formed by the very common, heterogeneous and cosmopolitan species group L. lapicida (Ach.) Ach. It includes the cosmopolitan L. lapicida var. pantherina (Ach.) Ach. and is sister to the Northern Hemisphere L. lapicida var. lapicida (Ach.) Ach. These subspecies show no morphological differentiation and are separated only by their different chemotypes but, according to Hertel (Reference Hertel1995), they have different ecological requirements. However, cluster L14 contains the two most common OTUs restricted to sSA (Lcd66 and Lcd70), as well as OTUs restricted to Antarctica (Lcd70), the Northern Hemisphere or with an alpine-Antarctic distribution (Lcd67). The now cosmopolitan species L. medusula (C. W. Dodge) Hertel, previously reported only for the Southern Hemisphere (Fryday & Hertel Reference Fryday and Hertel2014), forms cluster L15 with specimens from sSA, the Arctic and the Austrian Alps at the base of this clade. Finally, an Arctic specimen of L. protabacina Nyl. and an unidentified specimen from continental Antarctica (T48883b, Lcd80) form the clusters L16 and L17. The species included in this group are all part of Lecidea s. str. (Hertel Reference Hertel1984).
The second group, which contains species of the genera Lecidea s. str. and Porpidia, is highly supported, with the Southern Hemisphere L. kalbii Hertel (cluster L19) and the newly described species/genus Cyclohymenia epilithica McCune & M. J. Curtis (cluster C01) basal to the group, although with weak support. The cosmopolitan species clade L. auriculata Th. Fr. is divided at OTU level into Northern and Southern Hemisphere accessions (Lcd81a,b-84) and L. tessellata Flörke is formed by a single cosmopolitan OTU (Lcd85, cluster L18). The well-supported, Northern Hemisphere group of Porpidia species includes P. albocaerulescens (Wulfen) Hertel & Knoph, P. degelii (H. Magn.) Lendemer, P. rugosa (Taylor) Coppins & Fryday (cluster P01), P. hydrophila (Fr.) Hertel & A. J. Schwab (cluster P02) and P. flavicunda, P. melinodes (Korb.) Gowan & Ahti, P. speirea and P. tuberculosa (cluster P03). However, species of the genus Porpidia are clearly distinguishable morphologically from species of Lecidea, by their ascus type and additionally by the associated green microalgae of the genus Asterochloris (Wirth et al. Reference Wirth, Hauck and Schultz2013; Ruprecht et al. Reference Ruprecht, Søchting and Türk2016).
The third group is formed by four clusters of Porpidia species and is divided into two well-supported main subgroups. One is formed by cluster P05, which includes the heterogeneous cosmopolitan clade inc. sed. Porpidia sp. 1 together with P. cinereoatra (Ach.) Hertel & Knoph, P. contraponenda (Arnold) Knoph & Hertel, P. musiva (Korb.) Hertel & Knoph, P. irrigua A. Orange and Porpidia sp. (UR00248, Porp17), with P. striata Fryday and P. islandica Fryday et al. forming the highly supported clusters P06 and P07. The other strongly supported subgroup is formed by the heterogeneous and cosmopolitan cluster P08, including P. flavocruenta Fryday & Buschbom, several heterogeneous accessions of P. macrocarpa (DC.) Hertel & A. J. Schwab, and the quite differing accessions from Turkey and China that were identified as P. crustulata (Ach.) Hertel & Knoph.
The genus Poeltidea, which occurs only in the Southern Hemisphere, forms the fourth group and consists of three clusters, POE01 and POE02 (Poeltidea perusta (Nyl.) Hertel & Hafellner clade), and POE03 (Poeltidea sp. 1).
Lecidea/Porpidia/Poeltidea–ITS/mtSSU/RPB1
(Supplementary Material File S2-2). The final data matrix of this phylogeny contains 204 concatenated sequences of the markers ITS, mtSSU and RPB1 with a length of 2115 characters; it includes sequences of specimens of the genera Lecidea, Porpidia and Poeltidea and was rooted with Farnoldia jurana subsp. jurana as outgroup. Specimens from the project framework of the first author (Antarctica, Arctic, Austria) with the same three markers were added.
All available sequences from this study were included to show the abundance of the different specimens in the studied areas of sSA. The phylogenetically delimited groups revealed were assigned to OTU-, species- and genus level.
This multi-marker phylogeny is not fully comparable to the overall single marker (ITS) phylogeny of Lecidea/Porpidia/Poeltidea because of the limited availability of sequences of the chosen markers in GenBank. The topology is, in most cases, similar and it forms the same four groups, but in many cases they show greater support. The Lecidea group, at least, is strongly supported in this phylogeny. Due to the limited availability of Porpidia sequences in GenBank, the topology of this group is slightly different, with P. navarina clustering together with P. cinereoatra and P. macrocarpa, but with low support. Finally, the genus Poeltidea with two species is still at the base of this phylogeny.
The OTUs obtained from the ITS sequences are still very well supported. Many clades clearly show a local differentiation at OTU level and are endemic to sSA. The two largest clades (OTUs Lcd66 and Lcd70) are part of the cosmopolitan L. lapicida cluster and are the most abundant accessions. These are followed by Porpidia navarina and Lecidea sp. 1 (both species endemic to sSA), L. promiscens (cosmopolitan species but with sSA OTUs) and other smaller groups.
Lecidella–ITS
(Fig. 4). To place the new accessions of Lecidella from sSA into a global context, the species concept and most of the published accessions of Zhao et al. (Reference Zhao, Zhang, Zhao, Wang, Leavitt and Lumbsch2015) were used. Additionally, several sequences from GenBank and from the project framework of the first author were added to this dataset. Redundant sequences in terms of characters and distribution were not included. The final data matrix of this phylogeny contains 76 sequences of the marker ITS with a length of 538 characters, and was rooted with species of the genera Carbonea, Lecanora and Rhizoplaca to obtain well-defined units in the genus Lecidella.
The backbone of the phylogeny is unresolved but four strongly supported main clades are formed; three (L. enteroleucella (Nyl.) Hertel, L. stigmatea (Ach.) Hertel & Leuckert and L. elaeochroma (Ach.) Choisy) are the same as those identified by Zhao et al. (Reference Zhao, Zhang, Zhao, Wang, Leavitt and Lumbsch2015), with the fourth clade (Lecidella spp. nov.) containing two species occurring only in Antarctica and sSA. All available sequences for this group were included to show the abundance of the different accessions. The phylogenetically delimited groups revealed were assigned to OTU-, clade- and genus level.
Lecidella enteroleucella is still the only member of the first clade as described by Zhao et al. (Reference Zhao, Zhang, Zhao, Wang, Leavitt and Lumbsch2015).
The second clade (L. stigmatea) is completely unresolved. Lecidella patavina (A. Massal.) Knoph & Leuckert and L. stigmatea are intermixed and not assignable. These two species differ most noticeably in that the hymenium of L. patavina is inspersed with oil droplets, whereas that of L. stigmatea is not. That the accessions of these two species are intermixed perhaps indicates that either only one species is involved or that the defining character has been interpreted inconsistently. Lecidella greenii U. Rupr. & Türk and L. siplei (C. W. Dodge & G. E. Baker) May. Inoue form well-supported lineages and the 12 sequences of the species in this study show a clear local differentiation at OTU level.
A third, new and strongly supported, clade (Lecidella spp. nov.) shows two new species from sSA (Lecidella sp. 1) and continental Antarctica (Lecidella sp. 2).
The fourth clade (L. elaeochroma) shows a small number of separated and well-supported species (L. tumidula (A. Massal.) Knoph & Leuckert, L. meiococca (Nyl.) Leuckert & Hertel, L. wulfenii (Hepp) Korb, L. flavosorediata (Vězda) Hertel & Leuckert and Lecidella sp. 3, which is endemic to sSA). Lecidella elaeochroma, L. euphorea (Flörke) Hertel, L. carpathica Körb., L. elaeochromoides (Nyl.) Knoph & Hertel and L. effugiens (Nilson) Knoph & Hertel are not assignable because of mingling in different highly supported lineages. None of the investigated specimens were morphologically similar to the Southern Hemisphere species Lecidella sublapicida (C. Knight) Hertel (Knoph & Leuckert Reference Knoph and Leuckert1994).
Asterochloris–ITS
(Fig. 5). All the Porpidia species in this study are not only associated with Trebouxia as photobiont, but also with green microalgae of the genus Asterochloris. The accessions obtained from sSA were placed into a global context by adding all relevant taxonomically identified sequences from GenBank and from the project framework of the first author. Redundant sequences in terms of characters and distribution were not included. The final data matrix of this phylogeny contains 73 ITS sequences with a length of 519 characters.
The phylogeny was rooted midpoint and divided into two main clades (genera), Asterochloris and Vulcanochloris Vancurová. The accessions from sSA occur only in the Asterochloris clade. The backbone of this clade is unresolved. Again, all available sequences for this group are included to show the abundance of the different accessions. The phylogenetically delimited groups revealed were assigned to OTU-, clade-, and genus level. The topology of the species from GenBank shows a similar pattern to the phylogeny already described in Ruprecht et al. (Reference Ruprecht, Brunauer and Türk2014).
Only one accession from sSA clusters together with the cosmopolitan species A. woessiae Škaloud & Peksa. A highly supported and homogeneous clade is formed by 19 specimens (OTU Ast24) occurring only on Isla Navarino and one accession from the other side of the Beagle Channel (Tierra del Fuego) in the southernmost part of sSA. Four other accessions (OTUs Ast20–23) are placed in the main group with low support.
Trebouxia–ITS
(Fig. 6). To place the new accessions of Trebouxia from sSA into a global context, the species/OTU concept and the dataset reduced to one accession of each OTU of Leavitt et al. (Reference Leavitt, Kraichak, Nelsen, Altermann, Divakar, Alors, Esslinger, Crespo and Lumbsch2015) was used. Additionally, several new sequences from GenBank and from the project framework of the first author were added to this dataset. Redundant sequences in terms of characters and distribution were not included. The final data matrix of this phylogeny contains 157 ITS sequences with a length of 805 characters and was midpoint-rooted.
The phylogenetically delimited groups revealed were assigned to OTU- and clade level, as described in Leavitt et al. (Reference Leavitt, Kraichak, Nelsen, Altermann, Divakar, Alors, Esslinger, Crespo and Lumbsch2015). The backbone of the phylogeny is unresolved but four strongly supported main clades were formed (A, I, S and G) that correspond to those of Leavitt et al. (Reference Leavitt, Kraichak, Nelsen, Altermann, Divakar, Alors, Esslinger, Crespo and Lumbsch2015).
Altogether, clade A includes 39 OTUs with the specimens of this study forming part of two cosmopolitan (A02 and A04) and four locally differentiated (A36–A39) OTUs. A04 has a sequence similarity of 96.7% and was subdivided into two subunits (A04a and A04b).
Three different groups were formed by accessions assigned to Clade I. Due to a sequence similarity below the threshold of 97.5%, the subOTU I01i of Leavitt et al. (Reference Leavitt, Kraichak, Nelsen, Altermann, Divakar, Alors, Esslinger, Crespo and Lumbsch2015) was divided into two subunits (I01i and I01j) with a cosmopolitan and southern polar distribution, plus an independent OTU I17 occurring solely in sSA. The addition of the diverse accessions from sSA to the existing OTU I01, which already has 10 subOTUs (I01a–i) described by Leavitt et al. (Reference Leavitt, Kraichak, Nelsen, Altermann, Divakar, Alors, Esslinger, Crespo and Lumbsch2015), resulted in most of them being transferred into distinct OTUs. However, these have not been renamed here since this is an open system and a regrouping with new accessions is expected in the future.
Fifty percent of the sSA accessions of this marker are contained in the cosmopolitan OTUs S02 and S07 of clade S. S02 was subdivided into four subunits (S02, S02a by Leavitt et al. (Reference Leavitt, Kraichak, Nelsen, Altermann, Divakar, Alors, Esslinger, Crespo and Lumbsch2015) and S02b, S02c in this study), with the accessions from sSA being assigned only to S02 together with Northern Hemisphere specimens. S02b is formed solely by a specimen from continental Antarctica; a similar finding was described in Ruprecht et al. (Reference Ruprecht, Brunauer and Printzen2012a; T. jamesii ssp. is equivalent to S02b in this study). Another strongly supported OTU (S16) consists only of accessions from sSA. The cosmopolitan OTU S20 contains three accessions from the southernmost areas of sSA and is part of a strongly supported clade dominated by specimens from Iceland.
No accession from this study is part of clade G.
Trebouxia–ITS/psbJ-L/COX2
(Supplementary Material File S2-3). The data matrix of this phylogeny contains 217 concatenated sequences of the markers ITS, psbJ-L and COX2 with a length of 1693 characters. Only sSA specimens are included to demonstrate the intraspecific differentiation. This dataset was calibrated with four cultured Trebouxia specimens (see Supplementary Material File S1-3d; 2 × S02/Antarctica, A02/Antarctica and A12/Sweden). Interestingly, the psbJ-L sequences of A02 of the cultured specimen from Antarctica are different from the North American specimen from Leavitt et al. (Reference Leavitt, Kraichak, Nelsen, Altermann, Divakar, Alors, Esslinger, Crespo and Lumbsch2015).
The dataset still shows the same number of OTUs as the ITS phylogeny (Fig. 6) and the grouping is the same. Clade A shows nine well-supported groups at species level (A02, A12, A38, A39, A04a, A04b, A36, A37), with A36 and A04b being closely related. The subOTUs A04a and A04b are more separated than in the ITS phylogeny due to the marker psbJ-L.
Clade I is divided into two subOTUs (I01i and I01j) and one newly developed distinct OTU (I17) because of its heterogeneous structure. No COX2 sequences were included because they were not assignable.
More than half of the sequences are included in the homogenous and cosmopolitan OTUs S02 and (a smaller part) in S07. These groups are closely related and share similar COX2 sequences. OTU S16, which occurs only in sSA, is clearly separated at species level from S02 and S07, and S20 is situated at the base of clade S.
Distribution of species and OTUs: globally distributed vs. restricted to sSA and/or southern polar regions
Altogether, 185 mycobiont specimens forming 54 OTUs assigned to 24 species of the genera Lecidea, Porpidia, Poeltidea and Lecidella were identified. Four species of the genus Lecidea (Lecidea sp. 2, Lecidea sp. 3, L. medusula, L. tessellata) and Porpidia macrocarpa are globally distributed at species and OTU level.
By far the most abundant accessions are formed by locally differentiated OTUs (Lcd66, Lcd70; 48 accessions) and belong to the cosmopolitan species-clade Lecidea lapicida (cluster L14), with the next most frequent groups being Lecidella stigmatea (13) and Lecidea promiscens (9). Finally, a total of 12 species or single sequences are so far described and/or known only from sSA or the southern polar regions (Table 1, Figs 3 & 4, Supplementary Material Files S2-1a, b & S2-2).
The photobionts comprise 202 accessions that are assigned to 20 OTUs. Most of the algal specimens (128) belong to globally distributed taxa, especially Tr_S02 with 84 accessions, followed by Tr_S07, Tr_A02, Tr_A12, Tr_A04a, Tr_S20 and a single accession of Asterochloris woessiae from a lower elevation area close to Esquel, Argentina. The very heterogeneous OTU Tr_I01i (Leavitt et al. Reference Leavitt, Kraichak, Nelsen, Altermann, Divakar, Alors, Esslinger, Crespo and Lumbsch2015) was divided into two subOTUs: I01i with a global distribution and I01j that occurs in Antarctica and sSA. OTU I17 occurs solely in sSA. A surprisingly high number of 74 accessions (Asterochloris and Trebouxia) form 13 clearly separated OTUs and have, so far, been found only in sSA (Table 2, Figs 5 & 6, Supplementary Material File S2-3).
In summary, for the mycobiont the percentage distribution of accessions at OTU level shows a high rate of local differentiation and endemism for the sSA specimens versus those that are globally distributed (87:13). In particular, Parque Nacional Torres del Paine and Morro Chico, with 100% each, and the southernmost sampling point, Isla Navarino, with 90% have the highest amount of specialized accessions. In contrast, the photobiont OTUs show a higher rate of globally distributed accessions (32:68). However, both symbionts show no significant specialization along the latitudinal gradient in southern South America (Table 3).
Discussion
For the four re-evaluated groups Lecidea/Porpidia/Poeltidea, Lecidella (mycobiont), Asterochloris and Trebouxia (photobiont), the geographically isolated southern end of the South American continent supports a high degree of locally differentiated subclades (OTUs) in globally distributed species, as well as lineages currently known only from sSA at the species, coalescent-defined cluster and genus level. This was, to some extent, unexpected for these mostly globally distributed genera and can partially be explained by the lack of sequence information for most of the Southern Hemisphere lecideoid mycobiont species (Knoph & Leuckert Reference Knoph and Leuckert1994; Fryday & Hertel Reference Fryday and Hertel2014). This also applies to the photobionts because of the limited availability of molecular studies for the southern polar regions (e.g. Muggia et al. Reference Muggia, Zellnig, Rabensteiner and Grube2010; Fernández-Mendoza et al. Reference Fernández-Mendoza, Domaschke, García, Jordan, Martín and Printzen2011; Ruprecht et al. Reference Ruprecht, Brunauer and Printzen2012a).
Local differentiation (cryptic speciation) appears quite common in lichen-forming fungi (Leavitt et al. Reference Leavitt, Fankhauser, Leavitt, Porter, Johnson and St Clair2011; Lumbsch & Leavitt Reference Lumbsch and Leavitt2011; Kraichak et al. Reference Kraichak, Lücking, Aptroot, Beck, Dornes, John, Lendemer, Nelsen, Neuwirth and Nutakki2015; Dal Grande et al. Reference Dal Grande, Sharma, Meiser, Rolshausen, Budel, Mishra, Thines, Otte, Pfenninger and Schmitt2017), but has rarely been described for the most common and widespread lichen photobiont taxa Trebouxia (Fernández-Mendoza et al. Reference Fernández-Mendoza, Domaschke, García, Jordan, Martín and Printzen2011; Ruprecht et al. Reference Ruprecht, Brunauer and Printzen2012a; Leavitt et al. Reference Leavitt, Kraichak, Nelsen, Altermann, Divakar, Alors, Esslinger, Crespo and Lumbsch2015) and Asterochloris (Škaloud et al. Reference Škaloud, Steinova, Ridka, Vancurova and Peksa2015).
In particular, the lichen cluster (L14, Fig. 3) Lecidea lapicida, which occurs in polar and high mountainous regions worldwide (Hertel Reference Hertel1984; Hertel & Andreev Reference Hertel and Andreev2003; Hafellner & Türk Reference Hafellner and Türk2016), shows locally differentiated accessions at the OTU level that are currently known only from sSA. Surprisingly, Austrian and Antarctic (Lcd67) accessions are closely related, but they are clearly distinct from the two main OTUs (Lcd66 and Lcd70) that comprise 48 of the 185 sSA specimens. Another cosmopolitan (Northern Hemisphere and sSA) and common lichen species is L. auriculata, which includes a quite homogenous but widely distributed OTU (Lcd81b, 13 specimens) restricted to sSA. The heterogeneous clades of Porpidia macrocarpa, which include specimens from Antarctica and the Austrian Alps, show a similar pattern. Lecidea atrobrunnea is the only exception, forming two southern polar OTUs with accessions from both Antarctica and sSA (Fig. 3). A similar pattern is also known for Usnea aurantiacoatra (Jacq.) Bory (Laguna Defior Reference Laguna Defior2016) and Cetraria aculeata (Fernández-Mendoza et al. Reference Fernández-Mendoza, Domaschke, García, Jordan, Martín and Printzen2011). A different example is Lecidea cancriformis, which has, so far, been described as endemic to Antarctica and is one of the dominant crustose lichens in the most extreme areas of the continent (Castello Reference Castello2003; Hertel Reference Hertel2007; Ruprecht et al. Reference Ruprecht, Lumbsch, Brunauer, Green and Türk2010). The Antarctic accessions belong to a single, well-supported OTU (Lcd58; Fig. 3, Supplementary Material Files S2-1a, b & S2-2, available online) but there are seven closely related OTUs occurring in sampling areas north of Tierra del Fuego. However, the whole cluster L11, including L. cancriformis, remains confined to the southern polar regions. Several other species, as well as the genus Poeltidea, occur solely in the southern polar regions. Lecidea medusula, which was previously only investigated morphologically and thought to be endemic to the Southern Hemisphere (Hertel Reference Hertel2009), is shown to be a cosmopolitan species. However, in total, the cosmopolitan species/OTUs (Lecidea sp.2, Lecidea sp.3, L. medusula, L. tessellata, Porpidia macrocarpa) are outnumbered by those that are currently known only from sSA (Table 1).
The Lecidella phylogeny, based on the data of Zhao et al. (Reference Zhao, Zhang, Zhao, Wang, Leavitt and Lumbsch2015), reveals a new southern polar species-level clade (Lecidella spp. nov.) with accessions from sSA and continental Antarctica. The specimens are not morphologically assignable to the available species descriptions (e.g. Knoph & Leuckert Reference Knoph and Leuckert1994; Ruprecht et al. Reference Ruprecht, Lumbsch, Brunauer, Green and Türk2012b; Wirth et al. Reference Wirth, Hauck and Schultz2013). All the other sequences added to the phylogeny of Zhao et al. (Reference Zhao, Zhang, Zhao, Wang, Leavitt and Lumbsch2015) form well-supported and distinguished OTUs endemic to sSA.
Interestingly, several cosmopolitan and abundant mycobiont species occurring in continental and maritime Antarctica, for example Lecidea andersonii, L. polypycnidophora (Hertel Reference Hertel2007; Ruprecht et al. Reference Ruprecht, Lumbsch, Brunauer, Green and Türk2010, Reference Ruprecht, Søchting and Türk2016; Hale et al. Reference Hale, Fisher, Keuler, Smith and Leavitt2019) and Lecidella siplei (Ruprecht et al. Reference Ruprecht, Lumbsch, Brunauer, Green and Türk2012b), were not found in the sSA regions.
In contrast to the mycobiont, the photobiont shows the opposite pattern. In particular, the genus Trebouxia is known as widely distributed globally, with often low diversification (Muggia et al. Reference Muggia, Zellnig, Rabensteiner and Grube2010; Ruprecht et al. Reference Ruprecht, Brunauer and Printzen2012a). These findings are supported in this study with more than half of the accessions assigned to two cosmopolitan OTUs of the genus Trebouxia (S02 and S07) plus some smaller groups (A02, A04a, A12; Leavitt et al. Reference Leavitt, Kraichak, Nelsen, Altermann, Divakar, Alors, Esslinger, Crespo and Lumbsch2015; Fig. 6, Table 2, Supplementary Material File S2-3). The remaining Trebouxia and Asterochloris accessions form highly diverse and locally differentiated and/or endemic groups, which was unexpected. The contrasting distribution behaviour of the cosmopolitan photobionts could be caused mainly by their wide choice of mycobiont partners (Kroken & Taylor Reference Kroken and Taylor2000), allowing them access to the different distribution strategies of the various lichens.
The most southern sampling area at Isla Navarino shows, for the mycobiont, not only locally restricted OTUs, but also strongly supported endemic species (e.g. Porpidia navarina; Ruprecht et al. Reference Ruprecht, Søchting and Türk2016), which is also the case for the photobiont Asterochloris (OTU Ast24). As this area was ice-free during the Last Glacial Maximum (Douglass et al. Reference Douglass, Singer, Kaplan, Ackert, Mickelson and Caffee2005), the likely reason can be explained by the concept of glacial refugia, where the cold and glacial phases were the drivers of population divergences and (cryptic) speciation after transition from the Northern to the Southern Hemisphere (Paula & Leonardo Reference Paula and Leonardo2006; Stewart et al. Reference Stewart, Lister, Barnes and Dalen2010; Fernández-Mendoza & Printzen Reference Fernández-Mendoza and Printzen2013). Furthermore, the two most southern areas of the South American continent sampled (Parque Nacional Torres del Paine and Morro Chico), which both have 100% locally differentiated OTUs and endemic species for the mycobiont (Table 3), are influenced by the violent westerly gales caused by the split of the Humboldt Current to the north and the Antarctic Circumpolar Current (ACC) to the south (Silva et al. Reference Silva, Rojas and Fedele2009). This further leads to the assumption that mycobiont dispersal is limited through this asymmetrical wind system, which is caused by the undertow of the ACC, driven by westerly winds over the circumpolar streamlines (Allison et al. Reference Allison, Johnson, Marshall and Munday2010). Moreover the flow speed of the ACC between the Last Glacial Maximum and the Holocene has remained almost unchanged (McCave et al. Reference McCave, Crowhurst, Kuhn, Hillenbrand and Meredith2014). Nonetheless, several other strongly supported species groups that occur only in other areas of sSA, such as Lecidella sp. 1 at 2000 m a.s.l. close to Esquel (42.8°S) or endemic lineages in Trebouxia (S16, A38, A39), hint at further, and so far unknown, separation events at the remote and climatically extreme southern end of the American continent.
Taxonomy
It is well known that the mycobiont genera Lecidea and Porpidia (Fig. 3) are not clearly separated and our phylogeny confirms that the species currently included in Porpidia do not form a monophyletic group (i.e. Buschbom & Mueller Reference Buschbom and Mueller2004; Schmull et al. Reference Schmull, Miadlikowska, Pelzer, Stocker-Wörgötter, Hofstetter, Fraker, Hodkinson, Reeb, Kukwa and Lumbsch2011; Ruprecht et al. Reference Ruprecht, Søchting and Türk2016; Fig. 3, Supplementary Material Files S2-1 & S2-2b). Additionally, the newly described species/genus Cyclohymenia epilithica with perithecioid apothecia and an apparently Porpidia-type ascus (McCune et al. Reference McCune, Curtis and Di2017) is situated among these two genera. In general, species of Lecidea and Porpidia are morphologically differentiated by ascus-type (Lecidea or Porpidia), larger ascospores with the presence of a perispore in Porpidia and different genera of associated green microalgae as photobionts (Trebouxia sp. in Lecidea sp., Asterochloris sp. and Trebouxia sp. in Porpidia sp.; Ruprecht et al. Reference Ruprecht, Søchting and Türk2016). Chlorella sp. as described by Li et al. (Reference Li, Feng and Xie2013) was not found in the sSA Porpidia species. Although several new sequences were added for species that were previously only described morphologically (e.g. L. kalbii, L. promiscens, L. swartzioidea, L. lithophila, Poeltidea perusta), and sequences for other Porpidia species obtained from GenBank, the re-evaluated phylogeny could not be resolved. However, three species morphologically assigned to Lecidea s. str. (L. auriculata, L. tessellata, L. kalbii; Hertel Reference Hertel1984; Wirth et al. Reference Wirth, Hauck and Schultz2013; Fryday & Hertel Reference Fryday and Hertel2014) form, together with several Porpidia species and the genus Cyclohymenia, a highly supported but intermixed group. Although clearly defined groups for Porpidia are easily recognized and a name at the genus level is available for at least one of them (Haplocarpon), it would be premature to formally recognize these groups as genera because of the uncertain systematic position of the rare type species, Porpidia trullisata (Kremp.) Körb, for which molecular data are not yet available. However, the three other groups in our phylogeny are formed solely by species of Lecidea s. str., Porpidia and Poeltidea, respectively.
The unresolved and intermixed topology of several species in the two main clades of the Lecidella phylogeny (L. stigmatea and L. elaeochroma; Fig. 4) could not be improved with the additional specimens from sSA. Only an extended species sampling can help to unravel the inconsistent relationships in both these phylogenies (Lecidea/Porpidia/Poeltidea, Fig. 3; Lecidella, Fig. 4).
Conclusions
The species-rich group of lecideoid lichens found extensively in alpine and polar regions in southern South America comprises highly divergent OTUs of cosmopolitan species, as well as several endemic species. Three factors may contribute to the observed differentiation and endemism: a) the geographical isolation of this southernmost landmass north of Antarctica, b) limited dispersal caused by the Antarctic Circumpolar Current system, and c) the presence of regional glacial refugia.
The diverging patterns of dispersal in the cosmopolitan lecideoid lichen group are still under-researched. Acquiring larger datasets along the assumed distribution routes of the highest mountain ranges (Garrido-Benavent & Pérez-Ortega Reference Garrido-Benavent and Pérez-Ortega2017; Hale et al. Reference Hale, Fisher, Keuler, Smith and Leavitt2019), and a consequent sampling for better global coverage, will help to understand colonization events and specialization in this, so far, quite overlooked group of crustose lichens.
Acknowledgements
We are grateful to M. Affenzeller, H. P. Comes, M. Wagner (University of Salzburg), C. Printzen (Senckenberg, Frankfurt) and L. Sancho (Universidad Complutense Madrid) for giving highly appreciated advice and support. G. Brunauer (University of Salzburg), A. Passo (University of Comahue), M. Andreev (Botanical Institute, St. Petersburg), British Antarctic Survey (Cambridge) and U. Søchting (University of Copenhagen) kindly helped with collecting and providing the lichen specimens. Finally, we would like to thank Sieglinde Ott and Nadine Determeyer-Wiedmann (University of Düsseldorf) for providing several Trebouxia-cultures. This study was financially supported by the Austrian Science Fund (FWF): P26638.
Author ORCIDs
Ulrike Ruprecht, 0000-0002-0898-7677; Alan M. Fryday, 0000-0002-5310-9232.
Supplementary Material
Supplementary Material is found in two files. Supplementary Material File S1, includes Tables S1-1, S1-2a–d and S1-3–5. Supplementary Material File S2, includes Table S2-1a and Figs S2-1b, S2-2 and S2-3. To view supplementary material for this article, please visit https://doi.org/10.1017/S0024282920000225.


 Open access