


INTRODUCTION
Icequakes at or near the ice/bed interface of a glacier have recently been the subject of a number of studies (see Podolskiy and Walter (Reference Podolskiy and Walter2016); Aster and Winberry (Reference Aster and Winberry2017) and references therein). These icequakes, referred to herein as basal icequakes, are important because they provide the potential to elucidate the interaction of ice with the underlying till or bedrock. This interaction is important for constraining basal sliding in ice dynamics models, a significant but relatively poorly understood process that is critical in improving sea-level rise projections (Morlighem and others, Reference Morlighem2010; Ritz and others, Reference Ritz2015).
However, detecting these basal icequakes can be challenging. Often, the amplitude of the seismic energy reaching seismometers on the glacier surface is close to the noise level. Even when basal events have significantly greater amplitude than the background noise, surface crevassing events often dominate over basal events. Given the potential number of detected events in a given time period (e.g. order of thousands per day (Mikesell and others, Reference Mikesell2012; Röösli and others, Reference Röösli2014; Smith and others, Reference Smith, Smith, White, Brisbourne and Pritchard2015)), automated basal event detection and discrimination from surface crevassing is desirable. Here, we present the application of an automatic earthquake detection method, QuakeMigrate to this problem. QuakeMigrate automatically detects events that can then be further analysed to discriminate between surface crevassing and basal icequakes. This software has been made publicly available, and therefore the software combined with the details provided here will provide a useful and accessible tool for future cryoseismological investigations.
Various detection methods have previously been applied to search for basal icequakes. The two most common methods are: short-term-average to long-term-average (STA/LTA) algorithms; and frequency spectrum-based methods. STA/LTA algorithms (e.g. Allen (Reference Allen1978); Withers and others (Reference Withers1998)) are commonly used in many passive seismological environments, triggering on individual stations but with no discernible relationship between other stations. For icequake detection, they have been applied in a number of instances (Carmichael and others, Reference Carmichael, Pettit, Hoffman, Fountain and Hallet2012; Thelen and others, Reference Thelen2013; Allstadt and Malone, Reference Allstadt and Malone2014). However, STA/LTA algorithms alone are generally insensitive for discriminating between surface crevassing and basal events. Frequency spectrum-based methods can provide better discrimination between crevassing and basal icequakes, although they are generally less sensitive to events with a low signal to noise ratio (SNR), such as smaller basal icequakes. These methods have proven successful for initial icequake detection in several studies (O'Neel and others, Reference O'Neel, Marshall, McNamara and Pfeffer2007; Helmstetter and Garambois, Reference Helmstetter and Garambois2010; Röösli and others, Reference Röösli2014; Helmstetter and others, Reference Helmstetter, Moreau, Nicolas, Comon and Gay2015). However, further processing is generally required, such as manual inspection of events or additional filtering, and spectrum-based methods are often used in combination with cross-correlation template matching searches (Carmichael and others, Reference Carmichael, Pettit, Hoffman, Fountain and Hallet2012; Mikesell and others, Reference Mikesell2012; Thelen and others, Reference Thelen2013; Allstadt and Malone, Reference Allstadt and Malone2014) in an attempt to retrieve some of the previously missed lower-SNR events. A further method uses seismic waveform amplitudes (Jones and others, Reference Jones, Kulessa, Doyle, Dow and Hubbard2013). While the latter method may prove effective for locating crevassing events, it would rarely be possible to discriminate between crevassing and basal events using amplitude methods alone. In summary, none of the aforementioned methods provide automated detection of both lower-SNR and higher-SNR events while also discriminating for basal crevassing, without applying complex, time-consuming further processing steps. The method described in this paper provides a simple yet powerful way of overcoming these icequake detection challenges.
Data
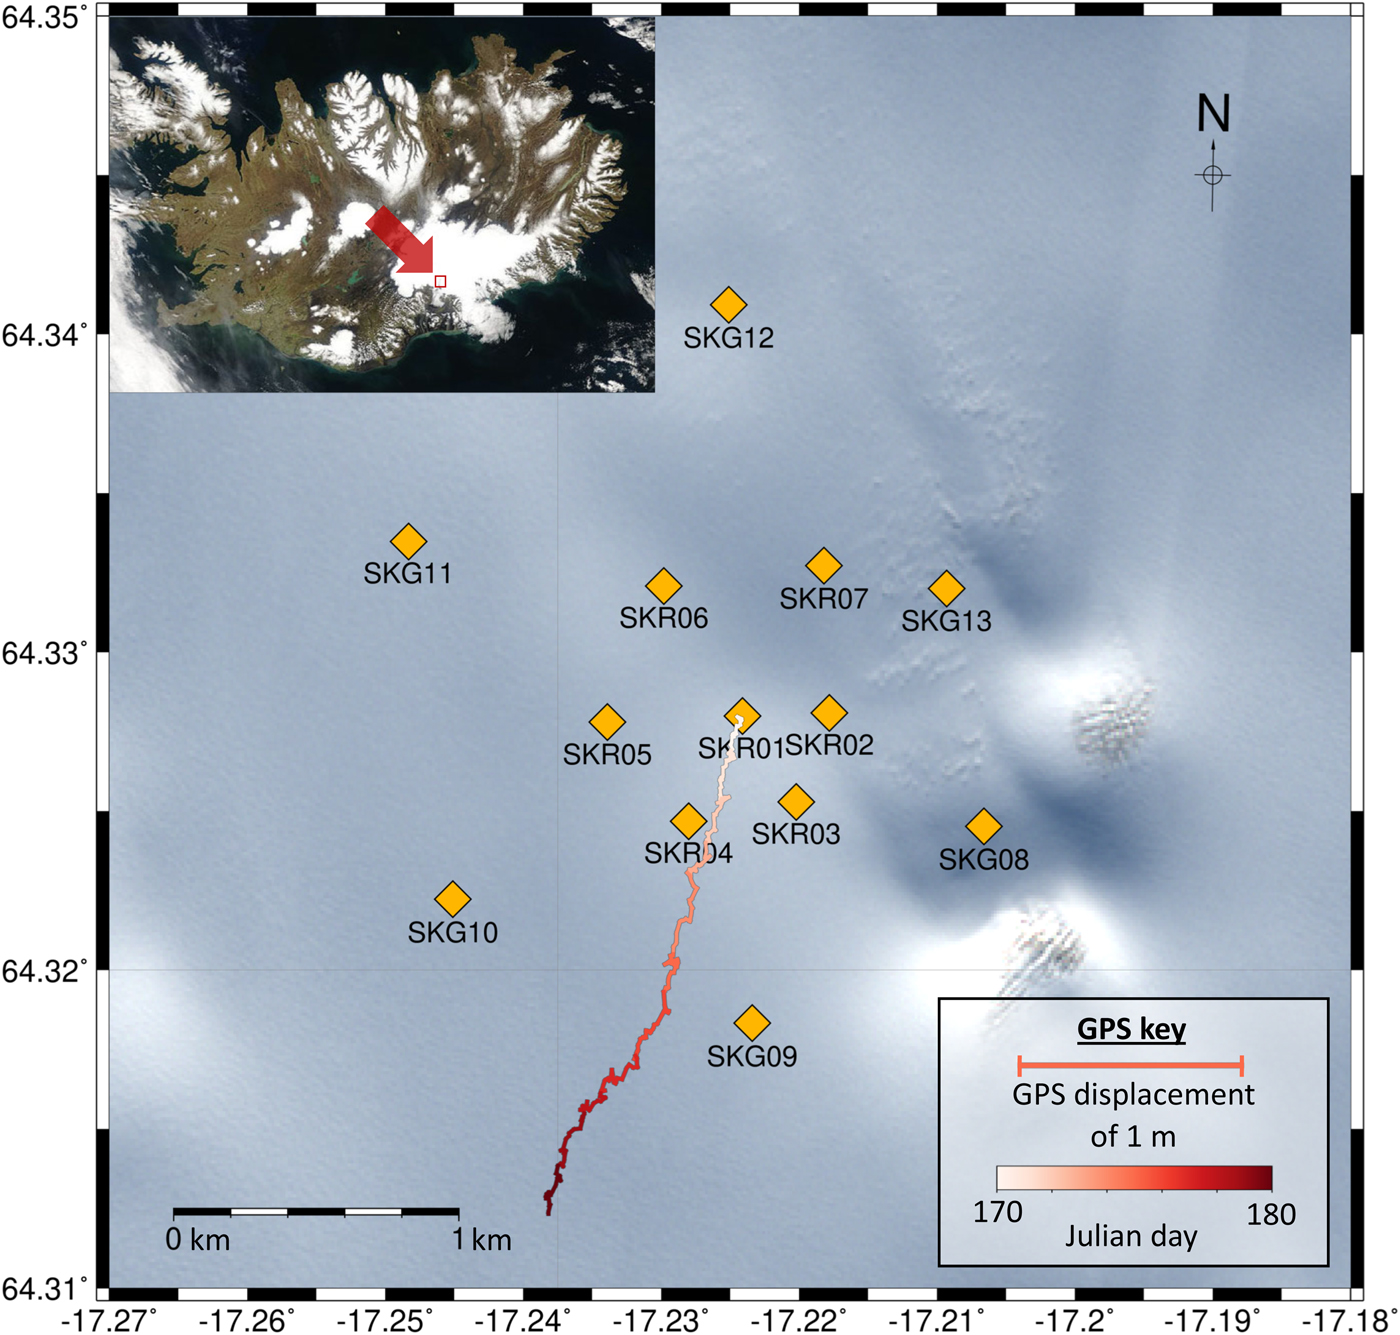
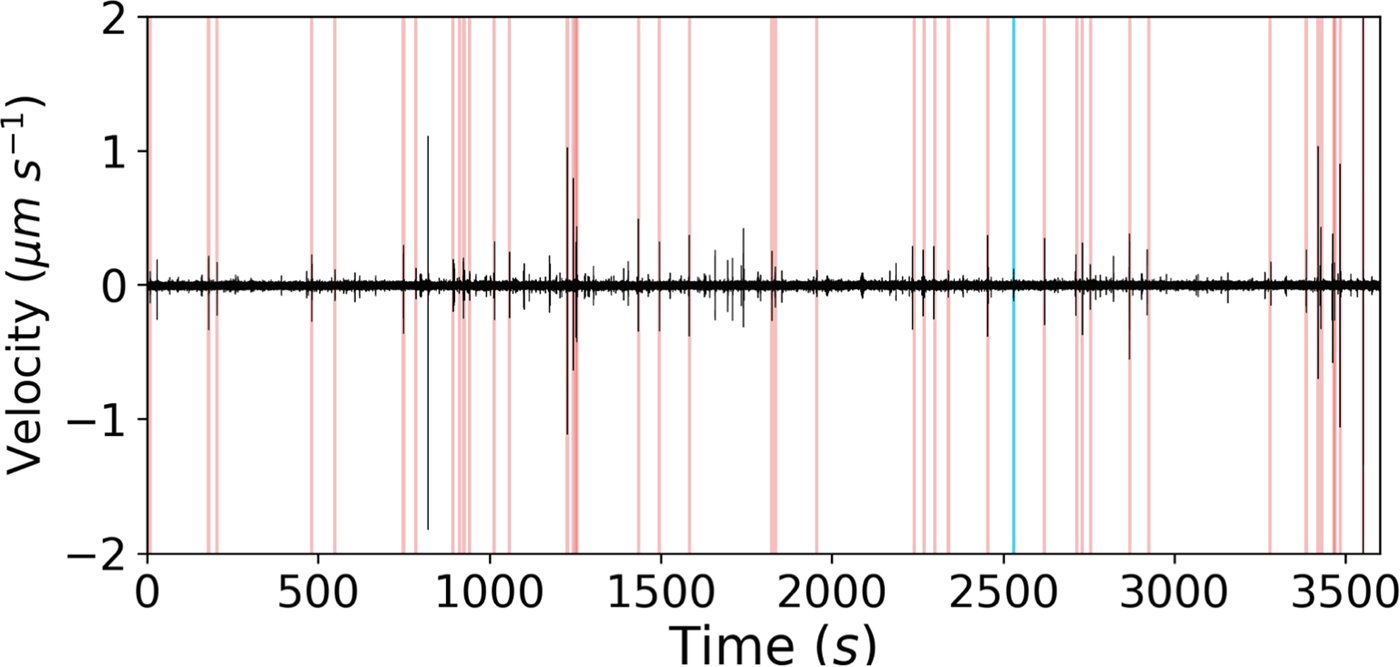
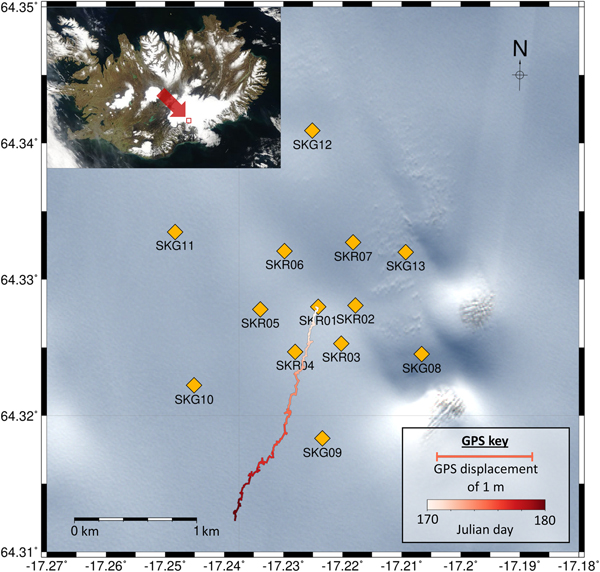
The data used to demonstrate the QuakeMigrate method detailed in this study are from a network of 13 seismometers located on Skeidararjökull, an outlet glacier of Vatnajökull Ice Cap, SE Iceland. They were deployed from 9 June to 2 August 2014. The network configuration is shown in Fig. 1. The inner seven instruments use 4.5 Hz geophones with Reftek RT 130 data loggers and the outer six instruments are Guralp 6TD 30 s seismometers. All the instruments were initially buried at ~ 4 m depth, although they had all melted out to the surface by the end of the deployment. The sampling rate of the instruments was 500 Hz. This dataset is useful for testing automatic detection and discrimination of basal icequakes from crevassing as the glacier was moving at an average speed of up to 100 m a−1 during the deployment and there is a crevasse field within and to the immediate south of the network. Figure 2 shows how much surface crevassing (red) is observed compared to basal icequakes (blue), and therefore highlights the basal icequake detection challenge posed by this dataset.
Network of instruments used in this study. Inset satellite image shows location of the network in Iceland. A 7-day running mean GPS data for the instrument SKR01 is plotted, showing the relative location of the instrument through time, to indicate glacier flow direction (~SSW) (see key for scale). RGB background image of Skeidararjökull is Copernicus Sentinel 2B data 2017, processed by the European Space Agency (ESA).
Plot of 1 hour of data for the vertical component of station SKR01. Red lines indicate manually identified crevassing events, blue lines indicate basal events. The data are for 18:00--19:00 on 29 June 2014.
DETECTION METHODS
In order to demonstrate the benefits of the QuakeMigrate method over previous methods, we compare the QuakeMigrate detection method to a spectrum-based method similar to that used in recent icequake studies (O'Neel and others, Reference O'Neel, Marshall, McNamara and Pfeffer2007; Helmstetter and Garambois, Reference Helmstetter and Garambois2010; Röösli and others, Reference Röösli2014; Helmstetter and others, Reference Helmstetter, Moreau, Nicolas, Comon and Gay2015). This comparative, literature inspired method involves several steps, including a dispersion filtering step and a template matching technique. While these steps could also be applied to the outputs from the QuakeMigrate method, we do not undertake this in our study in order to emphasise the usefulness of the QuakeMigrate method even without additional post-processing steps. Here we briefly describe the key attributes of each method and their specific application to the Skeidararjökull dataset.
QuakeMigrate detection method
Theory
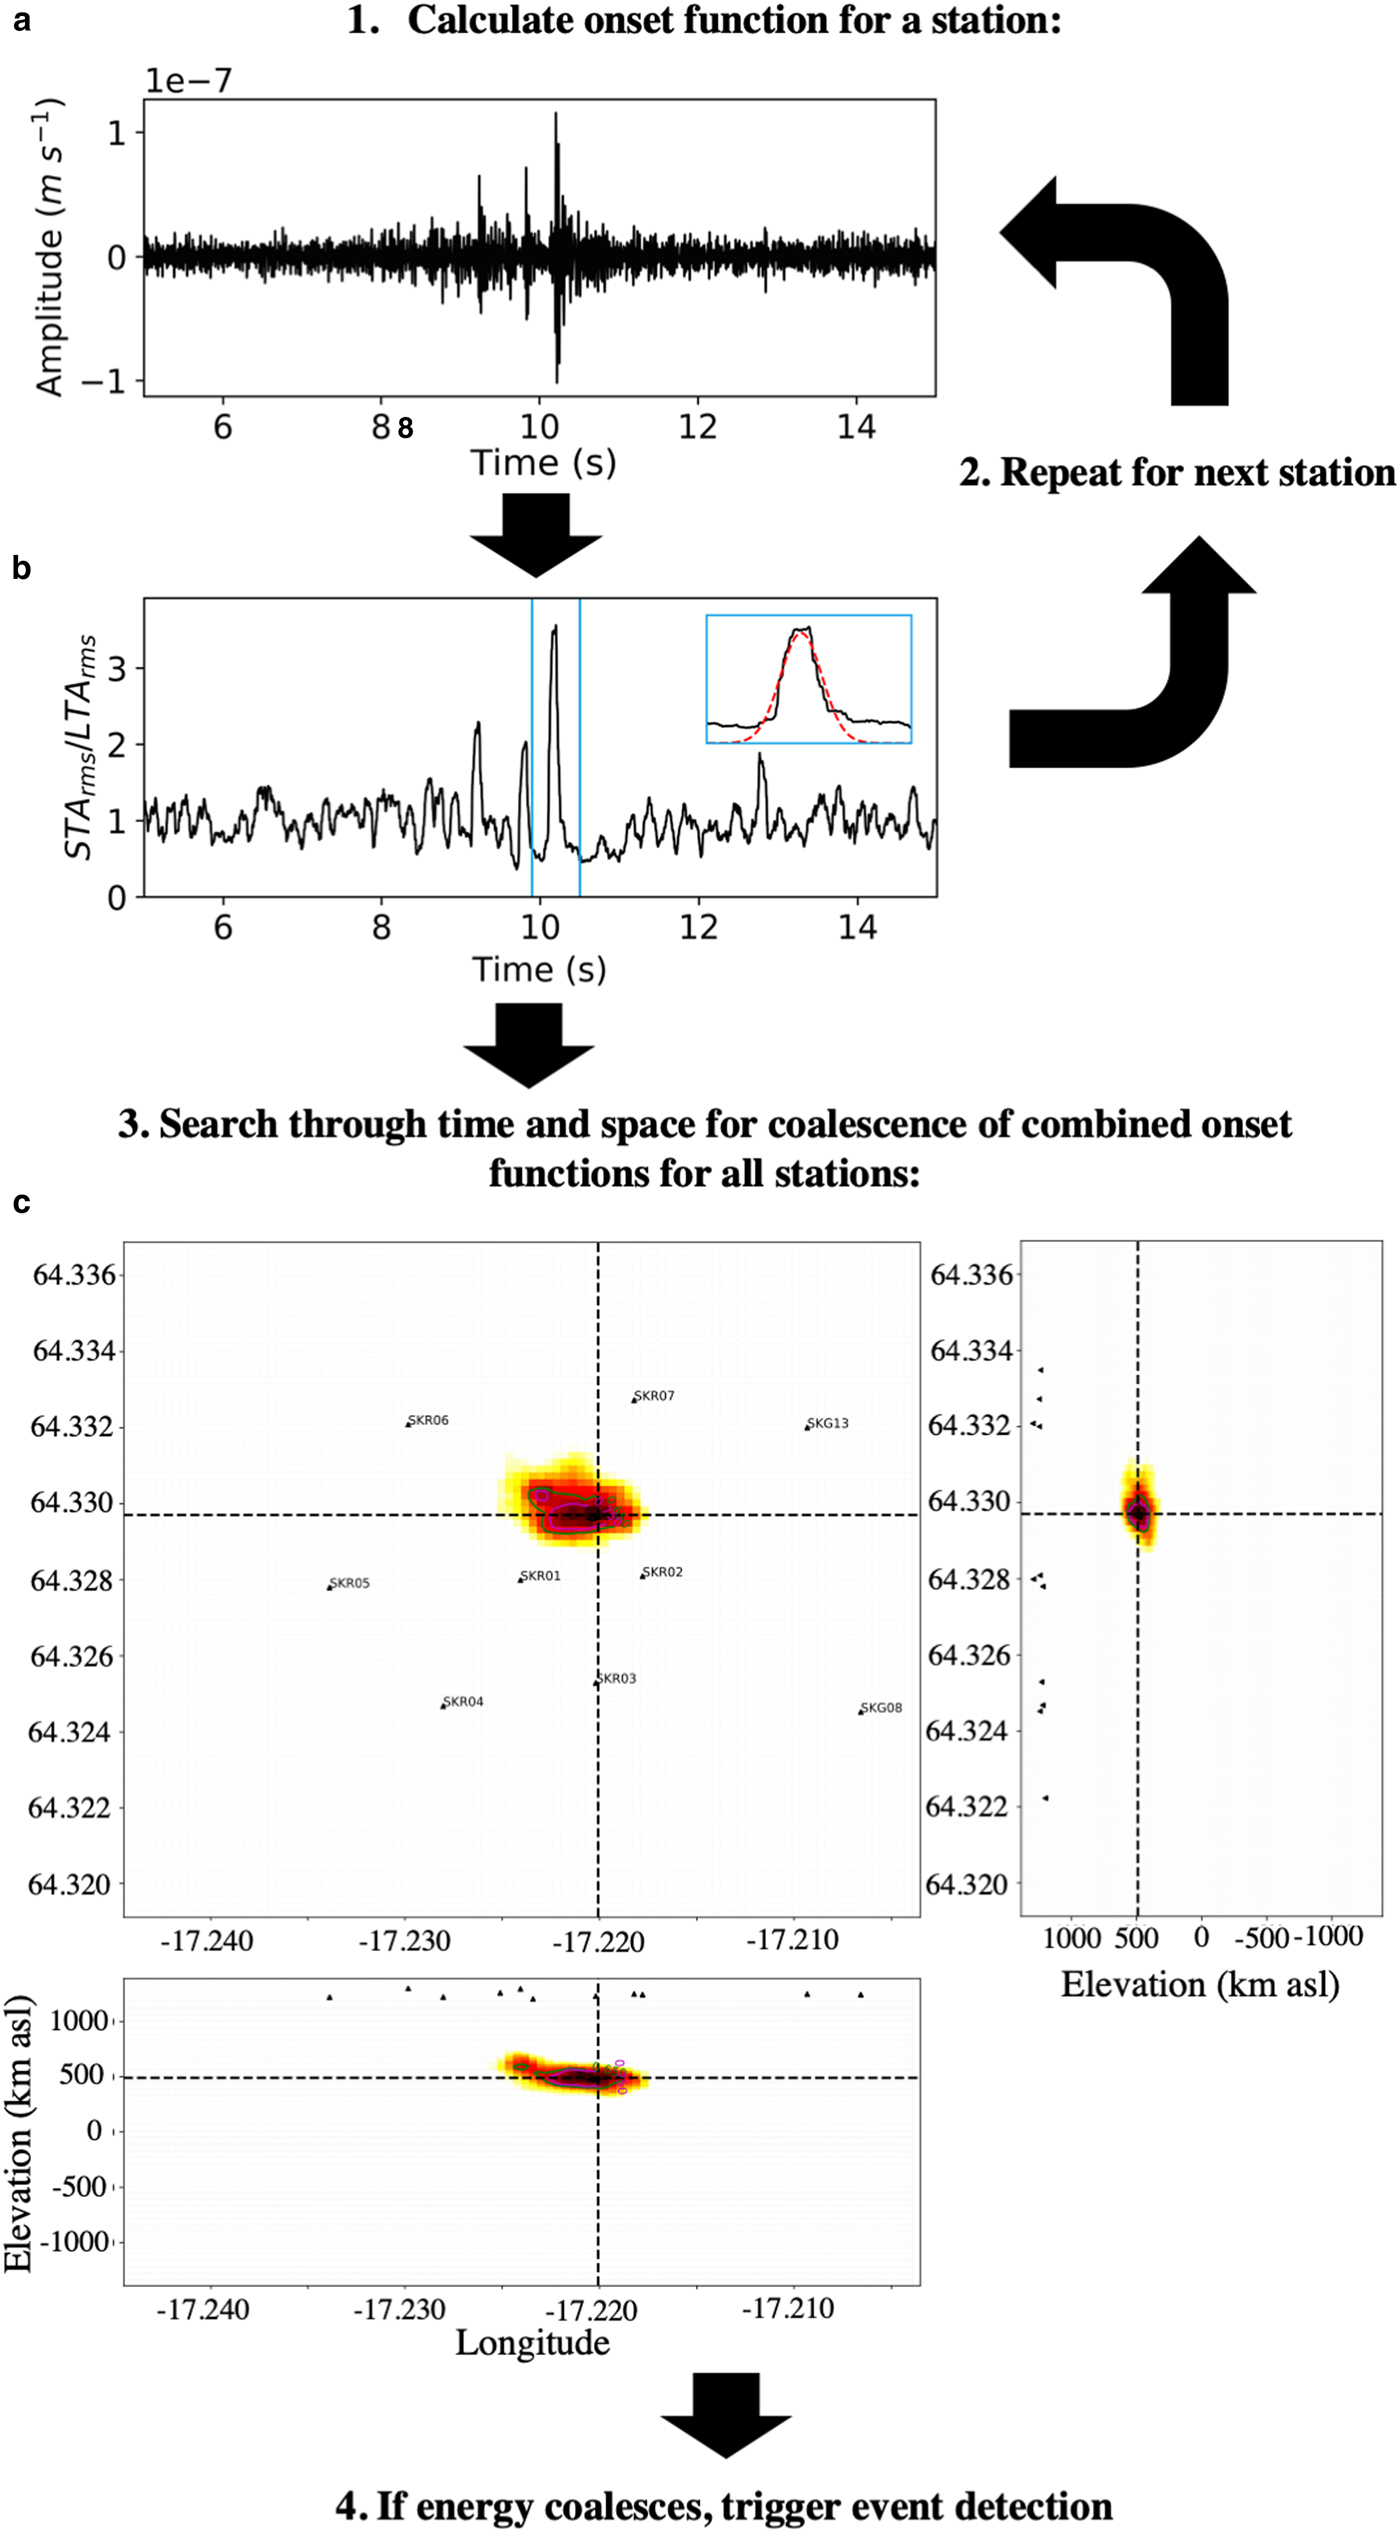
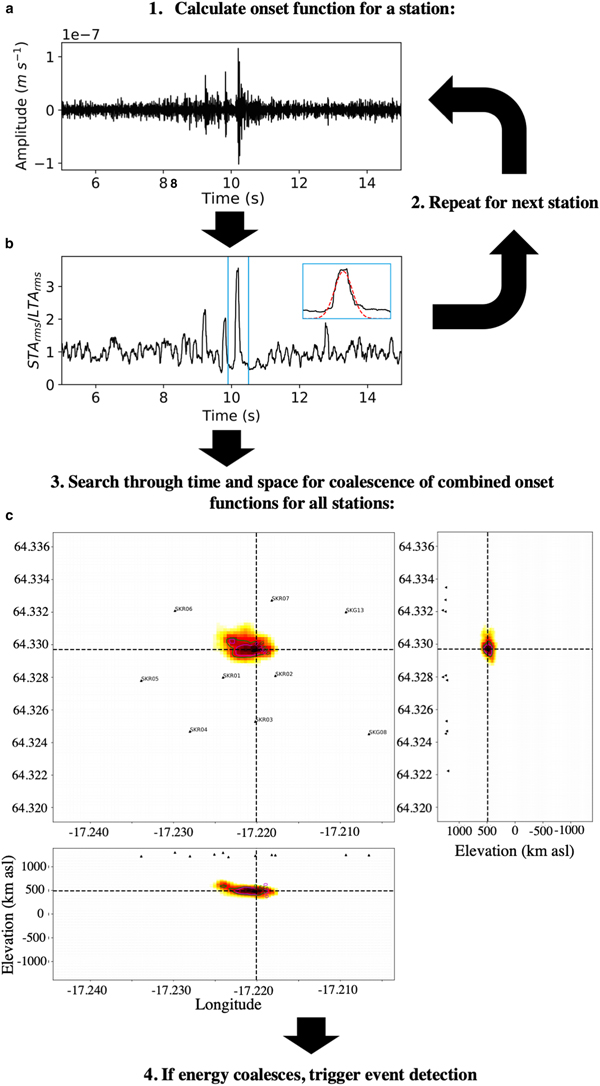
An outline of the QuakeMigrate method is shown in Fig. 3. The method involves back-propagating the energy arriving at seismic stations, searching for the coalescence of energy from multiple stations in time and space, building on the method of Drew and others (Reference Drew, White, Tilmann and Tarasewicz2013). The QuakeMigrate-based detection method is as follows. (1) The raw seismic signal at each station is band-pass filtered, (2) an STA/LTA algorithm applied to derive what we henceforth refer to as the onset function (see Fig. 3b). Peaks in these onset functions provide an approximation for the energy from a potential event arriving at the particular station. (3) The onset functions for each station are then combined, back-propagating the energy arriving at each station through time and space, searching at each time step for any locations where peaks in the onset functions for multiple stations become aligned, or coalesce. The point of maximum coalescence represents the most likely source and origin time of seismic energy and therefore the event hypocentre. To back-propagate the onset functions through time and space, one has to specify the velocity of the medium. QuakeMigrate allows for homogeneous, 1D or 3D velocity models to be specified. Here, we use a homogeneous velocity model. (4) The time and space through which we back-propagate the seismic energy is gridded, with the coalescence of the onset functions at each grid node calculated for each time sample. (5) If the maximum coalescence value for a particular time step reaches a defined threshold, an event is detected. This threshold is chosen to be sufficiently high so as to minimise false triggers caused by noise. (6) The arrival times for the event are then calculated based on the associated individual onset function peaks, with the arrival time uncertainties calculated from the standard deviation of the onset functions.
The QuakeMigrate detection method workflow for a triggered event. Arrows indicate the route through the various stages. (a) Filtered seismic trace for a single station. (b) The STA/LTA onset function. Inset plot in blue box shows a Gaussian function (red dashed line) fitted to the onset function, with the standard deviation assigned as the arrival time uncertainty. (c) The coalescence map for the event for the maximum coalescence time step, showing the coalescence of onset functions for all available stations.
(7) The final step in the icequake detection method is to locate the QuakeMigrate detected event hypocentres more accurately in order to spatially discriminate between surface crevassing and basal events. We use the non-linear hypocentre location method, NonLinLoc (Lomax and Virieux, Reference Lomax and Virieux2000). NonLinLoc uses the phase arrival times and arrival time uncertainties found using QuakeMigrate to probabilistically locate the most likely hypocentre for a given event and provides estimates of the uncertainty in the location. It also accounts for uncertainty in the velocity model. We then filter the data using estimates of the maximum depth uncertainty,  $\sigma _z^2$, and the RMS time residual t rms (see Appendix A for further details). By this method, a catalogue of relocated basal icequakes and crevassing is obtained.
The underlying method of searching for events using the coalescence of energy described above is similar to the Coalescence Microseismic Mapping (CMM) method (Drew and others, Reference Drew, White, Tilmann and Tarasewicz2013) used by Smith and others (Reference Smith, Smith, White, Brisbourne and Pritchard2015) for the location of icequakes near the bed of the Rutford Ice Stream, West Antarctica. The CMM algorithm has been applied to our dataset and successfully detected a significant number of events. However, for several reasons, it proved ineffective at distinguishing between basal icequakes and crevassing. Firstly, the CMM method provides insufficient output to optimise the initial search parameters required to effectively separate real events from false triggers. Secondly, CMM is limited by the size of travel-time lookup table that can be used, therefore limiting the spatial resolution to search over, whereas QuakeMigrate does not have the same limitation. Thirdly, no uncertainties in the arrival times or the location are calculated, although these are required for better constrained relocated event hypocentres, for spatial filtering. Unlike the algorithm defined in Drew and others (Reference Drew, White, Tilmann and Tarasewicz2013), the QuakeMigrate method provides uncertainty estimates for both location and phase arrival-times. Figure 3b shows the phase arrival time uncertainty estimated by QuakeMigrate for the P arrival at one station as the first standard deviation of the fitted Gaussian (shown by the red dashed line in the inset plot), with more details found in ?. These uncertainty estimates make the results considerably more useful because non-linear location methods, such as NonLinLoc (Lomax and Virieux, Reference Lomax and Virieux2000), can then be used to more accurately locate potential events. Relocated event hypocentres, along with their associated depth uncertainties, can then be used to filter basal icequakes from surface crevassing. The optimal initial location of events is more pertinent in the case of Skeidararjökull compared to the Rutford Ice Stream as Skeidararjökull is considerably thinner, and therefore an overlap of hypocentre uncertainty regions of basal icequakes and surface crevassing hypocentres is far more likely.
Setup for Skeidararjökull case
The parameters for QuakeMigrate used in this study are given in Table 1. It is likely that these parameters are broadly applicable for the majority of basal icequake studies. However, the coalescence detection threshold specified in Table 1 is likely to depend on the network geometry and local noise levels.
Table of specific QuakeMigrate parameters used in this study
A spectrum-based detection method for comparison
Theory
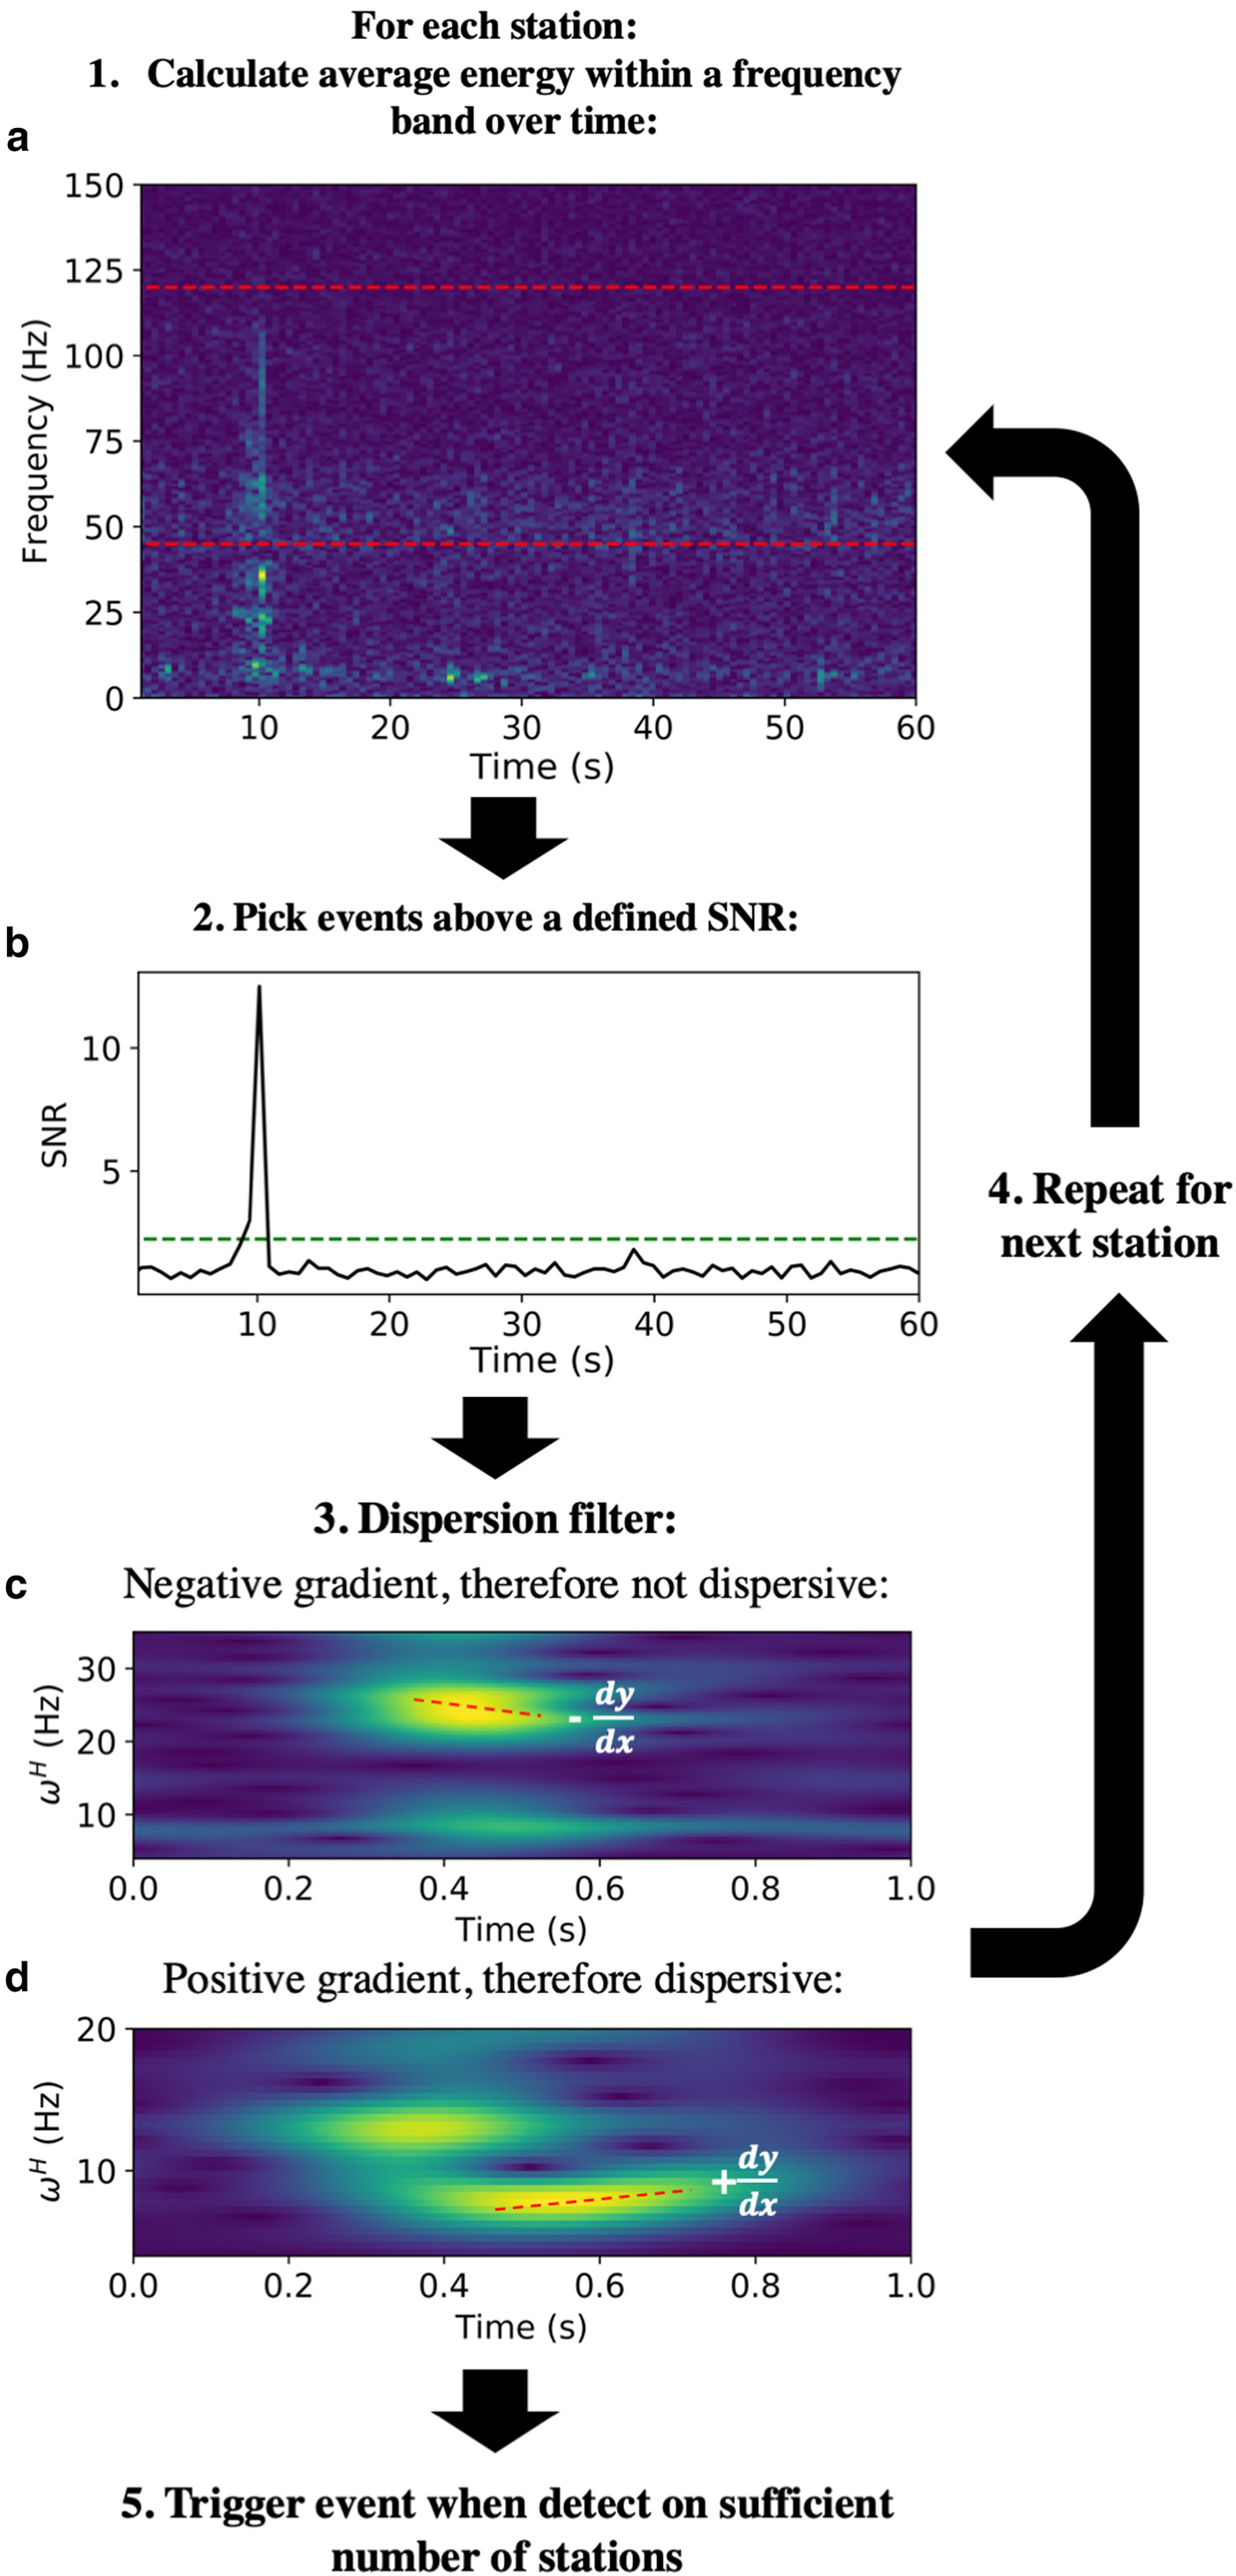
The spectrum-based method used for comparison in this study is outlined in Fig. 4. The method involves searching for peaks in the spectral power of a continuous trace over time, within a specific frequency band of the spectrum. Peaks in spectral power above a threshold trigger a potential event arrival at one station. Here we do this just for the vertical component and only trigger an event if it is detected on four or more stations concurrently.
The spectrum-based detection method workflow. Arrows indicate the route through the various stages. (a) Spectrogram of seismic trace. (b) SNR over time for the average energy of seismic energy within a defined frequency band (shown by the red dashes in (a)). (c) Example of FTAN space for an event arrival that is not dispersive at a station. (d) Example of FTAN space for an event arrival that is dispersive at a station. ω H is centre frequency.
This spectrum-based method with dispersive arrival filtering, detailed below, can provide an effective detection method in its own right, especially when combined with a cross-correlation template-based search using the initial events found, again detailed below. We therefore also make an implementation of this method (SpectDetect) publicly available.
Event discrimination using dispersion measurement
Due to the variability in the spectra of surface crevasse arrivals, some crevassing events have energy falling within the frequency band used to search for basal icequakes. Also, if a crevassing event is of sufficient amplitude, it is possible for it to trigger at four or more stations, resulting in an event detection. To remove this crevassing from the triggered icequake catalogue, we measure the frequency-time dispersion characteristics of event triggered arrivals at stations on horizontal components. Basal icequakes should not generate any surface wave energy, whereas crevassing events theoretically should exhibit strong surface wave arrivals that could be dispersive in nature (Aki and Richards, Reference Aki and Richards2002). Although we use a homogeneous ice velocity model in this study for locating icequakes, we understand that in reality there is likely to be a velocity gradient with depth due to the presence of a firn layer, resulting in significant decreases in seismic velocity near the surface. This velocity gradient would cause dispersive crevasse surface waves. Any event arrivals that are clearly dispersive are neglected, hence producing a detected icequake catalogue containing fewer surface crevassing events.
The method used to measure the dispersion of an event arrival is based upon Frequency Time Analysis (FTAN) theory (Keilis-Borok, Reference Keilis-Borok1989). For each triggered event, we take the complete signal,
 $$ W(t) = w_{\rm r}(t) + w_{\rm c}(t)i $$
where w r(t) is the real signal observed at a receiver and w c(t) is the complex component of the signal, obtained by taking the Hilbert transform of the real signal. We then take the Fourier transform of W(t),
 $$ K(\omega) = F[W(t)] $$
The FTAN domain, S(ωH, t), can then be obtained by applying a filter, G(ω). A simple and effective choice of filter is a Gaussian filter (Keilis-Borok, Reference Keilis-Borok1989), with a centre frequency ω H and a bandwidth σ(ω H). For a given centre frequency, ω H,
 $$ S(\omega^{H},t) = F^{-1}[G(\omega)K(\omega)] $$
One can then derive S(ω H, t) for a range of ω H. The gradient of the peak in energy over the duration of a particular event arrival within this domain, (δω H)/δt, provides a measure of the dispersion of the event arrival. The event arrival is dispersive if (δω H/δt) > 0. This is undertaken automatically, with the event removed from the catalogue if (δω H/δt) > 0.
The phase arrivals of all the detected events are manually picked and located using NonLinLoc (Lomax and Virieux, Reference Lomax and Virieux2000), as with the QuakeMigrate method. The catalogue of located events are then filtered using the  $\sigma _{z}^{2}$ values calculated by NonLinLoc.
Cross-correlation template-based search
A cross-correlation template-based search is used to find more events. Deep icequake events initially found using the spectrum-based method are used as template events, which are cross-correlated with continuous data, in order to find more, similar events. The signals from a template icequake arriving at each station are individually cross-correlated with the continuous data for each corresponding station. Here, we only perform this on the vertical component of each station. A cross-correlation detection threshold is set, with an event detected if the cross-correlation coefficient between the template and the continuous data for the same window is greater than the threshold. In this case we use a value of 0.7. The cross-correlation method therefore detects previously undetected events that are similar to the template event and therefore likely to come from the same approximate location.
Setup for the Skeidararjökull case
The parameters used in the spectrum-based search are given in Table 2. The high-pass filter value of 45 Hz is above the high-pass filter value used in the QuakeMigrate run. This difference is due to the insensitivity of the spectrum-based detection algorithm to surface crevassing, even with the dispersion filter implemented. A value of 45 Hz is sufficiently high that P-wave arrivals from surface crevassing are unlikely to be detected at four or more stations. The parameters used here are likely to be generally applicable for icequakes in other environments, but the limitation of the lower frequency window limit value might mean that lower frequency basal icequakes go undetected.
Table of specific spectrum-based method parameters used in this study
RESULTS
To test the effectiveness of QuakeMigrate compared to common icequake detection methods reported in the literature, we present results on the performance of the QuakeMigrate detection method for the seismic network deployed at Skeidararjökull, independently confirm that the detected deep icequakes are indeed approximately basal in origin and compare the effectiveness of the QuakeMigrate method to the spectrum-based method. Finally, we present results from the Rutford Ice Stream, Antarctica, in order to demonstrate how QuakeMigrate performs in a less noisy environment.
Skeidararjökull icequake detection
Performance of the QuakeMigrate detection method
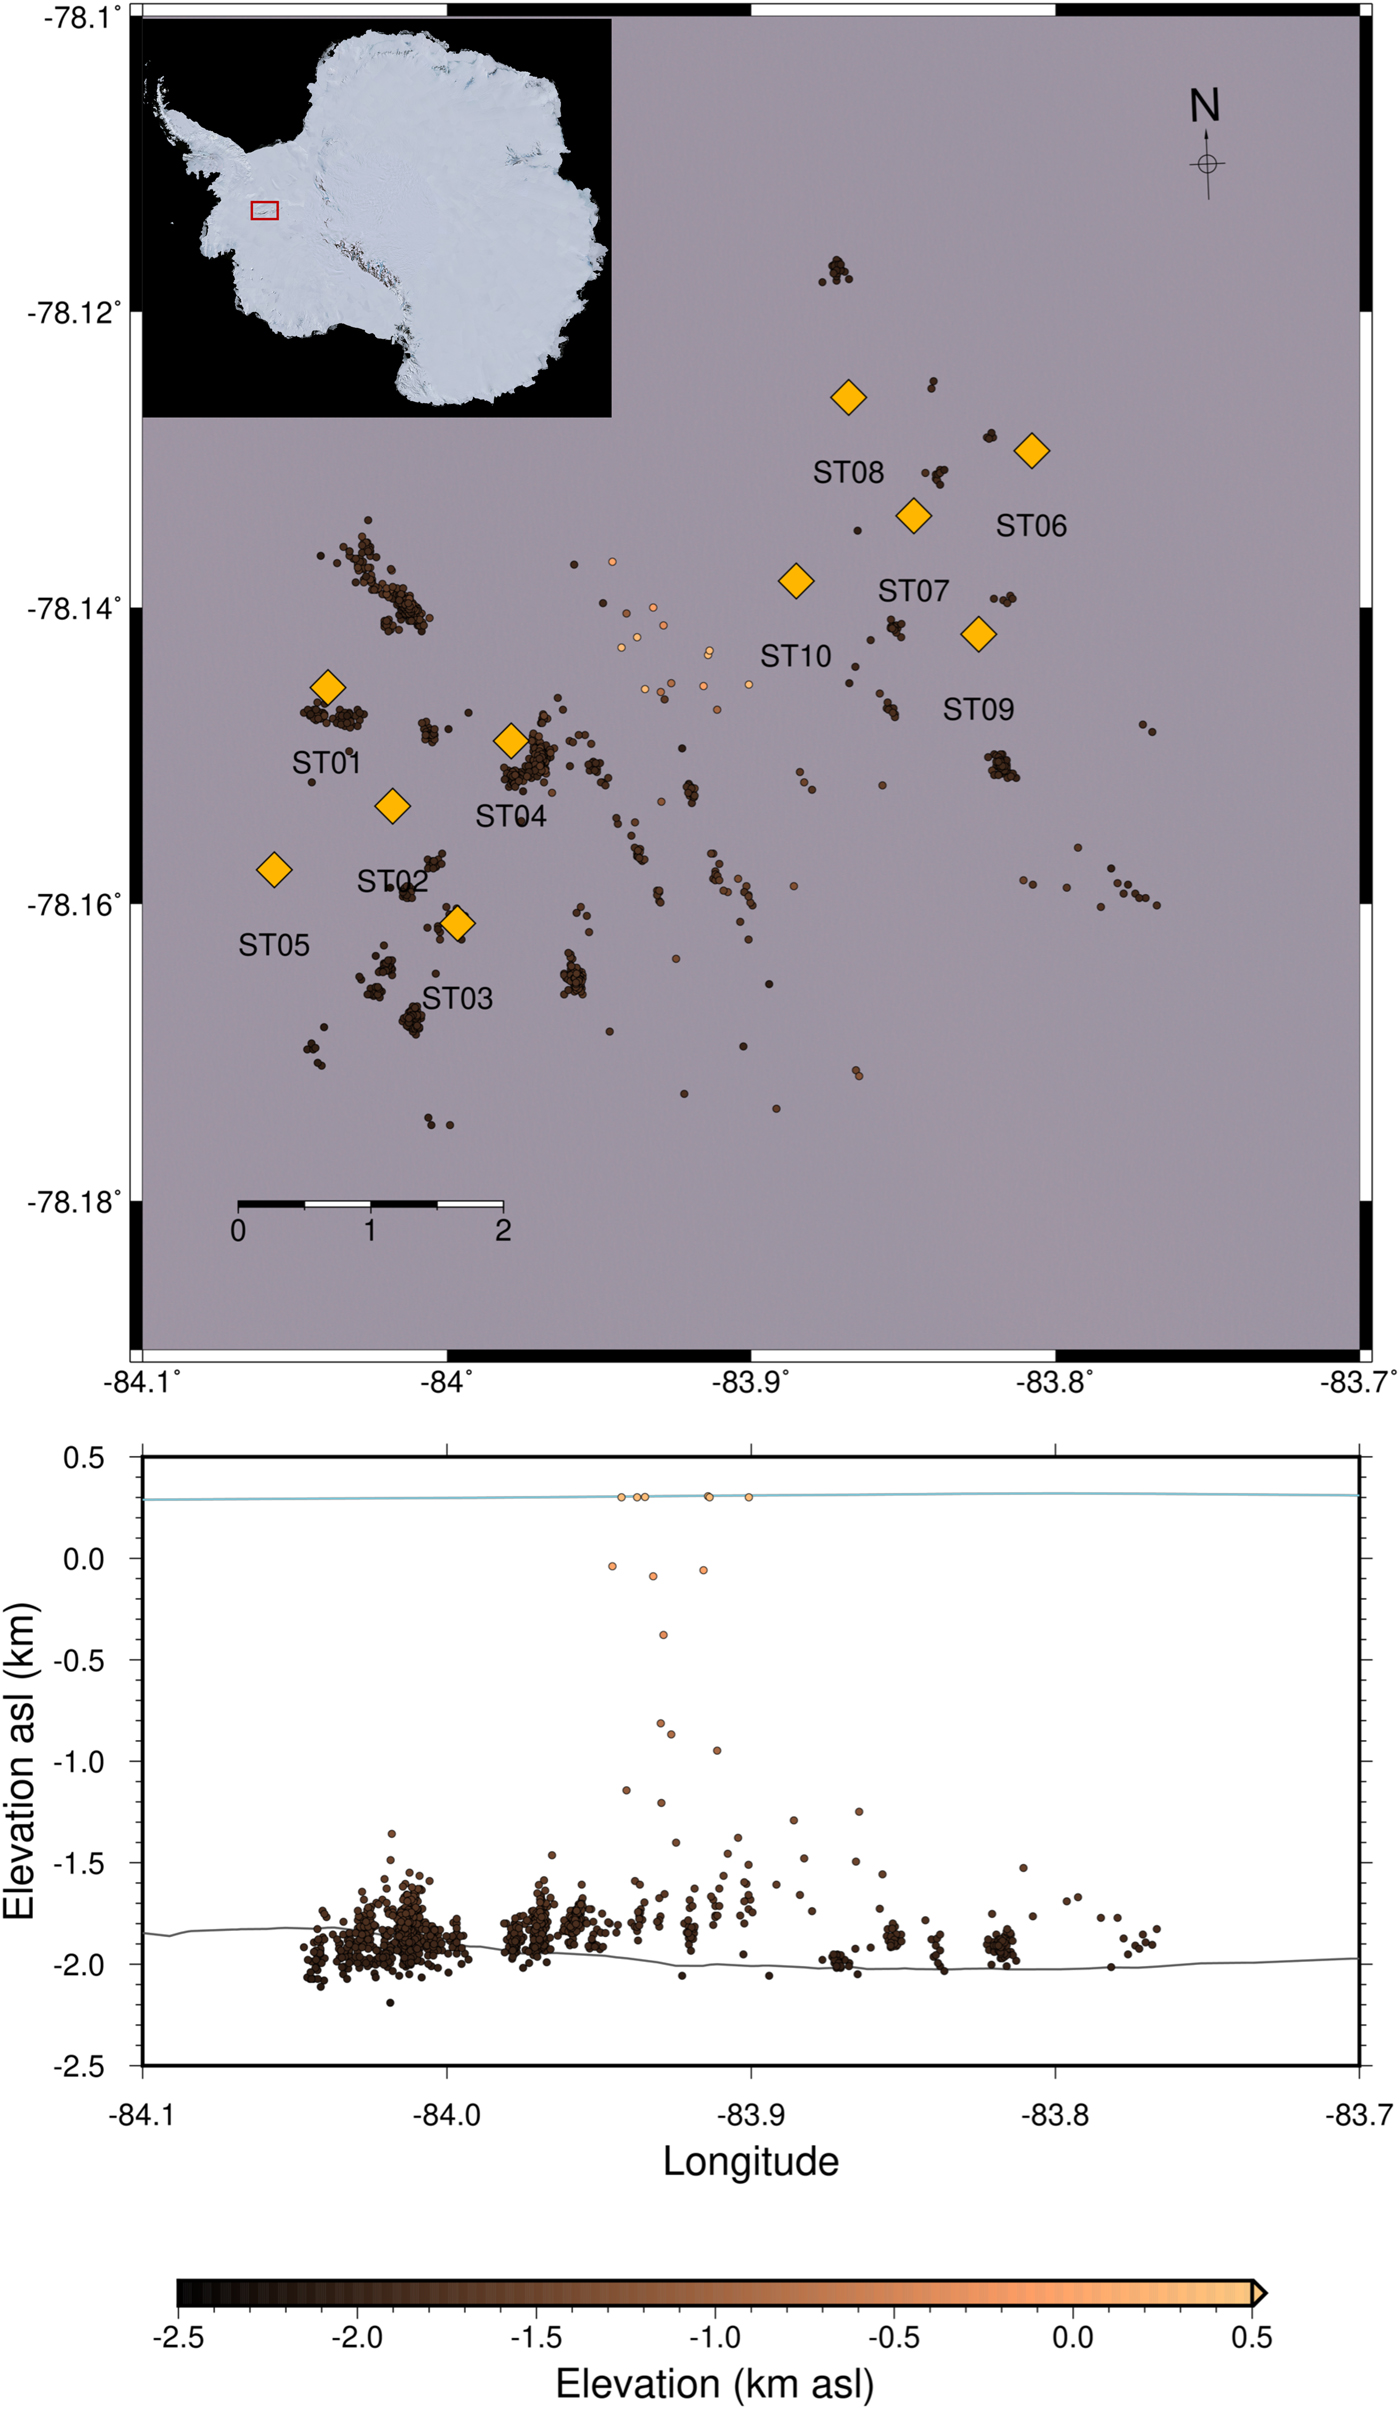
The best measures of performance of the QuakeMigrate detection method are the number of true basal icequake detections compared to the number of surface crevassing events incorrectly identified as basal icequakes; and the actual number of basal icequakes detected. Icequake detections over a period of 5 days from 25 to 29 June 2014 are used to assess this performance. These results are plotted in Fig. 5. We manually picked the phase arrivals associated with all events initially detected using QuakeMigrate that, when relocated using NonLinLoc, had hypocentral depths ~200 m below the ice surface (i.e. below 1 km asl).
Plot of icequakes detected via the QuakeMigrate method from 00:00 on 25 June to 23:59 on 29 June 2014. All events below 1.0 km asl that have a sufficiently high SNR have their phase arrival times manually picked. Points coloured by the bronze colour scale are events with automatically picked P and S phases via the QuakeMigrate method, with the points with red outlines in depth cross-section being the automatically detected icequake hypocentres from which phases have been manually picked, and blue points are the relocated events using manually picked P and S phases. Gold diamonds are seismometers. The ice surface and bed topography between profiles from the far south and north of the map extent are indicated by the blue and grey shaded regions, respectively. These regions are defined from radar data, with the profiles provided by the Glaciology Group, Institute of Earth Sciences, University of Iceland (Björnsson, Reference Björnsson2017).
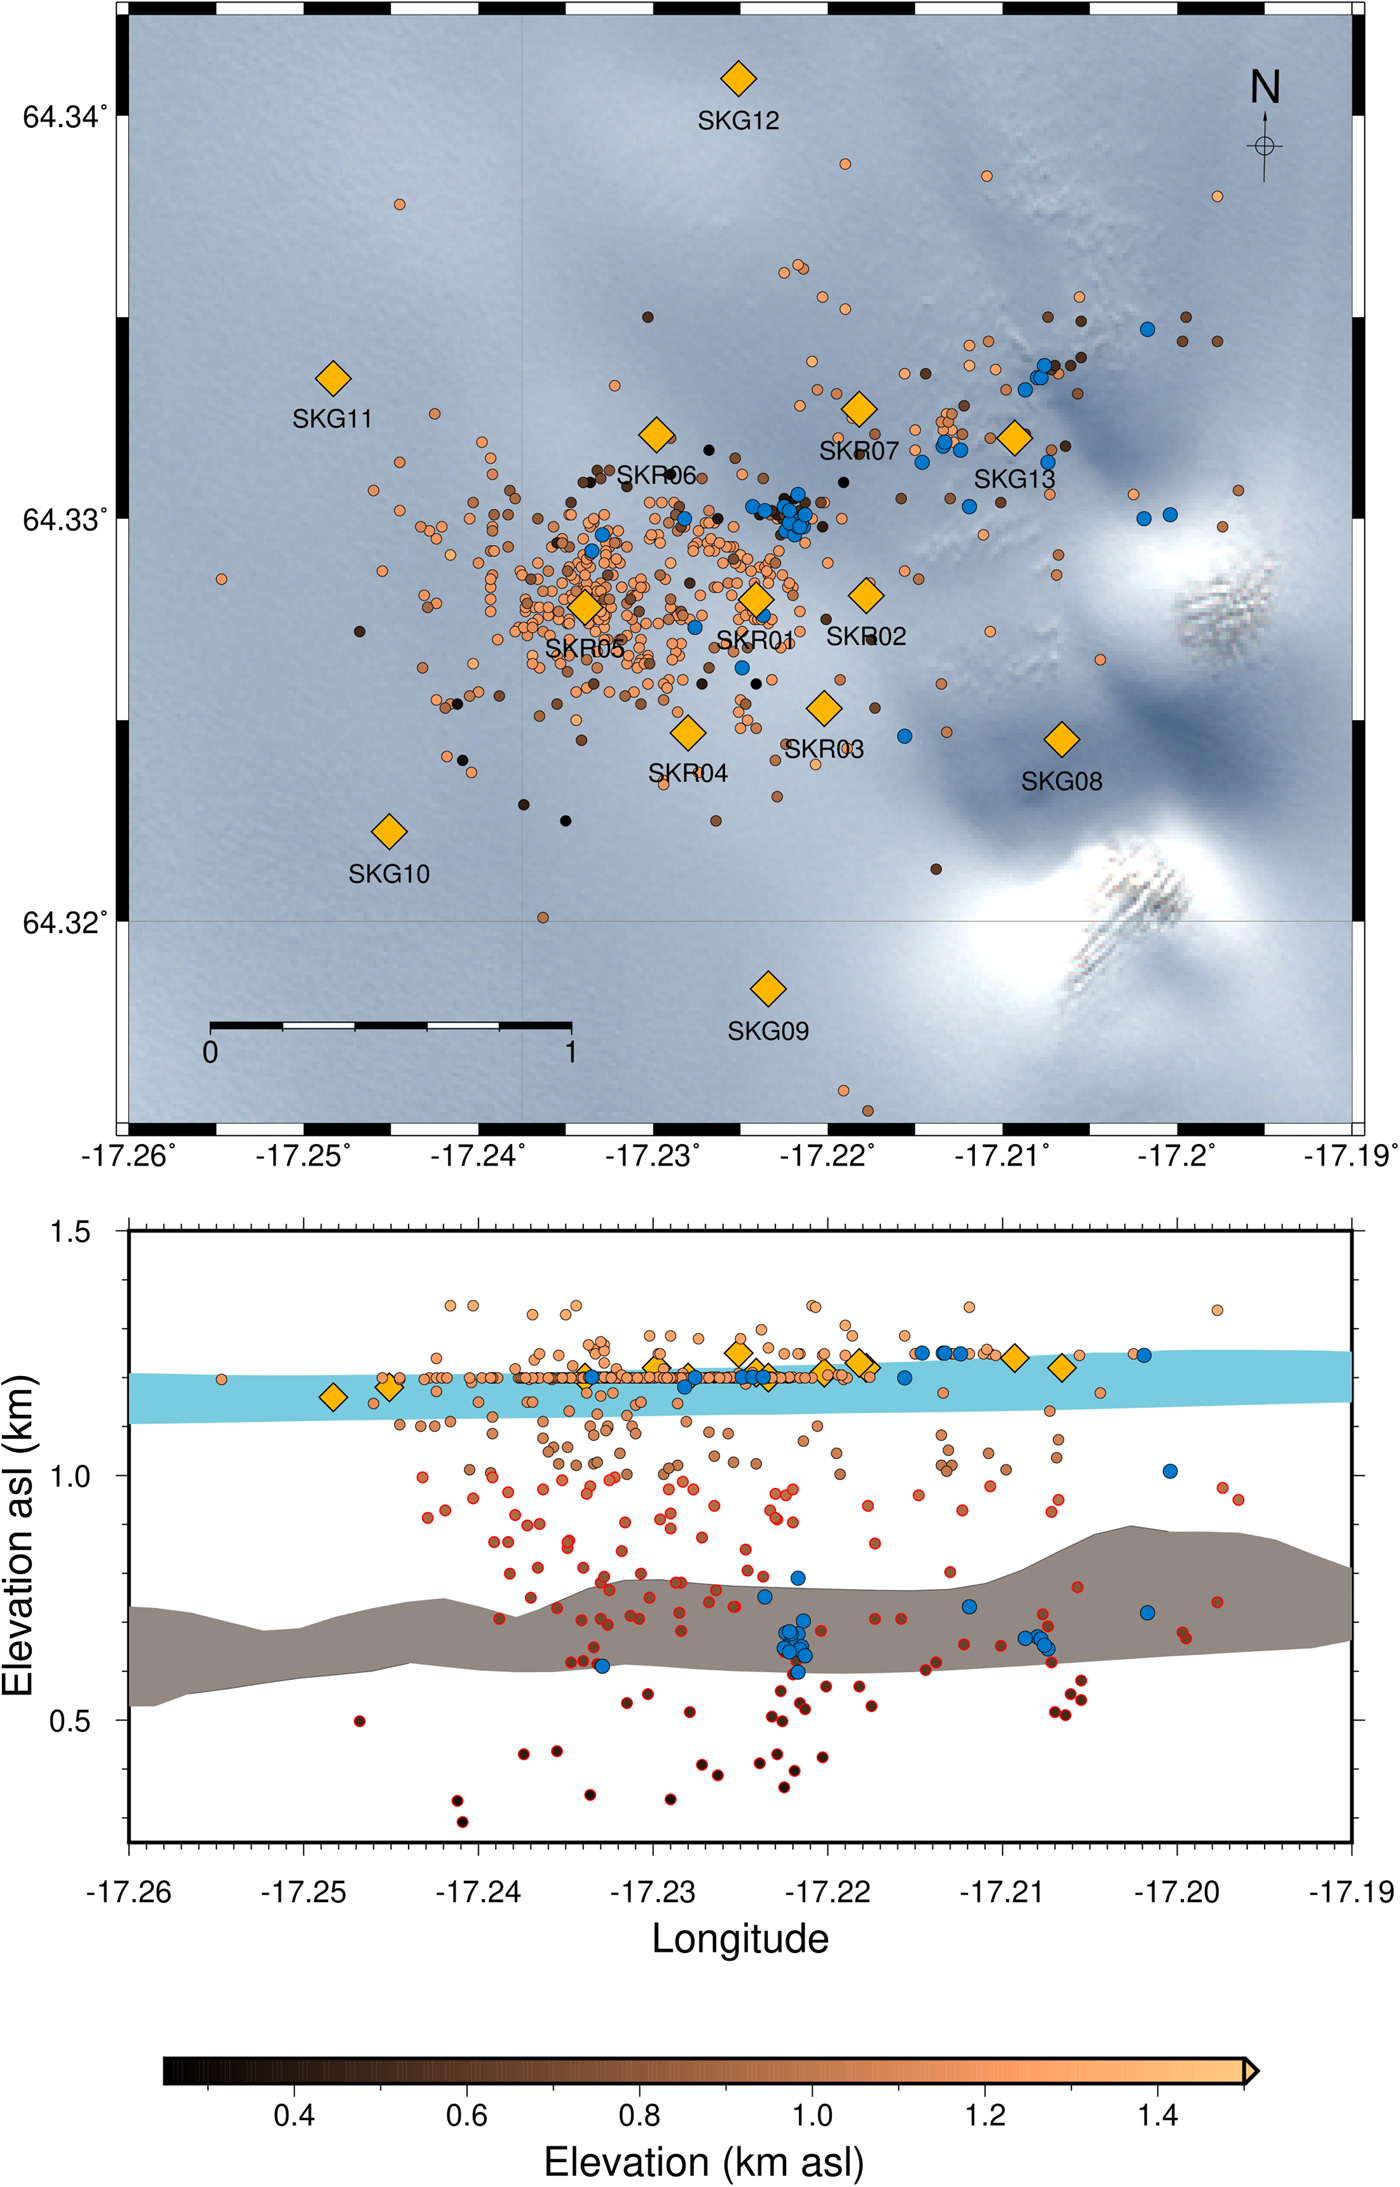
Of the 134 events deeper than 200 m below the ice surface, it was possible to manually pick P and S phase arrivals for 65 events. Of these, only 50 events met the NonLinLoc relocation quality measures we imposed on the original QuakeMigrate data (see Appendix A). Approximately 50% of these events remained deep after relocation, locating closer to the ice/bed interface than the surface, as shown by the blue points in Fig. 5.
Confirmation that basal icequake sources are not in the near surface
Although a number of events detected by QuakeMigrate locate near the ice/bed interface, here we also use other metrics to confirm whether these icequakes are indeed of basal origin. Figure 6 shows some of the metrics used, comparing basal and surface crevassing events. Various parameters for the three events are plotted. The first event is a high SNR basal icequake, detected by both the QuakeMigrate and spectrum-based methods. The second event is a low SNR basal icequake, detected by the QuakeMigrate method only. The third event plotted in Fig. 6 is a surface crevassing event, for comparison. The analysis of the icequakes presented in Fig. 6 is shown here primarily to show that QuakeMigrate is indeed detecting deep icequakes, and illustrate how one can more rigorously differentiate between deep icequakes and surface crevassing.
Comparison of cleaner and noisier basal icequakes to a surface crevassing event. (a) Waveforms on the vertical, north and east components for each event at station SKR01. Manually picked phase arrivals are shown (red for P, blue for S, and gold for surface phases). (b) Particle motion for P (red), S (blue), and surface (gold) phase arrivals. (c) Wadati plots for each event (Wadati, Reference Wadati1933). The surface crevassing event has both P-S and P-surface phase data plotted. (d) Spectrograms for the vertical component, for each event. (e) FTAN space plots of centre frequency vs. time period, for the radial component.
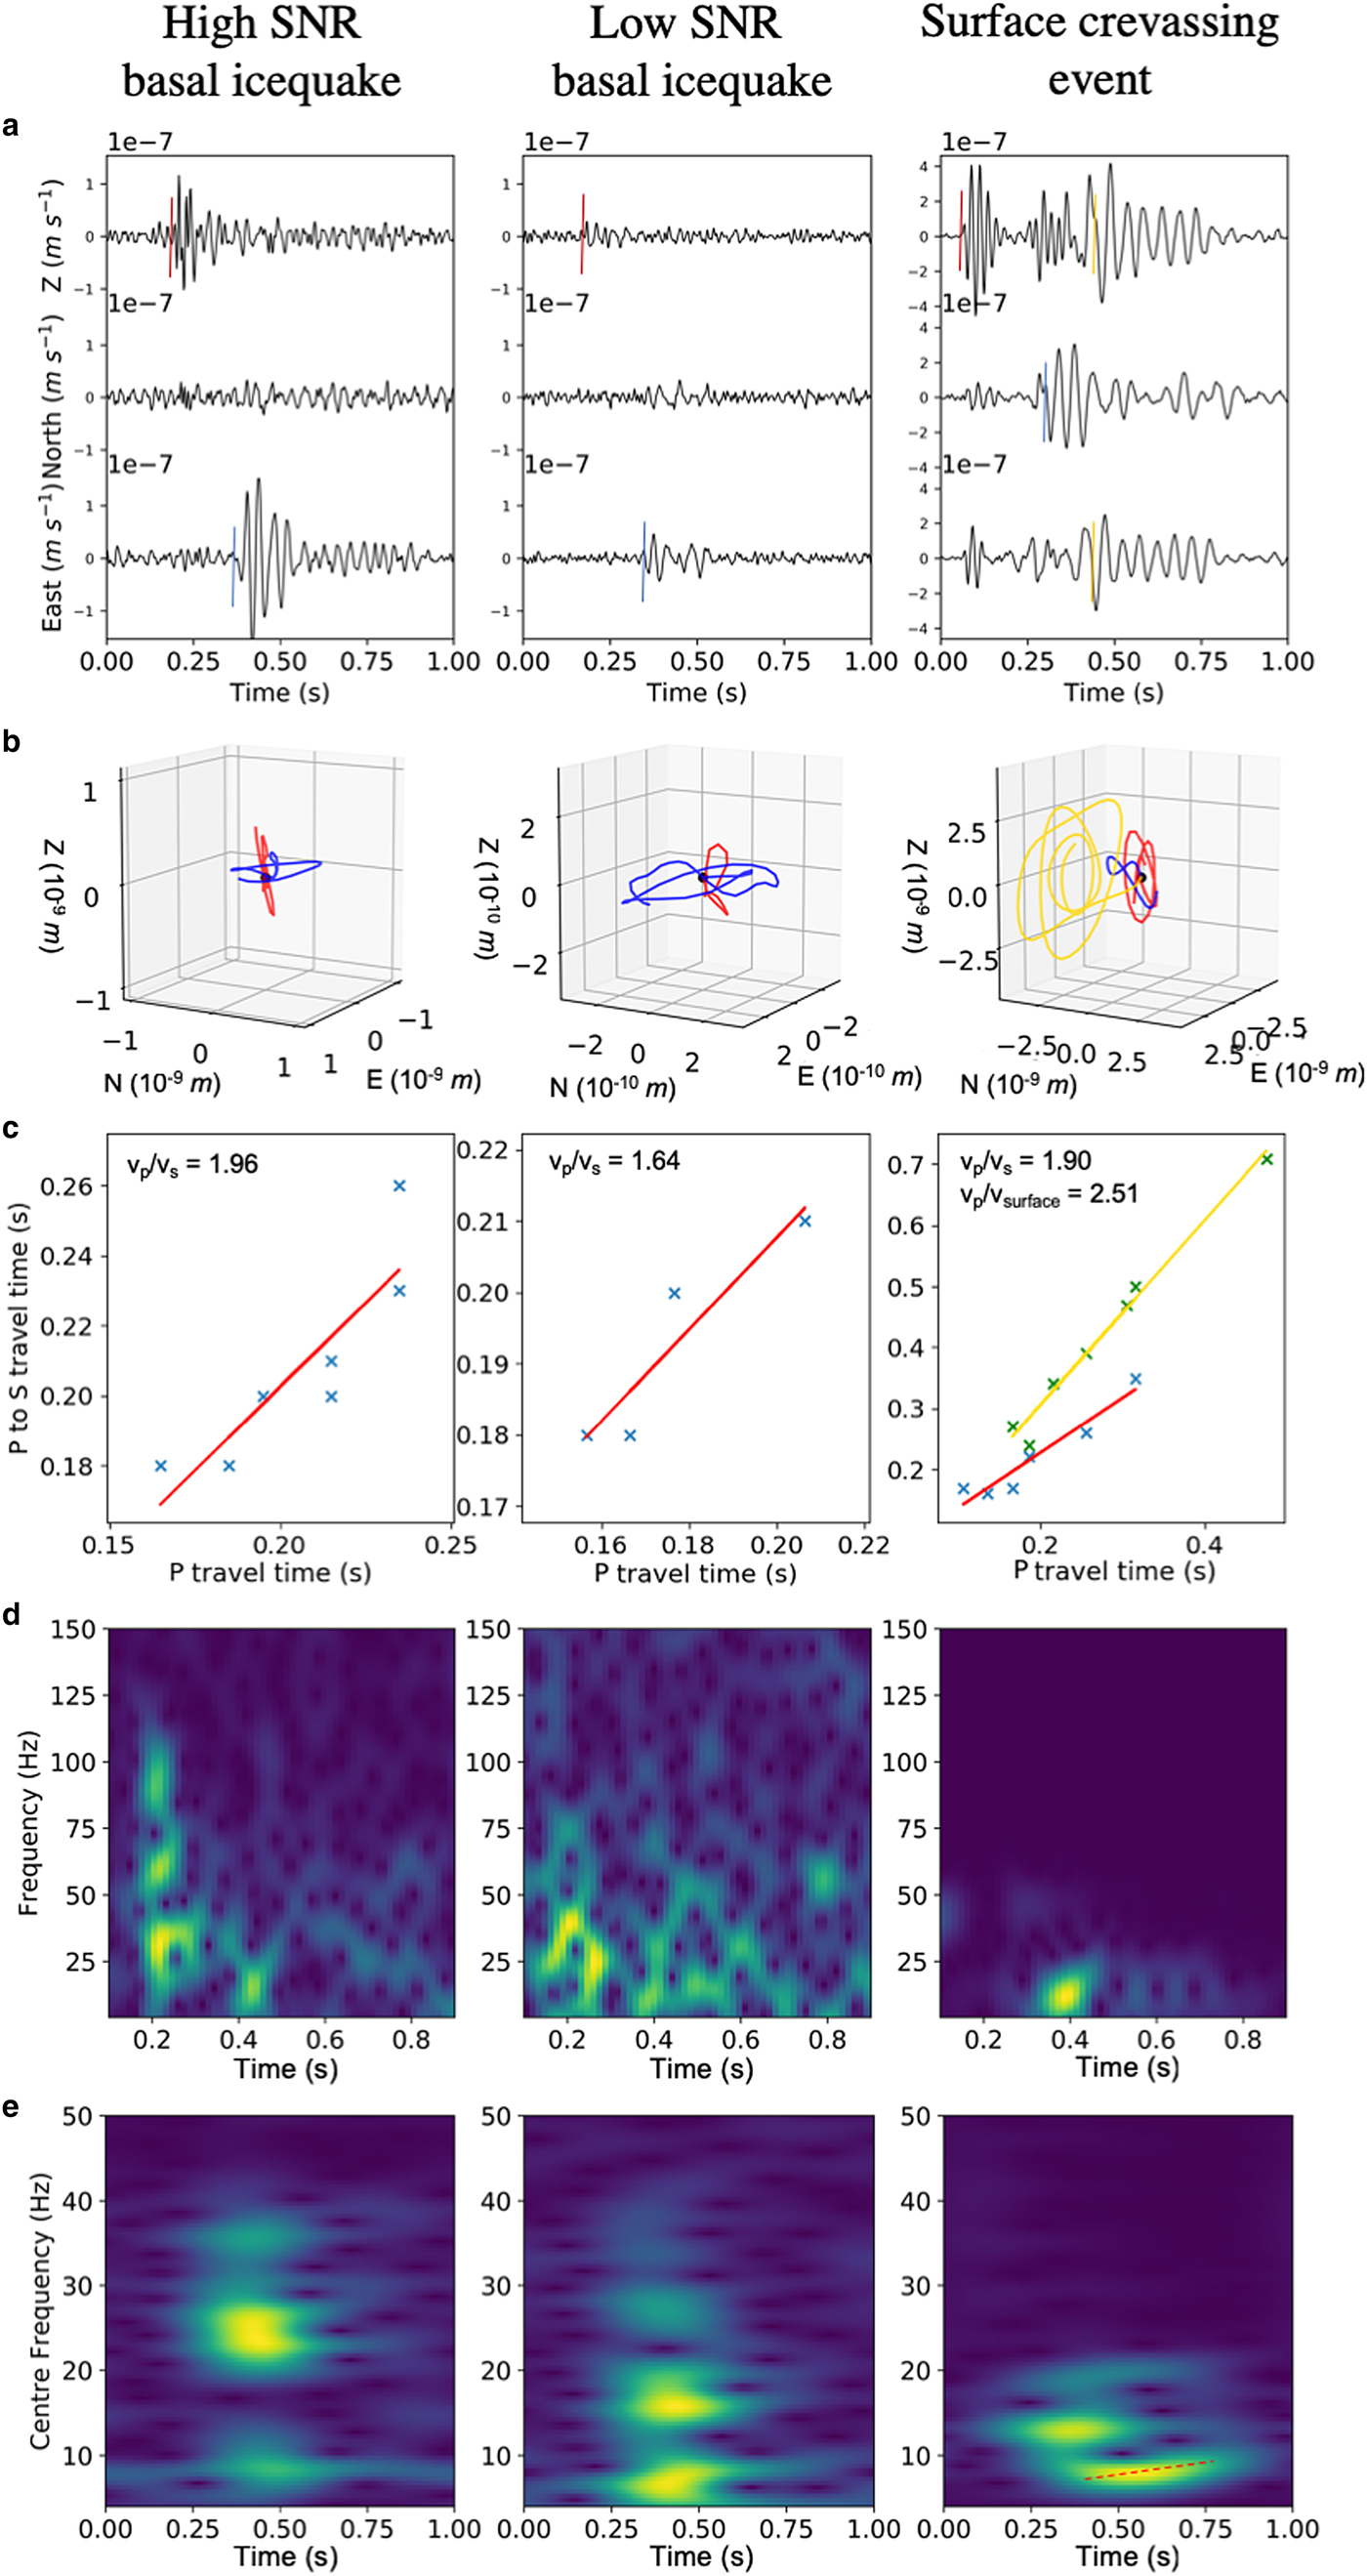
The waveforms for the Z, N and E components are plotted in Fig. 6a, showing that all the arrivals are impulsive in nature, with the S-wave arrivals (indicated by the blue lines) initially appearing similar to the surface wave arrivals associated with the crevassing event (indicated by the gold lines). This similarity leads to potential uncertainty when using P and S phase arrivals to deduce whether an event is basal in origin. Particle motions at a receiver reduce this ambiguity, with the basal icequakes exhibiting clear linear particle motions for the P and S arrivals (Fig. 6b). The surface crevassing event, however, exhibits an elliptical motion for the surface wave arrival, suggesting that the arrival is indeed associated with a Rayleigh wave phase from a near-surface event. The V p/V s and V p/V surface ratios shown by the Wadati plots (Wadati, Reference Wadati1933) (Fig. 6c) also suggest that the picked phase arrivals are associated with realistic V p, V s and V surface values.
The frequency domain can also be used to confirm that the basal icequakes originate within or below the bulk ice and do not have any associated surface wave arrivals. Spectrograms show that the basal icequakes have higher frequency arrivals associated with the P-wave. FTAN style plots (Keilis-Borok, Reference Keilis-Borok1989) for the east component (Fig. 6e) show that the S wave arrivals for the basal icequakes do not demonstrate dispersive wave packet arrivals, whereas the surface crevassing event has a dispersive arrival on the horizontal components, indicated by (δf/δt) > 0 (manually determined and indicated by the red dashed line on Fig. 6e). Since surface wave propagation can be dispersive, with an appropriate velocity-depth profile, this further points to the source of the third event interacting with the near surface.
Overall, the data presented in Fig. 7 confirm that the basal icequakes detected by QuakeMigrate are not associated with surface crevassing.
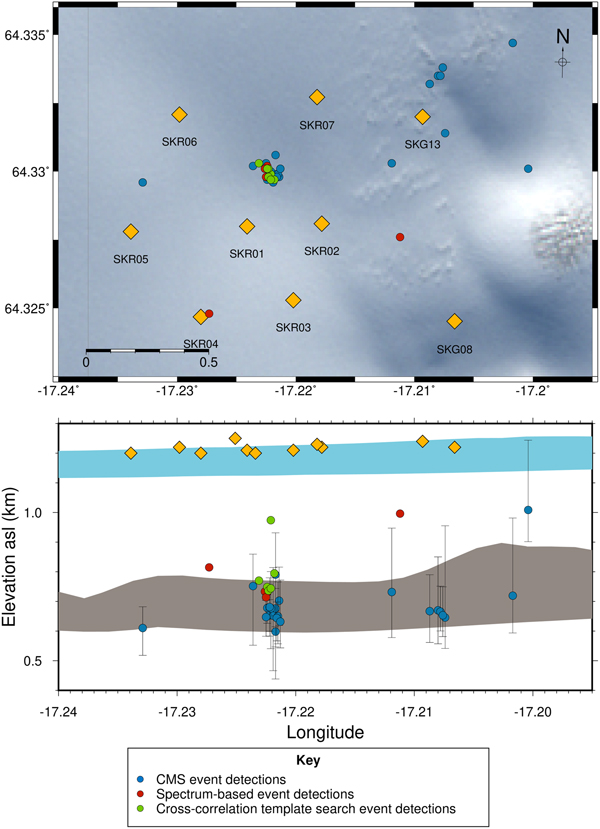
Plot of manually picked and relocated icequakes that initially had hypocentres below 1.0 km asl from the QuakeMigrate and spectrum-based detection methods. Events detected via the QuakeMigrate method are plotted in blue, with their associated depth uncertainties. Events detected via the spectrum-based method are shown in red. Additional events detected via cross-correlation template matching from the spectrum-based method detected events are shown in green. Gold diamonds are seismometers. The ice surface and bed topography are as specified in Fig. 5.

Comparison of QuakeMigrate and spectrum-based detection methods
Figure 7 and Table 3 compare results from the QuakeMigrate detection and spectrum-based methods.
QuakeMigrate detects more than four times the number of basal icequakes than the spectrum-based method (Table 3). When including additional events detected using a cross-correlation search with template events detected via the spectrum-based method, QuakeMigrate still detects more than twice as many events.
Table summarising comparative performance metrics of the QuakeMigrate and spectrum-based methods, as well as the cross-correlation (CC) method applied to events detected via the spectrum-based method. The incorrect-event-identification-rate is defined as the number of surface crevasse events incorrectly identified as basal icequakes, relative to the total number of detections of crevassing and basal icequakes
The primary reason for QuakeMigrate detecting more events is because it is generally more sensitive than the spectrum-based method. It not only triggers an event using detectable energy at each station but also includes energy that might not otherwise be detectable from the noise at other stations and coalesces the energy from these stations too. Therefore, otherwise undetectable energy contributes to QuakeMigrate detections, making it more likely to detect a lower SNR event. Different detection thresholds are used for the QuakeMigrate and spectrum-based detection methods. Whilst best efforts were made to reduce these thresholds as much as possible, in an attempt to detect the maximum possible number of events, differences between the sensitivity of the two methods may result.
Detection thresholds are also relevant for the discussion of incorrect identification of surface crevassing events by both methods. The incorrect-event-identification-rate is the proportion of surface crevassing events incorrectly identified as basal icequakes detected relative to the total detections of each method. The incorrect-event-identification-rates are given in Table 3. Reducing detection thresholds inevitably increases incorrect-event-identification-rates. However, the QuakeMigrate false detection rate is comparable to microseismic detection methods in other environments such as volcano seismology (e.g Dixon and others (Reference Dixon, Power and Stihler2005)). It is also worth noting that neither detection method triggers off random, stochastic energy arrivals at single stations but rather from other physical events such as surface crevassing or volcanic activity. It is likely that we would observe fewer incorrect event identifications at a different site where the activity of other seismic sources is lower.
QuakeMigrate detects multiple clusters of basal icequakes, whereas the spectrum-based method only identifies one clear cluster. This is a significant positive result for QuakeMigrate over the spectrum-based method since although a greater number of detected events alone provides a better temporal resolution of seismicity, the observation of multiple clusters can potentially enable investigations of a wider range of glaciological questions. For example, one could investigate the distribution of possible ‘sticky’ spots on the glacier bed, and possible corresponding topographical highs, hydrological systems or other factors. The cross-correlation template search does not provide any improvement on the spectrum-based search in this regard since the highly similar events found by the cross-correlation method are unlikely to be highly similar across multiple spatial locations.
One final comparative result is that not all the events detected by the spectrum-based method are detected by QuakeMigrate. This could be due to several reasons. Firstly, the QuakeMigrate method requires the overall energy arriving at a number of stations to be above the coalescence threshold, whereas the spectrum-based method simply requires detectable energy to be observed at four stations. This means that the spectrum-based method could be more sensitive than QuakeMigrate in certain instances, such as where four stations may have a detectable signal, but noise on other stations inhibits QuakeMigrate from finding a sufficient coalescence of energy for a detection. Here, the spectrum-based method would still detect an event. A second reason could be that the spectrum-based method is more easily applied over a large range of frequencies, especially higher frequencies. It could be that QuakeMigrate is missing certain events because of the frequency-dependence induced by the STA/LTA onset function values. Another potential reason could be that there is possible overlapping in time between some basal events and surface crevassing. However, this last reason is unlikely for most events since it was possible to manually pick phase arrivals for events detected using the spectrum-based method.
Overall, although QuakeMigrate misses some basal events that the spectrum-based method detects, according to our metrics QuakeMigrate performs better than the spectrum-based method, having a higher detection rate, a lower incorrect-event-identification-rate, and detects additional, spatially independent clusters of activity that would otherwise be absent from our icequake event catalogue.
Rutford Ice Stream icequake detection
The challenging nature of the Skeidararjökull dataset, with low SNR basal icequakes is hypothesised to because of the geographical location. Skeidararjökull has high surface snow accumulation and ablation rates at the deployment site, leading to the poor coupling between the seismometers and the glacier. It is also a temperate glacier, likely resulting in higher attenuation than if the entire ice column were well below the ice melting point. The glacier moves at  $\lt 100\,{\rm m}\,{\rm a}^{-1}$, a slower speed than many other glaciers studied seismologically.
To investigate whether this does indeed affect the performance of QuakeMigrate, we also apply the QuakeMigrate method to data from Rutford Ice Stream, West Antarctica (Smith and others, Reference Smith, Smith, White, Brisbourne and Pritchard2015). Figure 8 presents the results. The results are similar to the earlier analysis of Smith and others (Reference Smith, Smith, White, Brisbourne and Pritchard2015), as expected. We detect over 1000 events over a period of 2 days, with the majority of events located near the ice/bed interface (Fig. 8). The Rutford Ice Stream moves four times faster than Skeidararjökull, at 377 m a−1 (Murray and others, Reference Murray, Smith, King and Weedon2007). The site of the network on the ice stream surface is within the accumulation zone, so the instruments remain well coupled to the glacier for longer. Furthermore, the Rutford Ice Stream is significantly thicker than Skeidararjökull, making it easier to discriminate between surface and basal events. There are also fewer crevasses, resulting in fewer surface crevassing events to discriminate from basal icequakes. These data, therefore, demonstrate the potential performance of QuakeMigrate on a higher SNR data than the Skeidararjökull dataset.
Plot of QuakeMigrate detected icequake hypocentres at the Rutford Ice Stream, Antarctica, for the 20–21 January 2009. All events detected are relocated using NonLinLoc. The ice surface and ice/bed interface are indicated by the blue and grey lines, respectively (King and others, Reference King, Pritchard and Smith2016). The RGB background image is Copernicus Sentinel 2A data 2016, processed by ESA. Inset satellite image of Antarctica is a LandSat image.
DISCUSSION
Application of QuakeMigrate for basal icequake detection: advantages
Our results show that QuakeMigrate can be used as an effective tool for basal icequake detection. Although spectrum-based and other icequake detection methods have proven effective in certain instances, our results show that for a glacier with significant surface crevassing noise, QuakeMigrate outperforms the spectrum-based method in discriminating basal from near-surface icequakes. There are a number of advantages. The higher number of basal icequake detections provides a better spatial and temporal understanding of icequake activity. It detects greater numbers of events even than a cross-correlation template search in addition to the spectrum-based method. The lower rate of incorrect event identifications using QuakeMigrate reduces the time taken to produce a basal icequake catalogue from a dataset dominated by noise, or by surface events.
There are several reasons why QuakeMigrate is significantly more effective than other icequake detection methods. Firstly, QuakeMigrate triggers event detections based upon coalescence of both P and S energy arriving at multiple stations. This allows for more effective discrimination of surface crevassing events than for other methods since the energy from crevassing is dominated by dispersive surface waves, whose energy in the time domain appears more dispersed and therefore coalesces more weakly. The body waves are also attenuated over length scales smaller than that of the seismic network used in this study, likely due to a firn layer, and increased water content and fractured ice near the glacier surface. It is, therefore, less likely that one would obtain a high coalescence of energy for a crevassing event compared to a basal event at the same distance, although some crevassing events are still of sufficiently large amplitude to coalesce above the detection threshold. Secondly, QuakeMigrate is effective because it provides a physically rigorous estimation of phase arrival time uncertainty. These arrival time uncertainties can be used in hypocentre relocation by NonLinLoc, resulting in better hypocentral locations and more reliable estimations of the associated uncertainty metrics calculated by NonLinLoc, for example  $\sigma _z^2$, a measure of uncertainty in depth, and t rms a measure of the overall residual timing error associated with an event. The more accurate hypocentral locations and their associated uncertainties can be used to more effectively filter the data to reduce the number of incorrect event identifications (see Appendix A for further details). QuakeMigrate also likely detects more events than the spectrum-based method because it can be applied using wider frequency bands that span ranges associated with other noise sources since the detection of an event is more involved than simply searching for changes in the amplitude of energy in a particular frequency band.
QuakeMigrate can be fully automated, with results ready for input to location algorithms such as NonLinLoc (Lomax and Virieux, Reference Lomax and Virieux2000) once suitable detection parameters have been determined. The spectrum-based method, however, requires further phase arrival time picking, as undertaken manually in this study. Additional processing steps could also be undertaken after initial detection using QuakeMigrate that would further improve the performance of QuakeMigrate. One such example could be applying the surface wave dispersion filtering used in the spectrum-based method workflow to identify and remove surface crevassing events from the automatically detected QuakeMigrate catalogue. This would obviously enhance the effective removal of crevassing events from the catalogue, although it has not been applied here so as to show the effectiveness of QuakeMigrate in isolation.
The data used in this study have high rates of surface crevassing and other surface noise compared to many other glacial seismology datasets. This dataset therefore provides a particularly challenging dataset within which to search for basal icequakes. QuakeMigrate should therefore provide a useful tool in the search for basal icequakes in other similarly noisy environments such as outlet glaciers of the Greenland ice sheet, alpine glaciers in summer months and fast-moving Antarctic ice streams.
Application of QuakeMigrate for basal icequake detection: limitations
One limitation of the QuakeMigrate method is the incorrect-event-identification-rate. Only 20% of the potentially basal icequakes area actually found to be of basal origin after manual phase picking and relocation. However, the incorrect-event-identification-rate is at least partially due to the challenging nature of this dataset. A number of the incorrect event identifications are likely basal icequakes, but with insufficient energy to allow manual picking of arrival times. Poorly located surface crevassing events do not account for every incorrect event identification. When one applies the QuakeMigrate method to a less noisy environment, such as the Rutford Ice Stream dataset, the majority of detected icequakes originate near the bed. This confirms the above hypothesis that the incorrect-event-identification-rate is at least partially due to the low SNR of the Skeidararjökull icequake dataset.
A second limitation of QuakeMigrate is that it does not detect all the basal events. While one can only detect all events above the magnitude of completeness and some events below this, the fact that the spectrum-based method detects some events that QuakeMigrate does not detect is a cause for concern. In an endeavour to detect as many icequakes as possible, the simple argument would be to use both QuakeMigrate and the spectrum-based detection methods. One could also use QuakeMigrate detected events as templates for a cross-correlation template search for further, self-similar events.
A further limitation of QuakeMigrate is that it potentially requires a greater density of receivers than other methods. If some of the receivers have increased noise levels then a higher level of redundancy of receivers is required. The number of stations also affects the overall coalescence value and therefore the choice of detection threshold. Although using a greater number of receivers may initially appear preferable, if they have higher noise levels they could actually have a detrimental impact on the coalescence value and hence on the detection rate. Other methods, such as the spectrum-based method outlined in this study, may not require as many stations to be similarly effective. Unfortunately, these data are too sparse to test this. However, it is an important consideration when deciding what icequake detection method or methods to use, as well as when designing glacial seismology experiments.
While QuakeMigrate provides initial locations, and the results can be immediately relocated in NonLinLoc (Lomax and Virieux, Reference Lomax and Virieux2000), the hypocentral locations can change significantly when refined. Here, we refine all events >1 km asl, i.e. more than ~200 m below the ice surface by manually picking the phase arrival times. One could also improve the relative arrival time picks of events in the basal icequake clusters using cross-correlation and double-difference methods (e.g. Waldhauser and Ellsworth (Reference Waldhauser and Ellsworth2000); Waldhauser (Reference Waldhauser2001); Schaff and Waldhauser (Reference Schaff and Waldhauser2005); Waldhauser and Schaff (Reference Waldhauser and Schaff2008)). The accuracy of arrival time picks is also dictated to some extent by the method used to calculate the onset function. Instead of the STA/LTA function used here, one could enhance the onset function further by using a higher order method such as kurtosis (Langet and others, Reference Langet, Maggi, Michelini and Brenguier2014; Ross and others, Reference Ross, White, Vernon and Ben Zion2016). One could also use a more accurate velocity model. Here, we use a homogeneous velocity model. A more accurate velocity model, including firn or lateral variations, would theoretically result in higher coalescence values and hence better detection results. QuakeMigrate allows for 3D velocity models, but for simplicity in this study, we chose to use only a homogeneous velocity model.
There are other earthquake detection methods that have yet to be applied to icequake detection. One method that may have great potential builds on audio recognition algorithms such as Shazam (Wang, Reference Wang2003). This method, Fingerprint And Similarity Thresholding (FAST) (Yoon and others, Reference Yoon, O'Reilly, Bergen and Beroza2015), creates fingerprints of the defining features of a signal, groups similar signal fingerprints together and searches for other similar fingerprints, producing an earthquake catalogue (e.g. Yoon and others (Reference Yoon, Huang, Ellsworth and Beroza2017)). However, this method has not yet been applied in the field of icequake detection and may not work as effectively on noisy icequake datasets. Another method, ConvNetQuake (Perol and others, Reference Perol, Gharbi and Denolle2018) uses machine learning techniques for earthquake detection. The method uses convolutional neural networks to optimise a set of filter parameters to discriminate earthquakes from seismic noise for a training dataset. This method therefore is not dependent upon template matching methods and the associated limitations, and according to the authors can detect event types that are not in the training dataset (Perol and others, Reference Perol, Gharbi and Denolle2018). The ConvNetQuake could therefore provide a useful icequake detection method if it performs sufficiently well for the typically low SNR events presented in our study.
Additional potential cryoseismology applications
QuakeMigrate may also be useful for applications using seismicity to study other glacial processes. There are a number of other sources of seismicity within the cryosphere including iceberg calving, collision and grounding, englacial hydrofracture, hydrologically induced glacial tremor and ice shelf rifting (Podolskiy and Walter, Reference Podolskiy and Walter2016; Aster and Winberry, Reference Aster and Winberry2017). If the respective source radiates sufficient energy to arrive at multiple receivers locally, and if the source can be approximated as radiating from a point source or small region relative to the network of receivers, then QuakeMigrate may detect the event. Theoretically, QuakeMigrate could also potentially be used to investigate the origin of glacial tremor. However, glacial tremor can be sufficiently long in duration that a distinct packet of energy is impossible to back migrate (e.g. Roeoesli and others (Reference Roeoesli, Walter, Ampuero and Kissling2016)), a crucial criterion for the QuakeMigrate method.
CONCLUSIONS
Icequakes at or near the ice/bed interface of a glacier have the potential to be used to study the interaction of ice with the underlying till or bedrock. This is important for constraining processes such as basal sliding of glaciers and ice streams. We present a method of automatically detecting and discriminating between these basal icequakes and surface crevassing. The QuakeMigrate method introduced here involves searching through time and space for the coalescence of energy from these events. Data from Skeidararjökull, an outlet glacier of the Vatnajökull Ice Cap, SE Iceland, show that the QuakeMigrate method is effective in finding basal icequakes and automatically discriminating them from surface crevassing events. The QuakeMigrate method is also found to outperform a spectrum-based method. A higher number of basal icequakes are detected (27 vs. 6), the incorrect-event-identification-rate of basal icequake detections relative to surface crevassing and other seismic sources is lower (80 vs. 97% incorrect-event-identification-rate), and the QuakeMigrate method detects an additional, spatially independent and previously undiscovered basal icequake cluster. We also confirm that the events originate deep inside the ice by using a variety of measures including V p/V s ratios, particle motions and dispersion characteristics. Although QuakeMigrate has limitations, such as the high incorrect-event-identification-rate and it misses some events, these limitations have been shown to be less significant for more typical, less noisy icequake datasets. Software implementing both the QuakeMigrate and the spectrum-based methods are released to provide a tool for the cryoseismology community.
ACKNOWLEDGEMENTS
We thank Julian Drew for contributions to the development of the QuakeMigrate software. The QuakeMigrate software is made freely available for research use and can be found on online (https://github.com/Ulvetanna/QuakeMigrate). The spectrum-based method software, SpectDetect, is also made freely available for research use and can be found on GitHub (https://github.com/TomSHudson/SpectDetect) and is available on the Python repository. Users of this software should acknowledge this paper and ?, if appropriate. We thank Hunter Philson for helping collect the Skeidararjökull data and Robert Green for helping preprocess it. We thank Finnur Pálsson and the University of Iceland Glaciology Group for the Skeidararjökull surface and bed topography. We thank Andy Smith for leading the Rutford Ice Stream project, Hamish Pritchard for collecting the Rutford data and Emma Smith for help deciding on initial QuakeMigrate detection parameters to use. We thank Fabian Walter and his group for their contribution to a practical icequake detection session at the POLENET Glacial Seismology Training School (2017), upon which certain aspects of the spectrum-based method are based. We also thank the reviewers for constructive feedback that helped improve this study. Tom Hudson was funded by a the Cambridge Earth System Science NERC Doctoral Training Partnership. The Skeidararjökull data collection was funded by a BAS innovation grant and NERC Geophysical Equipment Facility Loan 1022. The Rutford data collection was funded by NERC grant NE/B502287/1 and NERC Geophysical Equipment Facility Loan 852. University of Cambridge, Department of Earth Sciences contribution number 4390.
APPENDIX A. Choice of NonLinLoc filter parameters for the QuakeMigrate catalogue of events
As QuakeMigrate provides uncertainty estimates for the phase arrival times of energy from the icequakes, one can use the statistical measures calculated by NonLinLoc (Lomax and Virieux, Reference Lomax and Virieux2000) to filter likely incorrectly identified events. Here, we use a combination of the square of the uncertainty in vertical location,  $\sigma _z^2$, and the root-mean-square time residual, t rms, a measure of the overall timing uncertainty of an event. As QuakeMigrate provides realistic estimates of arrival time errors, $\sigma _z^2$ and t rms are therefore realistic physical quantities.
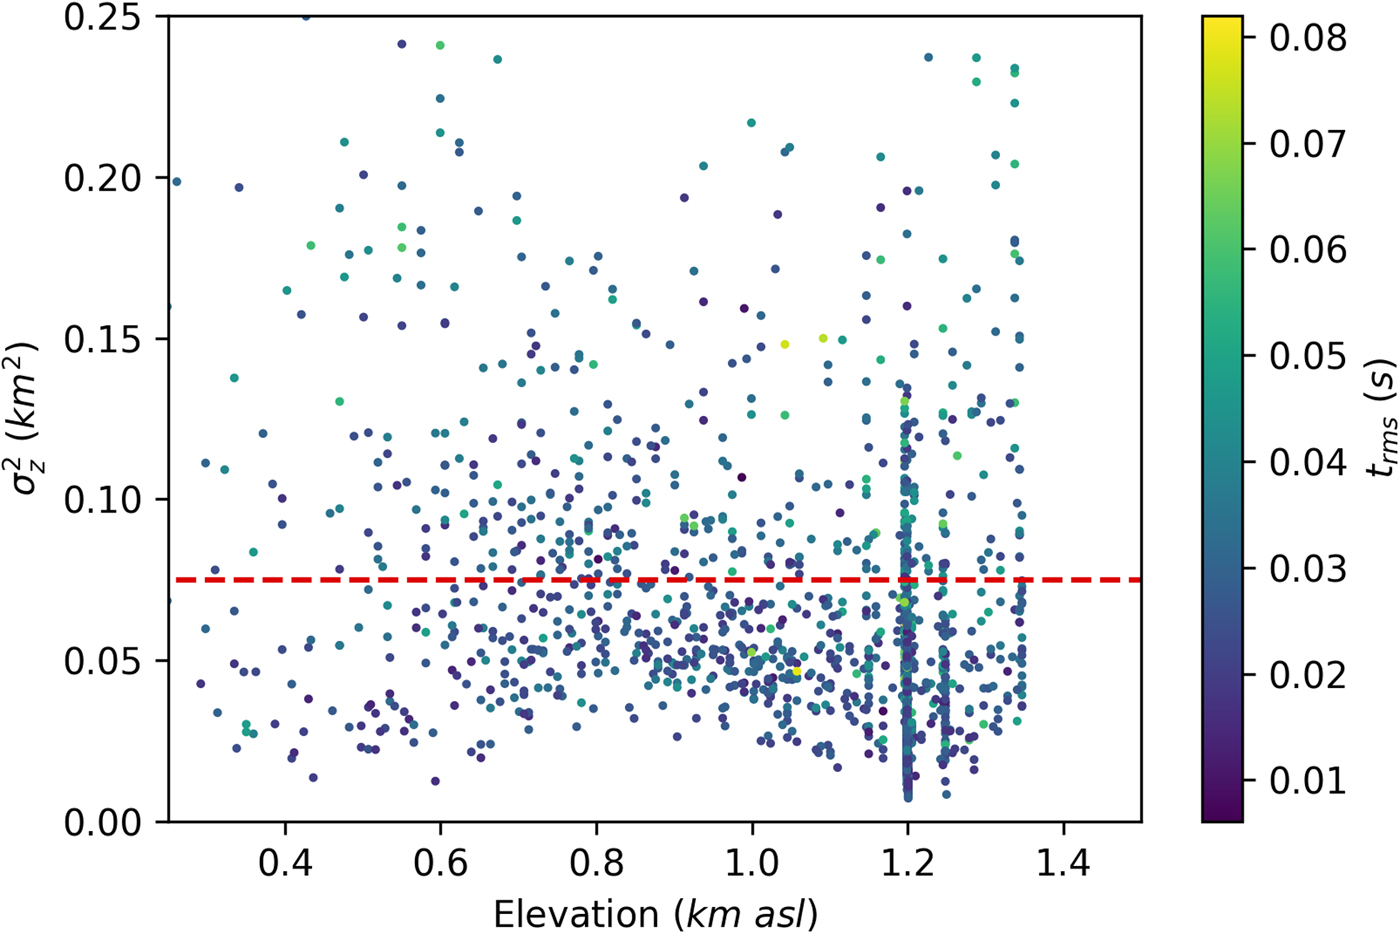
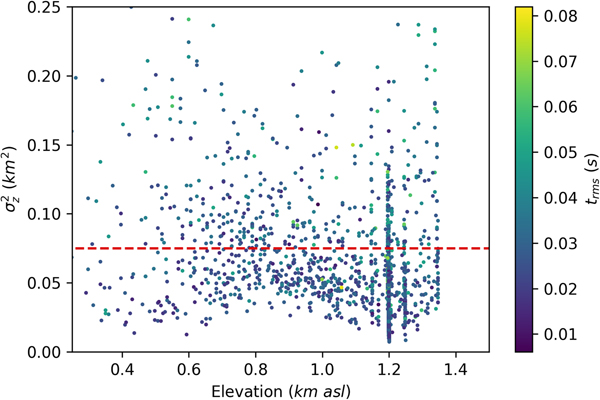
To determine the values of  $\sigma _z^2$ and t rms used to filter the results, we look at the relationship of the parameters with the depth of events, as one would expect these physical measures of event location uncertainty to be related to the depth of an icequake. The results for all the QuakeMigrate-detected events in this study are plotted in Fig. 9. A significant number of crevassing events can be seen at 1.2 km asl. Ignoring these values, a trend can be seen where $\sigma _z^2$ values are lower near the ice surface (~1.2 km asl) and the ice-bed interface, where one might expect the majority of icequake seismicity to occur. The higher values of $\sigma _z^2$ for automatically detected events at intermediate depth within the ice are likely to be due to either: the events are surface crevassing or basal icequakes that, within uncertainty, lie at the ice surface or the ice/bed interface; or they are indeed intermediate depth events, and just have smaller amplitudes than surface crevassing or basal icequakes, leading to higher uncertainties in automatically detected phase arrival times and therefore higher location uncertainties. It is also possible to observe an approximate trend of $\sigma _z^2$ with t rms, with lower t rms value events following the aforementioned trend of $\sigma _z^2 \gt 0.075\,{\rm km}^{2}$ with depth. From this data, we therefore decided that events with (corresponding to events with depth uncertainties of >275 m) and t rms > 0.025 s are likely to be incorrect event identifications or at least events of such low amplitude that further analysis would not be possible.
Plot of  $\sigma _z^2$ against elevation asl, for the events detected by QuakeMigrate. Events are coloured by t rms.
APPENDIX B. QuakeMigrate parameters for Rutford Ice Stream icequake search
Table 4 gives the parameters used for detecting icequakes at Rutford Ice Stream, Antarctica, plotted in Fig. 8. Some of these settings are based on those used in Smith and others (Reference Smith, Smith, White, Brisbourne and Pritchard2015).
Table of specific QuakeMigrate parameters used in the detection of icequakes at the Rutford Ice Stream, West Antarctica


 Open access