

Numerous scientific studies document the harm from consumption of sugary drinks( Reference Malik, Popkin and Bray 1 ). Sugary drinks are defined as beverages that contain added sugar, including regular (non-diet) soda, fruit and juice drinks (excluding 100 % juice), sports drinks, flavoured waters, sweetened iced teas and energy drinks( 2 ). These products contribute few or no essential nutrients to the diet and typically contain 13 to 30 g of added sugar per 8 fl oz (237 ml) serving( Reference Harris, Schwartz and Brownell 3 ). Sugary drinks are the number one source of added sugar in Americans’ diets( 2 ) and a child’s likelihood of becoming obese increases by 60 % for every 8 fl oz (237 ml) sugary drink consumed per day( Reference Ludwig, Peterson and Gortmaker 4 ). Further, concerning health outcomes related to added sugar consumption, including obesity and type 2 diabetes, are increasing for youth( Reference Malik, Schulze and Hu 5 – 11 ). These health trends are particularly troubling in light of evidence that dietary habits and overweight status in childhood and adolescence are strong predictors of future health( Reference Sun, Liang and Juang 12 – Reference Franks, Hanson and Knowler 14 ). As a result, numerous organizations have called for reduced consumption of added sugar and sugary drinks, including the WHO( 15 ), US government agencies( 2 , Reference Ogden, Kit and Carroll 16 ) and US public health and medical organizations( Reference Stallings and Yaktine 17 – 20 ). Social marketing campaigns from public health departments, including New York City, Philadelphia and Los Angeles, and public interest groups also target sugary drinks in an effort to reduce their consumption( 21 – Reference Jordan, Piotrowski and Bleakley 24 ). Recent public health initiatives have also reduced the availability of sugary drinks in schools( 25 ).
There are some signs of progress. Heavy consumption (i.e. individuals consuming >2092 kJ/d (>500 kcal/d) from sugary drinks) as well as soda consumption among teens have declined( Reference Han and Powell 26 ). However, an estimated 60 % of girls and 70 % of boys aged 2–19 years consume at least one sugary drink daily( Reference Ogden, Kit and Carroll 16 ) and 36 % of high-school youth consume at least two daily( Reference Park, Blanck and Sherry 27 ). In addition, the percentage of youth consuming sports drinks and energy drinks has increased( Reference Han and Powell 26 ). Sugary drinks contribute 16 % of children’s and adolescents’ total energy intake and 41 % of all added sugar consumed( Reference Ervin, Kit and Carroll 28 ). Even pre-schoolers consume ~292 kJ/d (~70 kcal/d) from sugary drinks, while adolescent boys consume 1142 kJ/d (273 kcal/d) on average( Reference Ogden, Kit and Carroll 16 ). Higher consumption among black youth( Reference Ogden, Kit and Carroll 16 ) also raises significant concerns as they face higher risks of obesity and related diseases compared with white youth( 29 ). Furthermore, despite public health efforts to reduce consumption, parents continue to serve sugary drinks to their children, with 54 % of added sugar coming from beverages consumed by youth at home( Reference Ervin, Kit and Carroll 28 ).
Previous research indicates a variety of reasons why parents provide sugary drinks for their children, as well as barriers to reducing sugary drinks in the home( Reference Jordan, Piotrowski and Bleakley 24 ). The present paper examines one potential contributor to parents’ decisions that has received little research attention: potential misperceptions about the healthfulness of some sugary drinks. In particular, fruit drinks, sports drinks and flavoured waters may be perceived as healthier beverage options for children. For example, a recent study found that many parents consider fruit drinks and flavoured waters to be healthier alternatives to other sugar-sweetened beverages for their children( Reference Welsh, Healy and Vos 30 ). There also is a common misperception that sports drinks are beneficial for children in connection with any amount of physical activity, although paediatricians recommend that most children not consume these beverages( 31 ). However, fruit drinks contain a median of 27 g of added sugar per 8 fl oz (237 ml) serving, nearly as much as the 30 g in the same serving size of regular soda, while flavoured water and sports drinks contain a median of 14 and 13 g of sugar, contributing 209 kJ (50 kcal) per 8 fl oz (237 ml) serving( Reference Harris, Schwartz and Brownell 3 ). Children’s beverages (i.e. products marketed by companies as intended specifically for children) tend to be slightly lower in sugar due primarily to smaller, pre-packaged serving sizes. Yet even children’s fruit drinks contain a median 16 g of sugar per serving, which is more added sugar than a 4- to 8-year-old should consume in a full day( Reference Johnson, Appel and Brands 18 , 32 ).
Furthermore, marketing messages on the packaging of many sugary drink products may imply that they provide essential nutrition. For example, eight of ten children’s fruit drinks, flavoured waters and sports drinks feature claims on product packages (averaging 1·7, 4·2 and 2·9 claims/package, respectively) highlighting healthful ingredients, including vitamin C and other vitamins and minerals, electrolytes and antioxidants( Reference Harris, Schwartz and Brownell 3 ). A study of similar nutrition-related claims on high-sugar cereals found that many parents thought the claims meant that nutritionally poor products were healthy choices for their children( Reference Harris, Thompson and Schwartz 33 ). Claims about ‘natural’ ingredients also appear on the majority of packages for children’s fruit drinks, flavoured waters and sports drinks( Reference Harris, Schwartz and Brownell 3 ). In addition, one-third of children’s fruit drinks contain some juice, which is highlighted on product packages, even though the highest juice content is just 10 %( Reference Harris, Schwartz and Brownell 3 ). Finally, ingredients that may pose concerns for parents are less likely to be featured on product packaging. For example, 40 % of children’s beverages contain artificial sweeteners and 60 % contain artificial colours, but this information can be ascertained only by careful reading of the ingredient lists on the nutrition facts panel( Reference Harris, Schwartz and Brownell 3 ).
Given the need to reduce young people’s sugary drink consumption, it is important to understand potential misperceptions among parents regarding the healthfulness of different types of sugary drinks. It would also be important to understand whether parents believe that some specific sugary drink products are healthier than other products within the same category. The purpose of the present research was to identify the categories and specific brands of sugary drinks that parents provide for their children and to understand parents’ perceptions of different sugary drinks as healthy options for children, the importance of on-package ingredient claims in their purchase decisions and their concerns about common sugary drink ingredients. This information may be helpful for the public health community and nutrition and medical practitioners to better inform parents about the need to reduce consumption of sugary drinks in the home.
Methods
The sample for the current analysis was supplied by Survey Sampling International, LLC, a market research company which maintains a representative panel of US adults who have consented to participate in online research surveys. For quality control, panel members are periodically rewarded for serving on the panel but are not compensated for individual surveys. Survey Sampling International distributed an email invitation to panel members with children aged 2–17 years, who then confirmed interest in completing the survey and provided informed consent. The survey was administered using Qualtrics online survey software in 2011. An initial sample of 600 parents was augmented with additional Hispanic and black respondents to ensure a minimum of 150 responses within each group for comparative analyses. The study was determined to be exempt from review by the university’s Human Subjects Committee. The survey was pilot tested with 200 participants from the university’s School of Management’s online survey system in the spring of 2011, who also provided a qualitative assessment of the survey to identify questions that were not clear or difficult to answer.
Participants first indicated the age and gender of all their children aged 2–17 years. If the participant had more than one child, she/he was asked to answer questions about the child with the most recent birthday. Parents then selected the categories of beverages they had purchased for their child or had in their home for their child to drink in the past month, including fruit drinks, sports drinks, sweetened iced teas, regular soda and flavoured waters. For each category selected, parents indicated the brands they purchased or had in their home from a list of seven to ten brands per category. Brands with the highest US sales in 2010 were included, based on sales data purchased from Symphony IRI Group for another study( Reference Harris, Schwartz and Brownell 3 ). After answering questions about the products they provided for their child, parents rated the healthfulness of all sugary drink categories, as well as eleven specific sugary drink brands, selected from products in each category that were marketed most often to children and adolescents( Reference Harris, Schwartz and Brownell 3 ). For comparison, parents also rated the healthfulness of other beverage categories (i.e. water, plain and flavoured milk, and diet soda). In addition, parents rated their concern about serving their child beverages with ingredients commonly found in sugary drinks (i.e. sugar, high-fructose corn syrup, caffeine, artificial sweeteners, artificial colours) and the importance of specific claims indicating product ingredient and nutrient information on packages of drinks they purchase for their child (i.e. low-calorie, real/natural, vitamin C, antioxidants, low-sodium). All scales ranged from 1 (not at all important/concerned/healthy) to 9 (very important/concerned/healthy). Tables 2–4 specify the wording for each of the questions. Finally, parents answered demographic questions about themselves, including gender, age, race/ethnicity and education level.
The percentage of parents who responded 7 to 9 on the 9-point scales (i.e. responses of somewhat/very important, concerned or healthy) were coded for each variable. The χ 2 test was used to examine significant differences between parents by race/ethnicity, age of child and parents who did v. did not purchase specific drinks. Significance of multiple comparisons was adjusted using a Bonferroni corrections test. Between-subject ANOVA with Scheffé’s post hoc correction test was performed to determine differences in mean number of sugary drink categories by three child age groups (2–5 years, 6–11 years, 12–17 years). All statistical analyses were conducted using the SAS statistical software package version 9·2 (2006).
Results
A total of 986 parents with at least one 2- to 17-year-old completed the survey. Four respondents who selected the same response for every question in the survey were excluded. Of the 982 respondents included in the analysis, 80 % were female and 72 % had some college education (see Table 1). The sample was highly diverse, as 46 % of respondents were non-white or Hispanic. The majority of participants (57 %) had more than one child. The children described in the survey were 49 % female and slightly more than half (53 %) were under 12 years old.
Demographic data for surveyed parents of 2- to 17-year-olds, USA, 2011
* If the parent had multiple children, she/he answered questions about the child with the most recent birthday.
Table 2 shows that 96 % of parents reported purchasing or providing sugary drinks for their child in the past month. On average, they provided drinks in 2·9 different sugary drink categories. Fruit drinks and regular soda were provided most often, by 77 % and 62 % of parents, respectively. In addition, 51 % of parents provided sports drinks for their child, 42 % provided sweetened iced teas and 39 % provided flavoured waters. Parents of 12- to 17-year-olds were significantly more likely to provide regular soda, sports drinks, iced teas and energy drinks, but less likely to provide fruit drinks. There was no difference in providing flavoured waters by age of child. Black parents were more likely than white parents to provide fruit drinks and iced teas for their child, but the total number of drink categories provided did not differ by race/ethnicity.
Percentage of parents who purchased or provided sugary drinks for their child in the past monthFootnote * in an online survey of parents (n 982) of 2- to 17-year-olds, USA, 2011
* Drink category selected in response to: ‘In the past month, which types of beverages have you purchased for your child or had in your home for your child to drink?’
† Significantly different from first column: 2–5 years for age; white for race/ethnicity (P<0·05).
‡ Significantly different from second column: 6–11 years for age; black for race/ethnicity (P<0·05).
Perceived healthfulness of sugary drink categories and brands
Table 3 shows perceived healthfulness of all drink categories and eleven specific drink brands by child’s age and race/ethnicity, as well as differences between parents who did and did not purchase the products. When asked about the healthfulness of different drink categories for their child, the majority of parents rated 100 % juice and plain milk as somewhat or very healthy (83 % and 79 %, respectively), while half rated flavoured milk as healthy. However, nearly one-half of parents also rated flavoured waters as healthy and more than a quarter of parents considered fruit drinks and sports drinks to be healthy. Fewer than 10 % of parents considered energy drinks, regular soda and diet soda to be healthy for their child. Parents of very young children were less likely to rate all categories of sugary drinks, except fruit drinks, as healthy choices for their child compared with parents of older children and adolescents. Black and Hispanic parents were more likely to rate many sugary drinks as healthy compared with white parents, including fruit drinks, sports drinks and a few branded products.
Perceived healthfulness of drink categories and sugary drink brandsFootnote * in an online survey of parents (n 982) of 2- to 17-year-olds, USA, 2011
* Percentage of parents who responded 7–9 (somewhat/very healthy) on a scale of 1 to 9 to: ‘Please rate how healthy you think each beverage is for your child’.
† Categories and brands are listed in order of perceived healthfulness (most to least).
‡ Significantly different from the following column: percentage who provided drink category/brand for child in total sample, no for provided for child (P<0·05).
§ Significantly different from first column: 2–5 years for age; white for race/ethnicity (P<0·05).
|| Significantly different from second column: 6–11 years for age; black for race/ethnicity (P<0·05).
Of note, parents were likely to rate the healthfulness of specific branded products differently from the drink categories to which they belong. For example, although just 30 % of parents rated fruit drinks healthy as a category, 43 % and 36 % rated Sunny D® and Capri Sun® fruit drinks as healthy. Similarly, 56 % rated Vitamin Water® as healthy, compared with 48 % who rated the flavoured water category as healthy. Significantly more parents also considered Gatorade®, Snapple®, Lipton Brisk® and Sprite® to be healthier than their respective categories overall. Capri Sun Roarin’ Waters®, Kool-Aid® and Red Bull® were the only brands that parents were less likely to rate as healthy compared with the overall category to which they belong. There were a few significant differences by demographic group. For example, parents of adolescents were more likely to rate Gatorade and Lipton Brisk as healthy for their child compared with parents of 6- to 11-year-olds, although these parents rated the healthfulness of the sports drink and iced tea categories similarly. More black parents also rated Gatorade and Capri Sun Roarin’ Waters as healthy compared with white parents, but there were no significant differences between black and white parents’ ratings of the sports drink and flavoured water categories.
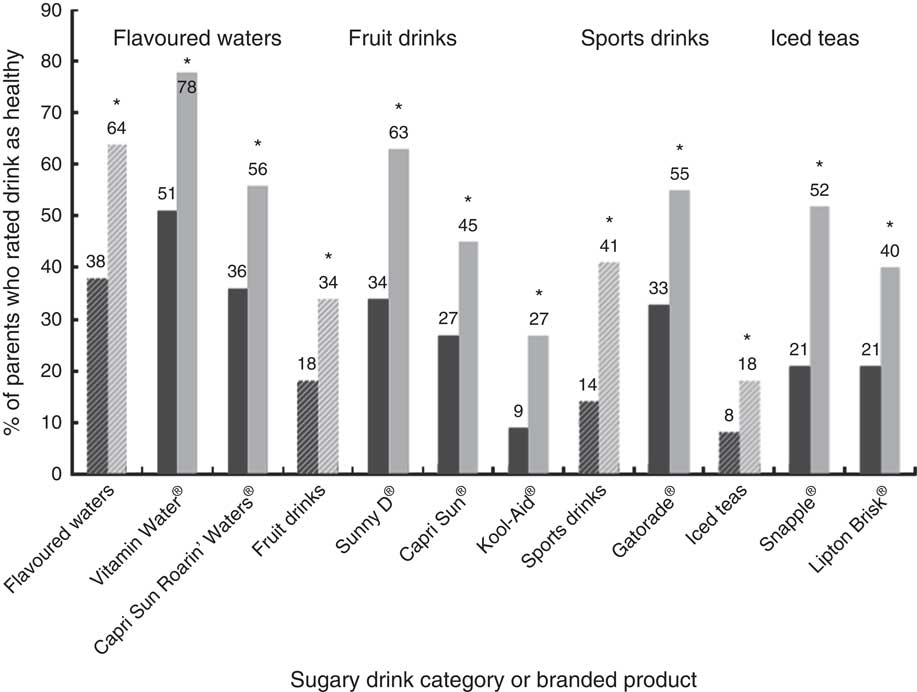
In addition, parents who reported purchasing a given category of sugary drinks were significantly more likely to rate that category as healthy compared with parents who did not purchase any sugary drinks from the category, and these incremental differences were quite high. The smallest difference in healthfulness ratings between parents who did v. did not purchase the drinks for their children was found for flavoured waters: 64 % of parents who purchased flavoured waters rated them as healthy v. 38 % of parents who did not purchase them, a difference of 68 %. The biggest difference was found for sports drinks: parents who purchased sports drinks for their children were almost three times more likely to rate them as healthy (41 %) than the 14 % of parents who did not purchase them. Similar patterns were found in perceived healthfulness of specific brands of drinks when comparing parents who did and did not purchase them. For instance, 78 % of parents who purchased Vitamin Water considered it to be healthy for their child compared with 51 % of those who did not purchase the product. More than half of parents who purchased Sunny D, Gatorade, Capri Sun and Snapple considered these drink brands to be healthy (Fig. 1).
Perceived healthfulness of selected sugary drink categories (diagonal hatched bars) and brands according to provision (![]() , parent did not provide the drink for their child;
, parent did not provide the drink for their child; ![]() , parent did provide the drink for their child) in an online survey of parents (n 982) of 2- to 17-year-olds, USA, 2011. Percentage of parents who responded 7–9 (somewhat/very healthy) on a scale of 1 to 9 to: ‘Please rate how healthy you think each beverage is for your child’ (note: the eight healthiest rated products and corresponding categories are shown). *Significantly different from parents who did not purchase the drink for their child (P<0·05)
, parent did provide the drink for their child) in an online survey of parents (n 982) of 2- to 17-year-olds, USA, 2011. Percentage of parents who responded 7–9 (somewhat/very healthy) on a scale of 1 to 9 to: ‘Please rate how healthy you think each beverage is for your child’ (note: the eight healthiest rated products and corresponding categories are shown). *Significantly different from parents who did not purchase the drink for their child (P<0·05)
On-package marketing
Parents’ concern about serving drinks that contain common ingredients and the importance of ingredient-related claims in purchasing specific drink products for their child are shown in Table 4. Two-thirds of parents reported concern about caffeine in their child’s drinks and 55–59 % reported concern about artificial sweeteners, high-fructose corn syrup and sugar. Concern about caffeine was highest among parents of the youngest children and lowest among parents of adolescents. Parents of adolescents were also less likely to be concerned about sugar in their child’s drinks compared with parents of younger children. Compared with white parents, black parents were significantly more likely to be concerned about all of the surveyed ingredients, except artificial sweeteners, while Hispanic parents were more likely to be concerned about sugar and artificial colours.
Parents’ concern about drink ingredients and the importance of on-package claims in an online survey of parents (n 982) of 2- to 17-year-olds, USA, 2011
* Percentage responding 7–9 (somewhat/very concerned) on a scale of 1 to 9 to: ‘How concerned are you about serving your child beverages that contain these ingredients?’
† Percentage responding 7–9 (somewhat/very important) on a scale of 1 to 9 to: ‘How important is it for you to purchase drinks with the following labels for your child?’
‡ Significantly different from first column: 2–5 years for age; white for race/ethnicity (P<0·05).
§ Significantly different from second column: 6–11 years for age; black for race/ethnicity (P<0·05).
One-third or more of parents indicated that each of the ingredient claims on drink packages was somewhat or very important to their decision to purchase sugary drinks for their child. The importance of each claim did not differ by their child’s age, but there were differences by race/ethnicity. White parents were more likely than black parents to rate low-calorie and vitamin C claims as important, while white parents were more likely to rate antioxidant and real/natural claims important compared with Hispanic parents.
Discussion
Nearly all parents in the present sample provided sugary drinks for their child and the number of sugary drinks provided increased with the child’s age. Parents of adolescents provided sugary drinks in more than three categories on average and were more likely to provide products in every category except fruit drinks and flavoured waters. However, even 82 % of parents of pre-schoolers provided sugary drinks for their child.
Most parents reported that some of these drinks are not healthy. For example, two-thirds of parents provided regular soda for their children, but only 6 % believed that it was somewhat or very healthy. Similarly, 42 % provided sweetened iced tea although just 18 % rated it as healthy. However, as predicted, parents’ beliefs about the healthfulness of flavoured waters, sports drinks and fruit drinks did not correspond with public health recommendations. Misperceptions about fruit drinks were especially problematic. Four out of five parents in the survey with children under 12 years of age reported providing these products for their children, even though these drinks contain the same amount of sugar on average as regular soda and typically contain 10 % fruit juice or less( Reference Harris, Schwartz and Brownell 3 ). Fruit drinks alone are the fourth largest source of fluid energy in the diets of children aged 2–18 years, providing an average of 385 empty calories (1611 kJ) per week( 2 ).
The findings also suggest that parents may not be aware of public health messages about the need to reduce consumption of drinks with added sugar or they may not understand that these messages apply to all drinks, not just regular soda. It is interesting to note that parents were ten times more likely to consider flavoured waters to be healthy and six times more likely to consider fruit drinks to be healthy compared with regular soda. Public health campaigns targeted to parents could also focus on the high sugar content of other categories of drinks and specifically address misperceptions of the healthfulness of fruit drinks, sports drinks and flavoured waters. In addition, parents’ concern about added sugar in drinks that they serve their child was relatively low compared with their concern about other ingredients examined, including caffeine, artificial sweeteners and high-fructose corn syrup. It is also worrisome that black and Hispanic parents were more likely to rate fruit drinks, sports drinks and some sugary drink brands as healthy compared with white parents, as black and Hispanic children also face greater risk of obesity and many diet-related diseases( Reference Ogden, Carroll and Kit 10 , Reference Ervin, Kit and Carroll 28 ). Public health campaigns in communities of colour may need to focus more on these other sugary drink categories.
Finally, it appears that general knowledge about the healthfulness of categories of sugary drinks does not necessarily translate to perceptions of individual drink brands within those categories. Although parents rated a few brands as less healthy than the overall category to which they belong (e.g. Kool-Aid fruit drink and Capri Sun Roarin’ Waters flavoured water), in most cases they perceived specific brands to be healthier than the category overall. Even Sprite and Gatorade were considered to be significantly healthier than regular soda and sports drinks in general. The difference in perceived healthfulness of specific beverage brands between parents who did and did not provide these drinks for their children was notable. In particular, it appears that parents may select Vitamin Water, Sunny D, Red Bull, Capri Sun Roarin’ Waters and Snapple because they believe that they are nutritious options for their child. Of note, in a lawsuit against Vitamin Water, the company’s defence stated, ‘No consumer could reasonably be misled into thinking Vitamin Water was a healthy beverage’( 34 ). Yet 51 % of parents in the current sample purchased Vitamin Water for their child and 78 % of those who purchased it rated it as healthy.
Potential influence of sugary drink marketing messages
Also as predicted, on-package ingredient claims appear to contribute to common misperceptions about sugary drink product healthfulness. One-third or more of parents indicated that they specifically look for claims such as ‘low-calorie’, ‘real/natural’, ‘vitamin C’ and ‘antioxidants’ when choosing drinks for their children. Of note, these claims are most prevalent on packaging for sugary drinks in the categories that parents most often perceive as healthy (i.e. children’s fruit drinks, sports drinks and flavoured waters)( Reference Harris, Schwartz and Brownell 3 ). On the other hand, parents’ reported concern about artificial sweeteners is inconsistent with their provision of many children’s fruit drinks that contain these ingredients. This finding suggests that parents may not realize that many fruit drinks contain both sugar and artificial sweeteners( Reference Harris, Schwartz and Brownell 3 ). This discrepancy highlights the need for more transparent reporting of ingredients to allow parents to make informed choices about drinks they select for their children.
However, parents also continue to regularly purchase drinks that they do not believe are healthy for their children, such as soda. A plausible reason for these purchases despite public health warnings is the prevalence of marketing for these products. In 2010, beverage companies spent $US 784 million on media to advertise sugary drinks( Reference Harris, Schwartz and Brownell 3 ). Adolescents viewed an average of 406 television advertisement for these products, while pre-schoolers and children viewed 213 and 277 advertisements, respectively( Reference Harris, Schwartz and Brownell 3 ). In addition, beverage companies target children and adolescents directly, spending $US 395 million in 2009 on all forms of youth-directed marketing, including marketing in schools, promotions in stores and local events( 35 ). Youth-targeted marketing expenditures on carbonated beverages were exceeded only by marketing expenditures by fast-food restaurants. Exposure to sugary drink advertising on television is associated with greater consumption among children( Reference Andreyeva, Kelly and Harris 36 ). It is interesting to note that parents cite ‘making their children unhappy’ and ‘making eating meals less enjoyable’ as significant barriers to reducing sugar-sweetened beverage consumption in their households( Reference Jordan, Piotrowski and Bleakley 24 ).
Marketing for sugary drinks also likely influences many parents’ purchases and attitudes about these products. In 2010, adults saw on average 364 television advertisements for sugary drinks, or approximately one per day( Reference Harris, Schwartz and Brownell 3 ). Of special concern is marketing of children’s sugary drinks to parents. These marketing messages, reinforced by ingredient claims on product packages, imply that these drinks are appropriate and even good for children. For example, in 2010 beverage companies spent $US 57 million to advertise children’s fruit drinks, including Capri Sun, Sunny D and Kool-Aid, much of it targeted to parents with messages that these products are fun and nutritious options for children( Reference Harris, Schwartz and Brownell 3 ). It is also interesting to note that many parents in the present study believed that Snapple was healthier than other brands of sweetened iced tea, suggesting that the message in its advertising campaign, ‘The best stuff on Earth’( 37 ), may also lead to inferred health benefits. Further research is needed to examine the direct effects of marketing on parents’ purchases of sugary drinks for their children. However, generally more positive perceptions of the healthfulness of specific brands, especially among parents who purchased those brands, indicate that marketing may influence parents’ beliefs about these products.
The current research does have limitations. The specific scales used in the study were not tested for validity or reliability. However, they were developed according to attitude measurement methods widely used in marketing research( Reference Stevens, Wrenn and Loudon 38 , Reference Aaker, Kumar and Day 39 ). As in the present survey, market researchers commonly use attitude scales to measure consumers’ beliefs about the characteristics and attributes of products and brands and judgements about the relative importance of different attributes. Marketing research attitude measures such as these have been found to be reliable and predictive of future purchase behaviours( Reference Stevens, Wrenn and Loudon 38 , Reference Aaker, Kumar and Day 39 ). In addition, due to the use of an online survey panel and recruitment of additional black and Hispanic parents, it does not reflect a representative sample of US parents. However, this methodology provided a highly diverse sample and enabled comparisons by race/ethnicity to specifically assess parents of children who face the greatest health risks from consumption of sugary drinks. The responses also are self-reported and subject to presentation bias. However, given that most parents reported serving products to their children that they considered to be unhealthy this concern appears to be minimal.
Conclusions
Understanding parents’ misperceptions about the healthfulness of some categories of sugary drinks, especially fruit drinks, sports drinks and flavoured waters, as well as the importance parents place on ingredient claims on product packages, such as real/natural and vitamin C, can help shape effective public health messages about reducing sugary drink consumption. This information will assist registered dietitians, paediatricians and public health professionals to more effectively inform patients, clients and the public about the need to reduce consumption of added sugar and help parents select truly healthy beverages for their children. In addition, the current research highlights the need for increased attention to ingredient claims on product packaging and other marketing messages that may mislead parents to believe that some sugary drinks are healthful options for their children.
Acknowledgements
Acknowledgements: The authors would like to thank Sai Liu for her assistance in preparing the manuscript. Financial support: This research was supported by the Robert Wood Johnson Foundation and the Rudd Foundation. The Robert Wood Johnson Foundation and the Rudd Foundation had no role in the design, analysis or writing of this article. Conflict of interest: None. Authorship: C.R.M. and J.L.H. formulated the research questions, designed the study and carried out the study. V.S. analysed the data. C.R.M. and J.L.H. wrote the manuscript. All authors contributed to editing and finalizing the manuscript. Ethics of human subject participation: This study was determined to be exempt from review by Yale University’s Human Subjects Committee.


