


Introduction
Weedy flowers provide pollen and nectar resources to pollinators in urban landscapes (Bretagnolle and Gaba Reference Bretagnolle and Gaba2015; Hicks et al. Reference Hicks, Ouvrard, Baldock, Baude, Goddard, Kunin, Mitschunas, Memmott, Morse, Nikolitsi, Osgathorpe, Potts, Robertson, Scott and Sinclair2016). It is expected that dandelion (Taraxacum officinale F.H. Wigg.) and white clover (Trifolium repens L.) could be visited by up to 50 different species of pollinators, including 37 species of bees, for floral rewards in an urban turfgrass system (Larson et al. Reference Larson, Kesheimer and Potter2014). Lowenstein et al. (Reference Lowenstein, Matteson and Minor2019) found that T. repens inflorescences attracted the most pollinator visits among 106 plant taxa, including ornamental and weedy flowers, in an urban landscape study documenting 1,815 plant–pollinator interactions. Due to the common occurrence of weeds in turfgrass systems and pollinator interaction for floral rewards (Jaiswal and Joseph Reference Jaiswal and Joseph2024), the threat associated with pollinator exposure to insecticide-treated T. repens flowers also increases (Gels et al. Reference Gels, Held and Potter2002; Larson et al. Reference Larson, Redmond and Potter2013). Insecticide applications are commonly utilized in managed turfgrass systems as part of controlling insect pest outbreaks (Held and Potter Reference Held and Potter2012; Larson et al. Reference Larson, Dale, Held, McGraw, Richmond, Wickings and Williamson2017). Besides direct contact, the same systemic insecticides also pose a risk to beneficial insects due to the potential for residue transfer to the visiting pollinator through the nectar of insecticide-treated weedy flowers (Larson et al. Reference Larson, Redmond and Potter2013, Reference Larson, Kesheimer and Potter2014). Furthermore, honey bees (Apis mellifera, Hymenoptera: Apidae) and bumble bees (Bombus impatiens, Hymenoptera: Apidae) were not able to discriminate between neonicotinoid-treated and non-treated inflorescences of T. repens (Larson et al. Reference Larson, Redmond and Potter2013).
Best practices for protecting pollinators from insecticide exposure in turfgrass systems include managing weedy flowers through mowing or herbicide applications (Godara et al. Reference Godara, Williamson, Koo and Askew2023; Larson et al. Reference Larson, Redmond and Potter2015). Godara et al. (Reference Godara, Williamson, Koo and Askew2023) noted that honey bees and other pollinators evacuate a treated plot within 2 d of synthetic auxin herbicide application, although T. repens flower quality persisted for up to 5 d in weedy turfgrass. McDougall et al. (Reference McDougall, DiPaola, Blaauw and Nielsen2021) found reduced pollinator abundance, diversity, richness, and evenness in a orchard [Prunus persica (L.) Batsch var. nectarine ‘Fantasia’] where synthetic auxin herbicide was used to remove weedy flowers from the ground cover. Mowing significantly reduced imidacloprid and clothianidin residues in T. repens nectar by 99% compared with non-mowed flowers, yet it decreased the survival rate of an anthrocorid bug Orius insidiosus by 26% when it fed on guttation from imidacloprid-treated creeping bentgrass (Agrostis stolonifera L.), even post-mowing (Larson et al. Reference Larson, Redmond and Potter2015). These studies suggest the need to employ deterrent strategies to limit the foraging of pollinators on weedy flowers in turfgrass, thereby reducing insecticide exposure. However, insect visitation data from previous studies were typically collected from short observations, 1 to 2 min between approximately 10:00 AM and 4:00 PM, potentially underestimating pollinator activity beyond these times (Bohnenblust et al. Reference Bohnenblust, Anthony, Egan, Mortensen and Tooker2016; Godara et al. Reference Godara, Williamson, Koo and Askew2023). A more comprehensive assessment of honey bee contact exposure in weed-infested turfgrass following mowing or herbicide application could enhance our understanding of how effective these practices are in deterring the insects.
Previous researchers utilized fluorescent tracers for evaluating deposition rates of pesticides on plants and soil (McWhorter and Wooten Reference McWhorter and Wooten1961; Menger et al. Reference Menger, Bontha, Beveridge, Borch and Henry2020; Staniland Reference Staniland1960, Reference Staniland1961) and for spray drift studies (Fritz et al. Reference Fritz, Hoffmann and Jank2011; Szarka et al. Reference Szarka, Kruger, Golus, Rodgers, Perkins and Brain2021). Fluorescent powders (DayGlo®, Cleveland, OH) are also commonly used as a marker for arthropod species in mark–release–recapture studies due to economic viability, environmental safety, and ease of handling (Hagler and Jackson Reference Hagler and Jackson2001; Hagler et al. Reference Hagler, Mueller, Teuber, Deynze and Martin2011; Perry et al. Reference Perry, Wallin, Wenzel and Herms2017; Rodriguez-Saona et al. Reference Rodriguez-Saona, Firbas, Hernandez-Cumplido, Holdcraft, Michel, Palacios-Castro and Silva2020). Previous research utilized a Saturn Yellow® fluorescent powder (DayGlo®), which yields a vivid fluorescent green color at 494 nm when exposed to excitement wavelength in the ultraviolet (UV) spectrum (Sobeck et al. Reference Sobeck, Chen and Smith2021). Research methods involving beneficial insects, such as pollinators, should use a nonlethal marking approach to evaluate insect movement patterns (Lövei and Ferrante Reference Lövei and Ferrante2024). Fluorescent powder is nonlethal and persists for up to 3 wk on insect bodies, which can be evaluated qualitatively for traces of fluorophore under UV light (Diouf et al. Reference Diouf, Seck, Fall, Bassene, Biteye, Bakhoum and Ciss2022). Koch and Weißer (Reference Koch and Weißer1997) used fluorescent powder as a proxy for insecticides to test honey bee exposure in flowering apple orchards (Malus spp.) and phacelia (Phacelia tanacetifolia Benth.) fields. Byrne et al. (Reference Byrne, Rathman, Orum and Palumbo1996) applied fluorescent powder at 123 kg ha−1 to a melon (Cucumis melo L.) field to track the migration behavior of whitefly (Bemisia tabaci, Hemiptera: Aleyrodidae). Fluorescent powder was also used to mimic pollen on flowers in field experiments to estimate the pollen dispersal by pollinators (Campbell Reference Campbell1985), making fluorescent powder a suitable choice for application to insects and weedy flowers.
However, research investigating the effectiveness of deterrent practices aimed at preventing pollinator foraging on weedy flowers before insecticide application in managed turfgrass is lacking. The objective of this study was to assess the contact exposure of actively trapped honey bees and passively captured insects to fluorescent powder–treated T. repens inflorescences in tall fescue [Schedonorus arundinaceus (Schreb.) Dumort.; syn.: Lolium arundinaceum (Schreb.) S.J. Darbyshire] turfgrass after implementing our proposed deterrent practices. We hypothesized that honey bee exposure to fluorescent powder, utilized as a proxy for insecticide application, would be reduced after implementing deterrent treatments to T. repens inflorescences in managed turfgrass systems.
Materials and Methods
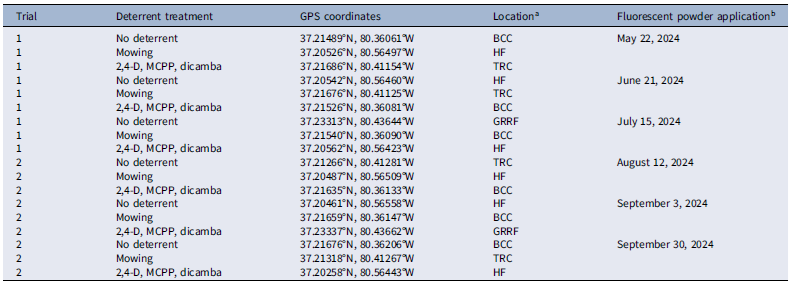
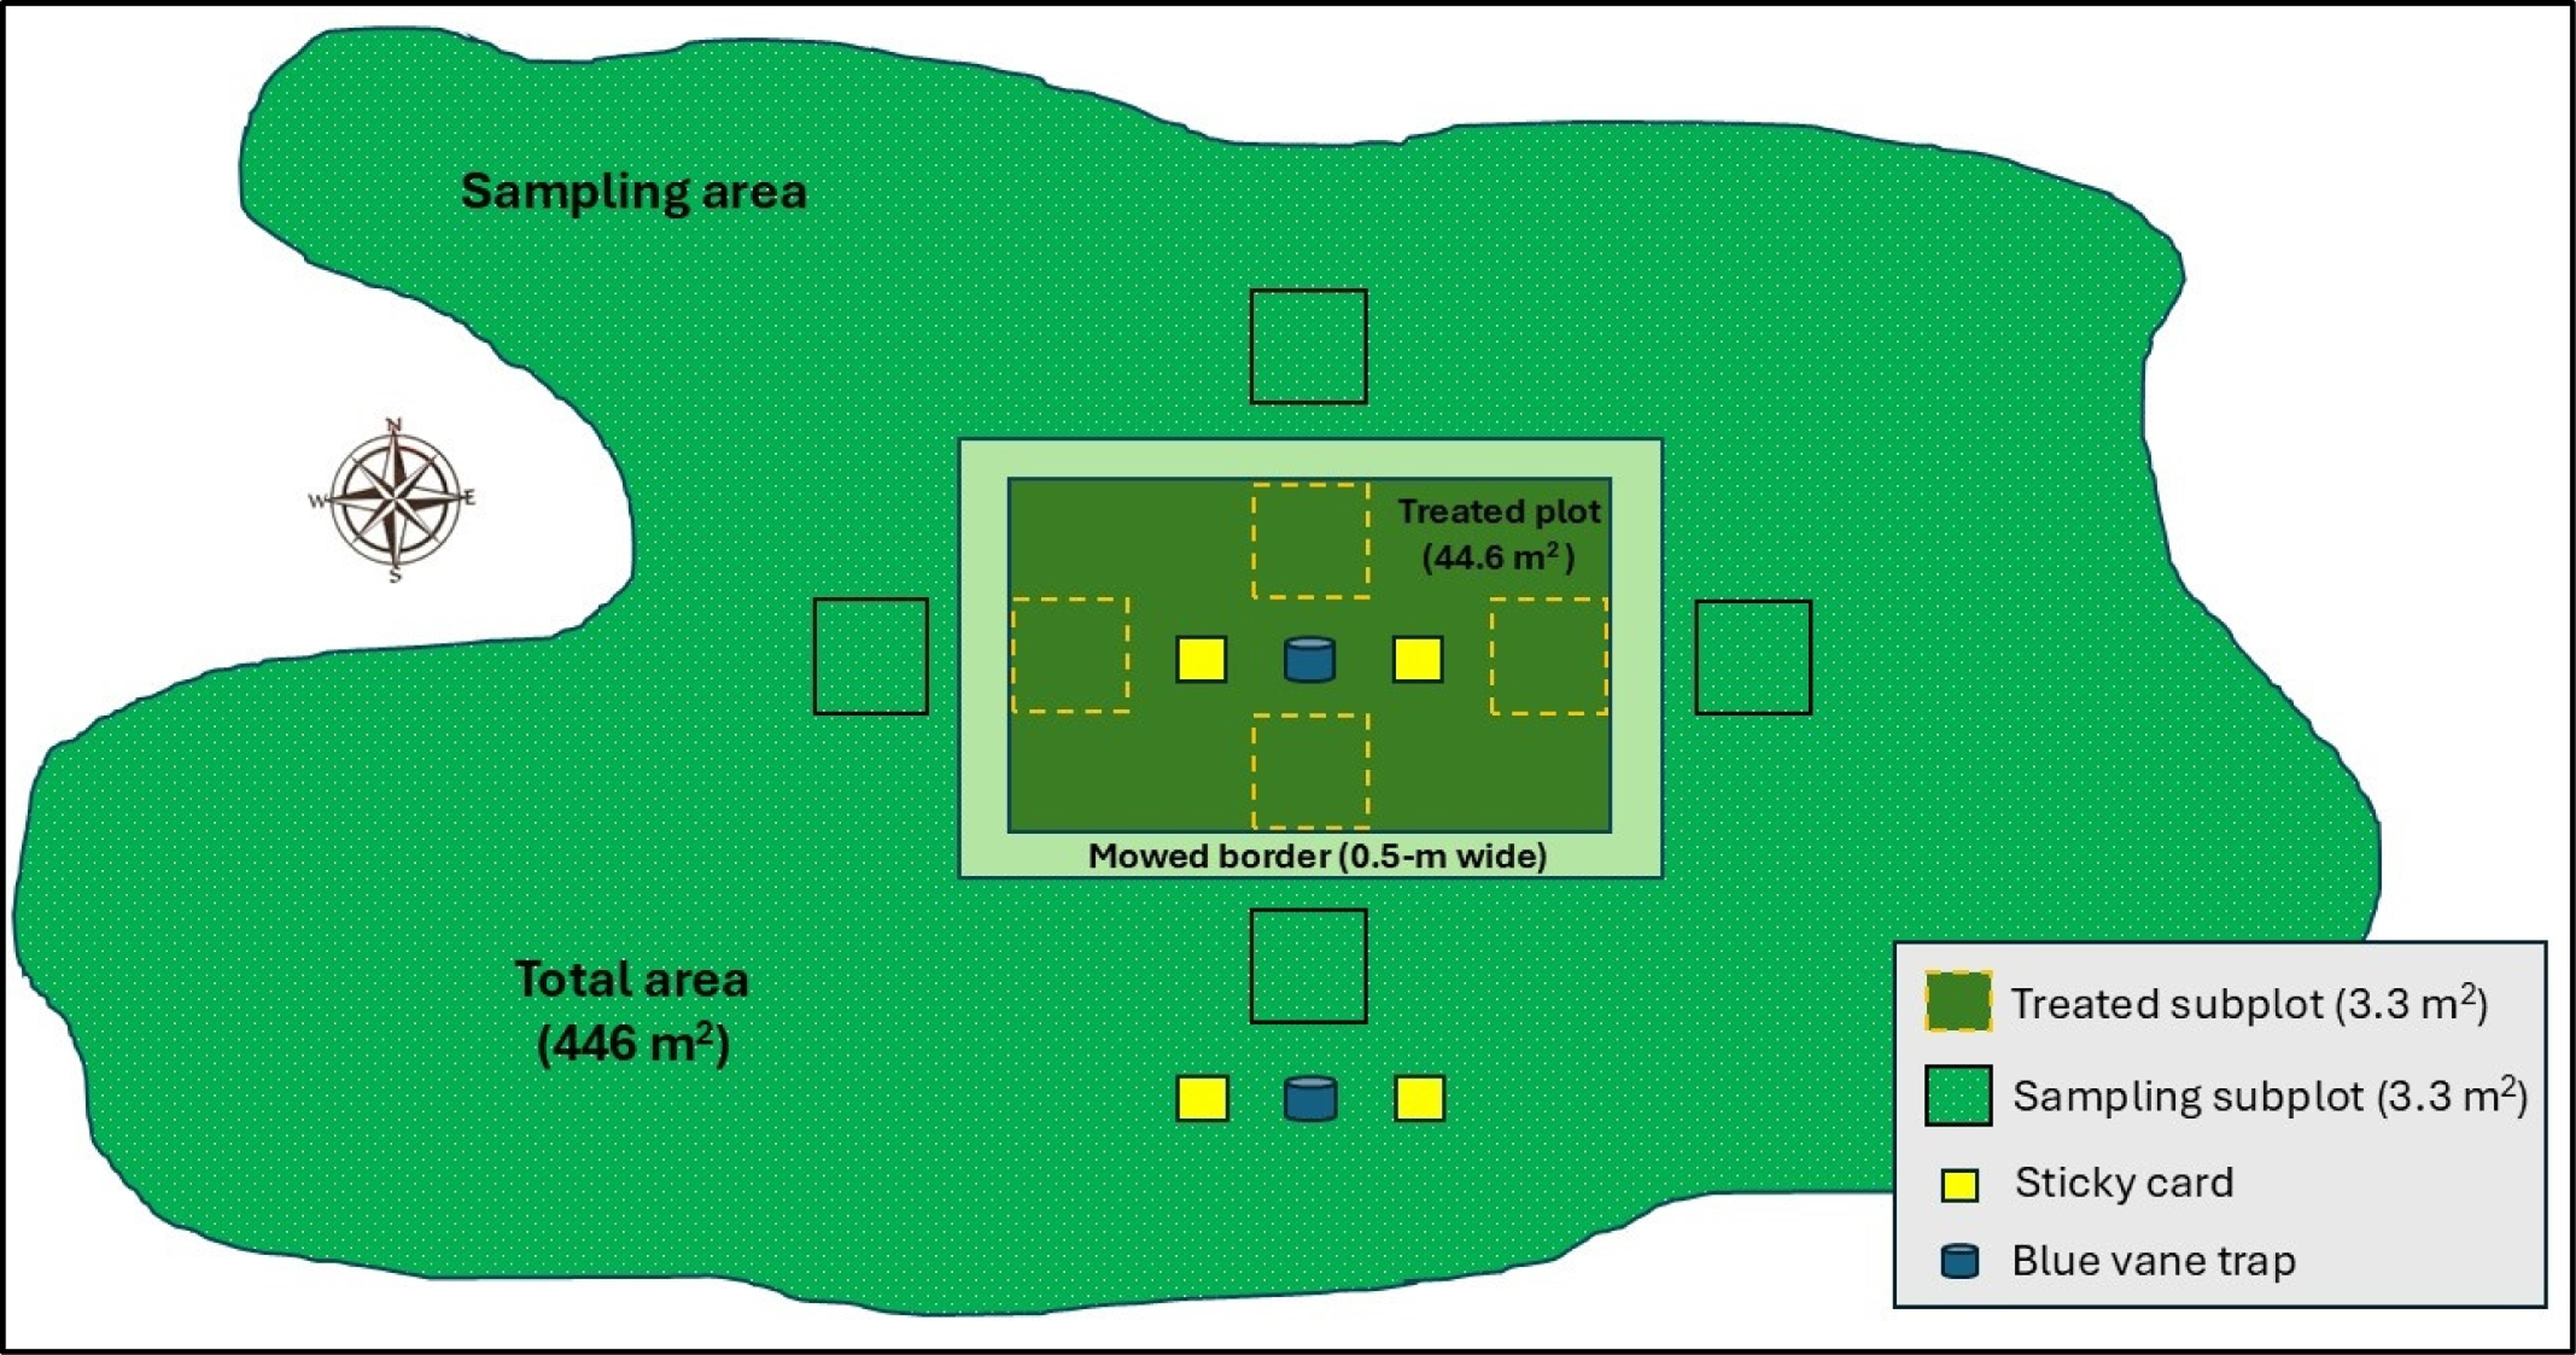
A field study was conducted in 2024 using a randomized complete block design with three treatments, each replicated three times across two trials (Table 1). Treatments were randomly assigned to one of three sites and blocked by time (Table 1). Three tall fescue turfgrass sites were chosen, each with a minimum T. repens floral density of 25 inflorescences m−2 over an area of at least 446 m2 (Figure 1). Within each site, a 44.6-m² plot served as the experimental unit for applying fluorescent powder and deterrent treatments (Figure 1). At each site, a 0.5-m-wide border was mowed to a height of 3 cm (about one-third of the original grass height) around each experimental unit to act as a visual barrier for preventing the inadvertent transfer of fluorescent powder into the sampling area due to human traffic during data collection (Figure 1). To ensure the independence of the experimental units, no two plots were placed closer than 4.5 km apart (Table 1), as this distance is beyond the typical foraging range of honey bees, which is up to 2 km (Steffan-Dewenter and Kuhn Reference Steffan-Dewenter and Kuhn2003).
Research experiments were conducted in Virginia to evaluate the effectiveness of deterrent treatments in preventing contact exposure of pollinators to fluorescent powder–treated Trifolium repens inflorescences in tall fescue turfgrass.

a Abbreviations: BCC, Blacksburg Country Club; GRRF, Glade Road Research Facility; HF, Homefield Farm; TRC, Turfgrass Research Center. All sites were in Montgomery County, VA, and were separated from one another by at least a 4.5-km radius. The three treatments were randomly assigned to these sites.
b Fluorescent powder was applied at least 22 d apart for each replication within each trial. Treatments were blocked by time.
An experimental unit layout representing the treated plot area (44.6 m2 = deterrent treatment followed by fluorescent powder application) and total plot area (446 m2 composed of Trifolium repens–infested turfgrass with a floral density of at least 25 inflorescences m−2). Four quadrats were established in each cardinal direction within and outside the treated area for floral density and insect visitation data collection. Passive traps were randomly established in any cardinal direction 1 m away from the quadrat.

Deterrent treatments included: (1) mowing (HRS216, American Honda Motor, Alpharetta, GA) the plot to a height of 5 cm to remove approximately 40% of the turfgrass canopy, including most of the T. repens inflorescences, at 0 d before applying fluorescent powder; (2) spraying the plot with a premix of 2,4-D, MCPP, and dicamba (Trimec Classic®, PBI Gordon, Shawnee, KS) at 1.52 kg ai ha−1, 2 d before applying fluorescent powder; (3) non-treated control with no deterrent treatment but fluorescent powder application at 0 d, referred to as a positive control (Table 1). Turfgrass is typically mowed to remove no more than one-third of the turf canopy (Patton Reference Patton2025). Our treatments of 40% removal were based on preliminary experiments to maximize T. repens bloom removal without significant harm to turfgrass (data not shown). Likewise, synthetic auxin herbicide premix was applied 2 d before fluorescent powder, as honey bees and other pollinators vacated the herbicide-treated area within 2 d after treatment (DAT) based on previous visual observations (Godara et al. Reference Godara, Williamson, Koo and Askew2023). Data collection was conducted over an 8-d period, initiated 1 d before applying deterrent treatments to collect baseline data for floral density and pollinator visitation and concluded 6 d after application. Mowing, fertilization, or any other turf protection product applications were suspended at all sites to maintain consistent flower density and pollinator activity throughout the experiment duration. Temporal blocks were spaced at least 22 d apart and timed to avoid periods of rainfall.
Herbicide treatment was applied using a CO2-pressurized backpack sprayer calibrated to deliver 374 L ha−1 using four extended-range flat-fan XR11006 spray nozzles (TeeJet® Technologies, Wheaton, IL) at 4.8 km h−1. A fluorescent powder (ECO 17 Saturn Yellow®, DayGlo®) with 4.5-µm particle size was used to assess pollinator exposure to treated areas after deployment of deterrent treatments. The fluorescent powder was mixed with sand particles, ranging in size from 0.25 to 1 mm, at a ratio of 1:4 using an electric motor–driven mixer (Proforce® Equipment, Miami, FL) to achieve a uniform blend. The sand was found in preliminary experiments (data not shown) to improve the flow of the powder blend through a custom 1.8 m by 1.2 m, five-screen applicator with 0.6-cm2 openings and 25 cm between screen layers. This custom device was positioned 20 times in each plot where a premeasured quantity of fluorescent powder–sand blend was dispensed at a rate of 73 kg fluorescent powder ha−1.
Active Honey Bee Sampling
Before application of deterrent treatments, 20 live honey bees were collected using vacuum-based catching devices (Bugzooka™, Trimax™ Locks/Wyers Products Group, Centennial, CO) from each experimental unit to establish a baseline for fluorescence in the laboratory before any exposure to applied fluorescent powder. An additional 80 honey bees were captured in equal measure at 4 and 28 h after treatment (HAT) with fluorescent powder from areas outside the treated plots but within the 446-m² T. repens inflorescences–infested zone with catching devices similar to those mentioned (Figure 1). Each honey bee was captured individually in a catch tube to avoid cross-contamination of residues. The honey bee specimens in the catch tube were then euthanized in a chloroform-based kill jar for 60 s. A chloroform-based kill jar accommodated over 20 catch tubes and concurrently reduced the handling time at each site. Samples were immediately placed on ice and transported to the Virginia Tech Glade Road Research Facility (37.23°N, 80.44°W) in Blacksburg, VA, for analysis of fluorescent powder exposure. Upon arrival, the samples were stored in a freezer at −20 C until the extraction process began.
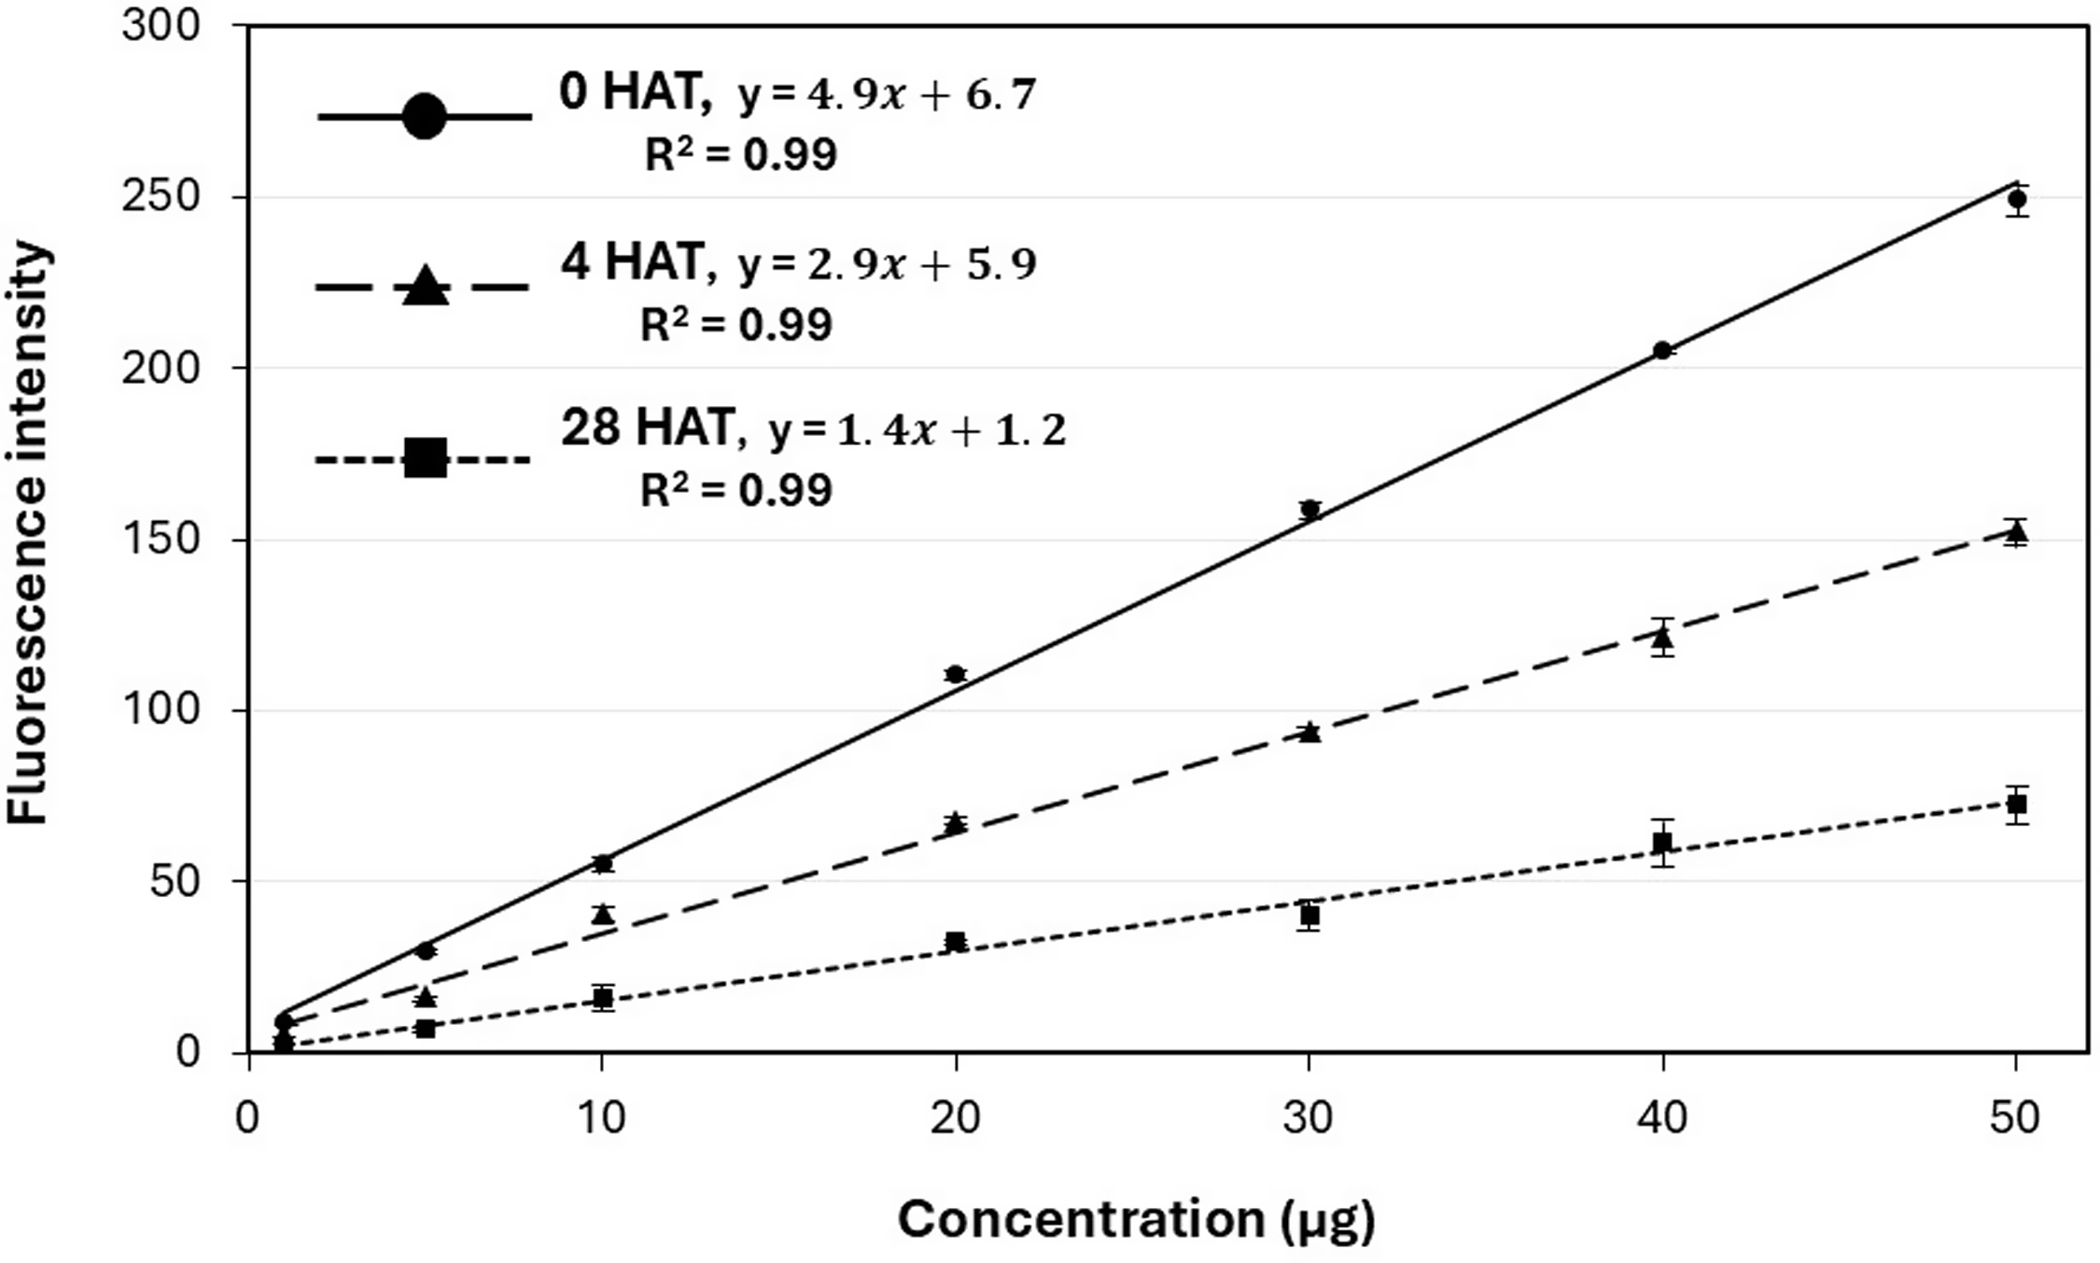
Each honey bee specimen was processed to extract fluorescent powder, creating individual samples for body rinse analysis. Preliminary tests established that an N, N-dimethylformamide (Spectranalyzed®, Fisher Scientific, Fair Lawn, NJ) and water (1:9) extraction method achieved a 91 ± 3.6% efficiency in removing fluorescent powder from honey bees after two rinses (data not shown). Each rinse consisted of 2 ml of the rinsing solution. Fluorescent powder intensity was measured using a QEPRO-XR spectrometer (Ocean Insight, Orlando, FL) equipped with a PX-2 pulsed xenon lamp (Ocean Insight). After visible light was blocked with a bandpass filter (Ocean Insight), excitation energy in the UV spectrum was redirected into the spectrometer using a 1-cm cuvette-shaped piece of Teflon (CVD-Diffuse, Ocean Insight) placed at a 45° angle in the fluorescence cuvette holder (Square One Cuvette Holder, Ocean Insight) for calibration. The amount of fluorescent powder per bee was quantified using standard curves that correlated fluorescence intensity with powder concentration (Fritz et al. Reference Fritz, Hoffmann and Jank2011), allowing comparison across different treatments (Figure 2). For preliminary experiments and baseline fluorescence detection, the standard curve was developed using fluorescent powder that had not been exposed to solar radiation (Figure 2). For honey bees collected at 4 and 28 HAT with fluorescent powder, the standard curve was adjusted to account for solar radiation exposure by placing petri dishes (100-mm diameter, Kimble® Kimax®, DWK Life Sciences, Millville, NJ) in the field accordingly (Figure 2). The average fluorescence intensity from 20 honey bees, collected for baseline detection in each plot, was subtracted from all other samples as background noise before data analysis.
Standard curves were used to calculate fluorescent powder concentration based on fluorescence intensity for samples not exposed to solar radiation, exposed for 4 h, and 28 h after treatment (HAT) under field conditions.

Passive Pollinator Sampling
Double-sided yellow sticky cards (20 cm by 14 cm, Alpha Scents, West Linn, OR) were deployed at a height of 25 cm above turfgrass canopy for 28 HAT with fluorescent powder (Figure 1). Two sticky cards were installed in the center of the treated area, while the other two were randomly positioned in one of the cardinal directions outside the treated area (Figure 1). Each card was evaluated under a stereoscope (SMZ1270, Nikon, Tokyo, Japan) equipped with a UV light source (Everbeam®, Surrey, Canada) emitting 315 to 405 nm with a peak at 365 nm for the presence or absence of fluorescent powder on lepidopterans, hoverflies, and beetles captured on both sides. These taxa were selected based on their higher probability of interacting with inflorescences. Two blue vane traps (BanfieldBio™, Seattle, WA) were installed, inside and outside the treated area for 28 HAT with fluorescent powder (Figure 1). These traps were composed of two 3-mm-thick, 24 cm by 13 cm polypropylene cross vanes placed perpendicularly at the top of a blue funnel placed over 2-L-capacity clear plastic jars (12-cm diameter and 18-cm height). Plastic jars were installed 5 cm below the turf canopy, and blue-colored funnels and vanes were at least 12 cm above the turf canopy. Joshi et al. (Reference Joshi, Leslie, Rajotte, Kammerer, Otieno and Biddinger2015) reported blue vane traps as the most effective trap type for collecting bees after a 3-yr study, which recorded more than 14,500 bees from 118 species. Previous researchers used an ethylene glycol–based medium to trap insects (Joshi et al. Reference Joshi, Leslie, Rajotte, Kammerer, Otieno and Biddinger2015; Turley et al. Reference Turley, Biddinger, Joshi and López-Uribe2022), but we utilized double-sided yellow sticky cards in the clear jar to trap the insects and to avoid dilution of fluorescent powder concentration over the study period. Bee species from vane traps were identified using guides and published dichotomous keys (Ascher and Pickering Reference Ascher and Pickering2020; Levenson and Youngsteadt Reference Levenson and Youngsteadt2019; Williamson et al. Reference Williamson, Hennen and Marek2018).
Floral Density and Honey Bee Visitation
Four quadrats, each measuring 3.34 m² were established in each direction (north, south, east, west) within and outside the treated area at each site to collect data on floral density and visible honey bee visitation (Figure 1). Flower density was assessed by manually counting all T. repens inflorescences within each quadrat at 8:00 AM on evaluation timings. Honey bee visitation was measured in each quadrat by visually recording the number of unique foragers physically interacting with inflorescences for a 1-min period per plot, conducted at 12:00 PM and 2:00 PM, as bees were expected to be actively foraging. Data were collected at each site before initiation of a deterrent treatment application and at 0 d, 1 d, and 7 DAT with fluorescent powder. Floral density data were converted to the number of inflorescences per square meter and honey bee visitation data were reported as insect visits per minute per square meter. Floral density was further converted to the percent reduction of initial flower density before applying deterrent treatments at each trial site.
Data Analysis
Treatment was considered a fixed effect, while trial and replication were considered random effects in the model statement. The number of fluorescent powder–exposed honey bees, average concentration on exposed honey bees, and flower density response variables were analyzed using ANOVA via PROC MIXED in SAS v. 9.4 (SAS Institute, Cary, NC). Data for response variables were tested for normality using PROC UNIVARIATE and the Shapiro-Wilk statistic, and homogeneity of variance was confirmed by visually inspecting plotted residuals and other metrics using the DIAGNOSTIC option of the PLOT procedure. Both bee and other insect counts from the pane and yellow sticky traps, respectively, were analyzed with the same procedure mentioned above. Data for the total number of bees captured per vane trap were log10 transformed, and the proportion of individuals marked was square-root transformed to comply with normality. The mean square of the treatment effect was evaluated using the mean-square error associated with random variable interaction (McIntosh Reference McIntosh1983). Means were separated using Fisher’s protected LSD test with a significance level of 0.05. Two linear regressions, using PROC REG, were calculated to assess the relationship between fluorescence intensity and the concentration of fluorescent powder and for floral density and honey bee visitations.
Results and Discussion
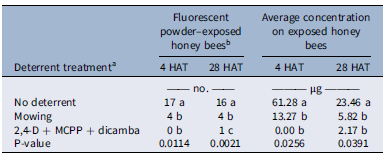
The treatment effect was significant for the number of fluorescent powder–exposed honey bees at 4 (P = 0.0114) and 28 HAT (P = 0.0021) and not dependent on the trial (Table 2). A mowing event before fluorescent powder application reduced the number of exposed honey bees by at least 75% compared with the non-treated control at 4 and 28 HAT (Table 2). A single mowing event reduced pollinator visitation on weedy flowers, including T. repens, by at least 50% in a grassland habitat (Phillips et al. Reference Phillips, Gaston, Bullock and Osborne2019). However, a premix of synthetic auxin herbicides reduced the number of fluorescent powder–exposed honey bees by ≥94% at 4 and 28 HAT (Table 2). Baucom et al. (Reference Baucom, Iriart, Soble, Armstrong and Ashman2025) also reported a 93% reduction in pollinator visitation based on visual observations after weedy flowers were treated with dicamba, altering plant–pollinator interactions. Synthetic auxin herbicides performed better in deterring honey bees at 28 HAT, as the number of fluorescent powder–exposed honey bees was higher in mowed plots compared with herbicide-treated plots (Table 2).
Contact exposure of honey bees to fluorescent powder–treated Trifolium repens inflorescences in turfgrass at 4 and 28 h after treatment (HAT) with fluorescent powder.

a Mowing was conducted on same day before fluorescent powder was applied; a premix of synthetic auxin herbicides (Trimec Classic® at 1.52 kg ai ha−1) was applied 2 d before fluorescent powder treatment.
b A total of 40 honey bees were actively sampled at each timing per treatment.
The treatment effect was significant for the average concentration of fluorescent powder on exposed honey bees at both 4 (P = 0.0256) and 28 HAT (P = 0.0391) and not affected by trial (Table 2). At 4 HAT, honey bees from sites without deterrent treatments were exposed to 61.28 µg of fluorescent powder per honey bee, which was reduced to 13.27 µg in mowed plots and to 0 µg in herbicide-treated plots (Table 2). Larson et al. (Reference Larson, Redmond and Potter2015) observed that even after mowing, pollinator exposure to insecticide-associated risk was not entirely eliminated, with up to 36 ng of imidacloprid and clothianidin g−1 of nectar remaining in newly formed T. repens inflorescences. By 28 HAT, the concentration of fluorescent powder on honey bees from no-deterrent plots was 23.46 µg per bee, but this decreased to ≤5.82 µg in plots treated with mowing or herbicide (Table 2). The average exposure level was reduced by 28 HAT in the positive control group (Table 2). This reduction can be explained in part by the limited lightfastness of the fluorescent powder, where UV irradiation resulted in greater than 85% decrease in emission intensity within 24 h (Sobeck and Smith, Reference Sobeck and Smith2022). However, this impact was largely corrected through the use of in-field standards for generating standard curves at 4 and 28 HAT (Figure 2). Additional factors possibly contributing to the lower exposure levels over time include dew, which enhances the aggregation of powder particles to one another and to plant surfaces (Ossola and Farmer Reference Ossola and Farmer2024), therefore decreasing their dislodgeability. Honey bee grooming behavior, including autogrooming and allogrooming, can also contribute to the active removal of powder particles from their bodies (Carroll and Brown Reference Carroll and Brown2024).
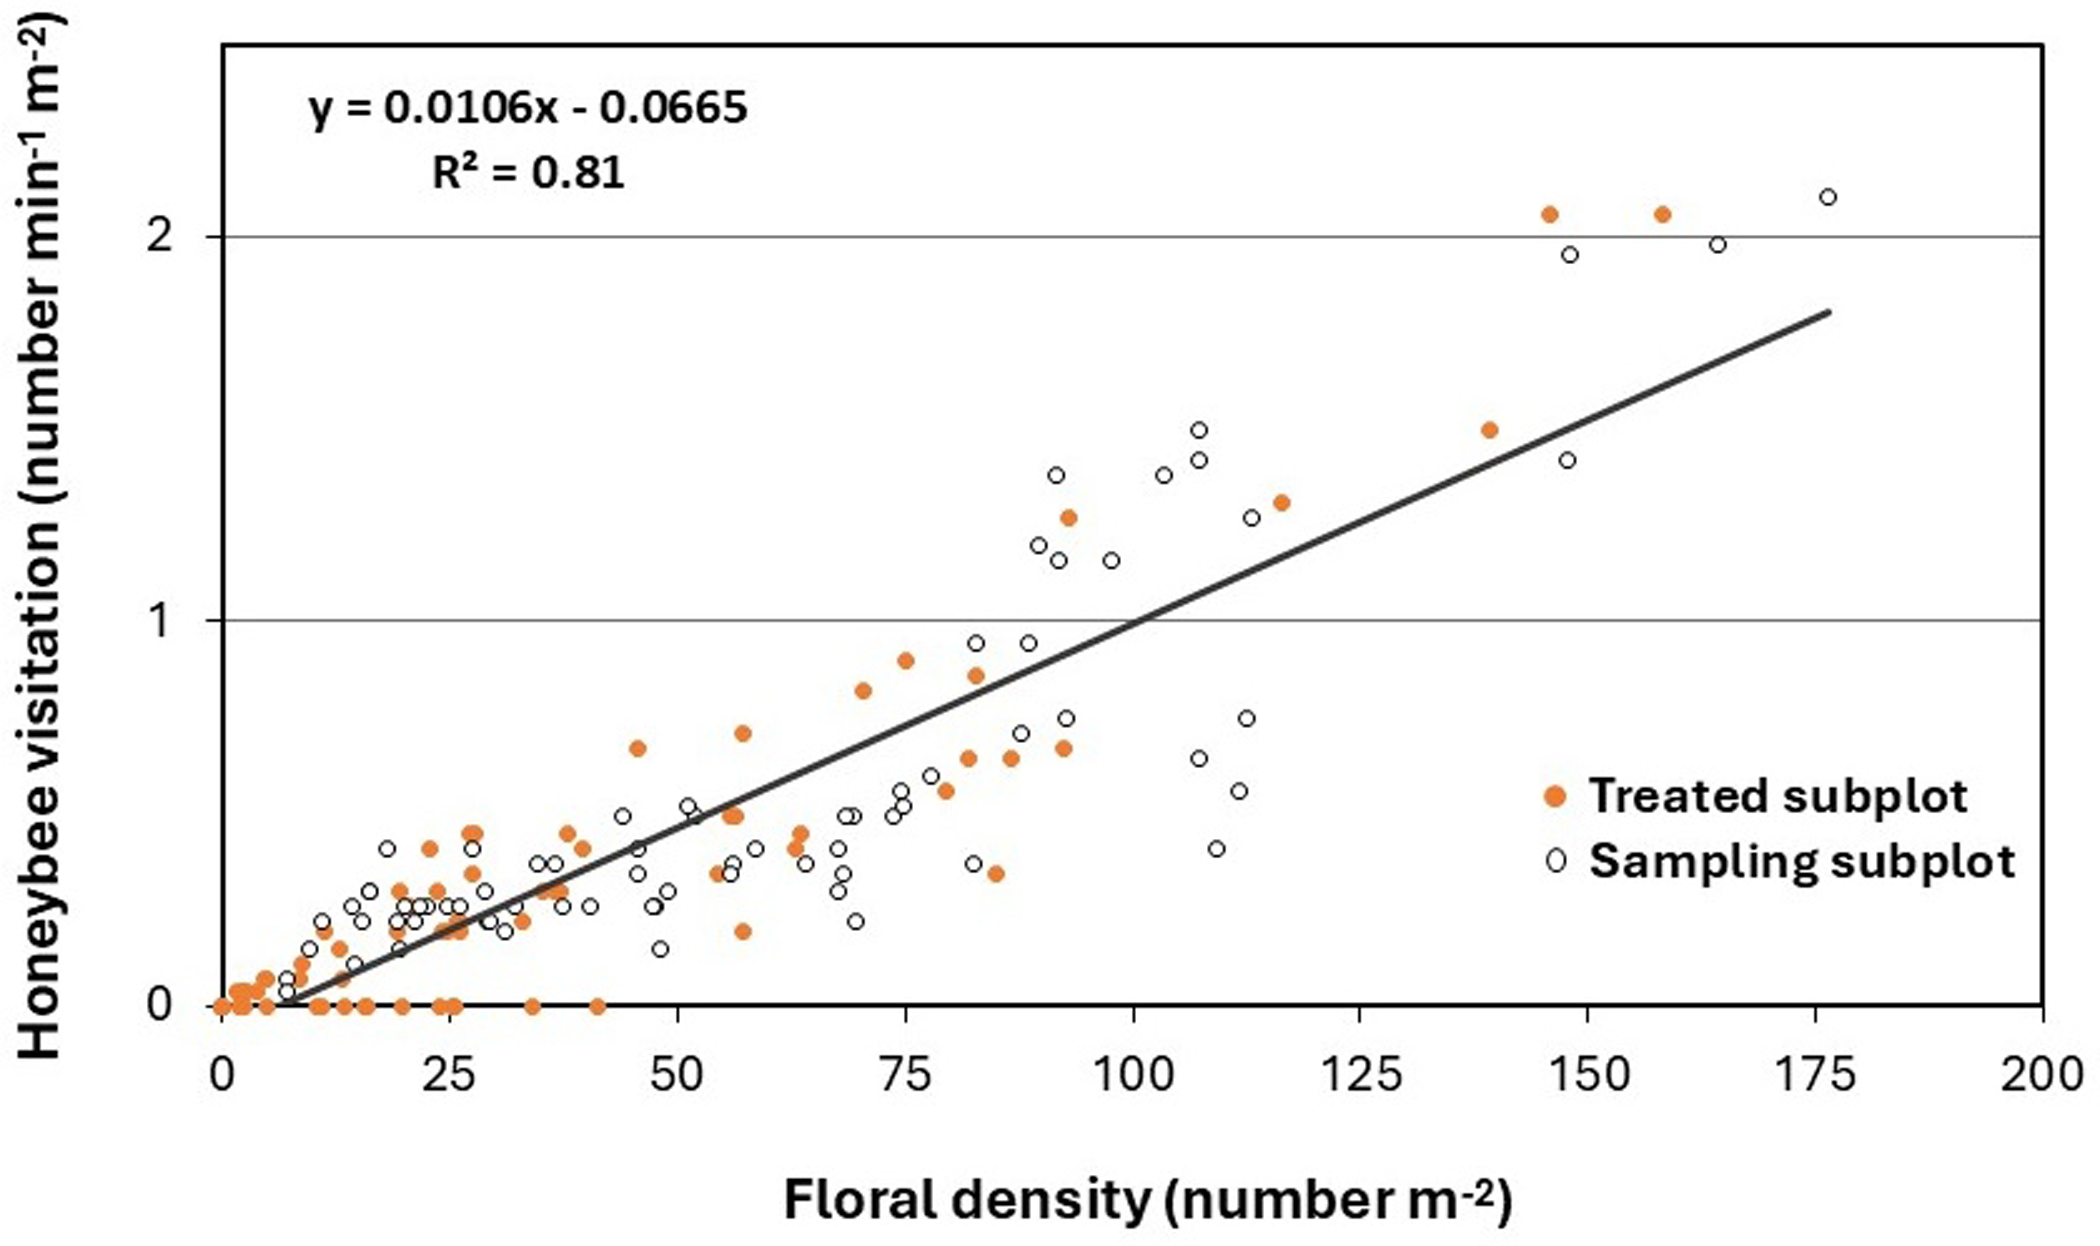
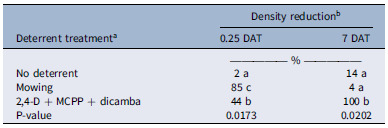
Honey bee visitation was positively correlated with T. repens inflorescence density, with 81% of the variation in honey bee visitation explained by changes in floral density (Figure 3). A similar positive linear correlation between floral density and pollinator visitation has been documented in previous studies on canola (Brassica napus L. ‘Wichita’), winter pea (Pisum sativum L. ssp. arvense (L.) Poir.), and red clover (Trifolium pratense L. ‘Mammoth’) (Ellis and Barbercheck Reference Ellis and Barbercheck2015). Further, Godara and Askew (Reference Godara and Askew2024) found that honey bee evacuation from herbicide-treated turfgrass areas was influenced by rapid changes in UV reflection from treated weedy flowers but ultimately driven by a reduction in floral density. In no-deterrent plots, there was a 14% decline in T. repens floral density by 7 DAT (Table 3). Zalenski (Reference Zaleski1964) observed a similar natural decline, linking it to reduced light penetration at the base of high-density plants, which slows vegetative and floral induction. At 0.25 DAT, T. repens inflorescence density was reduced to 85% in mowed plots and 44% in herbicide-treated plots (Table 3). Mowing led to a rapid decline in floral density compared with areas treated with synthetic auxins, where herbicide application resulted in an ∼20% reduction in floral density per days posttreatment (Godara et al. Reference Godara, Williamson, Koo and Askew2023). Mowing did not completely eliminate floral resources in weed-infested turfgrass; flowers at lower heights in the canopy can persist even after mowing events (Lerman et al. Reference Lerman, Contosta, Milam and Bang2018). T. repens shows high phenotypic plasticity in internode length, influenced by management intensity, which in turn affects inflorescence height and seed production (Caradus et al. Reference Caradus, Roldan, Voisey, Woodfield and Hasanuzzaman2023). However, in plots treated with synthetic auxins, there was a 100% decline in T. repens floral density, while non-treated and mowed plots showed less than a 15% reduction at 7 DAT (Table 3), due to floral regeneration following mowing. MacRae et al. (Reference MacRae, Mitchem, Monks and Parker2005) also reported greater than 90% control of T. repens inflorescences with synthetic auxin herbicides like 2,4-D and clopyralid.
Relationship between honey bee visitation and Trifolium repens inflorescence density during the study.

Trifolium repens inflorescence density at 0.25 and 7 d after treatment (DAT) with fluorescent powder. a

a Mowing was conducted on the same day before fluorescent powder was applied; a premix of synthetic auxin herbicides (Trimec Classic® at 1.52 kg ai ha−1) was applied 2 d before fluorescent powder treatment.
b Reductions are based on the average density of T. repens inflorescences before application of deterrent treatments, which were 57, 52, and 47 blooms m−2 in non-treated, mowing, and herbicide-treated plots, respectively.
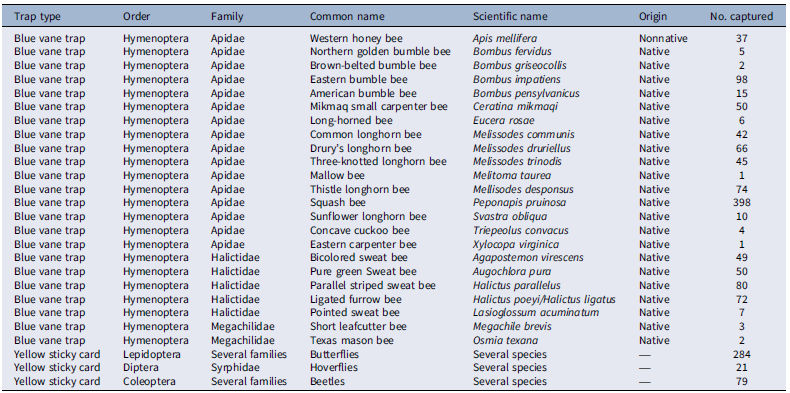
Blue vane traps captured 23 distinct bee species from the Apidae, Halictidae, and Megachilidae families (Table 4). Among the total 1,117 bees captured, more than 96% were native bees and comprised 1,080 insect specimens (Table 4). Previous research by Larson et al. (Reference Larson, Kesheimer and Potter2014) also documented 21 species of bees visiting T. repens inflorescences in turfgrass systems. Deterrent treatment did not affect the number of bee species collected per trap, possibly driven by strong visual cues from the light-reflectance properties of the trap in the 400- to 600-nm range (Acharya et al. Reference Acharya, Burke, Leslie, Loftin and Joshi2022). Kimoto et al. (Reference Kimoto, DeBano, Thorp, Taylor, Schmalz, DelCurto, Johnson, Kennedy and Rao2012) also found that the number of sweat bees (Lasioglossum) captured via blue vane traps was unaffected by management intensity. No effect of deterrent treatment (P > 0.05) was documented on bee exposure to fluorescent powder collected from blue vane traps. Yellow sticky cards captured 284, 21, and 79 insects from Lepidoptera, Diptera, and Coleoptera orders, respectively, when established for 28 HAT (Table 4). Deterrent treatments did not affect (P > 0.05) the exposure of Lepidoptera, Diptera, and Coleoptera insects collected from yellow sticky cards to fluorescent powder (data not shown). As with blue vane traps, previous research suggests that the strong visual attraction of Lepidoptera and Diptera insects to yellow traps (Laubertie et al. Reference Laubertie, Wratten and Sedcole2006; Meagher Reference Meagher2001) can attract insects from distances of several meters. Our deterrent treatments primarily targeted impacts on T. repens inflorescences (Table 3, Figure 3), but if insects were more attracted to the passive traps, then their capture rates would remain consistent regardless of habitat modifications with mowing or herbicide application. Venn and Kotze (Reference Venn and Kotze2014) also observed that the abundance and richness of beetles (Carabidae) were not affected by intensive mowing compared with unmanaged areas for 1 yr, potentially attributed to their functional role.
Bee species, butterflies, hoverflies, beetles, and their frequencies captured by passive traps. a

a Blue vane traps and yellow sticky cards were established as passive traps for 28 h after fluorescent powder treatment in Trifolium repens–infested turfgrass experimental plots in Blacksburg, VA, in 2024. Two blue vane traps and four yellow sticky cards were established for each experimental unit, with a total of 36 blue vane traps and 72 yellow sticky cards for three replications and two trials.
Our study shows that pretreating with mowing or synthetic auxin herbicides significantly reduces the number of honey bees exposed to fluorescent powder by at least 75% and 93%, respectively. Out of the exposed honey bees, the mowing and herbicide treatments reduced the fluorescent powder concentration by at least 75% and 90%, respectively. Mowing temporarily decreases the floral density of T. repens by 85%, but the impact diminishes by 7 DAT, allowing pollinator food resources to recover. In contrast, synthetic auxin herbicides cause a complete loss of floral resources by 7 DAT, leading to a long-term elimination of T. repens inflorescences. These deterrent practices vary from the permanent removal of pollinator food sources using synthetic auxin herbicides in areas requiring frequent insecticide applications to the short-term suppression of inflorescences via mowing, which permits floral regeneration in areas with less pest pressure. While this study provides valuable insight into how deterrent practices can mitigate pollinator exposure risk, several constraints of the experimental design should be considered. These experiments were conducted twice during 2024, which limits the ability to account for interannual variation in environmental conditions, weed phenology, and pollinator activity. Factors such as differences in temperature, precipitation, Trifolium spp., and pollinator abundance across years could influence the magnitude of deterrent effects observed. Blue vane traps captured 1,117 insect specimens representing 23 bee species, while 384 insects from Lepidoptera, Diptera, and Coleoptera orders were captured on yellow sticky cards. Despite differences observed in contact exposure of actively sampled honey bees, deterrent treatments did not affect the exposure of passively trapped pollinators to fluorescent powder or bee abundance in each blue vane trap. Our results highlight the intricate relationships between pollinators, weedy floral resources, and turfgrass management, emphasizing the need for developing integrated strategies that reconcile pest management with pollinator conservation. Future research will further explore the effects of deterrent treatments across various insect functional groups.
Acknowledgments
The authors want to thank Elijah Seright, Jeremy Leichner, John Hinson, Bill Keene, Brooks Saville, and the staff of Virginia Tech Turfgrass Research Center, Blacksburg Country Club, and Homefield Farm for their technical assistance in maintaining the research sites. The authors also thank Michael Goatley and Jacob Barney for editing the manuscript
Funding statement
The authors want to thank the PBI Gordon Corp., Shawnee, KS, for partially funding this study under the “2022 PBI-Gordan Turfgrass Pest Management Research Grant Program.”
Competing interests
The authors declare no conflicts of interest.

 Open access