


Body composition estimation is an essential component of comprehensive health monitoring(Reference Andreoli, Garaci and Cafarelli1). While examining the cross-sectional agreement between body composition techniques holds some utility, longitudinal investigations are needed to establish the relative comparability of specific methods for quantifying changes in distinct body compartments over time. The ability of methods of varying cost, complexity and accessibility to accurately estimate changes in body composition is a key concern in research and field settings(Reference Tinsley and Moore2). However, limited data are available to inform the ability of common methods to sufficiently detect longitudinal changes in body composition as compared with criterion methods.
In addition to the question of whether diverse methods of body composition estimation can detect true changes in optimal conditions – for example, when pre-assessment participant standardisation is tightly controlled – the use of techniques in less-than-optimal conditions introduces varying degrees of error into resultant body composition estimates(Reference Tinsley, Morales and Forsse3,Reference Nana, Slater and Hopkins4) . Pre-assessment standardisation typically involves performing tests in the morning after overnight (e.g. ≥8 h) abstention from food intake, substance ingestion, and most or all beverages, as well as following a period of rest from exercise and other moderate- or vigorous-intensity physical activity. Ideally, adherence to these items is confirmed via interview or objective criteria. In practice, it is not always possible to implement the desired level of participant standardisation due to personnel availability, scheduling constraints and related considerations(Reference Brewer, Blue and Hirsch5). Additionally, personnel conducting body composition assessments in clinical or applied settings may be unaware of current best practices for standardisation or the potential importance of these measures. While a lack of pre-assessment standardisation is often viewed as a minor concern that introduces real-but-small errors in body composition estimates, recent data demonstrate that greater concern may be warranted. Kerr et al. (Reference Kerr, Slater and Byrne6) performed an informative investigation revealing the meaningful interpretative consequences of transient errors in body composition estimates produced by unstandardised conditions. Before and after 6 months of self-selected training and diet, the body composition of resistance-trained participants was assessed – in both standardised and unstandardised conditions – using several field and laboratory assessment methods. For some methods, particularly those including body water assessments (i.e. multi-component models and bioimpedance techniques), a lack of standardisation led to dramatically amplified body composition changes or changes that were directionally reversed relative to standardised conditions. While some methods were apparently more robust to a lack of standardisation, the observation that ‘real’ body composition changes could be completely obfuscated by a simple lack of standardisation indicates the need for further delineation of the longitudinal implications of suboptimal standardisation procedures.
Based on the limited number of longitudinal interventions examining the validity of common body composition estimation techniques for tracking changes in body composition over time, as well as the scarce research quantifying the magnitude of errors in body composition alterations when suboptimal participant pre-assessment standardisation is present, further investigation through longitudinal studies is warranted. Therefore, the purpose of this investigation was to answer two primary questions: (1) Do longitudinal body composition changes quantified when one or more unstandardised assessments are present differ from the standardised change – defined as the observed change when both baseline and final assessments are standardised – for a given method? (2) Do the standardised changes detected by distinct methods differ? Based on prior data(Reference Kerr, Slater and Byrne6), it was hypothesised that assessment methods including body water assessments would be more susceptible to errors introduced by unstandardised subject presentation, whereas those evaluating external characteristics – such as digital anthropometry – would be less susceptible. Furthermore, it was hypothesised that meaningful differences between body composition changes detected by distinct methods would be observed, even in standardised conditions.
Methods
Study design
A 6-week supervised resistance training (RT) programme was conducted in conjunction with a high-energy diet designed to promote fat-free mass (FFM) accretion(Reference Smith, Harty and Stratton7). A total of four body composition assessment sessions were performed. The first two assessment sessions were performed on the same day immediately prior to the beginning of the intervention. For the first session, pre-assessment activities of participants were standardised by requiring overnight abstention from food, fluid, substance ingestion and exercise. After this session, participants were free to engage in normal daily activities. Later the same day, body composition assessments were repeated, without standardisation of pre-assessment activities (i.e. in unstandardised conditions). After the two pre-intervention body composition assessment sessions, participants completed the 6-week RT programme with simultaneous consumption of a hyperenergetic diet. After the intervention was complete, participants underwent the two final body composition assessment sessions, which were conducted just as before the intervention. Specifically, participants completed a morning visit with standardisation of pre-assessment activity and an afternoon assessment on the same day, without standardisation of pre-assessment activity. The standardised, ‘real’ body composition change was defined as the observed change when both the pre-intervention and post-intervention visits were standardised and was designated ‘SS.’ The observed change when the pre-intervention visit was standardised, but the post-intervention visit was unstandardised, was designated ‘SU.’ The observed change when the pre-intervention visit was unstandardised, but the post-intervention visit was standardised, was designated ‘US.’ Finally, the observed change when both pre-intervention and post-intervention visits were unstandardised was designated ‘UU.’ Research question no. 1 was addressed by comparing the body composition changes detected in the varying standardisation combinations (i.e. SS, SU, US and UU). Research question no. 2 was addressed by comparing the standardised (i.e. SS) changes detected between methods.
Participants
Participants were recruited through in-person announcements, emails and word-of-mouth. Individuals who were generally healthy, between the ages of 18 and 40 years, male, weight-stable (defined as no change in body mass (BM) >2·3 kg in the past 3 months), resistance-trained (defined as performing resistance exercise 2–5 d/week for ≥6 months), able to bench press ≥1·0 × BM and leg press ≥2·0 × BM during baseline one-repetition maximum assessments and willing to abstain from consumption of any supplement beyond a standard multivitamin or those provided as part of the study were eligible to participate. This study was conducted according to the guidelines laid down in the Declaration of Helsinki, and all procedures involving human subjects were approved by the Texas Tech University Institutional Review Board (IRB2019-356). Written informed consent was obtained from all subjects. This data collection was also prospectively registered on clinicaltrials.gov (ClinicalTrials.gov Identifier: NCT04069351).
Thirty-two individuals consented to participate in the study. Four individuals did not meet baseline muscular performance screening criteria and were ineligible to continue participation. Five additional participants dropped out of the study for reasons unrelated to the study, and two participants were withdrawn during the intervention for lack of compliance with the supervised RT programme. Subsequently, twenty-one participants completed the entire study. However, two individuals did not have complete data for the body composition methods examined herein. Therefore, nineteen individuals (age: 21·1 (sd 2·7) years; height: 178·1 (sd 6·8) cm; BM: 74·7 (sd 10·5) kg; BMI: 23·5 (sd 2·8) kg/m2; four-component model (4C) body fat %: 14·9 (sd 4·6) %; 4C FFM index: 20·0 (sd 2·1) kg/m2; 4C fat mass (FM) index: 3·6 (sd 1·3) kg/m2) were included in the present analysis.
Intervention
All participants completed 6 weeks of 3 d/week supervised RT while consuming a hyperenergetic diet as previously described(Reference Smith, Harty and Stratton7–Reference Stratton, Smith and Harty9). Briefly, the RT programme was designed by a Certified Strength and Conditioning Specialist and included a lower body session, upper body session and full body session weekly. Sessions were performed in the laboratory and directly supervised by those with Certified Strength and Conditioning Specialist or personal training certifications. Most exercises employed free weights (barbells and dumbbells) or select weight machines (e.g. hip sled, leg extension, leg curl). Exercise intensity was prescribed based on repetitions in reserve(Reference Zourdos, Klemp and Dolan10) and varied throughout the progressive programme. The full RT programme is displayed in online Supplementary Table S1. Participants were asked not to complete other structured exercise training outside of the prescribed programme.
Participants were instructed to maintain their regular dietary intake and also consume a dietary supplement provided by the researchers daily (Super Mass GainerTM, Dymatize Enterprises, LLC; 5·5 g fat, 123·5 g carbohydrate, 26 g protein, about 647·5 kcal). A BM increase of at least 0·45 kg/week was targeted, and weekly average BM values were examined in the laboratory to objectively assess compliance with the hyperenergetic diet. In the event that participants were not meeting weekly BM goals, they were encouraged to increase energy intake. Based on a multiple-pass, validated, automated, self-administered 24-h dietary assessment tool (ASA24; National Institute of Health, 2018), daily nutritional intake during the intervention was 51·4 (sd 19·7) kcal/kg, 2·3 (sd 0·7) g/kg protein, 6·2 (sd 2·3) g/kg carbohydrate and 1·8 (sd 0·8) g/kg fat. In absolute terms, this corresponded to daily intakes of approximately 3886 (sd 1403) kcal, 173 (sd 53) g protein, 464 (sd 161) g carbohydrate and 139 (sd 61) g fat. Based on standardised dual-energy X-ray absorptiometry-derived (DXA) FFM and FM changes(Reference Silva, Matias and Santos11), the estimated daily energy surplus during the 6-week intervention was 412 (sd 355) kcal.
Laboratory assessments
Overview
Over the duration of the study, participants reported to the laboratory for four separate body composition assessment sessions. The first two sessions took place on a single day immediately prior to commencement of the intervention, and the final two sessions took place on a single day immediately following completion of the intervention. The first and third visits took place with strict pre-assessment standardisation according to best practices for body composition assessment. In contrast, the second and fourth visits took place without implementation of any pre-assessment standardisation.
Due to variation in manufacturers’ requirements for pre-assessment standardisation, inadequate guidelines or a lack of information from manufacturers on this point, standardisation was operationally defined within the current study. Specifically, for the standardised (morning) assessments, participants were required to abstain from eating, drinking, utilising caffeine or nicotine and exercising or engaging in other moderate- or vigorous-intensity physical activity for ≥8 h. Participants were interviewed to confirm adherence to these restrictions. After completion of the standardised assessments, the participants were free to perform normal daily activities until the afternoon visit. During this period, there were no restrictions on fluid intake, food consumption, exercise or any other activities. Afternoon assessment sessions were scheduled according to participant availability. The duration between morning and afternoon assessments at the pre-intervention time point was 6·2 (sd 1·5) h, and the time difference at the post-intervention time point was 7·3 (sd 1·7) h.
Initial procedures
Upon reporting to the laboratory for each body composition session, participants voided and provided a urine sample for assessment of urine specific gravity with a digital refractometer (PA201X-093, Misco). Participants wore light athletic clothing for assessments and removed all metal and accessories prior to testing. Height was determined via mechanical stadiometer (Seca 769).
Body composition assessment
At each laboratory visit, participants underwent the following body composition estimation procedures, in order: air displacement plethysmography (ADP), three-dimensional optical imaging (3DO) with three separate scanners, multi-frequency bioelectrical impedance analysis (MFBIA) with two separate analysers, DXA, bioimpedance spectroscopy (BIS) and single-frequency bioelectrical impedance analysis (SFBIA). Additionally, data from these devices were used to produce three-component (3C) and 4C body composition estimates(Reference Tinsley12). Our within-laboratory reliability data for all methods are displayed in Table 1.
Within-laboratory reliability of body composition techniques
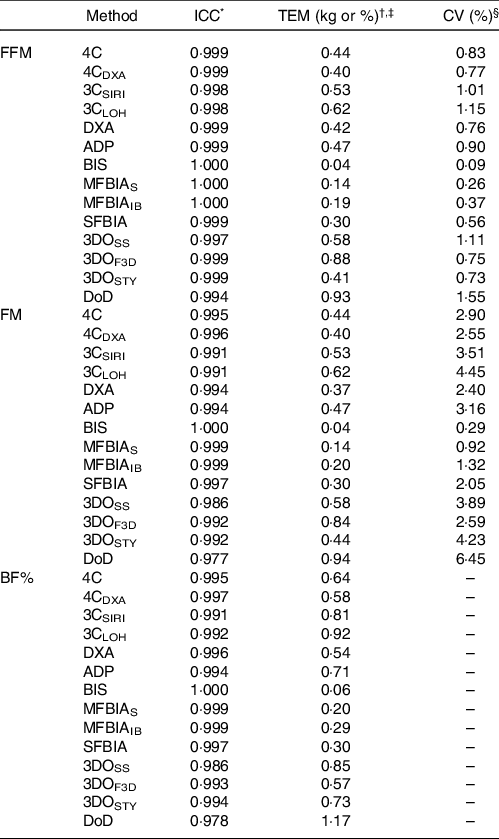
ICC, intraclass correlation coefficient; TEM, technical error of measurement; FFM, fat-free mass; FM, fat mass; BF%, body fat percentage; 4C, four-component model of Wang et al. (2002); 4CDXA, four-component model of Wang et al. (2002) with DXA-derived body volume; 3CSIRI, three-component model of Siri (1961); 3CLOH, three-component model of Lohman (1986); DXA, dual-energy X-ray absorptiometry (GE Lunar Prodigy); ADP, air displacement plethysmography (Cosmed BOD POD); BIS, bioimpedance spectroscopy (ImpediMed SFB7); MFBIAS, Seca multi-frequency bioelectrical impedance analysis (Seca mBCA 515/514); MFBIAIB, InBody multi-frequency bioelectrical impedance analysis (InBody 770); SFBIA, single-frequency bioelectrical impedance analysis (RJL Systems Quantum V); 3DOSS, SizeStream 3-dimensional optical imaging (SizeStream SS20); 3DOF3D, Fit3D 3-dimensional optical imaging (Fit3D ProScanner); 3DOSTY, Styku 3-dimensional optical imaging (Styku S100); DoD, US Department of Defense body fat equation.
* The ICC corresponds to the two-way model with random effects and absolute agreement (i.e. model 2, 1 of Shrout and Fleiss(Reference Shrout and Fleiss66)).
† The absolute TEM was calculated as: $TEM = \sqrt {{{\sum {({D^2})} } \over {2n}}} $
where D is the difference in body composition estimates from two separate assessments with a given technique. Within our laboratory, duplicate assessments were obtained on a single day (independent of the present investigation; n 18 participants for most variables), with completely separate tests performed and repositioning of the participant between assessments when applicable. The CV (i.e. relative TEM) was calculated as the absolute TEM divided by the mean of all measurements, multiplied by 100.
$TEM = \sqrt {{{\sum {({D^2})} } \over {2n}}} $
where D is the difference in body composition estimates from two separate assessments with a given technique. Within our laboratory, duplicate assessments were obtained on a single day (independent of the present investigation; n 18 participants for most variables), with completely separate tests performed and repositioning of the participant between assessments when applicable. The CV (i.e. relative TEM) was calculated as the absolute TEM divided by the mean of all measurements, multiplied by 100.
‡ TEM values are presented in % for BF% and kg for FM and FFM.
§ CV (i.e. relative TEM) is not displayed for BF% due to this metric already being presented as a percentage.
ADP (BOD POD®, Cosmed USA) was performed according to the manufacturer recommendations and included two to three volume measurements to ensure consistent values. Estimated thoracic gas volumes were used. BF% estimates were obtained from ADP by inserting the estimated body density (D b ) into the Siri(Reference Siri13) equation (Eq. 1).
 $${\rm{BF}}\% = \left[ {\left( {{{4.95} \over {{D_b}}}} \right) - 4.5} \right]{\rm{*}}100$$
Our within-laboratory test–retest reliability for ADP BV estimates is: intraclass correlation coefficient = 0·999, technical error of measurement (TEM) = 0·10 L and CV = 0·15 %, and for ADP Db estimates is: intraclass correlation coefficient = 0·994, TEM = 0·002 kg/l and CV = 0·15 %. BM estimates from the calibrated scale associated with the ADP device (Model BWB-627-A, modified Tanita, Corp.) were recorded and used as the values from which FM and FFM estimates were produced for each method. This procedure was employed to eliminate any differences – or lack of differences – in body composition estimates that were solely due to differences in BM detected by devices with integrated scales. Our within-laboratory test–retest reliability for the calibrated scale BM estimates is: intraclass correlation coefficient = 0·999, TEM = 0·01 kg and CV = 0·01 %.
Three separate 3DO scanners were utilised in the present study. One scanner employed structured light scanning with static components (Size Stream® SS20; designated 3DOSS), one scanner employed structured light scanning with a rotating platform (FIT3D® ProScannerTM; designated 3DOF3D) and the final scanner utilised time-of-flight technology with a rotating platform (Styku® S100; designated 3DOSTY)(Reference Heymsfield, Bourgeois and Ng14). The relevant product specifications yielding the data used in the present analysis were as follows: FIT3D® (software version 2.1.0, hardware version 5.0.4, sensor version 1.0.2), Size Stream® (software version 5.2.7 for Size Stream Studio, scanner version 6.2, 4C body composition equation V1(Reference Harty, Sieglinger and Heymsfield15)) and Styku® (software version 4.1.0.441.25.0, Styku Phoenix Advanced body composition model). The output from the Size Stream® scanner was also used to estimate body composition using the US Department of Defense (DoD)/Army body fat equation (Eq. 2)(16) for males, which uses waist circumference, neck circumference and height as inputs, with all values expressed in inches.
 $$BF\% = {\mkern 1mu} (86.010{\mkern 1mu} {\rm{*}}{\mkern 1mu} log10({\rm{waist}}\;{\rm{circumference}} - {\rm{neck}}\;{\rm{circumference}}))\\- (70.041{\mkern 1mu} {\rm{*}}{\mkern 1mu} log10\left( {height} \right)) + 36.76$$
Two separate MFBIA analysers were used (mBCA 515/514, Seca® gmbh & Co., designated as MFBIAS; and InBody 770, InBody, Seoul, South Korea, designated as MFBIAIB). MFBIAS is a nineteen-frequency, eight-point analyser with contact electrodes. The frequencies employed range from 1 to 1000 kHz, with a measuring current of 100 µA. Assessments are conducted in the standing position, with the hands placed on contact electrodes on the built-in handrails. This analyser has previously been validated against a 4C model for body composition estimates(Reference Bosy-Westphal, Schautz and Later17,18) . MFBIAIB is a direct segmental multi-frequency analyser that uses six measurement frequencies ranging from 1 to 1000 kHz and an applied current of 80 μA (±10 μA). This device uses eight electrodes, with four placed in contact with the bottom of the feet (two at each heel and front sole) and four placed in contact with the hands (two at each thumb and palm). Assessments are conducted in the standing position, with the shoulder abducted and arms straightened to ensure no contact between the arms and torso. This analyser has previously been validated against DXA for body composition estimates(Reference McLester, Nickerson and Kliszczewicz19–Reference Lahav, Goldstein and Gepner21).
DXA assessments were performed on a Lunar Prodigy scanner (General Electric) with enCORE software (version 16.2), which was calibrated daily before use. Positioning of participants was standardised using custom-made foam blocks to promote reliability of measurements.(Reference Tinsley12,Reference Nana, Slater and Hopkins22) . The ‘region’ rather than ‘tissue’ output values was used based on the results of a previous study, which indicated that the ‘region’ values exhibited superior validity when compared with a 4C model(Reference Tinsley12). DXA bone mineral content was divided by 0·9582 to yield a bone mineral (Mo) estimate for use in the 4C model(Reference Wang, Deurenberg and Guo23).
The BIS analyser (SFB7, ImpediMed) utilises 256 measurement frequencies ranging from 3 to 1000 kHz and was performed using the manufacturer-specified hand-to-foot electrode arrangement. This device was checked using the manufacturer-provided test cell prior to use. The sites for adhesive electrodes were cleaned with alcohol wipes prior to placement of the electrodes. The proximal wrist electrode was placed between the styloid processes of the radius and ulna bones, and the distal wrist electrode was placed 5 cm distal to the proximal electrode. For the ankle, the proximal electrode was placed between the medial and lateral malleoli of the tibia and fibula bones, and the distal ankle electrode was placed 5 cm distal to the proximal electrode. Additionally, the legs were positioned to ensure they did not touch, and the arms were separated from the torso by an about 30° angle. Each participant remained supine for ≥3 min immediately prior to BIS assessment, as recommended by the manufacturer. The coefficients utilised (ρ e = 273·9, ρ i = 937·2), as well as body density, body proportion and hydration values (1·05, 4·30 and 0·732, respectively), were the same as those utilised in previous investigations with the selected BIS analyser(Reference Moon, Tobkin and Roberts24–Reference Tinsley, Moore and Benavides26). BIS obtains total body water (TBW) estimates through Cole modelling(Reference Cole27) and mixture theories(Reference Hanai28) rather than regression equations used by the majority of bioimpedance methods (e.g. BIA)(Reference Kyle, Bosaeus and De Lorenzo29). The TBW estimates of the BIS analyser used in the present study have previously been validated against deuterium dilution(Reference Moon, Tobkin and Roberts24,Reference Moon, Smith and Tobkin25,Reference Buendia, Seoane and Lindecrantz30,Reference Armstrong, Kenefick and Castellani31) . In the present study, assessments were conducted in duplicate and averaged for analysis. BIS output was reviewed for quality assurance through visual inspection of Cole plots. In addition to the body composition estimates provided by the analyser, the TBW estimates were used in 3C and 4C models. Our within-laboratory test–retest reliability for BIS TBW estimates is: intraclass correlation coefficient = 0·999, TEM = 0·05 kg and CV = 0·08 %.
The SFBIA analyser (Quantum V, RJL Systems) employed an eight-point, bilateral, hand-to-foot electrode configuration and was tested before measurements using a manufacturer-supplied test resistor. Participant assessments were performed after ≥5 min of supine rest, immediately following BIS assessments. Electrode sites on the hand/wrist and foot/ankle were cleaned with alcohol pads prior to placement of the manufacturer-supplied adhesive electrodes. Electrodes were placed on the dorsal surfaces of both hands and both feet according to the manufacturer’s specifications. Prior to assessment, each participant’s limbs were separated to ensure that they did not contact other body regions. Participants remained motionless during assessments, and bioelectrical output was processed using manufacturer-provided software (RJL BC Segmental version 1.1.2). Assessments were conducted in duplicate and averaged for analysis.
The Siri 3C model was calculated using equation (3), as presented in Siri 1961(Reference Siri32):
 $${\rm{BF}}\% = 100\,{\rm{*}}\left( {{{2.118} \over {Db}} - 0.78{{{\rm{TBW}}} \over {{\rm{BM}}}} - 1.354} \right)$$
Db estimates were obtained from ADP, and BIS TBW was used. Additionally, the Lohman 3C model(Reference Lohman33), which includes an estimate of total body mineral (M; equivalent to Mo x 1·235(Reference Moon, Eckerson and Tobkin34)), was calculated using equation (4):
 $${\rm{BF}}\% = \!100\, {\rm{*}}{{6.386\,{\rm{*\,BV}} + 3.96*{\rm{M - 6}}.{\rm{09*BM}}} \over {{\rm{BM}}}}$$
The 4C model was produced using the equation of Wang et al. (Reference Wang, Xavier and Kotler35) (Eq. (5)):
 $${{{\rm{BF}}\% \! = \!100{*}}{{\;2.748{\rm{nn*BV}}\; - \;0.699{\rm{\,*\,TBW}}+ 1.129\,{\rm{*}}\,Mo\; - \;2.051{\rm{\,*\,BM}}} \over {{\rm{BM}}}}}$$
For all methods, FM and FFM estimates were obtained by applying the observed BF% values to the calibrated BM values.
Fat-free mass characteristics
To provide a comprehensive examination of participant characteristics and examine potential changes over time, FFM characteristics were estimated using data from the aforementioned laboratory procedures. These characteristics included the density of FFM (D FFM) and proportions of TBW (TBW:FFM), mineral (M:FFM), protein (P:FFM) and glycogen (G:FFM) in FFM(Reference Tinsley12,Reference Wang, Heshka and Wang36,Reference Heymsfield, Ebbeling and Zheng37) .
Soft tissue mineral (M s ) was estimated from BIS TBW using equation (6), which was developed by Wang et al. (Reference Wang, Xavier and Kotler35) using delayed-ϒ in vivo neutron activation:
 $${M_S}\left( g \right) = 0.882\,{\rm{*}}\,\left( {12.9\,{\rm{*}\,}TBW} \right) + 37.9$$
Residual mass (R) was estimated as:
 $$R = BM - TBW - Mo - Ms - F{M_{4C}}$$
Protein (P) and glycogen (G) mass were estimated using the following two equations in tandem(Reference Tinsley12,Reference Heymsfield, Ebbeling and Zheng37) :
 $$R = P + G$$
 $$G = 0.044*P$$
DFFM, TBW:FFM, M:FFM, R:FFM, P:FFM and G:FFM were calculated as shown in equations (10)–(15), using BIS TBW and 4C FFM estimates.
 $${D_{{\rm{FFM}}}} = {{{\rm{TBW}} + R + Mo + Ms} \over \displaystyle{{{TBW} \over {{0.9937}}} + {R \over {1.34}} + {{Mo} \over {2.982}} + {{Ms} \over {3.317}}}}$$
 $${\rm{TBW}}\!:\!{\rm{FFM}}\; = \;{\rm{TBW}}/{\rm{FF}}{{\rm{M}}}$$
 $${\rm{M}}\!:\!{\rm{FFM}}\; = \left( {Mo + Ms} \right)/{\rm{FF}}{{\rm{M}}}$$
 $${\rm{R}}\!:\!{\rm{FFM\;}} = {\rm{\;R}}/{\rm{FFM}}$$
 $${\rm{P\!}}:\!{\rm{FFM\;}} = {\rm{\;P}}/{\rm{FFM}}$$
 $${\rm{G}}\!:\!{\rm{FFM\;}} = {\rm{\;G}}/{\rm{FFM}}$$
Statistical analysis
The sample size was determined primarily due to feasibility of recruitment and resource availability. Our within-laboratory TEM, displayed in Table 1, indicates the value for each body composition assessment method that must be exceeded for a change to be considered larger than measurement error.
Data were analysed using R (version 4.0.2). Due to normality violations in the residual values from one-way repeated-measures ANOVA, the Friedman test was used as a non-parametric alternative to examine differences between standardisation conditions and between assessment methods. The Kendall’s W was used to compute the corresponding effect sizes. W ranges from 0, indicating no agreement between methods, to 1, indicating complete agreement between methods(Reference Tomczak and Tomczak39). In the event of a significant effect of method or standardisation for body composition estimates, pairwise comparisons were performed using Wilcoxon signed-rank tests. The Benjamini and Hochberg method was used to account for multiple comparisons, yielding adjusted P-values (P adj)(Reference Benjamini and Hochberg40). These analyses were performed using the rstatix R package(Reference Kassambara41). The sd of change scores (i.e. ΔFFM, ΔFM and ΔBF%) was used as an additional metric indicating the overall variability in body composition changes observed in different standardisation conditions(Reference Kerr, Slater and Byrne6).
Equivalence testing was used to evaluate whether each method demonstrated equivalence with the 4C model(Reference Dixon, Saint-Maurice and Kim42,Reference Lakens43) . Equivalence regions of 1·5 kg, 1·5 kg and 2·0 % were selected for FFM, FM and BF%, respectively, as the investigators considered these to be reasonable within the context of the present intervention. In order to be considered equivalent with the changes observed with the 4C model, the entire two one-sided t tests CI was required to be contained within the equivalence region. Equivalence testing was performed using the TOSTER R package(Reference Lakens43), which performs concurrent TOST and traditional null hypothesis significance testing as paired-samples t tests. Due to the inclusion of null hypothesis significance testing, the normality of differences between 4C estimates and each alternate model were examined using Shapiro–Wilk tests. All differences were normally distributed with the exception of FM and FFM differences between 4C and SFBIA. These normality violations were determined to be the result of an outlier whose data were unusual but real and therefore were retained in the analysis. Pearson’s correlation coefficients (r) between body composition changes were estimated, along with Lin’s concordance correlation coefficient (CCC)(Reference Lin44). Linear regression was employed to compare the relationship between 4C and each other method as compared with the line of identity (i.e. a perfect linear relationship with an intercept of zero and a slope of one), and the standard error of the estimate was obtained. These analyses were performed using the DescTools R package(45) and base R functions. The methods of Bland and Altman(Reference Bland and Altman46) were utilised alongside linear regression to visualise the degree of proportional bias. As part of these procedures, the mean differences and 95 % limits of agreement were calculated. Data visualisation was performed using the ggplot2 and TOSTER R packages(Reference Lakens43,Reference Wickham47) .
Statistical significance was accepted at P ≤ 0·05. However, to further aid interpretation of P values, surprisal (S) values were calculated as -log2(P). The S-value rescales the P value to an additive scale and indicates the bits of information against the test hypothesis embedded within the test statistic(Reference Rafi and Greenland48). The S-value can be conceptualised as the number of consecutive fair coin tosses yielding ‘heads’ required to equal the level of surprise of the test statistic.
Results
BM increased by 4·2 (sd 2·0) kg (range: 0·5–8·5 kg). FFM characteristics are displayed in Table 2. Raw body composition changes for each method and standardisation combination are displayed in online Supplementary Tables S2–S4.
Fat-free mass characteristics1
(Mean values and standard deviations; minimum (Min) and maximum (Max) values)
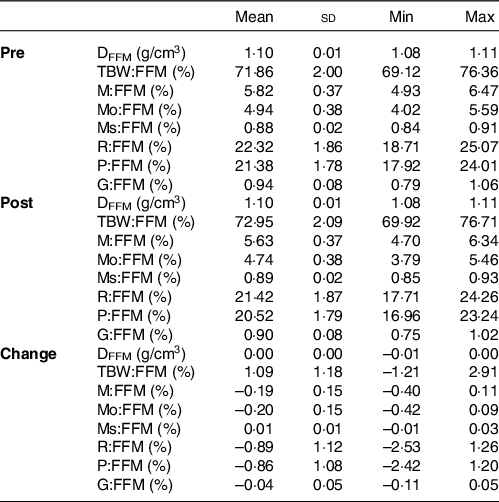
DFFM, density of fat-free mass (FFM); TBW:FFM, proportion of FFM as total body water; M:FFM, proportion of FFM as total mineral; Mo:FFM, proportion of FFM as bone mineral; Ms:FFM, proportion of FFM as soft tissue mineral; R:FFM, proportion of FFM as residual (i.e., protein plus glycogen); P:FFM, proportion of FFM as protein; G:FFM, proportion of FFM as glycogen.
*See equations (6)–(15) for calculation of FFM characteristics.
Standardisation comparison
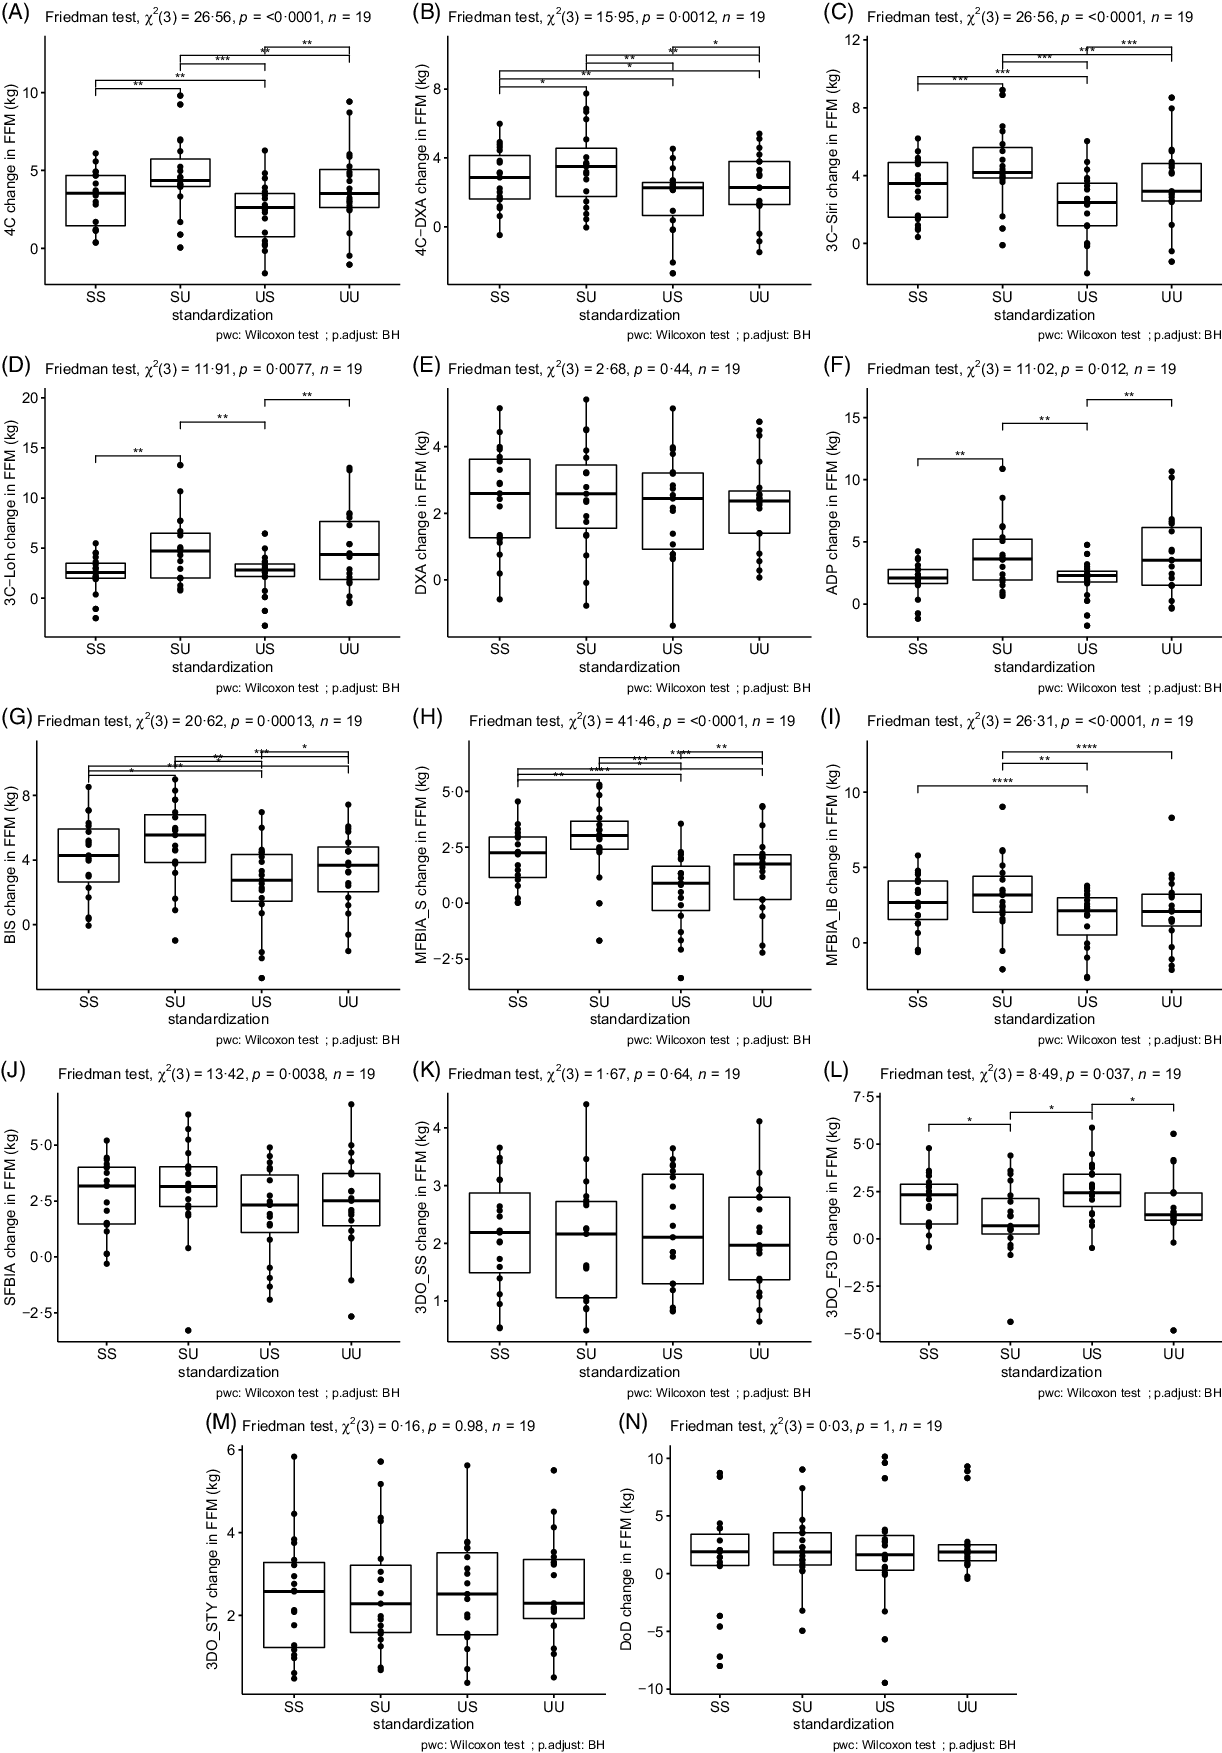
Based on the Friedman tests, ΔFFM values significantly differed based on standardisation for 4C, 4CDXA, 3CSIRI, 3CLOH, ADP, BIS, MFBIAS, MFBIAIB, SFBIA and 3DOF3D; however, ΔFFM values did not differ based on standardisation for DXA, 3DOSS, 3DOSTY and DoD (Fig. 1; online Supplementary Table S5). For FFM, the sd of change scores averaged across methods was 1·79 kg for SS, 1·96 kg for US, 2·18 kg for SU and 2·18 kg for UU. ΔFM values significantly differed based on standardisation for 4C, 4CDXA, 3CSIRI, 3CLOH, ADP, BIS, MFBIAS, MFBIAIB, 3DOSS, 3DOF3D and 3DOSTY; however, ΔFM values did not differ based on standardisation for DXA, SFBIA and DoD (Fig. 2; online Supplementary Table S6). For FM, the sd of change scores averaged across methods was 1·74 kg for SS, 1·91 kg for US, 1·99 kg for SU and 2·09 kg for UU. ΔBF% values significantly differed based on standardisation for 4C, 4CDXA, 3CSIRI, 3CLOH, ADP, BIS, MFBIAS, MFBIAIB, 3DOSS, 3DOF3D and 3DOSTY; however, ΔBF% values did not differ based on standardisation for DXA, SFBIA and DoD (Fig. 3; online Supplementary Table S7). For BF%, the sd of change scores averaged across methods was 1·95 % for SS, 2·13 % for US, 2·38 % for SU and 2·47 % for UU. Relationships between fully standardised (i.e. SS) body composition changes and the changes detected in each other standardisation combination (i.e. SU, US and UU) are displayed in online Supplementary Figures S1–S9.
Influence of Standardisation on Fat-Free Mass Estimates. In each panel, a comparison of standardisation conditions is displayed. Assessment methods are identified in the y-axis label for panels A–N. For each assessment method, the Friedman test was performed with subsequent pairwise comparisons using the Wilcoxon signed-rank test and Benjamini and Hochberg (BH) correction for multiple comparisons. **** P < 0·0001; *** P < 0·001; ** P < 0·01; * P < 0·05. SS represents changes when both pre- and post-assessments were standardised; SU represents changes when pre-assessments were standardised but post-assessments were unstandardised; US represents changes when pre-assessments were unstandardised but post-assessments were standardised; UU represents changes when both pre- and post-assessments were unstandardised. Standardised indicates that pre-assessment abstention from food and fluid intake and physical activity restrictions were employed, whereas unstandardised had no pre-assessment requirements or limitations.
Influence of Standardisation on Fat Mass Estimates. In each panel, a comparison of standardisation conditions is displayed. Assessment methods are identified in the y-axis label for panels A–N. For each assessment method, the Friedman test was performed with subsequent pairwise comparisons using the Wilcoxon signed-rank test and Benjamini and Hochberg (BH) correction for multiple comparisons. **** P < 0·0001; *** P < 0·001; ** P < 0·01; * P < 0·05. SS represents changes when both pre- and post-assessments were standardised; SU represents changes when pre-assessments were standardised but post-assessments were unstandardised; US represents changes when pre-assessments were unstandardised but post-assessments were standardised; UU represents changes when both pre- and post-assessments were unstandardised. Standardised indicates that pre-assessment abstention from food and fluid intake and physical activity restrictions were employed, whereas unstandardised had no pre-assessment requirements or limitations.

Influence of Standardisation on Body Fat Percentage Estimates. In each panel, a comparison of standardisation conditions is displayed. Assessment methods are identified in the y-axis label for panels A–N. For each assessment method, the Friedman test was performed with subsequent pairwise comparisons using the Wilcoxon signed-rank test and Benjamini and Hochberg (BH) correction for multiple comparisons. **** P < 0·0001; *** P < 0·001; ** P < 0·01; * P < 0·05. SS represents changes when both pre- and post-assessments were standardised; SU represents changes when pre-assessments were standardised but post-assessments were unstandardised; US represents changes when pre-assessments were unstandardised but post-assessments were standardised; UU represents changes when both pre- and post-assessments were unstandardised. Standardised indicates that pre-assessment abstention from food and fluid intake and physical activity restrictions were employed, whereas unstandardised had no pre-assessment requirements or limitations.

Method comparison
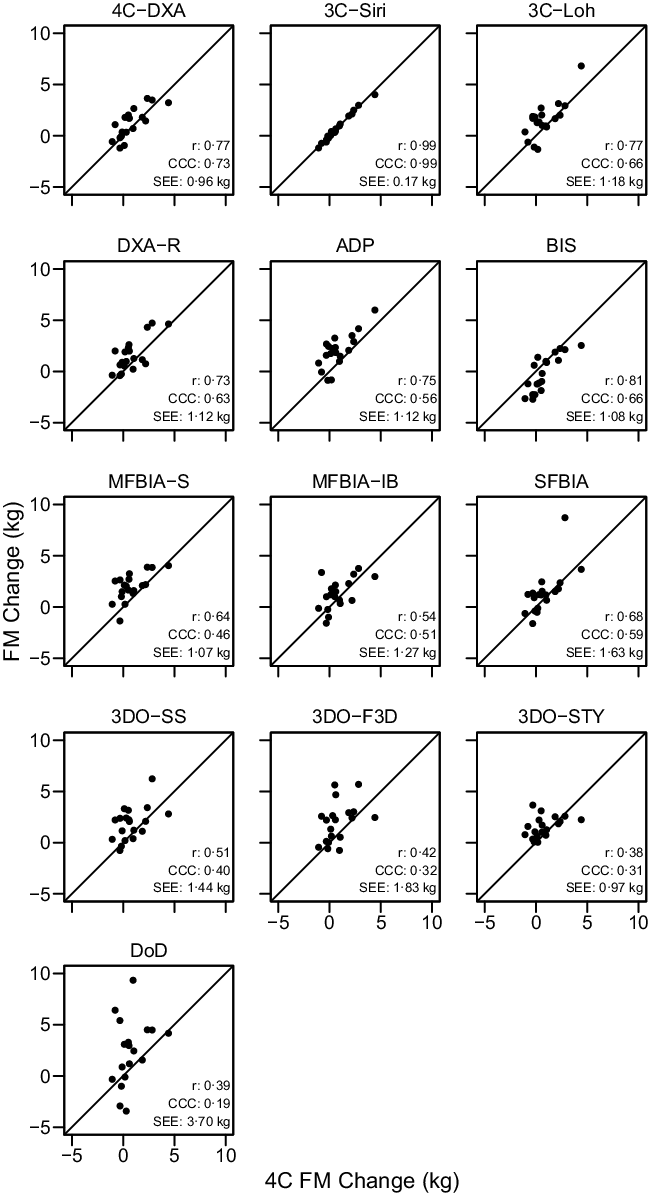
The ‘real’ (i.e. SS) body composition changes observed with each method are displayed in online Supplementary Fig. S10, and relationships between 4C body composition changes and the changes detected by each other method – when pre- and post-assessments were standardised – are displayed in Figures 4–6.
Comparison of Standardised Fat-Free Mass Changes. The fully standardised (i.e., standardised pre- and post-assessments) four-component model (4C) fat-free mass (FFM) change is plotted against the fully standardised FFM change observed for each other method. The diagonal line in each panel represents the line of identity (i.e. the line of perfect agreement, with a slope of 1 and intercept of 0). The Pearson’s correlation coefficient (r), concordance correlation coefficient (CCC) and standard error of the estimate (SEE) are displayed for each comparison. Equations representing the linear relationship between FFM changes detected by 4C and each other method are as follows. 4CDXA: y = 0·81x + 0·18; 3CSIRI: y = 0·99x + 0·07; 3CLOH: y = 0·83x: 0·20; DXA: y = 0·68x + 0·26; ADP: y = 0·61x + 0·04; BIS: y = 1·27x + 0·07; MFBIAS: y = 0·54x + 0·29; MFBIAIB: y = 0·71x + 0·44; SFBIA: y = 0·53x + 0·91; 3DOSS: y = 0·29x + 1·22; 3DOF3D: y = 0·24x + 1·28; 3DOSTY: y = 0·52x + 0·79 and DoD: y = 1·54x – 3·80. Statistically significant r and CCC values were observed for all methods except 3DOF3D.

Comparison of Standardised Fat Mass Changes. The fully standardised (i.e. standardised pre- and post-assessments) four-component model (4C) fat mass (FM) change is plotted against the fully standardised FM change observed for each other method. The diagonal line in each panel represents the line of identity (i.e. the line of perfect agreement, with a slope of 1 and intercept of 0). The Pearson’s correlation coefficient (r), concordance correlation coefficient (CCC) and standard error of the estimate (SEE) are displayed for each comparison. Equations representing the linear relationship between FM changes detected by 4C and each other method are as follows. 4CDXA: y = 0·81x + 0·57; 3CSIRI: y = 0·99x – 0·02; 3CLOH: y = 0·98x + 0·76; DXA: y = 0·83x + 0·90; ADP: y = 0·91x + 1·28; BIS: y = 1·05x – 0·99; MFBIAS: y = 0·63x + 1·47; MFBIAIB: y = 0·58x + 0·83; SFBIA: y = 1·07x + 0·54; 3DOSS: y = 0·60x + 1·39; 3DOF3D: y = 0·60x + 1·48; 3DOSTY: y = 0·28x + 1·32 and DoD: y = 1·10x + 1·97. Statistically significant r and CCC values were observed for all methods except 3DOSTY, 3DOF3D and DoD.
Comparison of Standardised Body Fat Percentage Changes. The fully standardised (i.e. standardised pre- and post-assessments) four-component model (4C) body fat percentage (BFP) change is plotted against the fully standardised BFP change observed for each other method. The diagonal line in each panel represents the line of identity (i.e. the line of perfect agreement, with a slope of 1 and intercept of 0). The Pearson’s correlation coefficient (r), concordance correlation coefficient (CCC) and standard error of the estimate (SEE) are displayed for each comparison. Equations representing the linear relationship between BFP changes detected by 4C and each other method are as follows. 4CDXA: y = 0·72x + 0·47; 3CSIRI: y = 0·98x – 0·07; 3CLOH: y = 0·94x + 1·12; DXA: y = 0·63x + 0·82; ADP: y = 0·74x + 1·54; BIS: y = 1·15x – 1·28; MFBIAS: y = 0·44x + 1·65; MFBIAIB: y = 0·42x + 0·77; SFBIA: y = 0·78x + 0·88; 3DOSS: y = 0·19x + 1·39; 3DOF3D: y = 0·16x + 1·38; 3DOSTY: y = 0·02x + 0·95 and DoD: y = 1·22x + 2·32. Statistically significant r and CCC values were observed for all methods except MFBIAIB, 3DOSTY, 3DOF3D, 3DOSS and DoD.

Based on the Friedman test, ΔFFM values significantly differed between methods (χ 2(13) = 53·3, P < 0·0001, S = 20·3, Kendall’s W = 0·22 (small)). Pairwise comparisons indicated numerous differences between methods. All differences are displayed in online Supplementary Table S8. Methods differing from the 4C ΔFFM were DXA (P adj = 0·043, Sadj = 4·5), ADP (P adj = 0·006, Sadj = 7·4), BIS (P adj = 0·008, Sadj = 7·0), MFBIAS (P adj = 0·007, Sadj = 7·2) and 3DOF3D (P adj = 0·045, Sadj = 4·5). Equivalence testing indicated that 4CDXA, 3CSIRI, 3CLOH, DXA, BIS, MFBIAIB, SFBIA and 3DOSTY demonstrated equivalence with 4C ΔFFM based on a ±1·5-kg equivalence region (online Supplementary Fig. S11). ADP, MFBIAS, 3DOSS, 3DOF3D and DoD did not demonstrate equivalence. Bland–Altman analysis indicated statistically significant proportional bias for BIS, MFBIAS, 3DOSS and DoD (Fig. 7). For ΔFFM, the linear relationship between 4C and 4CDXA, 3CSIRI, 3CLOH and MFBIAIB exhibited slopes and intercepts that did not significantly differ from 1 and 0, respectively (Fig. 4). The relationship between 4C and DXA, ADP, 3DOSTY, 3DOF3D, 3DOSS, MFBIAS, BIS and SFBIA exhibited slopes that differed from 1, and 3DOSS and DoD exhibited intercepts that differed from 0. r values ranged from 0·32 to 1·00, with CCC values of 0·24 to 1·00 and standard error of the estimate values of 0·17 to 3·57 kg (Fig. 4).
Bland–Altman Analysis for Fat-Free Mass Changes. Each panel depicts Bland–Altman analysis, with the solid diagonal line representing the relationship between the difference in fat-free mass (FFM) changes – calculated as the alternate method change minus the 4C change – and the average of alternate and 4C changes. The shaded regions around the diagonal line indicate the 95 % confidence limits for linear regression lines, the horizontal dashed lines indicate the upper and lower limits of agreement (LOA) and the horizontal solid line indicates the mean difference between methods. Slopes of linear regression lines significantly differed from 0 for BIS (P = 0·003), MFBIAS (P = 0·04), 3DOSS (P = 0·006) and DoD (P < 0·0001), but not 4CDXA (P = 0·77), 3CSIRI (P = 0·76), 3CLOH (P = 0·81), DXA (P = 0·37), ADP (P = 0·11), MFBIAIB (P = 0·97), SFBIA (P = 0·71), 3DOF3D (P = 0·25) or 3DOSTY (P = 0·23). Intercepts did not differ from 0 for any method (P > 0·12), with the exception of DoD (P < 0·0001).
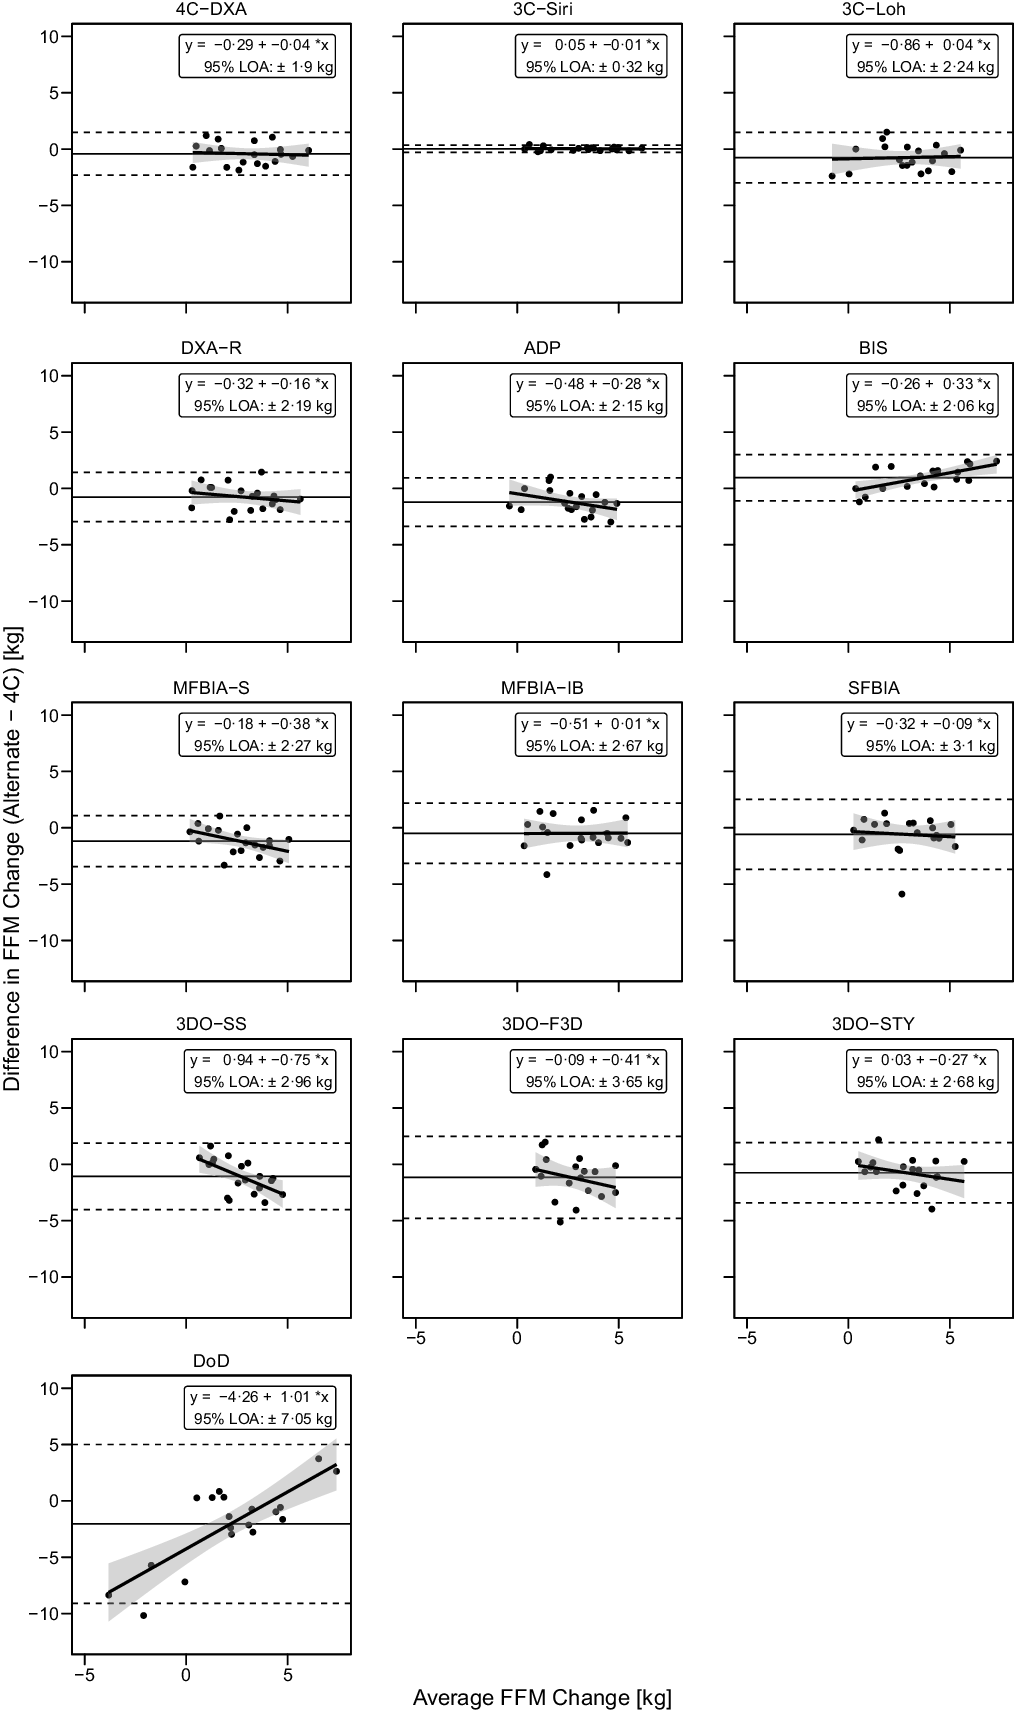
Based on the Friedman test, ΔFM values significantly differed between methods (χ 2(13) = 53·3, P < 0·0001, S = 20·3, Kendall’s W = 0·22 (small)). Pairwise comparisons indicated numerous differences between methods. All differences are displayed in online Supplementary Table S9. Methods differing from the 4C ΔFM were DXA (P adj = 0·043, Sadj = 4·5), ADP (P adj = 0·006, S = 7·4), BIS (P adj = 0·008, Sadj = 7·0), MFBIAS (P adj = 0·007, Sadj = 7·2) and 3DOF3D (P adj = 0·045, Sadj = 4·5). Equivalence testing indicated that 4CDXA, 3CSIRI, 3CLOH, DXA, BIS, MFBIAIB, SFBIA and 3DOSTY demonstrated equivalence with 4C ΔFM based on a ±1·5-kg equivalence region (online Supplementary Fig. S12). ADP, MFBIAS, 3DOSS, 3DOF3D and DoD did not demonstrate equivalence. Bland–Altman analysis indicated statistically significant proportional bias for SFBIA and DoD (Fig. 8). For ΔFM, the linear relationship between 4C and 3CSIRI, SFBIA and DoD exhibited slopes and intercepts that did not significantly differ from 1 and 0, respectively (Fig. 5). 4CDXA, 3CLOH, ADP, DXA, MFBIAS, MFBIAIB, BIS, 3DOF3D and 3DOSS exhibited slopes that did not differ from 1, but intercepts that differed from 0. 3DOSTY exhibited a slope and intercept that differed from 1 and 0, respectively. r values ranged from 0·38 to 0·99, with CCC values of 0·19 to 0·99 and standard error of the estimate values of 0·17 to 3·70 kg (Fig. 5).
Bland–Altman Analysis for Fat Mass Changes. Each panel depicts Bland–Altman analysis, with the solid diagonal line representing the relationship between the difference in fat mass (FM) changes – calculated as the alternate method change minus the 4C change – and the average of alternate and 4C changes. The shaded regions around the diagonal line indicate the 95 % confidence limits for linear regression lines, the horizontal dashed lines indicate the upper and lower limits of agreement (LOA) and the horizontal solid line indicates the mean difference between methods. Slopes of linear regression lines significantly differed from 0 for SFBIA (P = 0·02) and DoD (P < 0·0001), but not 4CDXA (P = 0·74), 3CSIRI (P = 0·84), 3CLOH (P = 0·12), DXA (P = 0·41), ADP (P = 0·26), BIS (P = 0·08), MFBIAS (P = 0·93), MFBIAIB (P = 0·77), 3DOSS (P = 0·44), 3DOF3D (P = 0·12) or 3DOSTY (P = 0·19). Intercepts differed from 0 for ADP (P = 0·02), BIS (P = 0·0003), MFBIAS (P = 0·01) and 3DOSTY (P = 0·02), but no other methods (P > 0·11).

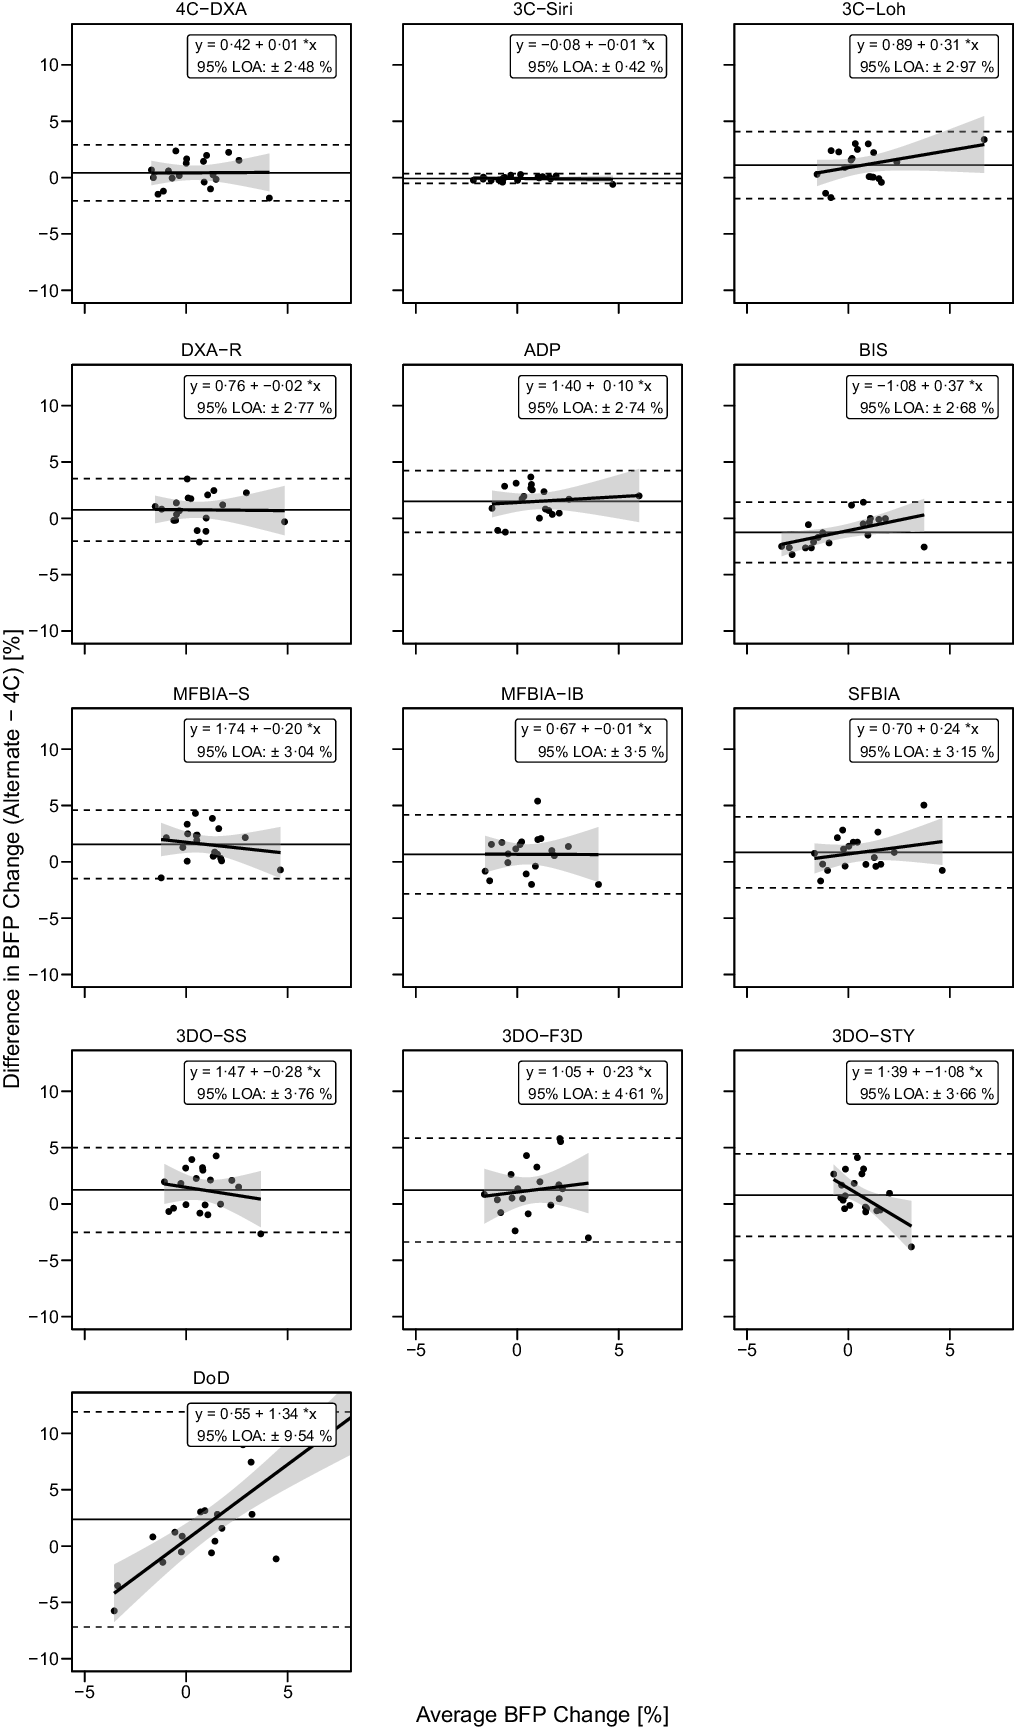
Based on the Friedman test, ΔBF% values significantly differed between methods (χ 2(13) = 48·8, P < 0·0001, S = 17·7, Kendall’s W = 0·20 (small)). Pairwise comparisons indicated numerous differences between methods. All differences are displayed in online Supplementary Table S10. Methods differing from the 4C ΔBF% were 3CLOH (P adj = 0·034, Sadj = 4·9), ADP (P adj = 0·005, Sadj = 7·6), BIS (P adj = 0·005, Sadj = 7·6) and MFBIAS (P adj = 0·005, Sadj = 7·6). Equivalence testing indicated that 4CDXA, 3CSIRI, 3CLOH, DXA, BIS, MFBIAIB, SFBIA and 3DOSTY demonstrated equivalence with 4C ΔBF% based on a ±2·0 % equivalence region (online Supplementary Fig. S13). ADP, MFBIAS, 3DOSS, 3DOF3D and DoD did not demonstrate equivalence. Bland–Altman analysis indicated statistically significant proportional bias for BIS, 3DOSTY and DoD (Fig. 9). For ΔBF%, 4CDXA, 3CSIRI and DoD did not exhibit slopes or intercepts that differed from 1 and 0, respectively (Fig. 6). 3CLOH, ADP, DXA, BIS and SFBIA demonstrated a slope that did not differ from 1 but an intercept that differed from 0. MFBIAS, MFBIAIB, 3DOSTY, 3DOF3D and 3DOSS exhibited slopes and intercepts that differed from 1 and 0, respectively. r values ranged from 0·03 to 0·99, with CCC values of 0·02 to 0·99 and standard error of the estimate values of 0·22 to 5·00 % (Fig. 6).
Bland–Altman Analysis for Body Fat Percentage Changes. Each panel depicts Bland–Altman analysis, with the solid diagonal line representing the relationship between the difference in body fat percentage (BFP) changes – calculated as the alternate method change minus the 4C change – and the average of alternate and 4C changes. The shaded regions around the diagonal line indicate the 95 % confidence limits for linear regression lines, the horizontal dashed lines indicate the upper and lower limits of agreement (LOA) and the horizontal solid line indicates the mean difference between methods. Slopes of linear regression lines significantly differed from 0 for BIS (P = 0·02), 3DOSTY (P = 0·01) and DoD (P < 0·0001), but not 4CDXA (P = 0·96), 3CSIRI (P = 0·65), 3CLOH (P = 0·13), DXA (P = 0·95), ADP (P = 0·63), MFBIAS (P = 0·48), MFBIAIB (P = 0·98), SFBIA (P = 0·31), 3DOSS (P = 0·46) or 3DOF3D (P = 0·60). Intercepts differed from 0 for 3CLOH (P = 0·03), DXA (P = 0·048), ADP (P = 0·002), BIS (P = 0·001), MFBIAS (P = 0·001), 3DOSS (P = 0·01) and 3DOSTY (P = 0·005), but not other methods (P > 0·09).
Discussion
The present investigation examined the impact of unstandardised assessments when quantifying longitudinal changes in body composition in response to RT and a high-energy diet. Additionally, the comparability of different assessment methods for longitudinal tracking in standardised conditions was presented. A major finding was that some methods – particularly DXA and select digital anthropometry techniques – were relatively robust to unstandardised conditions, while most methods demonstrated meaningful errors when unstandardised conditions were present for one or both of the pre- or post-intervention assessments. In standardised conditions, 4CDXA and 3CSIRI demonstrated the highest overall agreement with the criterion 4C model – as indicated by the presence of statistical equivalence, a lack of significant differences, a lack of proportional bias and significant r and CCC correlations for all three body composition variables (i.e. FFM, FM and BF%). 3CLOH, MFBIAIB and SFBIA demonstrated the same features for two of the three body composition variables, while DXA and 3DOSTY demonstrated them for one of the three variables. While some of the remaining methods (i.e. ADP, BIS, MFBIAS, 3DOSS, 3DOF3D and DoD) demonstrated potentially acceptable performance for select metrics, their positive performance was less consistent.
Although numerous studies have documented the potential for transient, artificial changes in body composition estimates in response to food ingestion, fluid intake or exercise(Reference Tinsley, Morales and Forsse3,Reference Lytle, Stanelle and Kravits49–Reference Gallagher, Walker and O’Dea54) , limited prior data have demonstrated the longitudinal implications of these errors(Reference Kerr, Slater and Byrne6,Reference Nana, Slater and Hopkins38) . In this regard, Kerr et al. (Reference Kerr, Slater and Byrne6) performed an informative investigation of the consequences of unstandardised assessments before and after a 6-month period of unsupervised training in exercising adults. Several assessment methods were employed, including 3C and 4C models, DXA, BIS, ADP and skinfold thickness assessments. The ability of unstandardised assessments to confound real changes in body composition was clearly demonstrated by this investigation, although the magnitude of errors observed with distinct methods varied widely. For the 4C model in standardised conditions, the mean changes observed after 6 months were a small 0·3-kg increase in FFM and a 0·2-kg decrease in FM. When baseline assessments were standardised and final assessments were unstandardised – analogous to SU in the present study – increases in FFM and decreases in FM were artificially increased, particularly in methods containing TBW estimates (i.e. multi-component models and BIS). Specifically, mean increases in FFM for these methods ranged from 0·2 to 0·3 kg in standardised conditions as compared with 1·5–1·9 kg when the final assessment was unstandardised. For FM, the mean standardised changes for these methods ranged from –0·2 to 0·1 kg, with changes of –0·6 to –1·0 kg when the final assessment was unstandardised. Furthermore, when both baseline and final assessments were unstandardised – analogous to UU in the present study – Kerr et al. (Reference Kerr, Slater and Byrne6) observed that the direction of mean changes was actually reversed for some methods relative to the changes observed in fully standardised conditions. For example, mean changes in FFM for multi-component models and BIS ranged from –0·2 to –0·7 kg, with mean changes in FM ranging from 0·2 to 0·7 kg in unstandardised conditions. Clearly, substantial differences in the interpretation of months-long, group-level body composition changes could occur depending on the presence or absence of adequate standardisation immediately preceding assessments. Furthermore, differences at the individual level were even more pronounced in many cases.
In contrast to the small mean body composition changes observed by Kerr et al. (Reference Kerr, Slater and Byrne6), the mean and standard deviation increase in 4C FFM in standardised conditions (i.e. SS) for the present study was 3·2 (sd 1·8) kg, with a mean increase in FM of 0·8 (sd 1·4) kg. This was a result of the supervised, progressive RT programme and intentional implementation of a hyperenergetic diet. Due to the large increase in FFM observed in the present study, most methods demonstrated a mean increase in FFM regardless of standardisation conditions. However, the magnitude of increase in FFM varied based on standardisation; changes were often artificially inflated in SU and artificially diminished in US, as in Kerr et al. (Reference Kerr, Slater and Byrne6). While mean changes observed in UU were sometimes similar to SS, the changes were generally more variable, as indicated by the spread of individual data points and sd of change scores. Averaged across methods, the sd of changes in FFM was 1·79 kg for SS as compared with 2·18 kg for UU. In contrast to FFM, the smaller changes in FM and BF% caused mean changes in these variables to be directionally reversed in different standardisation conditions for some methods.
Although focusing solely on DXA, Nana et al. (Reference Nana, Slater and Hopkins38) also demonstrated the concerning longitudinal effects induced by unstandardised assessments. Body composition changes were estimated during a 6-week training programme with or without cold water immersion therapy. On three separate occasions, DXA assessments were performed both under standardised and random conditions within a single day. A major finding was that the variability of BM and fat-free soft tissue changes – as indicated by the sd of change scores – was approximately twice as large in unstandardised conditions. Importantly, the researchers concluded that a unique effect of the cold water immersion therapy – a possible detriment to fat-free soft tissue – could have been completely undetectable if solely unstandardised conditions had been implemented(Reference Nana, Slater and Hopkins38). Unfortunately, the extent to which small-but-real effects have gone undetected in the literature, due to suboptimal standardisation prior to body composition estimation, is inestimable due to the frequency of inadequate reporting of body composition standardisation procedures. Conversely, it is possible that some body composition changes reported under unstandardised conditions are artificial, caused by random or systematic differences between subject presentation at different time points.
While recommendations for standardising various aspects of body composition assessments have been presented(Reference Ackland, Lohman and Sundgot-Borgen55,Reference Kyle, Bosaeus and De Lorenzo56) , there are no unified guidelines concerning standardisation. Indeed, the wide variety of technologies, specific devices, and purposes for body composition estimation may preclude recommendations that are universally applicable. Kyle et al. (Reference Kyle, Bosaeus and De Lorenzo56) detailed recommendations for participant standardisation prior to bioimpedance assessments, which included proper height and weight assessments; food, drink and alcohol abstention; voiding of urinary bladder; timing of physical activity or exercise; skin condition and electrode, limb and body positioning. The authors stated that bioimpedance metrics are most influenced by whether the participants are in a fasted or fed state and recommended a ≥ 8-h period of fasting and no alcohol intake. However, some commercial bioimpedance analysers recommend shorter abstention periods(Reference Kerr, Slater and Byrne6). In the Official Positions of the International Society for Clinical Densitometry, Hangartner et al. (Reference Hangartner, Warner and Braillon57) recommend consistent preparation of the participant – including implementation of fasting, voiding the urinary bladder and standardisation of the time of day and prior physical activity – prior to body composition estimation via DXA. The positions further state that scanning after an overnight fast provides the best conditions for reproducible measurements. However, Ackland et al. (Reference Ackland, Lohman and Sundgot-Borgen55) highlight the appeal of DXA for body composition assessment in active individuals due to its measurements being minimally influenced by fluid fluctuations. The present study also supports the robustness of DXA in less-than-ideal standardisation conditions, with this technology arguably demonstrating the best overall performance in the context of the present study. Although DXA has limitations when compared with criterion multi-component models(Reference Tinsley12,Reference Heymsfield, Ebbeling and Zheng37,Reference Toombs, Ducher and Shepherd58) , the present results demonstrate an advantage of DXA in unstandardised conditions and indicate that the use of multi-component models should be restricted to standardised conditions. The cumulative error introduced by the multiple input terms within a 4C model – BM, BV, TBW and Mo – likely all make contributions to the errors observed in unstandardised conditions, although the influence of TBW may be particularly large. Therefore, in situations in which standardisation is not possible, other methods that are less influenced by acute bodily disturbances – such as DXA or anthropometry – may be more appropriate.
In standardised conditions, 4CDXA and 3CSIRI demonstrated the highest overall agreement with the criterion 4C model, with 3CLOH, MFBIAIB, SFBIA, DXA and 3DOSTY generally performing well also. Due to the greater difficulty of conducting longitudinal validity studies, as compared with simple cross-sectional investigations, relatively limited data are available to indicate the comparability of methods to track body composition changes over time, as compared with a multi-component model criterion. Santos et al. (Reference Santos, Silva and Matias59) reported that DXA (Hologic QDR 4500A) presented only moderate accuracy for detecting body composition changes in elite judo athletes, as compared with a 4C model. The reported Pearson’s correlations (r) between DXA and 4C for changes in FFM, FM and BF% ranged from 0·53 to 0·62. In the present investigation, stronger correlations of 0·64 to 0·78 were observed. A multitude of differences – including the specific DXA hardware and software, as well as the participant population and intervention – could have contributed to these differences. Pourhassan et al. (Reference Pourhassan, Schautz and Braun60) performed an informative investigation of multiple body composition techniques, as compared with a 4C model, in the contexts of weight loss, weight gain and weight stability. In the context of weight gain, DXA (Hologic QDR 4500A) demonstrated r values of –0·19 to 0·37 for FM and FFM changes. ADP (Cosmed BOD POD) also demonstrated very poor agreement, with r values of only 0·04–0·16 for FM and FFM changes. In the present study, much stronger agreement was observed (r of 0·68 to 0·79), which may be attributable to the intervention – which involved an intentional energetic surplus and structured RT programme – and consistency of the follow up period as compared with the previous study(Reference Pourhassan, Schautz and Braun60). Interestingly, as compared with relationships observed for those who gained weight, Pourhassan et al. (Reference Pourhassan, Schautz and Braun60) reported stronger correlations for FM and FFM changes in the context of weight loss for ADP (r: 0·19 to 0·46), as well as a stronger correlation for DXA FM changes (r: 0·66) but no correlation for DXA FFM changes (r: –0·02). These findings suggest that the context in which longitudinal comparisons of methods are made influences the observed strength of relationship, as previously postulated(Reference Tinsley and Moore2). Additionally, the specific hardware and software of methods can meaningfully influence output and limit generalisability within a broad technological category(Reference Stratton, Smith and Harty9,Reference Hangartner, Warner and Braillon57,Reference Tinsley, Moore and Benavides61) .
While the data presented in this manuscript and the accompanying supplementary materials may serve as a resource for researchers and practitioners to better understand the influence of standardisation on interpretation of longitudinal body composition changes – as well as the performance of common methods in standardised conditions – there are also limitations of the present work. As noted, the specific intervention may influence the agreement between methods, and the present results cannot be appropriately generalised to body composition tracking in all contexts or even all contexts in which weight gain occurs. The present study recruited only male participants due to data indicating a desire for BM gain in non-overweight university males as compared with a desire for BM loss in normal-weight university females(Reference Neighbors and Sobal62). Additionally, the sample size was relatively small and selected for feasibility reasons. Use of BIS TBW estimates, rather than those from a dilution technique, is a potential limitation of the multi-component models, although prior investigations have validated both BIA and BIS for TBW estimation in groups of healthy adults(Reference Haas, Schütz and Engeli63–Reference Kerr, Slater and Byrne65). Additionally, the use of dilution techniques for TBW estimation is uncommon in applied research and field settings, and using bioimpedance-based TBW estimates in a multi-component model is superior to simply utilising 2C models that assumes constant FFM properties(Reference Kerr, Slater and Byrne65). Finally, while the inclusion of the unstandardised assessments was for generalisability to settings in which pre-assessment activities of participants may not standardise or known, objective quantification of the activities performed by participants prior to the unstandardised assessments could have provided additional information regarding the factors making the largest contributions to the observed errors.
In summary, the present study indicates the importance of controlling and documenting standardisation procedures prior to body composition assessments, particularly for longitudinal investigations. This is especially critical when changes in body composition are expected to be small, and rigorous procedural standardisation may increase the likelihood that small-but-real changes can be detected. However, the effects of standardisation also varied between technologies, with some – particularly DXA and select digital anthropometry techniques – being more robust against errors. Differences in the ability of common assessment techniques to accurately estimate body composition changes in standardised conditions were also observed. Considering the details of body composition assessment methodology can aid interpretation of longitudinal data and allow for an appropriate degree of confidence be apportioned to observed changes.
Supplementary material
To view supplementary material for this article, please visit https://doi.org/10.1017/S0007114521002579
Acknowledgements
The authors would like to acknowledge Sarah White, Abegale Williams, Marqui Benavides, Baylor Johnson and Jacob Dellinger for their critical assistance in data collection and processing.
No financial support was received for the present investigation. The dietary supplement utilised in the present study was donated by Dymatize® Nutrition (Dallas, TX, USA). This entity played no role in the study design, execution or the preparation of the present communication.
G. M. T.: conceptualisation, data curation, formal analysis, investigation, methodology, project administration, resources, software, supervision, validation, visualisation, writing – original draft and writing – reviewing and editing. P. S. H.: data curation, investigation, project administration, supervision and writing – reviewing and editing. M. T. S.: data curation, investigation, project administration, supervision and writing – reviewing and editing. R. W. S.: conceptualisation, data curation, investigation, methodology, project administration, supervision and writing – reviewing and editing. C. R.: data curation, investigation, project administration, supervision and writing – reviewing and editing. M. R. S.: writing – reviewing and editing.
G. M. T. has received in-kind support for his research laboratory, in the form of equipment loan or donation, from manufacturers of body composition assessment devices, including Size Stream, LLC; Naked Labs Inc.; RJL Systems; MuscleSound; and Biospace, Inc. (DBA InBody). The remaining authors have no relevant interests to declare.
This study was conducted according to the guidelines laid down in the Declaration of Helsinki and all procedures involving human subjects were approved by the Texas Tech University Institutional Review Board (IRB2019-356).



