

The timing of puberty is a consistent predictor of chronic disease risk and mortality. Age at menarche, a valid indicator of sexual maturation in girls at the population level, is inversely related to risk of breast( Reference Hsieh, Trichopoulos and Katsouyanni 1 ) and endometrial( Reference Dossus, Allen and Kaaks 2 ) cancers, cardiometabolic disease( Reference Canoy, Beral and Balkwill 3 ) and all-cause mortality( Reference Charalampopoulos, McLoughlin and Elks 4 ). At least 40 % of the variability in age at menarche is attributable to the effects of environmental exposures( Reference Morris, Jones and Schoemaker 5 ), yet few of them have been characterised.
Nutritional factors during infancy and childhood could play an important role in determining the onset of puberty( Reference Villamor and Jansen 6 ). Although many studies have focused on the impact of early life energy balance, very few well-conducted investigations have addressed the effects of specific foods and nutrients. Intake frequency of red meat in middle childhood was inversely associated with age at menarche in a longitudinal study( Reference Jansen, Marín and Mora-Plazas 7 ). The mechanisms to explain this potential effect are unknown; however, they could be related to nutrients for which red meat is a major dietary source, including micronutrients such as Fe, Zn and vitamin B12. Because these nutrients are essential for survival and development of the offspring, evolutionary theory might predict that readiness for reproduction should be conditional on achieving adequate stores; analogous to the prediction of the need to reach a critical level of fat stores in order to initiate puberty( Reference Frisch 8 ). Thus, higher intake of these nutrients during childhood should be related to earlier age at onset of puberty. Nevertheless, results from a few longitudinal studies of childhood diet and age at menarche have been inconsistent( Reference Kissinger and Sanchez 9 – Reference Rogers, Northstone and Dunger 12 ) and virtually no previous studies have employed objective micronutrient status biomarkers assessed during childhood as the exposures.
We conducted a prospective investigation to examine the associations of Hb, plasma ferritin, mean corpuscular volume (MCV), serum Zn, plasma vitamin B12, erythrocyte folate and plasma retinol in middle childhood with age at menarche. We hypothesised that higher concentrations of these biomarkers would be related to earlier age at menarche.
Methods
Study design and population
We conducted a longitudinal study in the context of the Bogotá School Children Cohort (BoSCCo) a prospective investigation of nutrition and health of Colombian children. Details of the study design have been reported previously( Reference Arsenault, Mora-Plazas and Forero 13 ). In brief, we recruited a random sample of 3202 children aged 5–12 years from the public primary school system of Bogotá, Colombia, in February 2006. These children were representative of low- and middle-income families in the city at the time, because most public school students in Bogotá are from these socioeconomic strata.
Baseline information
At the time of recruitment, we obtained information on child, parental and household characteristics with the use of a questionnaire self-administered by the parents. The form included questions on parental age, education level, family composition, maternal parity, age at menarche, height and weight, and on the child’s background and habits including birthdate, birthplace and time habitually spent playing outdoors. It also inquired about socioeconomic status (SES) indicators such as ownership of common household assets and the SES classification of the household according to the local government. The presence of food insecurity was evaluated through a validated modified version of the United States Department of Agriculture Household Food Security Survey Module( Reference Harrison, Stormer and Herman 14 ).
In the weeks following enrolment, trained research assistants visited the schools to obtain anthropometric measurements from the children. Weight was measured in light clothing to the nearest 0·1 kg on Tanita HS301 electronic scales (Tanita Arlington Heights), and height was measured without shoes to the nearest 1 mm with wall-mounted Seca 202 stadiometers (Seca). Investigators asked girls whether or not they had started menstruating. At the same visits, the research assistants obtained fasting blood samples through antecubital venepuncture in 88 % of participating children. One aliquot was collected in an EDTA-coated tube and a second one in a metal-free polypropylene tube without anticoagulant for separation of serum. The samples were protected from sunlight and transported in refrigerated coolers on the day of collection to the Colombian National Institute of Health, where they were processed and cryostored for future analyses.
Follow-up
In-person follow-up visits occurred in June and November 2006, at least once between 2007 and 2009, and at least once between 2011 and 2015. These visits typically took place at school, or at home if children were absent from school. In addition to in-person visits, girls’ homes were called on the phone at least once a year. At each in-person or telephonic contact, girls were asked if they had begun menstruation and, if they had, the date of their first menstrual period. Major holidays and school vacation periods were used to aid the girls’ recall of the date of menarche if needed.
This study was conducted according to the guidelines laid down in the Declaration of Helsinki and all procedures involving human subjects were approved by the Ethics Committee of the National University of Colombia and the University of Michigan Health Sciences and Behavioural Sciences Institutional Review Board. Written informed consent from parents or primary caregivers of all children and the children’s assent to participate were obtained before enrolment.
Laboratory methods
Micronutrient status biomarkers were quantified in the blood samples collected at baseline at the Colombian National Institute of Health, Bogotá. Hb concentrations and MCV were determined on an automated hematology analyzer. Plasma ferritin concentrations were measured using a competitive chemiluminescent immunoassay in an ADVIA Centaur analyzer (Bayer Diagnostics). C-reactive protein (CRP) concentrations were measured using a turbidimetric immunoassay on an ACS180 analyzer (Bayer Diagnostics). Serum Zn concentrations were determined using an atomic absorption technique( Reference Makino and Takahara 15 ) on a Shimadzu AA6300 spectrophotometer (Shimadzu Scientific Instruments). Plasma vitamin B12 and erythrocyte folate were quantified using a competitive chemiluminescent immunoassay in the ADVIA Centaur analyzer. Plasma retinol (vitamin A) was measured with use of high performance liquid chromatography on a Waters 600 System (Waters Corporation).
Data analysis
Of the 3202 children enrolled, 1635 (51·1 %) were girls. Among them, twenty-six had experienced menarche by the time of recruitment and were excluded. Other exclusions involved 143 girls who were lost to follow-up before the first assessment post-baseline and two girls diagnosed with Turner syndrome who were undergoing hormonal therapy. Thus, the analytic sample size consisted of 1464 girls.
We estimated the outcome, age at menarche, as date of menarche minus date of birth, in decimal years. Among 228 girls (15·6 %) who did not recall the day of the month when menarche occurred, we imputed the 15th. In another 101 girls (6·9 %) who only remembered the year of menarche, 1 July was imputed for the calculation of age at menarche. The girl’s mother was the primary informant of the occurrence or date of menarche in 197 participants (13·5 %). In all, 19 % of girls (n 280) did not have menarche during follow-up and were censored at the last contact date.
The main exposures of interest were micronutrient status biomarkers. Hb is an indicator of anaemia due to different causes, including deficiencies of Fe, folate, vitamin B12 or vitamin A, inflammation and some genetic disorders( 16 ). MCV and ferritin were used as indicators of Fe stores in the body( Reference Zimmermann and Hurrell 17 ). Hb, MCV and ferritin were categorised into quartiles of their distributions in the study population. We did not consider anaemia (low Hb) or Fe deficiency (low ferritin) as dichotomous exposures because very few girls (<4 %) had values under the cut-points conventionally used to define these conditions. Serum Zn and erythrocyte folate were used as biomarkers of intake at the population level and also categorised into quartiles. Plasma vitamin B12, a marker of animal food sources intake( Reference Villamor, Mora-Plazas and Forero 18 ), was categorised as <222 or ≥222 pmol/l according to a conventional cut point to represent marginal status( Reference Allen 19 ). Vitamin A status was categorised using conventional cut-points of plasma retinol concentrations as<0·70, 0·70–1·04, or ≥1·05 µmol/l( Reference de Pee and Dary 20 ). All micronutrient biomarker indicators were also examined as continuous variables. CRP concentration was also considered in the analyses as an indicator of inflammation, which could affect ferritin and retinol levels.
Covariates included sociodemographic, anthropometric, and health-related characteristics assessed at the time of recruitment. Girls’ height- and BMI-for-age z scores were calculated from measured values with the use of the WHO growth reference for children aged 5–19 years( Reference de Onis, Onyango and Borghi 21 ). Maternal BMI (kg/m2) was estimated from weight and height values objectively measured in 29 % and from self-reported values in the rest. Covariates were categorised as presented in Table 1.
Age at menarche in 1464 school-age girls from Bogotá, Colombia according to sociodemographic and anthropometric characteristics (Hazard ratios (HR) and 95 % confidence intervals)
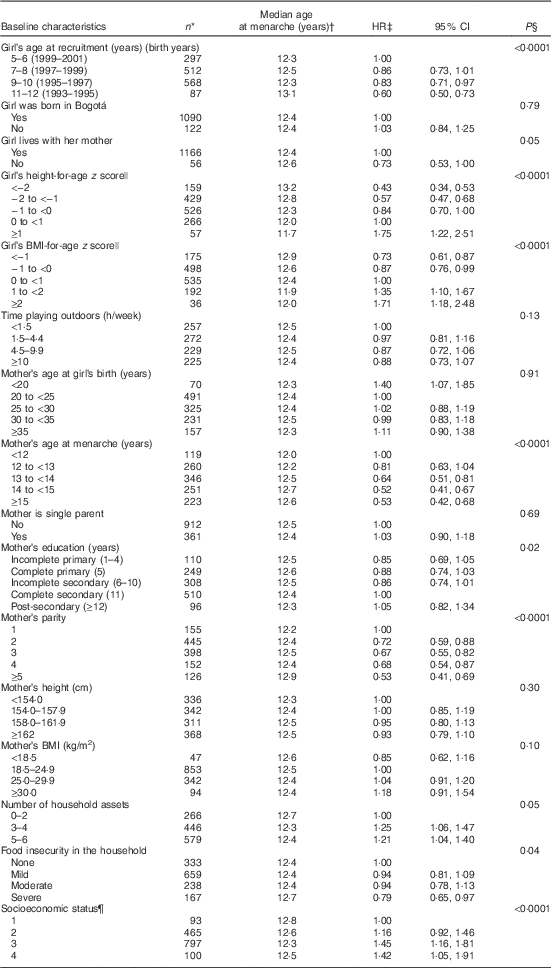
* Totals may be <1464 due to missing values.
† From Kaplan–Meier survival probabilities.
‡ From Cox proportional hazards models with age at menarche as the outcome and indicator variables for each predictor as the covariates. The robust sandwich covariance matrix estimate was specified in each model to account for siblings in the sample.
§ For ordinal predictors, test for trend (Wald) when a covariate representing ordinal categories of the predictor was introduced into the model as continuous. For dichotomous variables, χ 2 test.
|| According to the WHO reference.
¶ Ranking according to the city’s classification of neighbourhoods’ public services fees. One is the lowest rank.
We investigated the associations between predictors of interest and age at menarche with the use of time-to-event techniques including Kaplan–Meier survival probabilities and Cox regression. These methods adequately account for right-censoring of the outcome as some girls did not reach menarche during follow-up. In bivariate analyses, we first estimated median ages at menarche from Kaplan–Meier curves and hazard ratios (HR) with 95 % CI from Cox proportional-hazard models by categories of sociodemographic, anthropometric, and health-related characteristics. Age in decimal years was the time scale in the Cox models. HR>1 indicate an earlier menarche compared with the reference category, whereas HR<1 indicate a later menarche. For ordinal predictors, we conducted tests for linear trend by introducing into the Cox model a variable representing ordinal categories of the predictor as a continuous covariate. For dichotomous predictors we estimated χ 2 tests. The robust sandwich covariance matrix estimate( Reference Lin and Wei 22 ) was specified in each Cox model to account for siblings in the sample.
Next, we examined the associations of each micronutrient status indicator with age at menarche with use of the same methods. Micronutrient biomarkers were considered both as categorical and as continuous predictors as some of the associations seemed reasonably linear. We estimated HR with 95 % CI per 1 sd difference in the distribution of each biomarker. We then conducted multivariable analyses by fitting a Cox regression model with the micronutrient status indicators and baseline covariates that were considered relevant from an aetiological viewpoint. Only variables that remained significantly associated with the outcome were retained in the final model. Because inflammation can affect circulating concentrations of some of the biomarkers considered, CRP was included in all multivariable models. Also, we conducted supplemental analyses excluding girls with CRP>10 mg/l. In the primary analytic strategy we deliberately excluded the girls’ height- and BMI-for-age z scores from the multivariable model because these variables could be on the causal path from micronutrient status to age at menarche. However, in supplemental analyses we added these covariates to the model.
As the potential effect of micronutrients on the onset of puberty could depend on the age at the time of exposure, we decided a priori to examine the associations of micronutrient biomarkers with age at menarche stratified by age at assessment of micronutrient status. We included cross-product terms between baseline age groups and micronutrient biomarker categories in the Cox model and tested the significance of the interactions with the use of χ 2 joint tests.
Because there were missing values on the micronutrient biomarkers and covariates, we conducted supplemental analyses using a Markov Chain Monte Carlo multiple imputation method to estimate missing values before inclusion in the multivariable model( Reference Schaefer 23 ). Results from ten multiple imputation cycles were combined to estimate adjusted HR and 95 % CI with the use of the PROC MIANALYZE routine of Statistical Analysis Software (SAS). All analyses were performed using SAS version 9.4 (SAS Institute).
Results
The mean age of girls at recruitment was 8·6 (sd 1·7) years. Mean height- and BMI-for-age z scores were −0·76 (sd 1·01) and 0·08 (sd 0·93), respectively. Hb, ferritin, and MCV concentrations were 145 (sd 11) g/l, 43·2 (sd 23·2) µg/l and 86·5 (sd 5·2) fl on average. Mean Zn, vitamin B12, erythrocyte folate and retinol concentrations were 21·3 (sd 6·2) µmol/l, 337 (sd 108) pmol/l, 846 (sd 236) nmol/l and 1·04 (sd 0·35) µmol/l, respectively. Mean CRP was 1·6 (sd 2·9) mg/l.
Median follow-up time was 5·7 (interquartile range (IQR) 2·6, 6·8) years. During this time, 1184 of the girls (80·9 %) experienced menarche. The estimated median age at menarche was 12·44 (IQR 11·72, 13·26) years. Age at menarche was significantly, inversely associated with year or birth, baseline height- and BMI-for-age z scores, maternal education, the number of household assets and the household’s SES (Table 1). Maternal age at menarche and parity, and the presence of food insecurity in the household were positively related to age at menarche.
In bivariate analyses, Hb concentrations in middle childhood were inversely associated with age at menarche (Table 2). Every 1 sd of Hb (11 g/l) was related to a 7 % (95 % CI 2, 13; P=0·01) higher probability of experiencing menarche at any given time of follow-up. By contrast, plasma ferritin was positively related to age at menarche. The probability of having menarche was 8 % lower (95 % CI 3, 13; P=0·002) for every 1 sd of ferritin (23·2 µg/l) during middle childhood. MCV was also positively related to age at menarche, although the association was only marginally significant. None of the other micronutrient status indicators examined was significantly associated with age at menarche (Table 2).
Age at menarche according to micronutrient status biomarkers in middle childhood among 1464 girls in Bogotá, Colombia (Hazard ratios (HR) and 95 % confidence intervals)
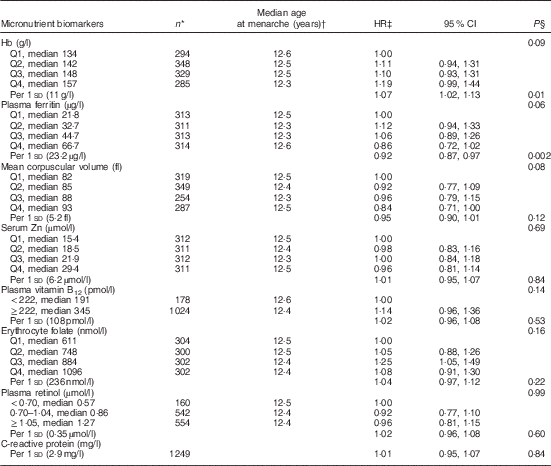
Q, quartile.
* Totals may be <1464 due to missing values.
† From Kaplan–Meier survival probabilities.
‡ From Cox proportional hazards models with age at menarche as the outcome and indicator variables for each biomarker as the covariates. The robust sandwich covariance matrix estimate was specified in each model to account for siblings in the sample.
§ For ordinal predictors, test for trend (Wald) when a covariate representing ordinal categories of the predictor was introduced into the model as continuous. For dichotomous variables and estimates per 1 sd, χ 2 test.
In analyses adjusted for age at recruitment, maternal age at menarche and parity, and SES (Table 3), Hb remained inversely associated with age at menarche (HR per 1 sd: 1·11; 95 % CI 1·04, 1·18; P=0·001), whereas ferritin was positively related to the outcome (HR per 1 sd: 0·94; 95 % CI 0·88, 0·99; P=0·02). The results were essentially unchanged after excluding twenty-four girls with CRP>10 mg/l (Hb HR: 1·10; 95 % CI 1·03, 1·17; P=0·004; ferritin HR: 0·94; 95 % CI 0·89, 0·99; P=0·03) or after performing multiple imputation of missing data (Table 3). Further adjustment for height- and BMI-for-age z scores did not change the associations of Hb or ferritin with age at menarche (see online Supplementary material and Table S1).
Multivariable-adjusted hazard ratios (HR) of menarche according to sociodemographic characteristics and iron status indicators in middle childhood (Hazard ratios and 95 % confidence intervals)
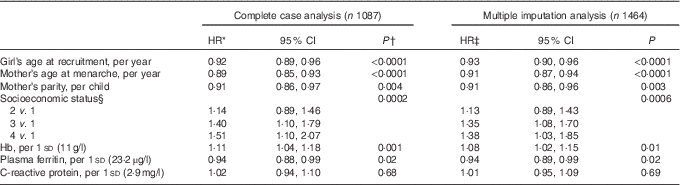
* From multivariable-adjusted Cox proportional hazards models with age at menarche as the outcome. Covariates included all variables presented. The robust sandwich covariance matrix estimate was specified in each model to account for siblings in the sample.
† Wald test. For socioeconomic status, test for trend (Wald) when a covariate representing ordinal categories of the predictor was introduced into the model as continuous.
‡ From multivariable-adjusted Cox proportional hazards models fit on a dataset obtained through Markov Chain Monte Carlo multiple imputation.
§ Ranking according to the city’s classification of neighbourhoods’ public services fees. One is the lowest rank.
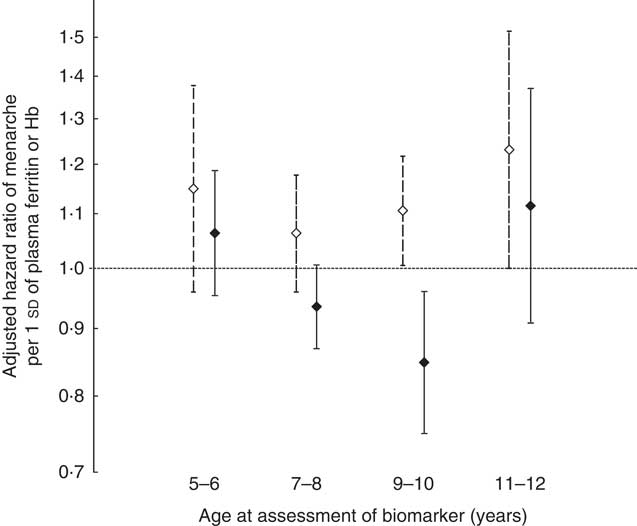
We examined whether the associations of Hb or ferritin with age at menarche differed depending on the age during middle childhood when the biomarkers were assessed (i.e. age at recruitment into the cohort). The association with Hb was not significantly modified by age at assessment of exposure (P test for interaction=0·60) (Fig. 1). Nevertheless, the association with ferritin was strongest and statistically significant only in girls who were between 9 and 10 years of age at the time of exposure assessment (P test for interaction=0·02) (Fig. 1). In this group, every 1 sd of plasma ferritin was associated with a 15 % (95 % CI 4, 25; P=0·009) lower chance of having menarche at any given point of follow-up. These estimates did not change substantially after imputing missing data (online Supplementary Table S2).
Adjusted hazard ratios of menarche in relation to 1 sd of Hb (11 g/l) or plasma ferritin (23·2 μg/l) concentrations according to age at assessment of the biomarker. Error bars represent 95 % CI. ![]() , Hb;
, Hb; ![]() , ferritin. Hazard ratios and 95 % CI were estimated with the use of multivariable-adjusted Cox proportional hazards models with age at menarche as the outcome and predictors that included age group at recruitment (three indicator variables), Hb or ferritin (continuous) and interaction terms between age group and Hb or ferritin. Covariates included the mother’s age at menarche in years (continuous), mother’s parity (continuous), socioeconomic status (three indicator variables), plasma ferritin (for the age–Hb interactions) or Hb (for the age-ferritin interactions), and C-reactive protein (continuous) (n 1087). The robust sandwich covariance matrix estimate was specified in each model to account for siblings in the sample.
, ferritin. Hazard ratios and 95 % CI were estimated with the use of multivariable-adjusted Cox proportional hazards models with age at menarche as the outcome and predictors that included age group at recruitment (three indicator variables), Hb or ferritin (continuous) and interaction terms between age group and Hb or ferritin. Covariates included the mother’s age at menarche in years (continuous), mother’s parity (continuous), socioeconomic status (three indicator variables), plasma ferritin (for the age–Hb interactions) or Hb (for the age-ferritin interactions), and C-reactive protein (continuous) (n 1087). The robust sandwich covariance matrix estimate was specified in each model to account for siblings in the sample.
Discussion
In this longitudinal investigation, higher Hb concentrations in middle childhood were related to earlier menarche, whereas higher ferritin concentrations were associated with later menarche, especially in girls who were 9–10 years of age at the time of micronutrient status assessment. None of the other micronutrient biomarkers studied was associated with age at menarche.
We had initially hypothesised that biomarkers of micronutrients present in animal food sources would be related to earlier menarche based on results from investigations that showed inverse associations between animal food intake in childhood and age at onset of menses. For example, in the BoSCCo study consuming red meat twice a day in middle childhood was related to a 64 % higher probability of reaching menarche during follow-up compared with an intake frequency of <4 times/week( Reference Jansen, Marín and Mora-Plazas 7 ). Also, higher meat intake in childhood was related to earlier menarche in girls from Korea( Reference Li, Paik and Joung 24 ), the UK( Reference Rogers, Northstone and Dunger 12 ) and the USA( Reference Kissinger and Sanchez 9 ). Some authors attributed this potential effect to the protein content of animal foods as intake of total animal protein( Reference Kissinger and Sanchez 9 , Reference Berkey, Gardner and Frazier 25 , Reference Gunther, Karaolis-Danckert and Kroke 26 ) or protein from dairy( Reference Gunther, Karaolis-Danckert and Kroke 26 – Reference Ramezani Tehrani, Mirmiran and Gholami 28 ) in childhood had also been related to earlier menarche. Nevertheless, animal foods are rich in nutrients other than protein, including highly bioavailable Fe, Zn, and vitamin B12, which were not considered in previous studies. Direct evidence for an effect of these micronutrients on age at menarche is very scant. Our findings on ferritin as an Fe status indicator and age at menarche are contrary to our initially study hypothesis; yet they are novel. Blood ferritin is an adequate indicator of Fe stores in the absence of inflammation at the population level( 16 ); thus, these findings could reflect a relation of Fe status with the timing of puberty. Only one previous longitudinal study addressed the relation of pre-menarcheal Fe status and age at menarche. Among eighty-nine Chilean girls aged 9–14 years in 1977, investigators noted an inverse correlation between baseline mean corpuscular Hb concentration, a proxy for Fe status, and age at menarche assessed years after the blood draw, presumably when the event had occurred in all girls( Reference Trujillo and Valenzuela 29 ). The correlation was only adjusted for age at the time of recruitment. Although ferritin was not measured, there were no associations with other indices including transferring saturation. Other studies have examined associations of pre-menarcheal Fe intake with age at menarche. Among 230 girls from California, dietary Fe assessed>1 years before menarche was positively related to age at menarche, consistent with our findings, although the analyses lacked control for potential confounding( Reference Kissinger and Sanchez 9 ). By contrast, among 2299 Canadian girls 10–11 years of age Fe intake was unrelated to age at menarche during a median 17-month follow-up( Reference Moisan, Meyer and Gingras 10 ); nevertheless, only 40 % of girls reached menarche during follow-up. Similarly, in the British Avon Longitudinal Study of Parents and Children (ALSPAC), Fe intake at 3 or 7 years of age was unrelated to age at menarche in 3298 girls( Reference Rogers, Northstone and Dunger 12 ).
The nature of a positive relation of plasma ferritin as a proxy for Fe status and age at menarche is unclear. Ferritin concentrations in our study population were generally high, consistent with the mean value reported by the Colombian National Nutrition Survey of 2005 for children 5–12 years of age in Bogota, 38·8 µg/l( 30 ). Hence, if Fe influences the timing of puberty, this effect may be observable only at high levels of exposure. The mechanisms underlying such a potential effect are speculative. A recent cross-sectional study of adults with metabolic syndrome found a strong inverse correlation between serum ferritin and leptin, independent of inflammation( Reference Gao, Li and Gabrielsen 31 ). In a rat model, dietary Fe overload decreased adipocyte expression of leptin( Reference Gao, Li and Gabrielsen 31 ). Leptin has been involved in triggering the onset of puberty( Reference Matkovic, Ilich and Skugor 32 , Reference Elias 33 ) through disinhibition of the pulsatile secretion of gonadotropin releasing hormone in the hypothalamus. It is conceivable that low leptin levels resulting from high dietary Fe around the time when puberty is triggered delay the cascade of events leading to physical manifestations of sexual development. The fact that the association was stronger in girls aged 9–10 years than it was in younger ones may suggest that exposure during a narrow window right before onset of puberty is more relevant than long-term exposure. Because menarche is a relatively late event of sexual development, exposure after 10 years of age may be irrelevant as the cascade of events leading to puberty would have been triggered before. Future studies are warranted to confirm this association in other populations.
The opposite directions of the associations of ferritin and Hb with age at menarche suggest that these biomarkers represent different underlying biological exposures. Hb is a poor correlate of Fe status( Reference Margolis, Hardison and Bender 34 ), especially when the prevalences of anaemia or Fe deficiency are as low as they are in this population( Reference Arsenault, Mora-Plazas and Forero 35 ). Furthermore, Hb might exert physiological actions beyond its well-known roles transporting oxygen and carbon dioxide. Hb is expressed in non-erythroid cells of many systems including the brain( Reference Xie and Yang 36 ) and the female reproductive tract( Reference Dassen, Kamps and Punyadeera 37 ). Thus, the inverse association between Hb and age at menarche might be explained by Hb itself. In the small study from Chile, Hb was not correlated with age at menarche( Reference Trujillo and Valenzuela 29 ). Whether Hb is involved in expression of leptin or other factors related to the onset of puberty remains to be elucidated in future investigations.
Age at menarche was unrelated to Zn, vitamin B12, folate and vitamin A status biomarkers. Very few longitudinal investigations have addressed the potential effect of these nutrients on the timing of puberty in girls, and none had done so with the use of biomarkers. In the ALSPAC cohort, Zn intake at 7 years of age was related to having menarche before 12 years 8 months( Reference Rogers, Northstone and Dunger 12 ). Childhood intake of nutrients involved in one-C metabolism, including vitamin B12 and folate, has not been related to age at menarche in longitudinal studies( Reference Kissinger and Sanchez 9 – Reference Rogers, Northstone and Dunger 12 ). In a cohort of 213 girls from Massachusetts, very high vitamin A intake at 10 years of age according to a FFQ was associated with earlier menarche( Reference Maclure, Travis and Willett 11 ). Conversely, studies that assessed diet with use of short-term intake methods( Reference Kissinger and Sanchez 9 , Reference Moisan, Meyer and Gingras 10 , Reference Rogers, Northstone and Dunger 12 ) did not find an association. Inconsistencies in the results across populations could be due to differences in the dietary assessment methods used, age at assessment, and internal validity due to biases typical of observational studies.
Our study has many strengths. First, its longitudinal design reduces the possibility of outcome misclassification and reverse causation bias. Second, the use of valid biomarkers of micronutrient status prevents recall bias in the exposure. Measurement errors of exposures and outcome are uncorrelated. Third, the sample size was large and representative of girls from public schools of a large city. Fourth, follow-up was high. Fifth, we had the possibility to consider important potential confounders in the analysis and to examine associations stratified by age. Finally, internal validity was high considering that the associations of known predictors of age at menarche were in the expected directions. For example, maternal age at menarche, parity and the household SES were positively related to age at onset of menses( Reference James-Todd, Tehranifar and Rich-Edwards 38 , Reference Jansen, Herran and Villamor 39 ), whereas childhood height and BMI were inversely related( Reference Morris, Jones and Schoemaker 40 ).
Some limitations are also worth noting. Although biomarkers are objectively measured, they are subject to measurement error from several sources. This measurement error, however, is likely random in nature and unrelated to the outcome of interest. Some biomarkers measured in plasma or serum may not be well time-integrated and thus may reflect short- rather than long-term intake. We only quantified these biomarkers at baseline and needed to assume that they represented habitual intake. Lack of follow-up exposure measurements prevented us from examining potential thresholds for the triggering of menarche. Plasma ferritin is an acute phase reactant; although adjusting the multivariable model for CRP or excluding girls with high CRP (an independent inflammatory marker) did not change the estimates of association, some remaining extraneous variation due to subclinical inflammation cannot be discarded. As an acute phase reactant, ferritin concentrations could represent inflammation from different underlying conditions including stress; and chronic stress has been related to later menarche in this population( Reference Villamor, Chavarro and Caro 41 ). It is uncertain whether girls with higher ferritin concentrations were experiencing increased levels of stress. It is not possible to rule out confounding by unmeasured nutrients that may be related to the micronutrients we assessed. For example, Hb could reflect better nutritional status overall and larger body size. Although in this population BMI was unrelated to Hb at baseline( Reference Arsenault, Mora-Plazas and Forero 35 ) and adjustment for BMI did not change the association of Hb with age at menarche, residual confounding by overall nutritional status could be a non-causal explanation of this finding. Measurement error in potential confounders like maternal age at menarche could affect adjusted estimates in an unpredictable direction. Generalisability of the results is limited because Hb and ferritin concentrations were generally high in this group of girls, possibly owing to living at high altitude and being exposed to Fe supplementation programs at school and Fe fortification of wheat flour, which was mandated for the country in 1996. Erythrocyte folate concentrations were also high as the wheat flour fortification mandate includes folate as well. Decreased variability in this biomarker due to homogeneously high levels in the population could have masked associations with age at menarche. Concentrations of Zn, vitamin B12 and vitamin A were not particularly high; thus, lack of variability is an unlikely reason to explain the null associations observed with these nutrients.
In sum, Hb concentrations in middle childhood are inversely related to age at menarche whereas plasma ferritin, a proxy for Fe stores, is positively associated with this outcome. Future studies are warranted to confirm whether these associations exist in populations with different distributions of these biomarkers.
Acknowledgements
The study was supported by the Asistencia Sanitaria Interprovincial S.A. (ASISA) Research Fund at the University of Michigan. The funding source had no role in the design, analysis or writing of this article.
E. V. and M. M.-P. designed the research. C. M., M. M.-P. and H. O. conducted the research. E. V. performed the statistical analyses, wrote the paper and had primary responsibility for the final content. All authors have read and approved the final version of the manuscript.
The authors declare that there are no conflicts of interest.
Supplementary material
For supplementary material/s referred to in this article, please visit https://doi.org/10.1017/S0007114517003130


