

Chronic non-transmissible diseases have evolved to become the first cause of morbidity and mortality during the last two decades in Mexico( Reference Frenk, Bobadilla and Sepúlveda 1 ). Type 2 diabetes( Reference Barquera, Tovar-Guzman and Campos-Nonato 2 ), CHD and stroke( Reference Velazquez-Monroy, Barinagarrementería-Aldatz and Rubio-Guerra 3 ) are the most frequent causes of death in adults. The epidemiology of these diseases and dyslipidaemias have been extensively documented( 4 – Reference Olaiz, Rivera and Shamah 6 ).
Alterations of some cardiovascular risk (CVR) indicators and signs of atherosclerosis can be identified from early life. In the Bogalusa cohort, 50 % of the children aged 2–15 years showed fatty strips in their coronary arteries and 8 % presented with fibromatous plaques( Reference Berenson, Srinivasan and Bao 7 ). Studies in American( Reference Freedman 8 , Reference de Ferranti, Gauvreau and Ludwig 9 ), Spanish( Reference Plaza Perez 10 ), Chilean( Reference Corvalán, Uauy and Kain 11 ) and Mexican( Reference Villalpando, Carrión and Barquera 12 ) children aged between 10 and 19 years have reported a noticeable prevalence of abnormal concentrations of LDL-cholesterol, TAG, HDL-cholesterol and high blood pressure( Reference Berenson, Srinivasan and Bao 7 ).
Longitudinal studies have demonstrated that both arterial wall lesions and dyslipidaemias found in infancy may persist throughout adulthood( Reference Webber, Srinivasan and Wattigney 13 – Reference Lauer, Lee and Clarke 15 ). In another study, plasma LDL-cholesterol levels predicted carotid intima-media thickness during adulthood( Reference Li, Chen and Srinivasan 16 ).
Studies in children routinely eating low-saturated fat diets have shown that these children had lower concentrations of total cholesterol (TC) and TAG as well as lower blood pressure than their counterparts, whose diets consisted of a higher content of saturated fats( Reference Niinikoski, Lagström and Jokinen 17 , Reference Niinikoski, Jula and Viikari 18 ). Total fat intake from the typical Mexican diet is below the recommendations of the WHO (25 %). Mean intake of saturated fat of school-age children exceeds by 1 percentage point 10 % of energy intake which is the recommended intake of the WHO( Reference Ramirez, Villalpando and Moreno 19 ).
A recent study reported that whole cows’ milk is the second most important source of total fat and the first source of saturated fat in the diet of Mexican school-age children( Reference Ramirez, Villalpando and Moreno 19 ).
As part of a national strategy to curb the increasing rates of obesity and CVD, the Mexican Ministry of Health convened an expert panel to produce public recommendations for consumption of healthy beverages. This panel recommended substituting whole milk with partially defatted milk (1·6 % fat) for the population >2 years of age( Reference Rivera, Muñoz-Hernández and Rosas-Peralta 20 ) in accordance with WHO recommendations for a healthy diet( 21 ).
The purpose of this clinical trial was to assess the impact of substituting the intake of whole cows’ milk with either partially defatted or defatted milk on the serum concentrations of TAG, TC, HDL-cholesterol, apoA1, apoB and Lp(a) in a sample of children aged between 6 and 16 years. The expected results may provide information with the aim of preventing CVD from early life.
Methods
Participants included in the study were healthy boys and girls according to parental declaration. Children were aged between 6 and 16 years and were students from thirteen boarding schools in the state of Hidalgo located in the central Mexican plateau. During the school term, children live in boarding schools from Monday through Friday and receive three daily meals prepared in the school kitchen, following pre-planned menus that include two glasses a day of whole cows’ milk as part of the usual diet.
Intervention
Boarding schools were selected from fifty-four boarding schools in the district; thirteen were randomly assigned to receive a full supply of either whole cows’ milk (3 % fat), partially defatted cows’ milk (2·0 % fat) or defatted cows’ milk (0·5 % fat) to be consumed by all the children eating at school during a 4-month period. Randomisation was carried out using a list of computer-generated random numbers. Whole and partially defatted milk powders were packed in foil sachets, indistinguishable from each other, except for a coloured band in one of the corners. Defatted milk was in liquid form and packed in tetrabrick containers. Milk was prepared at the school kitchen; 240 g of whole and partially defatted milk were rehydrated with purified water in separate opaque plastic jars.
Defatted milk came in ready-to-consume packed liquid form and was transferred to similar plastic jars before serving. Despite the differences in milk fat content, all the milk samples were fortified with the same micronutrient pre-mix (Table 1). Treatment was started simultaneously at baseline. Field workers and school personnel were blinded to the objectives of the study. A general idea of the relationship between milk consumption and health was provided. The investigators were blinded to treatment until the randomisation code was broken.
Composition of 400 ml of defatted, partially defatted and whole, reconstituted or fluid, milk
RE, retinol equivalents.
Children received 400 ml daily of the assigned milk (200 ml at breakfast and 200 ml at dinner). A survey carried out in the boarding schools before the intervention found that the habitual daily intake of milk varied from 300 to 500 ml. Milk for the study was produced by Liconsa S.A. de C.V. (Querétaro, Mexico), a federal agency responsible for the social milk-distribution programme.
System of indigenous boarding schools
Boarding schools are public institutions administered by an agency of the Mexican federal government. Schools are clustered in zones with a high density of the indigenous population within the country. Children admitted to boarding schools live in surrounding communities and receive boarding and three meals a day during school days to foster school attendance.
Variables measured
Socio-demographic information was collected using a previously validated questionnaire. Individual milk intake was measured on a daily basis, weighing the glass before and after consumption. The weight difference was considered as the intake.
At baseline and at 4 months, anthropometric variables (body weight, height and waist circumference) were measured and venous blood samples were analysed using standard techniques by trained personnel( Reference Lohman, Roche and Martorell 22 ). Blood samples were collected after a 12-h fast. Serum was separated immediately by centrifugation at 2500 g and stored in cryovials in liquid N2 until being transported to a central laboratory. TC was determined using an enzymatic hydrolysis and oxidation method. TAG concentration was measured after lipase hydrolysis in an automatic analyser with a tungsten lamp (Prestige 24i; Tokyo Boeki Medical System Ltd). Inter-assay CV was 3·04 % for TC and 5·7 % for TAG. HDL-cholesterol was measured by a direct enzymatic colorimetric assay after eliminating chylomicrons from the sample. Inter-assay CV was 5·02 %.
Concentrations of VLDL-cholesterol and LDL-cholesterol were calculated using the Friedewald equation( Reference Roberts 23 ):
 $${\rm VLDL}={\rm TAG}/{\rm 5};\,{\rm LDL}={\rm TC}{\minus}(({\rm TAG}/{\rm 5}){\plus}{\rm HDL}).$$
Validity of these calculations is restricted to persons with serum TAG concentrations between 0·4 and 8·0 mmol/l( Reference Demacker and Hijmans 24 ). Serum concentrations of apoA1, total apoB and Lp(a) were measured with an immunoturbidimetric assay from Beckman Coulter using commercial kits. To assure the precision and exactitude of the determinations, we used National Institute of Standards and Technology reference materials 909b and 1951b. In our laboratory, the concentration of TC measured was 4·33±0·07 mmol/l (reference 4·29 mmol/l), of HDL-cholesterol 1·64±0·08 mmol/l (reference 1·56 mmol/l) and of TAG 1·06±0·02 mmol/l (reference 1·07 mmol/l).
Dietary information
A selected group of 130 subjects (ten from each of the thirteen boarding schools) were interviewed on two separate occasions (2 and 3 months after baseline) to collect dietary information for the entire day using the weighted-test method, resulting in a total of 241 valid measurements. Subjects allowed interviewers to weigh their plates before and after eating. The difference was considered as the amount eaten. Daily menus were collected from the chief cook, and the composition of the recipes was calculated using the food composition tables collected by the Instituto Nacional de Salud Pública (INSP)( Reference Rodríguez-Ramirez, Mundo-Rosas and Jimenez-Aguilar 25 ). The amounts consumed by the subjects were related with the plate composition. Energy and macronutrient content were calculated. The amount of dietary energy and macronutrient content were divided by kilograms of body weight and were reported.
Measurements of macronutrients and energy composition of milk
Lipid concentration was measured gravimetrically after chloroform–methanol extraction by a modification of the Folch method( Reference Jensen, Bitman and Wood 26 ). Protein content of milk was measured by the micro-Kjeldahl method (Kjeltec Autoanalyzer 1030; Tecator Co.). Lactose was estimated by measuring glucose concentrations after lactose hydrolysis with β-galactosidase( Reference Trinder 27 ), and energy was measured in a bomb calorimeter (Parr Instrument). For micronutrient concentrations, we relied on the reports of the manufacturer, with their most recent report shown in Table 1.
Sample size calculations
Sample size was calculated to detect differences between means of 0·44 sd in TC with α 0·05 and power of 0·8. The sample size resulted in 146 children per treatment group; 10 % was included to compensate for losses to follow-up for a total of 480 children.
Statistical analysis
Outcome variables were statistically described as arithmetic mean values with their standard deviations. To test for possible baseline imbalances between treatment groups, a set of ordinary least squares (linear) regression models were fitted to the data with robust standard errors, taking into account clustering of observations at the school level. To estimate treatment effects, a set of multi-level linear regression models with random intercept was fitted to the data (mixed-effects models). These models take into account the nested structure of the data, from clustering of children within schools and from the repeated measures due to the longitudinal design( Reference Searle, Casella and McCulloch 28 ). The effect was assessed using a difference in differences approach( Reference Lance, Guilkey and Hattori 29 ), which consists of including time-by-treatment interaction terms in the model. Interaction coefficients represent the treatment effect adjusting for pre-existing baseline differences that may have remained after randomisation. Dependent variables were the concentrations of TAG, TC, LDL-cholesterol, HDL-cholesterol, VLDL-cholesterol, apoA1, total apoB and Lp(a) lipoproteins, TC:HDL-cholesterol and total apoB:apoA1 ratios. Due to their right-skewed distribution, dependent variables were logarithmically transformed for inclusion in the model to provide a better fit. Using this approach, the antilog of the β coefficients represents the effect of the intervention expressed as the ratio of the biomarker concentrations between treatment groups. In all models, the reference category of the reported effect estimates was the whole milk group. In addition, a second set of multi-level models with untransformed dependent variables were also fitted for ease of interpretation, where the effect estimates were expressed in terms of the difference in concentrations between treatment groups. Covariates included in all the models were age, sex and baseline values of BMI as well as all lipid variables other than the dependent variable of that particular model.
Dietary analysis
An additional analysis of dietary data was performed
Individuals with energy intake <30 % of their estimated energy requirements for weight, height, sex and age( 30 ), as well as values >p95×1·5 of the energy intake distribution of the sample, were excluded from the analysis (19/260 measurements). The association between the change in serum lipid concentrations (final–baseline) and intake of energy, carbohydrates, lipids and proteins for each treatment group was assessed by multiple linear regression models, with the change in serum lipid concentration as the dependent variable. All models were adjusted by baseline values of age, sex and BMI, using Huber–White robust standard errors, considering clustering of children within schools( Reference Froot 31 , Reference Rogers 32 ). Statistical significance was set at P<0·05. Statistical analyses were performed using the computational software STATA v. 12.0 (Stata Statistical Software).
Ethical issues
This study was conducted according to the guidelines laid down in the Declaration of Helsinki, and all procedures involving human subjects/patients were approved by the Research, Ethics and Biosecurity Committees of the INSP, Cuernavaca, Mexico.
Consent of parents or legal guardians and assent of the participants were obtained after a careful explanation of the objectives, procedures and risks of the project by signing informed consent or assent letters. Moreover, authorisations were obtained from school authorities and from their regional supervisors.
Results
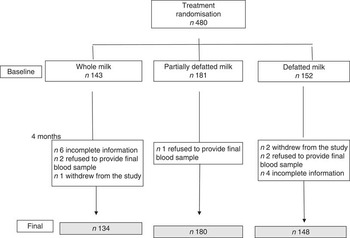
After randomisation, we gathered a total sample of 480 children. A total of 2·9 % (fourteen subjects) were lost to follow-up according to the causes described in the consortium in Fig. 1. After excluding those subjects, the final analysis sample included the whole milk group (n 134), partially defatted milk group (n 180) and defatted milk group (n 148).
Consort of cases.
Some characteristics of the sample are shown in Table 2. No differences were found in baseline values for mean age, weight, waist circumference, TC, TAG, VLDL-cholesterol, LDL-cholesterol, HDL-cholesterol, lipoproteins apoA and total apoB among the treatment groups with the exception of height. Children from the whole milk group were significantly taller than those from the partially defatted milk group (6 cm, P=0·05). Lp(a) concentrations were significantly lower in the whole milk group than in the defatted (P=0·005) milk group. The comparability of most baseline variables among treatment groups is indicative of a successful randomisation.
Clinical characteristics and baseline and final concentrations of serum lipids in children living in boarding schools and consuming whole, partially defatted and defatted cows’ milk for 4 months*(Mean values and standard deviations)

WC, waist circumference; TC, total cholesterol.* P values represent differences between whole milk and partially defatted milk or defatted milk group within the same time of intervention using a multi-level linear regression model adjusted for clustering of children at schools.
In a series of multi-level linear regression models using the difference in differences approach, the estimated effect of treatment compared with the whole milk group was a reduction for TC, LDL-cholesterol, HDL-cholesterol and total apoB of –0·43 mmol/l (9 %), –0·28 mmol/l (12 %), –0·16 mmol/l (9 %) and –0·05 g/l (7 %), respectively (all P<0·001), in defatted milk consumers. In the group that consumed partially defatted milk compared with the group that consumed whole milk, a significant decrease was noted in LDL-cholesterol (–0·12 mmol/l, P=0·01), apoA (–0·05 g/l, P=0·01) and total apoB (–0·05 g/l, P=0·001) (Table 3).
Multi-level regression models using the difference in differences approach models were constructed having alternately as dependent variables the final–baseline differences of biomarkers in children consuming whole, partially defatted and defatted cows’ milk*(Coefficients with their standard errors, n 241)

TC, total cholesterol.
* An interaction term treatment×difference in concentrations is presented. Whole milk is the reference group for all the comparisons.
The ratio of total apoB:apoA reduced significantly compared with whole milk in the defatted milk group (–0·05 g/l, P<0·001) but not in the partially defatted milk group (–0·02 g/l, P=0·1). TC:HDL-cholesterol ratio was not significantly different between the groups.
Dietary information
A final sample of 241 subjects was registered. Total daily intake of carbohydrates (g/kg) was negatively associated with serum final–baseline differences of TC (P=0·01) and positively associated with final–baseline differences of total apoB (P=0·01). Daily lipid intake (g/kg) was positively associated with final–baseline differences of TC (P=0·01) and negatively associated with Lp(a) (P=0·04), apoA (P=0·01) in partially defatted v. whole milk differences (P=0·01). Daily protein intake (g/kg) was positively associated with apoA (P=0·01) and partially defatted milk v. whole milk differences (P=0·01) and negatively associated with total apoB final–baseline differences (P=0·01). Comparing the difference in differences of the intake of energy, carbohydrates, lipid and protein between the whole milk group and partially defatted and defatted milk groups were not significant (Table 4). In addition, groups consuming partially defatted and defatted milk progressively increased the amount of tortillas (lime-treated whole cornmeal pancakes) eaten from a baseline of 175(SD 25) g/kg per d to 220(SD 35) g/d in the partially defatted milk group and to 275 (SD 48) g/d in the defatted milk group.
Multi-level linear regression models between dietary test-weighing intakes of energy (kcal/kg per d) and macronutrients (g/kg per d) associated with final–baseline basal differences in serum lipids in 241 children consuming whole, partially defatted and defatted milk living in thirteen Mexican boarding schoolsFootnote *(Coefficients with their standard errors)
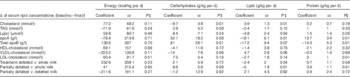
* From dietary test-weighing obtained during the intervention in 241 children.
† Multi-level linear regression models adjusted by sex, age and BMI and clustering of children in schools.
‡ P values<0.05 indicate an association between the change in serum lipids (baseline–final) and the intake of energy, carbohydrates, lipids or protein.
Discussion
We present evidence that substituting the intake of whole milk with defatted milk for 4 months decreased serum concentrations of TC, HDL-cholesterol, LDL-cholesterol and total apoB compared with the group consuming whole milk. In addition, for consumers of partially defatted milk, there was a reduction in the concentrations of apoA and total apoB compared with the group consuming whole milk.
Decrease of serum TC and LDL-cholesterol in consumers of defatted milk may be a response to reducing the intake of milk fat theoretically from 12·3 g/d (the amount of fat contained in 400 ml of whole milk) to 1·8 g/d from defatted milk (difference between whole v. defatted milk 10·4 g/d). Despite the lack of significance between the intake of carbohydrates and lipids in defatted and partially defatted milk, there should be compensation with carbohydrates according to our observation of the higher intake of tortillas in both the defatted and partially defatted milk groups. In our study, we observed lower serum concentrations of TC with the highest intake of carbohydrates. Substitution of fat by carbohydrates reduces LDL-cholesterol concentration according to the equation proposed by Mensink & Katan( Reference Mensink and Katan 33 ):
 $$\Delta {\rm LDL {\hbox -} {\hyphen}cholesterol}\,{\rm (mmol}/{\rm l)}=0\! \cdot \!0{\rm 33}{\times}({\rm CHO}\to{\rm SFA})-0\! \cdot \!00{\rm 6}\,{\rm (CHO}\to{\rm mono)}-0\! \cdot\! 0{\rm 14}{\times}({\rm CHO}\to{\rm poly}).$$
In two longitudinal studies, providing children with a low-fat, low SFA and low-cholesterol diet resulted in lower serum concentrations of TC, LDL-cholesterol and HDL-cholesterol with no effects on TAG( Reference Niinikoski, Lagström and Jokinen 17 , Reference Obarzanek, Kimm and Barton 34 ). In a meta-analysis of sixty trials examining the effect of different dietary compositions, when substituting SFA in the diet with carbohydrates, the TC:HDL-cholesterol ratio did not change( Reference Mensink, Zock and Kester 35 ). On the contrary, studies increasing the intake of SFA resulted in increments in LDL-cholesterol and HDL-cholesterol concentrations( Reference Lichtenstein 36 ).
In this study, the theoretical reduction of fat intake from milk was 10·4 g/d or 395.3 kJ (94·5 kcal/d) (whole v. defatted milk), which is 4·7 % of the energy intake of 8368 kJ (2000 kcal/d) used as a reference for adults according to the WHO, allowing for the intake of other macronutrients such as carbohydrates, protein or other fats( Reference Lee, Gerrior and Smith 37 , Reference Appel, Sacks and Carey 38 ). An increase in the intake of complex carbohydrates represented by tortillas was noted. Final increments were 100 g/d in the defatted milk group (P=0·01) and 45 g/d in the partially defatted milk group (P=0·05). This large increment could result in the lowering of TC, LDL-cholesterol, HDL-cholesterol and total apoB in the defatted milk group, considering that this was a complex carbohydrate with a low glycaemic index and was associated with a high content of 1·2 g fibre/100 g of dry tortillas( Reference Hernandez, Souza and Villalpando 39 ). Nevertheless, differences in fat and carbohydrate intake were not significant among treatment groups in this study. This is not unusual considering the variability among 2-d surveys, thirteen schools and 241 subjects. Substitution of carbohydrates for fat has been reported to have several implications. In experimental studies, some types of lipids such as SFA used to substitute carbohydrate intake had no effect on TC:HDL-cholesterol, but there were increments in LDL-cholesterol and in HDL-cholesterol( Reference Micha and Mozaffarian 40 ). A series of randomised clinical trials have established clear multiple effects of SFA reduction on circulating lipids and lipoproteins, depending upon which nutrient is utilised for the substitution( Reference Mensink and Katan 33 , Reference Chong, Fielding and Frayn 41 ). In some cases, use of PUFA or MUFA results in reductions in TAG and LDL and elevation of HDL-cholesterol. Although replacement of SFA with carbohydrates appears to provide no overall CVD benefit, indirect lines of evidence suggest that effects could vary depending on overall carbohydrate quality( Reference Livesey, Taylor and Hulshof 42 ). For example, replacing SFA with less processed, higher fibre, lower glycaemic index carbohydrates could provide benefit, whereas replacing SFA with more processed, lower fibre, higher glycaemic index carbohydrates may have no effects or even may be harmful( Reference Livesey, Taylor and Hulshof 42 , Reference Siri Tarino, Sun and Hue 43 ). Many of the latter studies were controlled experiments replacing different nutrients from a high-carbohydrate, low-fat diet. In our study, the reduction of milk fat occurred in a population with a usual low-fat diet and an intervention with different amounts of lipids for 4 months possibly made the difference in the serum lipid response reported here.
Concentrations of total apoB and apoA lipoproteins are relevant for atherogenesis. As one molecule of apoB-48 is carried on intestinally derived particles (e.g. chylomicrons) and one molecule of apoB-100 is carried on liver-derived lipoproteins (e.g. LDL), total apoB represents the sum of all lipogenic particles( Reference Olofsson, Wiklund and Boren 44 ). On the contrary, apoA forms part of HDL-cholesterol and activates the reverse transport of cholesterol from peripheral tissues to the liver( Reference Steinberg, Parthasarathy and Carew 45 ). Concentrations of total apoB and total apoB:apoA ratio are considered as indicators of CVR, especially early in life( Reference Srinivasan and Berenson 46 , Reference Van der Steeg, Boekhold and Stein 47 ). Concentrations of total apoB in both partially defatted and defatted milk was most probably reduced by changes in milk fat intake. Total apoB:apoA ratio is considered as a good predictor of cardiovascular events, although in children we are far from using it in such a capacity. In this study, an improvement in the balance between atherogenic and anti-atherogenic lipoproteins is shown, and most probably it is related with the reduction in milk fat intake.
A particular strength of this study is its clinical trial design. Although fat-soluble vitamins are reduced by defatting milk, this was not the case in this study where the three types of milk were fortified with the same pre-mixed formula as shown in Table 1. Some limitations of this study are that milk intake was not recorded during weekends, but we have no reason to assume that the quantity of milk provided at home was different among treatment groups.
In summary, we present the results of a clinical trial in which reduction in intake of milk fat lipids resulted in a reduction of TC, HDL-cholesterol, LDL-cholesterol and total apoB lipoprotein concentrations in serum in the defatted milk group. Defatted milk intake reduced some serum indicators of CVR.
Acknowledgements
The authors thank Ms Carolina Hernandez for her secretarial assistance.
Liconsa S.A. de C.V. provided the three types of milk used in this study and provided non-conditional economic support. Liconsa S.A. de C.V. had no role in the design, analysis or writing of this article.
S. V. and T. S. designed the overall project and participated in interpreting and writing the manuscript; Y. L. Z. and V. M. conducted field work and participated in writing the manuscript. A. C. and H. L. F. performed the statistical analysis and participated in the writing of the manuscript.
The participant researchers of this study declare having no personal or financial interests that could impact the results of the study.


