


Non-technical Summary
The Peruvian coast is well known for its diverse and well-preserved vertebrate fossils. This remarkable record has allowed scientists to piece together the evolutionary history of the region’s marine ecosystems. In contrast, the invertebrate fauna—though abundant and equally well-preserved—has received far less attention, leaving gaps in our understanding of past coastal-marine environments.
In this study, we explored how molluscan communities along the central Peruvian coast have changed over the past 10 million years. We found a major faunal shift between 6 and 4 million years ago, leading to the emergence of a diverse assemblage that closely resembles the molluscan fauna seen today. Clams (bivalves) showed an increase in diversity, driven by the appearance of several taxa. Meanwhile, marine snails (gastropods) underwent a gradual transition, mainly due to the loss of older taxa.
When looking into the ecological traits of these mollusks, we found no single pattern of change over time. This suggests that the gain and loss of mollusks was part of a broader reorganization of ecological strategies. The shift was likely driven by the rise of the Andes, changes in the coastline—such as the loss of semi-embayments and shallow-water habitats—and rising sea level. Our findings contribute to our understanding of how coastal-marine ecosystems evolved in relation to the development of the modern Humboldt Current System.
Introduction
The Humboldt Current System (HCS), one of the major Eastern Boundary Upwelling Systems, bathes the coasts of Peru and Chile between 3.5°S and 55°S (Thiel et al. Reference Thiel, Macaya, Acuna, Arntz, Bastias, Brokordt and Camus2007; Miloslavich et al. Reference Miloslavich, Klein, Díaz, Hernández, Bigatti, Campos and Artigas2011) with surface waters that are relatively cool for a tropical to subtropical region. Renowned for its exceptionally productive fisheries (accounting for 15% of global fish captures; Chavez et al. Reference Chavez, Bertrand, Guevara-Carrasco, Soler and Csirke2008), the year-round coastal productivity of the HCS supports diverse invertebrate communities with large population sizes. Mollusk species in the HCS, well-adapted to these cold productive waters, play a crucial role in sustaining coastal ecosystems (Thiel et al. Reference Thiel, Macaya, Acuna, Arntz, Bastias, Brokordt and Camus2007), where they act as a primary food source to secondary consumers, including vertebrates (e.g., fish, seabirds) and other invertebrates (e.g., mollusks, crustaceans).
The HCS ecosystem is shaped by several abiotic factors operating at various spatial and temporal scales (Thiel et al. Reference Thiel, Macaya, Acuna, Arntz, Bastias, Brokordt and Camus2007; Ibañez-Erquiaga et al. Reference Ibañez-Erquiaga, Pacheco, Rivadeneira and Tejada2018; Valqui et al. Reference Valqui, Ibañez-Erquiaga, Pacheco, Wilbur, Ochoa, Cardich and Pérez-Huaranga2021), including the strength of upwelling-favorable winds, meridional and offshore temperature gradients, an intense and shallow Oxygen Minimum Zone (OMZ), and high nutrient availability (Thiel et al. Reference Thiel, Macaya, Acuna, Arntz, Bastias, Brokordt and Camus2007; Montecino and Lange Reference Montecino and Lange2009). On interannual timescales, primary productivity, and thus the ecosystem’s productivity and fish loadings, are strongly affected by sea-surface temperature (SST) anomalies and anoxic events linked to El Niño Southern Oscillation (ENSO)–driven climatic variability (Swartzman et al. Reference Swartzman, Bertrand, Gutiérrez, Bertrand and Vasquez2008).
Considering that modern atmospheric pCO2 has reached late Miocene levels (i.e., 400 ppm; Steinthorsdottir et al. Reference Steinthorsdottir, Coxall, de Boer, Huber, Barbolini, Bradshaw and Burls2021) and climate models predict El Niño–like warm conditions in the future HCS (Cai et al. Reference Cai, Santoso, Collins, Dewitte, Karamperidou, Kug and Lengaigne2021) alongside zonal and meridional SST gradients comparable to those of the late Miocene–early Pliocene (Wara et al. Reference Wara, Ravelo and Delaney2005; Fedorov et al. Reference Fedorov, Burls, Lawrence and Peterson2015), it is necessary to adopt a long-term perspective on the history of HCS biodiversity to assess the ecosystem’s sensitivity and potential response to stationary greenhouse climates. The East Pisco Basin (EPB) on the Peruvian continental margin has long been identified as an exceptional source of diverse and well-preserved vertebrate fossils from the Cenozoic, giving insights into the evolution of coastal-marine vertebrate fauna in response to oceanographic and geological processes (e.g., Muizon and DeVries Reference Muizon and DeVries1985; Collareta et al. Reference Collareta, Lambert, Marx, Muizon, Varas-Malca, Landini and Bosio2021; Ochoa et al. Reference Ochoa, Salas-Gismondi, DeVries, Baby, Muizon, Altamirano and Barbosa-Espitia2021). Nevertheless, the evolution of invertebrate communities during the development of modern HCS coastal ecosystems, particularly the changes in molluscan diversity and community composition, remains poorly understood.
In the 1800s, pioneering researchers such as Darwin, D’Orbigny, Philippi, and Möricke realized that Chilean sediments from the Miocene and Pliocene were predominantly constituted of extinct molluscan fauna, while Pleistocene sediments consisted primarily of extant mollusks (Möricke Reference Möricke1896). Consequently, they proposed a substantial molluscan turnover at the Plio-Pleistocene transition on the temperate coast of western South America; a hypothesis later revisited by Herm (Reference Herm1969) and DeVries (Reference DeVries2001). Rivadeneira and Marquet (Reference Rivadeneira and Marquet2007) used data from the Chilean fossil record to reveal a selective bivalve extinction in the Plio-Pleistocene, while Rivadeneira and Nielsen (Reference Rivadeneira and Nielsen2017) recognized a significant and selective turnover of benthic gastropod species. Nonetheless, within the northern HCS, there is no information on the long-term molluscan assemblage evolution and diversification rates, aside from specific taxonomic research (e.g., DeVries Reference DeVries2005, Reference DeVries2008; see full list in Supplementary Table 1) and a recent assessment of the evolution of marine ecological guilds (Vermeij et al. Reference Vermeij, DeVries, Griffin, Nielsen, Ochoa, Rivadeneira, Salas‐Gismondi and Valdovinos2024). The profound environmental changes in both coastal morphology and oceanographic conditions associated with the long-term development of the modern HCS would be expected to drive selective faunal changes. For instance, the onset of upwelling-induced high productivity and the development of an intense and shallow OMZ might favor deposit-feeding taxa over suspension-feeding taxa, which can be sensitive to anoxia or high turbidity (Rhoads and Young Reference Rhoads and Young1970; Levin and Gage Reference Levin and Gage1998; Levin Reference Levin, Gibson and Atkinson2003; Montecino and Lange Reference Montecino and Lange2009). The tectonic-driven expansion of high-energy, open-coast sandy beaches that characterizes the modern Peruvian Coastline might have favored actively mobile, burrowing fauna over sedentary or epifaunal taxa adapted to lower-energy conditions (McLachlan Reference McLachlan, McLachlan and Erasmus1983; Defeo and McLachlan Reference Defeo and McLachlan2005, Reference Defeo and McLachlan2013). However, whether such ecological shifts implied a faunal turnover in the northern HCS remains to be quantitively assessed.
In this study, we analyze the changes in composition, diversity, and turnover rates of bivalves and gastropods of the EPB during the last 10 Myr to define long-term evolutionary patterns of the molluscan communities in the central-southern Peruvian coast. Our goal is to quantitatively assess the long-standing hypothesis of a Plio-Pleistocene molluscan turnover in western South America (Herm Reference Herm1969; DeVries Reference DeVries2001; Rivadeneira and Marquet Reference Rivadeneira and Marquet2007; Rivadeneira and Nielsen Reference Rivadeneira and Nielsen2017), and to evaluate possible relationships between molluscan faunal changes and the establishment of modern coastal ecosystems, including shifts in geological and oceanographic conditions. These analyses will contribute to an understanding of the historical path of the HCS toward modern-day biodiversity.
Geological Setting
The EPB extends from the Cañete area (13°S) to the Huacllaco area (16°S; Rivera Reference Rivera1957; Couch and Whitsett Reference Couch, Whitsett, Kulm, Dymond, Dasch, Hussong and Roderick1981; Thornburg and Kulm Reference Thornburg, Kulm, Kulm, Dymond, Dasch, Hussong and Roderick1981; DeVries Reference DeVries2020; Fig. 1). The EPB is characterized by extensive Cenozoic shallow-marine sedimentary sequences, rich in fossils, including well-preserved vertebrates and mollusks (e.g., Caldas Reference Caldas1978; Dunbar et al. Reference Dunbar, Marty and Baker1990; León et al. Reference León, Rosell, Aleman, Torres and De la Cruz2008; Di Celma et al. Reference Di Celma, Malinverno, Gariboldi, Gioncada, Rustichelli, Pierantoni, Landini, Bosio, Tinelli and Bianucci2016). In the Sacaco area (15.2–16°S), the Neogene and Quaternary marine sediments have been categorized into three distinct units based on their lithology and accompanying fauna (DeVries Reference DeVries2020; Ochoa et al. Reference Ochoa, DeVries, Quispe, Barbosa-Espitia, Salas-Gismondi, Foster and Gonzales2022): the Mio-Pliocene Pisco Formation, the Plio-Pleistocene Caracoles Formation, and the middle Pleistocene Pongo Formation. These formations and crystalline basement rock are unconformably overlapped by numerous late Pleistocene marine terraces, among which are the Totoral Tablazo (+150–200 m, 15.29°S, 74.45°W; DeVries Reference DeVries2020), the “Terraza de Puente a Carretera San Nicolas” (+30 m, 15.3°S, 75.1°W; Ortlieb et al. Reference Ortlieb, DeVries and Diaz1990), and the “Terraza al Este de Lomas” (+40 m, 15.5°S, 74.8°W; Ortlieb et al. Reference Ortlieb, DeVries and Diaz1990), all of which contain well-preserved malacological fossil remains. The fossil molluscan fauna studied herein has primarily been retrieved from these Miocene, Pliocene, and Quaternary sediments.
Peruvian coastline. Color gradient represents the sea-surface temperature from January 1991–2020, modified from Ishii et al. (Reference Ishii, Shouji, Sugimoto and Matsumoto2005). The frame represents the East Pisco Basin (EPB), and the solid arrows represent the two main currents of the Peruvian coast: Ecuador-Peru Coastal Current (EPCC) and Humboldt Current (HC).

The Pisco Formation, discontinuously extending from Pisco to at least Yauca (13.5–15.6°S; Caldas Reference Caldas1978; Leon et al. Reference León, Rosell, Aleman, Torres and De la Cruz2008), was deposited in coastal to shallow-marine settings, encompassing open and sheltered shorefaces and offshore shelf environments (Dunbar et al. Reference Dunbar, Marty and Baker1990; Di Celma et al. Reference Di Celma, Malinverno, Gariboldi, Gioncada, Rustichelli, Pierantoni, Landini, Bosio, Tinelli and Bianucci2016). In the Sacaco area, the Pisco Formation predominantly consists of late Miocene to early Pliocene–aged massive to laminated siliceous-rich siltstones, sandstones, and diatomites (10–4.5 Ma; Muizon and DeVries Reference Muizon and DeVries1985; Ochoa et al. Reference Ochoa, DeVries, Quispe, Barbosa-Espitia, Salas-Gismondi, Foster and Gonzales2022). This formation is notable for its abundant and well-preserved fossil record, which has undergone extensive study (see Muizon and DeVries Reference Muizon and DeVries1985; Ochoa et al. Reference Ochoa, Salas-Gismondi, DeVries, Baby, Muizon, Altamirano and Barbosa-Espitia2021; Collareta et al. Reference Collareta, Lambert, Marx, Muizon, Varas-Malca, Landini and Bosio2021 and references therein). The molluscan fauna found in the Pisco Formation includes species such as Anadara chilensis, Dosinia ponderosa, Concholepas kieneri, Ficus allemanae, and Incatella cingulatiformis, which are absent in sediments from the youngest units (DeVries Reference DeVries2020).
Sediments of the Caracoles Formation, exclusively outcropping in the Sacaco area, were deposited in shallow-marine settings, likely in a (semi-)restricted environment (DeVries Reference DeVries2020). Accumulation began after a prolonged hiatus from 4.5 to 2.7 Ma, marking the Pisco-Caracoles Unconformity. The age of the uppermost Caracoles sediments remains unknown, but their stratigraphic position indicates deposition ceased before 1.9 Ma (DeVries Reference DeVries2020; Ochoa et al. Reference Ochoa, Salas-Gismondi, DeVries, Baby, Muizon, Altamirano and Barbosa-Espitia2021). Characterized by medium-grained and bioturbated sandstones interbedded with coquina beds, the Caracoles Formation contains mainly molds and disarticulated valves of bivalves, including Mulinia, the mytilid Choromytilus chorus, and venerids such as Pitar, Amiantis, Cyclinella subquadrata, and Eurhomalea fuenzalida. The gastropod fauna, from which the formation derives its name, is diverse and dominated by the crepidulid Crepipatella dilatata, accompanied by Sinum cymba, Felicioliva peruviana, Xanthochorus xuster, Polinices, Nassarius, Cancellaria, and Olivella among others (DeVries Reference DeVries2020).
The Pongo Formation contains sediments accumulated in coastal environments on high-energy sandy beaches (DeVries Reference DeVries2020). Based on recent radiometric ages, deposition lasted from approximately 1.9 Ma to at least 1.4 Ma (Ochoa et al. Reference Ochoa, DeVries, Quispe, Barbosa-Espitia, Salas-Gismondi, Foster and Gonzales2022), which coincides with the biozonation proposed by DeVries (Reference DeVries2020) based on molluscan fauna. The Pongo Formation presents two distinct lithostratigraphic subunits, Pongo-1 and Pongo-2 (DeVries Reference DeVries2020). The lower subunit, Pongo-1, is identified by its sandy and poorly cemented lithology, along with a molluscan assemblage dominated by the venerid Pitar and several gastropods, including Polinices, Sinum, Stramonita, Xanthochorus, Nassarius, Mitrella, Cancellaria, and the specimens morphologically transitional between Chorus grandis and the extant Chorus giganteus (DeVries Reference DeVries2020). The upper subunit, Pongo-2, consists of unconsolidated or cemented coarse-grained sand with cobble beds and biogenic debris. Molluscan fauna within this subunit primarily includes the pectinid Argopecten purpuratus, C. chorus, Chama, Leukoma taka, and a high diversity of gastropods, such as C. dilatata, Crucibulum lignarium, Polinices uber, and muricids like Acanthina unicornis, Concholepas concholepas, Thaisella chocolata, and Xanthochorus (DeVries Reference DeVries2020).
The Huacllaco sediments, found along the 1S Panamerican Highway (15.88°S), consist mainly of bioclastic sandstone, cobble, and coquina beds, which are interpreted to have formed in high-energy environments, probably on rocky intertidal beaches. The Huacllaco sequence has been divided in five sedimentary subunits based on lithological features and molluscan fauna (DeVries Reference DeVries2020). Subunits I, II, and lower III are younger than the uppermost Pisco sediments (Mio-Pliocene) and are correlative with late Pliocene levels from the Chilean Mejillones area dated with strontium chemostratigraphy (87Sr/86Sr) as 3.4 Ma (see DeVries Reference DeVries2020). The uppermost sediments of subunit III are correlative with the late Pliocene Caracoles Formation, which has a maximum depositional age of 2.7 Ma (Ochoa et al. Reference Ochoa, DeVries, Quispe, Barbosa-Espitia, Salas-Gismondi, Foster and Gonzales2022). Subunits IV and V lack direct chronostratigraphic control, but their stratigraphic position suggests a latest Pliocene–early Pleistocene age. Accordingly, the age of the Huacllaco sediments spans from the late Pliocene to the early Pleistocene (ca. 3.4–1.4 Ma). Mollusk fossils in Huacllaco are exceptionally well-preserved and include C. chorus, Chlamys, Mulinia, Mesodesma, and gastropods such as C. grandis, Fissurella, Nacella, Chlorostoma, Prisogaster, Acanthina, Concholepas, and Xanthochorus, among others (DeVries Reference DeVries2020).
Finally, several late Pleistocene marine terraces exist along the EPB and correspond to the youngest marine units. These units, including the Totoral Tablazo (DeVries Reference DeVries2020), the “Terraza de Puente a Carretera San Nicolas” (+30 m; Ortlieb et al. Reference Ortlieb, DeVries and Diaz1990), the “Terraza al Este de Lomas” (+40 m; Ortlieb et al. Reference Ortlieb, DeVries and Diaz1990), and the terraces at Cerro El Huevo (+40 to +330 m; Broggi Reference Broggi1946), preserve abundant extant cool-adapted mollusks of the modern Humboldt Province, such as Ameghinomya antiqua, C. chorus, Eurhomalea lenticularis, Eurhomalea rufa, Perumytilus purpuratus, C. dilatata, and F. peruviana. Shells of extant Quaternary species from the Panamic Province in northern Peru, including Anadara grandis, Chione broggi, and Cerithium stercusmuscarum, are also present within these terraces.
Evolution of Coastal Oceanographic Conditions and Ecosystems since the Late Miocene
The southeast Pacific and the Peruvian Margin have experienced large oceanographic and environmental changes (e.g., Wara et al. Reference Wara, Ravelo and Delaney2005; Herbert et al. Reference Herbert, Lawrence, Tzanova, Peterson, Caballero-Gill and Kelly2016) during the last 10 Myr, after the progressive ocean cooling, the strengthening of latitudinal and meridional thermal gradients, and the Andean uplift. Various fossils from the Pisco Formation reveal the presence of tropical to subtropical taxa within the EPB (Muizon and DeVries Reference Muizon and DeVries1985; Collareta et al. Reference Collareta, Lambert, Marx, Muizon, Varas-Malca, Landini and Bosio2021), including several mollusks (Ficus, Terebra; Muizon and DeVries Reference Muizon and DeVries1985; DeVries Reference DeVries2020), sirenians (Nanosiren; Domning and Aguilera Reference Domning and Aguilera2008), and crocodylians (Sacacosuchus, Piscogavialis; Salas-Gismondi et al. Reference Salas-Gismondi, Ochoa, Jouve, Romero, Cardich, Perez, DeVries, Baby, Urbina and Carré2022; Zamora-Vega et al. Reference Zamora-Vega, Romero, Urbina, Carré, Ochoa and Salas-Gismondi2025). This fauna suggests warmer than present coastal surface waters during the late Miocene (Ochoa et al. Reference Ochoa, Salas-Gismondi, DeVries, Baby, Muizon, Altamirano and Barbosa-Espitia2021). Warm conditions might have been favored locally in the EPB by the remnants of the Coastal Cordillera, which acted as a protective barrier for heterogeneous semi-embayment settings (Marocco and Muizon Reference Marocco and Muizon1988). Those marine environments, however, were continuously connected to the open ocean, as indicated by similar strontium isotope ratios (Ochoa et al. Reference Ochoa, Salas-Gismondi, DeVries, Baby, Muizon, Altamirano and Barbosa-Espitia2021; Gonzales Reference Gonzales2023). Isotope-based coastal temperature reconstructions also indicate warm conditions (Muizon Reference Muizon1981). At a regional scale, offshore alkenone-based SST reconstructions also show temperatures were 3–4°C warmer in the Eastern Pacific cold tongue during the late Miocene (Dekens et al. Reference Dekens, Ravelo and McCarthy2007; Liu et al. Reference Liu, Tian, Liu, Herbert, Fedorov and Lyle2019; Rafter et al. Reference Rafter, Farmer, Martínez-García, Ravelo, Karnauskas, Batista and Bernasconi2025), associated with a reduced zonal SST gradient across the tropical Pacific that is interpreted either as a sign of a “permanent El Niño” climate at that time (Wara et al. Reference Wara, Ravelo and Delaney2005) or as evidence of weaker vertical density gradients (Rafter et al. Reference Rafter, Farmer, Martínez-García, Ravelo, Karnauskas, Batista and Bernasconi2025).
The first steps toward modern oceanographic conditions and ecosystems in the EPB took place during the early Pliocene (Ochoa et al. Reference Ochoa, Salas-Gismondi, DeVries, Baby, Muizon, Altamirano and Barbosa-Espitia2021), likely in response to coastal geomorphological changes related to an Andes uplift pulse (5–4 Ma) and the progressive global cooling of the Plio-Quaternary (5–0 Ma; Fedorov et al. Reference Fedorov, Burls, Lawrence and Peterson2015). The onset of modern Humboldt Current ecosystems, as evidenced in the vertebrate fossil record by the lack of crocodylians and the replacement of seals by close relatives of the extant sea lions, occurred during the late Pliocene (4.5–2.7 Ma; Ochoa et al. Reference Ochoa, Salas-Gismondi, DeVries, Baby, Muizon, Altamirano and Barbosa-Espitia2021), coinciding with the beginning of Northern Hemisphere glaciations (3.0–2.6 Ma), progressive Plio-Pleistocene global cooling, and the onset of the modern ocean–atmosphere circulation in the tropical Pacific (Wara et al. Reference Wara, Ravelo and Delaney2005; Dekens et al. Reference Dekens, Ravelo and McCarthy2007).
The modern oceanographic configuration was established by the late Pliocene, allowing the development of two well-defined marine provinces and ecosystems along the Peruvian coasts (Miloslavich et al. Reference Miloslavich, Klein, Díaz, Hernández, Bigatti, Campos and Artigas2011; Fig. 1). The Panamic Province, situated north of 6°S and referred to as a tropical province, is closely linked to the Ecuador-Peru Coastal Current (EPCC). This current is responsible for transporting comparatively warm, nutrient-poor tropical waters southward to northern Peru (Miloslavich et al. Reference Miloslavich, Klein, Díaz, Hernández, Bigatti, Campos and Artigas2011; Ibañez-Erquiaga et al. Reference Ibañez-Erquiaga, Pacheco, Rivadeneira and Tejada2018). The Humboldt Province, which comprises most of the Peruvian coastline (8–18.3°S) and extending south into Chile to 54°S, is shaped by the HCS. As such, the Humboldt Province is characterized by wind-induced coastal upwelling resulting in lower SSTs and higher primary productivity (Thiel et al. Reference Thiel, Macaya, Acuna, Arntz, Bastias, Brokordt and Camus2007; Montecino and Lange Reference Montecino and Lange2009). Due to the abundance of phytoplankton, decomposing organic matter, and high oxygen demand, the HCS (and thus the Humboldt Province) has a permanent shallow and intense OMZ (Chavez et al. Reference Chavez, Bertrand, Guevara-Carrasco, Soler and Csirke2008; Montecino and Lange Reference Montecino and Lange2009). The Transitional Zone between the Panamic and Humboldt Provinces (6–8°S), located where the EPCC and HCS waters converge, results in a unique climate-sensitive blend of species (Olsson Reference Olsson1961; DeVries Reference DeVries1987; Ibañez-Erquiaga et al. Reference Ibañez-Erquiaga, Pacheco, Rivadeneira and Tejada2018; Valqui et al. Reference Valqui, Ibañez-Erquiaga, Pacheco, Wilbur, Ochoa, Cardich and Pérez-Huaranga2021).
These two provinces, as part of the Southeastern Pacific oceanographic setting, are presently subject to high interannual climate variability due to the ENSO. During canonical or coastal El Niño events, the thermocline deepens, inducing a strong warming of coastal waters, which limits the upwelling of nutrient-rich subsurface waters, reducing primary productivity (Gutiérrez et al. Reference Gutiérrez, Grados, Graco, Vásquez, Velazco, Sánchez and Ayón2014). These events strongly impact community and population dynamics, particularly for species adapted to the cold and productive waters of the HCS (Thiel et al. Reference Thiel, Macaya, Acuna, Arntz, Bastias, Brokordt and Camus2007). ENSO events further allow episodic southward expansions of tropical marine invertebrates, such as mollusks and crustaceans (Paredes et al. Reference Paredes, Cardoso and Tarazona2004; Arntz et al. Reference Arntz, Gallardo, Gutiérrez, Isla, Levin, Mendo, Neira, Rowe, Tarazona and Wolff2006; Valqui et al. Reference Valqui, Ibañez-Erquiaga, Pacheco, Wilbur, Ochoa, Cardich and Pérez-Huaranga2021). The transient southward resettling of tropical benthic species is likely related to the migration of planktonic larvae (Atrina maura, Isorobitella peruviana, Pteria sterna, Cymatium keenae, Hexaplex brassica, Homalocantha multicrispata, etc.) via the Peru–Chile countercurrent (Paredes et al. Reference Paredes, Cardoso and Tarazona2004; Ashton et al. Reference Ashton, Riascos and Pacheco2007).
Material and Methods
Data Source, Compilation, and Curation
We built an occurrence dataset of fossil bivalves and gastropods, dated from 12 to 0 Ma in the EPB (Supplementary Tables 1, 2), compiled from published reports (see Supplementary Table 1), the Paleobiology Database (https://paleobiodb.org), and malacological collections of the Burke Museum’s Invertebrate Paleontology and Micropaleontology collection (UWBM), the Paleontological Research Institution online collection (PRI), and the invertebrate collection of the Natural History Museum of the Universidad Nacional Mayor de San Marcos (MUSM). The chronostratigraphic information and taxonomic ID status of each fossil entry was reviewed and updated (e.g., DeVries Reference DeVries2020; Ochoa et al. Reference Ochoa, Salas-Gismondi, DeVries, Baby, Muizon, Altamirano and Barbosa-Espitia2021, Reference Ochoa, DeVries, Quispe, Barbosa-Espitia, Salas-Gismondi, Foster and Gonzales2022). Supplementary Table 1 presents the list of references from which fossil records were gathered for this study. To account for differences in taxonomic resolution between genera, all analyses were performed at both the genus and species levels. The Ostreidae family was not included in the database due to a lack of taxonomic precision.
Additionally, a dataset of modern molluscan fauna was incorporated to serve as a reference benchmark for the communities inhabiting the Peruvian coast at similar latitudes (13–16°S). The modern dataset was compiled from published literature (e.g., Keen Reference Keen1971; Alamo and Valdivieso Reference Alamo and Valdivieso1997; Ramirez et al. Reference Ramírez, Paredes and Arenas2003; Paredes and Cardoso Reference Paredes and Cardoso2007; Paredes et al. Reference Paredes, Cardoso, Santamaría, Esplana and Llaja2016; Montes Reference Montes2018; Valentich-Scott et al. Reference Valentich-Scott, Coan and Zelaya2020) and records from the Collection of Modern and Fossil Mollusks of the Peruvian Littoral gathered by Luc Ortlieb and housed at the Universidad Peruana Cayetano Heredia (UPCH), following the same criteria as those indicated for the fossil database. The compiled database, which includes fossil and modern mollusks, is available in Supplementary Table 2.
Data Analysis
Time Binning
All fossil records were classified based on their known stratigraphic range. To control edge effects and mitigate the impact of gaps in diversity patterns in the fossil record (which might lead to inaccurate per capita estimates of origination or extinction), we performed a range-through analysis on all species and genus entries of the presence–absence fossil database (Boltovskoy Reference Boltovskoy1988). We thus assumed that genus and species existed throughout the entire period between their first occurrence (FO) and last known occurrence (LO), even if they were not observed between these occurrences. We then systematically classified all occurrences into 12 discrete 1 Myr time bins, spanning 12 to 0 Ma. The 12–11 Ma and 11–10 Ma time bins were included in the analysis to prevent misinterpretations due to the edge effect but were not interpreted. Furthermore, the 1–0 Ma time bin only includes fossil taxa (i.e., genus and species) recovered from the EPB’s fossil record, that is, it does not include the entire spectrum of modern molluscan fauna inhabiting the central Peruvian Margin. This deliberate choice aims to limit the overestimation of accumulated diversity and origination rates due to differences in sampling effort between fossil and extant faunas. In addition, a modern sample was created (0–0 Ma) to compare against the molluscan richness observed in the 1–0 Ma time bin, but it was not used for assessing origination and extinction per capita rates.
Composition of Faunal Assemblages
We aimed to evaluate faunal similarity and dissimilarity across time bins, providing insights into the timing and intensity of faunal turnover within the mollusks of the EPB. Changes in faunal composition at the genus and species levels were assessed using hierarchical cluster analysis, nonmetric multidimensional scaling (NMDS; k = 2, 999 iterations), and permutational multivariate analysis of variance (PERMANOVA; 999 permutations). Presence–absence data were analyzed with the unweighted pair group method with arithmetic mean (UPGMA) and the Jaccard dissimilarity index, which accounts for the proportion of non-shared features (Real and Vargas Reference Real and Vargas1996). The same dissimilarity matrix was subsequently used for PERMANOVA and NMDS analyses. Stress values were evaluated to assess the quality of the ordination (Clarke Reference Clarke1993). In addition, to assess the extent of faunal composition changes, we estimate the proportion of extant genera and species per time bin (i.e., Lyellian percentages; Stanley et al. Reference Stanley, Addicott and Chinzei1980), as well as the proportions of extinct and extirpated (i.e., locally extinct) taxa per time bin. We considered a taxa as extirpated when it disappears from the EPB fossil record but remains in other localities.
An indicator species analysis (ISA) was performed to identify taxa most associated with each molluscan assemblage (Bakker Reference Bakker2008). Presence–absence data were organized using hierarchical clustering results as grouping factors. The analysis was conducted using the point biserial correlation coefficient (“r.g”) as the association function and included 999 permutations to assess statistical significance (p < 0.05).
Diversity and Turnover Rates
We assessed changes in molluscan diversity by estimating mollusk diversification rates at the genus level. Diversity was measured using the incidence-based Chao2 and first-order Jackknife estimators for each assemblage identified through hierarchical clustering (Chao et al. Reference Chao, Chazdon, Colwell and Shen2005; Supplementary Data 1). These methods account for unseen taxa and provide a robust assessment of taxonomic diversity per assemblage (i.e., time-bin cluster). To evaluate differences in estimated richness between assemblages, we performed Mann-Whitney U significance tests. Molluscan turnover was estimated using per capita origination rates (oriPC) and extinction rates (extPC), following the methodology established by Foote (Reference Foote1999).
 $$ oriPC=-\log \left( tOri/\left( tOri+ tThrough\right)\right) $$
 $$ extPC=-\log \left( tExt/\left( tExt+ tThrough\right)\right) $$
tOri represents the number of originating taxa, which includes those with first occurrences in the focal bin and last occurrences after it. tExt is the number of taxa going extinct, referring to taxa with first occurrences before the focal bin and last occurrences in it. tThrough is defined as the number of taxa that have first occurrence before and last occurrence after the focal bin. Taxa that occur within a single time bin (i.e., singletons) were excluded to improve statistical reliability by reducing the influence of random variation in the fossil record and noise in the analyses. These definitions do not distinguish between extinction and extirpation (i.e., local extinction) or origination and migration, so turnover rates must be interpreted appropriately.
Ecological selectivity patterns in origination and extinction events were assessed by categorizing mollusk genera and species according to ecological traits. Bivalves were classified by life habit (infaunal siphonate, infaunal asiphonate, semi-infaunal, epifaunal, nestler, and borer), mobility (actively mobile, immobile, and sedentary), shell fixation (unattached, bysally attached, and cemented), and diet (suspension feeder, deposit feeder, and chemosymbiotic suspension feeder). Gastropods were categorized by life habit (epifaunal and infaunal) and diet (carnivores, grazers, and suspension feeders). The ecological trait categories follow the molluscan life habit databases of Todd (Reference Todd2001). When information was not available, putative diet or habits were inferred from species belonging to the same genus or family, as ecological traits are often phylogenetically conserved (Jablonski Reference Jablonski2005). Supplementary Table 2 presents assigned ecological trait categories per taxa.
The number of genera and species per ecological trait and percentage of each trait, were calculated for each time bin. Statistical differences between clusters based on ecological traits were evaluated through PERMANOVA using the Bray-Curtis distance metric. Additionally, we assessed whether changes in faunal composition were associated with specific traits by fitting smooth surfaces of ecological trait percentages onto the NMDS ordinations using generalized additive models (GAMs). This nonparametric approach allows for the visualization of potential nonlinear relationships between the community structure and the prevalence of specific ecological strategies. NMDS analyses were conducted in two dimensions (999 iterations). The statistical significance of each fitted surface was evaluated using the summary statistics from the resulting models (Table 1). A fixed seed was used in all cases to ensure replicability. Traits with minimal sample sizes (representing <5% of the total sample; i.e., the bivalve life habits borer and nestler/within hard surfaces, and the diet chemosymbiotic deposit feeder) were not considered for this surface fitting analysis.
Results from the generalized additive model (GAM) smooth surface fitting of ecological trait proportions onto the NMDS ordination of mollusk genera. edf, effective degrees of freedom; R 2 (adj) = adjusted R 2; deviance explained (%) indicates the percentage of deviance explained by the fitted surface. The p-values are formatted such that marginally significant values (p < 0.10) are italicized and significant values (p < 0.05) are italicized and bold. Traits with low sample sizes (i.e., borer, nestler/within hard surfaces, and chemosymbiotic deposit feeder) were excluded from this analysis.

All analyses were performed using R v. 4.4.1 (R Core Team 2024; Supplementary Data 2). Clustering analyses, NMDS, PERMANOVA, incidence-based Chao2, first-order Jackknife estimators, and ecological smooth surface fittings (GAMs) were performed using the vegan package v. 2.6-4 (Oksanen et al. Reference Oksanen, Simpson, Blanchet, Kindt, Legendre, Minchin and Hara2022). ISAs were performed with the indicspecies package v. 1.8.0 (Cáceres and Legendre Reference Cáceres and Legendre2009), while turnover rates employed the divDyn package v. 0.8.2 (Kocsis et al. Reference Kocsis, Reddin, Alroy and Kiessling2019).
Results
Taxonomic Composition
The molluscan fossil record from the late Miocene to the Holocene of this region comprises a total of 152 species, representing 97 genera and 51 families (see Supplementary Table 2). Gastropods encompass 26 families, 51 genera, and 96 species, while bivalves comprise 25 families, 46 genera, and 56 species. The families Muricidae and Veneridae stand out for their high diversity among gastropods and bivalves, respectively. Between the 10–9 Ma and the 1–0 Ma time bins, we observed 12 genera/26 species singletons within the fossil molluscan fauna, 8/20 corresponding to gastropods and 4/6 to bivalves. Stratigraphically, the Pisco Formation, which spans six time bins (10–4 Ma), yielded the highest number of genera (71) and species (89), as expected, given its long temporal range and a historically higher sampling effort. It was followed by the Quaternary marine terraces (1–0 Ma; 59 genera and 69 species) and the Pongo Formation (2–1 Ma; 52 genera and 57 species), likely reflecting a Pull of the Recent bias (Jablonski et al. Reference Jablonski, Roy, Valentine, Price and Anderson2003). Finally, the 4–2 Ma time interval, composed of the Caracoles Formation and Huacllaco sediments, had 45 genera and 52 species.
Faunal Assemblages
Cluster analyses and PERMANOVA at a genus level revealed two distinct molluscan assemblages over the past 10 Myr (Fig. 2, Supplementary Fig. 1; p = 0.005). The NMDS analysis, conducted using the Jaccard index as the similarity measure, produced a two-dimensional solution with a stress value of 0.005, confirming the data structure. The first assemblage, herein referred to as Assemblage A, was present during the late Miocene up to the 7–6 Ma time bin and so is exclusively found within the Pisco Formation. It is characterized by gastropod genera such as Alora, Phos, Ficus, and Misifulgur, as well as bivalves such as Hybolophus, Anadara, Chionopsis, and Dosinia (Supplementary Table 3). On average, 14.7% of the genera from this assemblage have become extinct, and 43.8% are locally extinct (Fig. 3, Supplementary Fig. 2). The second assemblage, herein referred to as Assemblage B, spans the 6–5 Ma through 1–0 Ma time bins and includes mollusk taxa recovered from the upper Pisco Formation, Caracoles Formation, Huacllaco section, Pongo Formation, and Pleistocene marine terraces. This assemblage is composed of mostly extant mollusks (Fig. 3, Supplementary Fig. 2), ranging from ~49.1% (6–5 Ma) up to 89.8% (1–0 Ma) extant genera. Assemblage B includes distinctive gastropod genera such as Trachycardium, Fissurella, Stramonita, and Cymatium, as well as bivalves such as Donax, Eurhomalea, Ensis, Mesodesma, and Glycymeris. Assemblage B does not share a cluster with the sample containing the modern Peruvian fauna (0–0 Ma).
Dendrogram of hierarchical clustering and nonmetric multidimensional scaling (NMDS) of faunal composition across time bins, based on the Jaccard dissimilarity index. Points represent time bins, and X’s indicate group centroids. A, Mollusk genera. B, Gastropod genera. C, Bivalve genera.

Status of mollusk genera by time bin: extant (blue), extinct (magenta), and extirpated/locally extinct (green). Panels show the number (A, C, E) and percentage (B, D, F) of mollusk (A, B), gastropod (C, D), and bivalve (E, F) genera in each status category.

Bivalve genera and species cluster assemblages followed the same temporal pattern observed in the broader mollusk genera grouping (i.e., 10–6 Ma and 6–0 Ma; Fig. 2, Supplementary Fig. 1; p = 0.005) but differed slightly from the change in gastropod assemblages. The initial gastropod assemblage is observed up to the 6–5 Ma time bin, then a new, less defined assemblage emerged during the 5–4 Ma time bin and persists until the 1–0 Ma time bin (Fig. 2; Supplementary Fig. 1; p = 0.009). The bivalve and gastropod NMDS analyses further revealed that bivalve associations went through an abrupt restructuring, while gastropods exhibited a gradual change in faunal composition.
Ecological Selectivity
Bivalve assemblages (10–6 Ma and 6–0 Ma) showed significant shifts in ecological trait composition, whereas gastropod assemblages (10–5 Ma and 5–0 Ma) retained similar ecological trait compositions across clusters. PERMANOVA revealed that, at the genus level, bivalve life habit (p = 0.007), mobility (p = 0.026), shell fixation (p = 0.046), and diet composition (p = 0.007) varied significantly between the 10–6 Ma cluster and the 6–0 Ma cluster. In contrast, gastropod ecological trait composition did not show significant differences between the 10–5 Ma and 5–0 Ma clusters, either in life habit (p = 0.244) or in diet (p = 0.072).
We found that mollusk composition changes were related only to specific ecological traits, as shown by fitting smooth surfaces onto the NMDS ordinations (Fig. 4, Supplementary Fig. 3). At the genus level, bivalve life habits, such as both semi-infaunal (p = 0.069) and infaunal asiphonate (p = 0.069) traits, were marginally significant, showings higher percentages in the older Assemblage A (10–6 Ma; Fig. 4A). Other life habits, such as epifaunal (p = 0.131) and infaunal siphonate (p = 0.455), did not significantly change between assemblages. Likewise, bivalve mobility traits were not significantly different (e.g., immobile, p = 0.167). For shell fixation, only the cemented trait showed a marginally significant relationship (p = 0.077), with the fitted surface indicating a prevalence associated with the older assemblage (Fig. 4C). Among bivalve diets, deposit feeder was the only marginally significant trait (p = 0.064), with higher percentages associated with the older 10–6 Ma time bins (Fig. 4D). For gastropods, life habit traits were not associated with the ordination (p = 0.204). Among gastropod diets, the suspension-feeder trait was the only one to show a significant relationship (p = 0.015), explaining 94.7% of the deviance. The fitted surface shows that high percentages of this trait are strongly associated with the younger Assemblage B (6–0 Ma) (Fig. 4E).
Temporal patterns in ecological genus composition, selectivity, and structure of bivalve and gastropod genus-level assemblages. Each panel shows (left) stacked bar plots of the proportional representation of ecological categories per time bin, with sample sizes (n) indicated above each bar. Where statistically significant (p < 0.05) or marginally significant (p < 0.10), the (right) panels show NMDS ordinations of presence–absence Jaccard-based community composition with trait percentages fit as smooth surfaces using generalized additive models (GAMs). Contours represent the modeled percentage. A, Bivalve life habit categories (epifaunal, infaunal siphonate, infaunal asiphonate, semi-infaunal, nestler, and borer), with fitted surfaces for semi-infaunal and infaunal asiphonate. B, Bivalve mobility categories (actively mobile, immobile, and sedentary forms), with no traits being significantly associated with the ordination. C, Bivalve shell fixation categories (unattached, cemented, and byssally attached), with fitted surface for cemented. D, Bivalve diet categories (suspension feeders, deposit feeders, and chemosymbiotic deposit feeders), with fitted surface for deposit feeder. E, Gastropod diet categories (carnivores, grazers, and suspension feeders), with fitted surface for suspension feeder. F, Gastropod life habit categories (epifaunal and infaunal), with no traits being significantly associated with the ordination.

Diversity and Turnover Rates
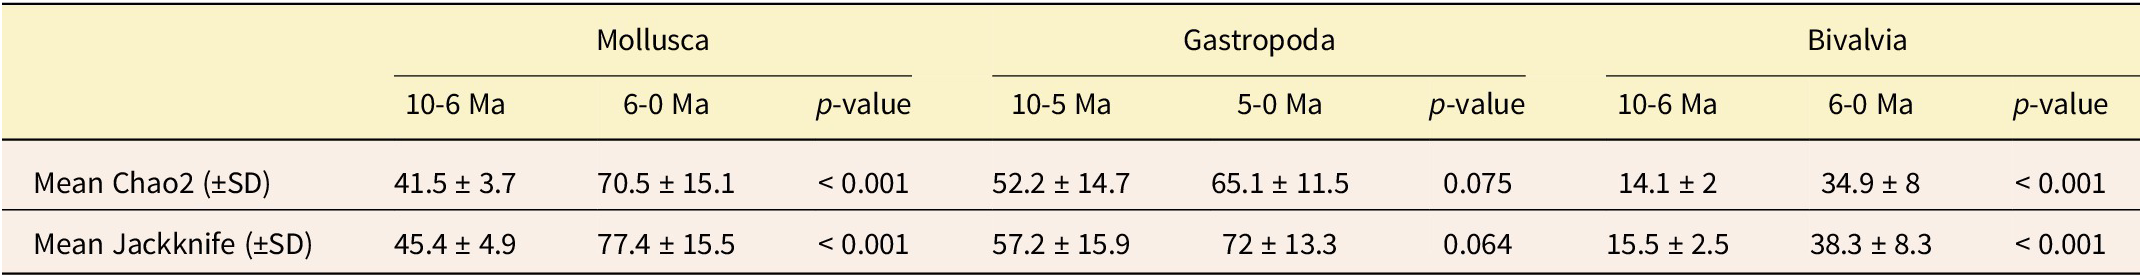
We found that molluscan Assemblage A (10–6 Ma) had lower genus richness (p < 0.001), with a mean Chao2 estimation of 41.5 ± 3.7, compared with the higher taxonomic diversity found in Assemblage B (6–0 Ma), which had a mean Chao2 estimation of 70.5 ± 15.1 (Table 2). However, bivalve and gastropod diversity between clusters does not follow the same pattern as the overall molluscan assemblages. Bivalve diversity exhibited the same pronounced increase toward the younger cluster (6–0 Ma), with mean Chao2 estimations indicating a significant increase from 14.1 ± 2 to 34.9 ± 8 (p < 0.001). In contrast, gastropod diversity showed no discernible difference between the 10–5 Ma cluster and the 5–0 Ma cluster (p = 0.075), with mean Chao2 estimations of 52.2 ± 14.7 and 65.1 ± 11.5, respectively. This shows that the molluscan diversity pattern is primarily driven by changes in bivalve diversity.
Incidence-based Chao2 and first-order Jackknife diversity estimates of mollusk, bivalve, and gastropod genera per assemblage identified through hierarchical clustering. The p-values indicate significance of assemblage differences based on the Mann-Whitney U-test.

The per capita origination rates among mollusks varied across time bins (Fig. 5, Supplementary Fig. 4, Supplementary Table 4). A first origination peak was observed within the 10–9 Ma time bin at genus (oriPC = 0.66) and species levels (oriPC = 1.22), which coincides with the onset of molluscan fauna characteristic of the late Miocene (Fig. 2, Supplementary Fig. 1). Both bivalves and gastropods display the same increase in origination rates, although at differing intensities. A second origination peak at the genus (oriPC = 0.0.4) and species (oriPC = 0.72) levels was observed within mollusks at the 6–5 Ma time bin. At a genus level, gastropods presented a low origination rate of 0.2, while bivalves reached a value of 0.61. From the 5–4 Ma time bin to the 1–0 Ma time bin, consistently low genus origination rates were noted for bivalves (oriPC = 0–0.27; mean oriPC = 0.14) and gastropods (oriPC = 0.05–0.15; mean oriPC = 0.1), which contrasts with a consistent, albeit modest, value in mollusk species origination rates averaging 0.34 (Fig. 5). These consistent origination rates can explain higher diversity values observed in bivalves from Assemblage B.
Changes in molluscan diversity and turnover at the genus level, in relation to oceanographic and geological events. A, Summary chronostratigraphic column of the southern East Pisco Basin (EPB; Sacaco area and Huacllaco section; Ochoa et al. Reference Ochoa, DeVries, Quispe, Barbosa-Espitia, Salas-Gismondi, Foster and Gonzales2022). The Pisco Formation (pale blue; >12 Ma–4.5 Ma), Caracoles Formation (orange; 2.7–1.9 Ma), Huacllaco (pink; 3.4–1.4 Ma), Pongo Formation (green; 1.9–1.4 Ma) and marine terraces (cyan; <1Ma). B, Central Andean elevation profile from Martínez et al. (Reference Martínez, Jaramillo, Correa-Metrío, Crepet, Moreno, Aliaga, Moreno, Ibañez-Mejia and Bush2020). C, Global sea-level data from Miller et al. (Reference Miller, Browning, Schmelz, Kopp, Mountain and Wright2020). D, Sea- surface temperature (SST) data from Dekens et al. (Reference Dekens, Ravelo and McCarthy2007; site 1237; black) and Liu et al. (Reference Liu, Tian, Liu, Herbert, Fedorov and Lyle2019; ODP 846; magenta). E, Per capita origination rates (oriPC). F, Per capita extinction rates (extPC). Horizontal error bars correspond to time bin groupings.

Mollusk per capita extinction rates are marked by a two-step event (Fig. 5, Supplementary Fig. 4, Supplementary Table 4) within the 6–5 Ma and 5–4 Ma time bins, with average rates of 0.21 and 0.52 for genera and species, respectively. Elevated extinction rates are identifiable in gastropods and bivalves, although they exhibit differing temporalities and intensities. Gastropod genus exhibited an increase in extinction rates within the 6–5 Ma (extPC = 0.25) and 5–4 Ma time bins (extPC = 0.2), while at a species level, there was also a sustained increase during the 6–5 Ma (extPC = 0.81) and the 5–4 Ma (extPC = 0.69) time bins. No bivalve extinctions were recorded for the 6–5 Ma time bin; however, extinction rates peaked within the 5–4 Ma time bin (genera extPC = 0.35 and species extPC = 0.57).
Discussion
Regional Biodiversity Shifts
The disparity between modern and Mio-Pliocene molluscan fossil faunas of western South America has led to suggestions that a major molluscan turnover occurred during the late Neogene, in particular at the Plio-Pleistocene transition (ca. 3–2 Ma; Herm Reference Herm1969; DeVries Reference DeVries2001; Rivadeneira and Marquet Reference Rivadeneira and Marquet2007; Rivadeneira and Nielsen Reference Rivadeneira and Nielsen2017; Vermeij et al. Reference Vermeij, DeVries, Griffin, Nielsen, Ochoa, Rivadeneira, Salas‐Gismondi and Valdovinos2024). Our analysis of the Peruvian mollusk fauna confirms and quantifies this faunal turnover; however, we found it occurred during the Mio-Pliocene transition (around 6–4 Ma), earlier than observed on the Chilean coast (Rivadeneira and Marquet Reference Rivadeneira and Marquet2007; Rivadeneira and Nielsen Reference Rivadeneira and Nielsen2017), as suggested by Vermeij et al. (Reference Vermeij, DeVries, Griffin, Nielsen, Ochoa, Rivadeneira, Salas‐Gismondi and Valdovinos2024).
Our analysis shows that the turnover in Peru does not coincide with geologic formation boundaries, implying that the observed compositional patterns are not driven by stratigraphic hiatuses, taphonomic limitations, or depositional settings. Lithostratigraphic features of the Pisco Formation support this, as it represents a consistently shallow depositional environment; therefore, its internal faunal dissimilarities cannot be attributed to such artifacts like the 4.5–2.7 Ma EPB hiatus. Assemblage A, which includes mollusks from 10 to 6 Ma, is mainly composed of a gastropod fauna exclusive to the Pisco Formation, including key genera such as Herminespina, Ficus, Chorus, and Misifulgur (Supplementary Fig. 5). It coincides with the Chorus frassinettii-Herminespina philippii Molluscan Concurrent Range Zone (fpMZ) proposed by DeVries (Reference DeVries2020). A sudden origination (6–5 Ma) and subsequent extinction (5–4 Ma) of numerous bivalve taxa, as well as a prolonged turnover of gastropods from 6 to 4 Ma gave rise to Assemblage B, which includes taxa characteristic of the modern Humboldt Province, such as Trachycardium, Eurhomalea, Ensis, and Choromytilus bivalves, as well as Thaisella, Stramonita, Polinices, Fissurella, and Crepipatella gastropods. This new assemblage is recovered from sediments deposited both before and after a regional unconformity dated to 4.5 Ma (Ochoa et al. Reference Ochoa, Salas-Gismondi, DeVries, Baby, Muizon, Altamirano and Barbosa-Espitia2021), which are associated with the Pisco, Caracoles, and Pongo Formations, as well as with the Huacllaco sediments and the Pleistocene marine terraces.
It is possible that some extinctions attributed to the 5–4 Ma time bin in fact occurred during the 4–3 Ma time bin, leading to an artificially elevated extinction peak, which could be distributed over two time bins. This misattribution may result from a 1.8 Myr sedimentary hiatus between the Caracoles and Pisco Formations. Our analysis, however, showed that there is no artificial origination increase in the 3–2 Ma time bin after the presence of the hiatus (Fig. 5), supporting a steady origination rate since the early Pliocene (5–4 Ma). Additionally, the fossil record found within the Huacllaco sediments (3.4–1.4 Ma) partially covers the Pisco-Caracoles hiatus (4.5 to 2.7 Ma). Therefore, these possible misattributions do not challenge the observed faunal compositions for Assemblages A and B, nor do they impact the temporal distribution or diversity observed in each of these assemblages.
Along the Chilean coast, a faunal turnover between the Pliocene and Pleistocene led to the extinction of approximately 66% of bivalve species, primarily affecting epifaunal forms, while large-sized taxa had a higher survival rate (Rivadeneira and Marquet Reference Rivadeneira and Marquet2007). Rivadeneira and Nielsen (Reference Rivadeneira and Nielsen2017) also identified a substantial local extinction of gastropod species between those epochs, which was then followed by the addition of new species, resulting in a selective loss of large-sized carnivores and an increase in small-sized herbivore grazers and suspension feeders. Our analyses on the Peruvian molluscan fauna also revealed significant shifts in ecological trait composition between molluscan assemblages (PERMANOVA analyses). For bivalves, this shift was characterized by a marginally significant long-term decline in taxa with traits such as semi-infaunal and infaunal asiphonate life habits, cemented shell fixation, and a deposit-feeder lifestyle (Table 1). Gastropods underwent a long-term shift in ecological trait composition, characterized by a late Miocene to modern significant expansion of suspension feeders (Fig. 4E, Table 1). None of the remaining ecological traits exhibit significant long-term differences between assemblages (Table 1). The combination of a single significant shift in gastropod diet with declines in specific bivalve life habits, along with the nonsignificant variance of several traits (e.g., bivalve mobility), suggests that the 6–4 Ma turnover was not driven by a unidirectional ecological process. Instead, our results support the interpretation that the observed faunal change reflects a broad reorganization of ecological strategies (Jablonski and Sepkoski Reference Jablonski and Sepkoski1996), albeit one that included specific selective pressures, most notably the rise of suspension-feeding gastropods. The difference in ecological selectivity and timing between the Peruvian and Chilean molluscan faunas may be indicative of local factors driving distinct pathways of ecological restructuring (Vermeij et al. Reference Vermeij, DeVries, Griffin, Nielsen, Ochoa, Rivadeneira, Salas‐Gismondi and Valdovinos2024). However, similar patterns to those observed in Chile may emerge if high-resolution analyses using finer chronostratigraphic detail (i.e., below 1 Myr) are applied to the EPB molluscan Plio-Pleistocene record.
Drivers of Biodiversity Changes toward Modern Fauna Consolidation
The vertebrate fossil record (see Muizon and DeVries Reference Muizon and DeVries1985; Ochoa et al. Reference Ochoa, Salas-Gismondi, DeVries, Baby, Muizon, Altamirano and Barbosa-Espitia2021; Collareta et al. Reference Collareta, Lambert, Marx, Muizon, Varas-Malca, Landini and Bosio2021 and references therein), the presence of subtropical mollusks (Ficus, Terebra; Muizon and DeVries Reference Muizon and DeVries1985; DeVries Reference DeVries2020), and paleotemperature reconstructions from offshore sediment cores (Dekens et al. Reference Dekens, Ravelo and McCarthy2007; Liu et al. Reference Liu, Tian, Liu, Herbert, Fedorov and Lyle2019) indicate that the Peruvian coast experienced warm surface waters during the deposition of the upper Pisco Formation (10–4.5 Ma). Between 6 and 3 Ma, SSTs were 2–4°C warmer than today in the eastern tropical Pacific and off Peru (Dekens et al. Reference Dekens, Ravelo and McCarthy2007; Rafter et al. Reference Rafter, Farmer, Martínez-García, Ravelo, Karnauskas, Batista and Bernasconi2025). The Pacific zonal gradient was reduced, arguably creating El Niño–like mean conditions (Wara et al. Reference Wara, Ravelo and Delaney2005; Dekens et al. Reference Dekens, Ravelo and McCarthy2007; Fedorov et al. Reference Fedorov, Burls, Lawrence and Peterson2015). Offshore eastern equatorial Pacific primary productivity appears stable since the early Pliocene (~5 Ma; Rafter et al. Reference Rafter, Farmer, Martínez-García, Ravelo, Karnauskas, Batista and Bernasconi2025). Whether primary productivity in the coastal upwelling differed during warmer Mio-Pliocene climates remains unresolved. However, warmer conditions were more likely the result of a deeper thermocline and warmer subsurface water than of weaker upwelling (Fedorov et al. Reference Fedorov, Dekens, McCarthy, Ravelo, deMenocal, Barreiro, Pacanowski and Philander2006; Dekens et al. Reference Dekens, Ravelo and McCarthy2007; Rafter et al. Reference Rafter, Farmer, Martínez-García, Ravelo, Karnauskas, Batista and Bernasconi2025), as suggested by pervasive Chaetoceros-rich diatomites. Warmer SSTs in the eastern tropical Pacific would have strengthened local atmospheric convection, leading to increased coastal precipitation (Ochoa et al. Reference Ochoa, Carré, Montenegro, DeVries, Caballero-Rodríguez, Rodríguez-Reyes and Barbosa-Espitia2025), thus promoting terrigenous supply into the EPB (Gonzales Reference Gonzales2023). These conditions may have contributed to the subsequent faunal restructuring, supporting high bivalve origination rates while also creating ecological opportunities for suspension-feeding gastropods, which became a significant component of the new assemblage.
During the early Pliocene, a combination of oceanographic and tectonic-driven geomorphological changes reshaped the coastal landscapes, altering habitats, coastal temperatures, salinity gradients, and nutrient availability (Fig. 5). Late Miocene–early Pliocene (6–5 Ma) tectonic activity driven by the Nazca Plate’s subduction caused an uplift pulse along the central Andes Cordillera (Kar et al. Reference Kar, Garzione, Jaramillo, Shanahan, Carlotto, Pullen, Moreno, Anderson, Moreno and Eiler2016; Martinez et al. Reference Martínez, Jaramillo, Correa-Metrío, Crepet, Moreno, Aliaga, Moreno, Ibañez-Mejia and Bush2020) and a gradual reduction of the late Miocene shallow embayments. This was followed by a sustained Pliocene sea-level rise of 21 m (ca. 4.9–3.9 Ma; Miller et al. Reference Miller, Browning, Schmelz, Kopp, Mountain and Wright2020), which modified the coastline and rocky shore distribution, resulting in landward movement of the coastline, and thus an expansion of the continental platform and an increase in niche availability. Nonetheless, the current topography and sedimentary record of the central Peruvian coastline suggest heterogeneous landscapes through time. For instance, the Antenas locality at Ica (14.45°S, 75.58°W) would have been an embayment during the Pliocene, and the course of Quebrada Gramonal along the Ica Valley would have been inundated during the Pleistocene, leaving behind several marine terrace remnants, while the modern Paracas Bay represents the present-day expression of such shallow-water settings. Further assessment of rocky shore biota from the EPB (e.g., Huacllaco, Montemar, Sud-Sacaco, Quebrada Huaricangana, Ica Valley) could reveal the role that the reduction of sheltered habitats and rocky areas and the increase of sandy habitats played in mollusk diversification patterns. Changes in coastal morphology, regional hydrological cycles (Burls and Fedorov Reference Burls and Fedorov2017), and geochemistry (salinity, oxygenation) likely contributed to the elevated mollusk extinction rates during the Mio-Pliocene transition (6–4 Ma) and a subsequent restructuring of molluscan communities (Vermeij et al. Reference Vermeij, DeVries, Griffin, Nielsen, Ochoa, Rivadeneira, Salas‐Gismondi and Valdovinos2024). This process has also been mentioned as a contributing factor for the extinction of vertebrate taxa characteristic of the Pisco Formation, such as the aquatic sloth Thalassocnus, the gavialoids Piscogavialis and Sacacosuchus, and the mollusk-eating walrus-like dolphin Odobenocetops (Ochoa et al. Reference Ochoa, Salas-Gismondi, DeVries, Baby, Muizon, Altamirano and Barbosa-Espitia2021; Salas-Gismondi et al. Reference Salas-Gismondi, Ochoa, Jouve, Romero, Cardich, Perez, DeVries, Baby, Urbina and Carré2022).
While El Niño events today strongly impact coastal ecosystems in Peru (Arntz et al. Reference Arntz, Gallardo, Gutiérrez, Isla, Levin, Mendo, Neira, Rowe, Tarazona and Wolff2006; Valqui et al. Reference Valqui, Ibañez-Erquiaga, Pacheco, Wilbur, Ochoa, Cardich and Pérez-Huaranga2021), their influence during the Mio-Pliocene is unclear. Some climate models and paleoceanographic data suggest that the ENSO was active in the Pliocene (Haywood et al. Reference Haywood, Valdes and Peck2007; Scroxton et al. Reference Scroxton, Bonham, Rickaby, Lawrence, Hermoso and Haywood2011; White and Ravelo Reference White and Ravelo2020) or even during the late Miocene (Gonzales Reference Gonzales2023). El Niño events today favor the southward migration and settling of warm-water species (Paredes et al. Reference Paredes, Cardoso and Tarazona2004), modifying the latitudinal diversity and faunal assemblages along the southern Peruvian coast. If an active ENSO existed during the late Miocene, understanding its effects on the diversity of the Peruvian coast remains challenging and beyond the scope of this paper. It would require (1) a complete characterization of the Panamic mollusk faunas that inhabited the Caribbean and eastern tropical Pacific from, at least, the middle to late Miocene; and (2) extending the spatiotemporal record outside the EPB to include Peruvian and Chilean records in order to identify taxa exclusively associated with the upwelling process of cooler waters from the south.
Since the Plio-Pleistocene transition, changes in oceanic conditions have probably been the main driver of ecosystem change. A sustained global decrease in SST (Zachos et al. Reference Zachos, Pagani, Sloan, Thomas and Billups2001; Dekens et al. Reference Dekens, Ravelo and McCarthy2007; Liu et al. Reference Liu, Tian, Liu, Herbert, Fedorov and Lyle2019), combined with a reduction of sea level (Miller et al. Reference Miller, Browning, Schmelz, Kopp, Mountain and Wright2020), which coincided with the intensification of coastal upwelling (Dekens et al. Reference Dekens, Ravelo and McCarthy2007), shaped the establishment of the modern Humboldt ecosystems (Fig. 5). This transformation has been recognized in the vertebrate fossil record (Villafaña and Rivadeneira Reference Villafaña and Rivadeneira2014; Ochoa et al. Reference Ochoa, Salas-Gismondi, DeVries, Baby, Muizon, Altamirano and Barbosa-Espitia2021) with the appearance of cold-adapted taxa like otariid pinnipeds and the diversification of delphinid dolphins; these groups still maintain a high position in the trophic network of the HCS. Our results indicate that mollusks also experienced a shift in composition since the Plio-Pleistocene, with the addition of bivalve species now characteristic of the HCS, such as Argopecten purpuratus, Donax obesulus, Mesodesma donacium, and Aulacomya atra (Supplementary Fig. 5). Notably, while gastropod genus richness remained stable following the 6–4 Ma turnover event (Table 2), this apparent stability masks a significant ecological restructuring, with suspension-feeding gastropods becoming a key component of the new assemblage (Table 1). This indicates the faunal turnover differentially impacted both groups: bivalves were restructured primarily through high origination rates that added new HCS-adapted species, while gastropods went through an ecological trait restructuring. The addition of the new bivalve species is likely linked to shifts in habitat availability, such as the expansion of sandy environments since the Mio-Pliocene transition.
Extant mollusk genera from northern Peru (i.e., the Panamic Province) are present in the EPB fossil record since the Miocene (Supplementary Fig. 2), yet they are especially abundant and well preserved in the late Pleistocene marine terraces (Ortlieb et al. Reference Ortlieb, DeVries and Diaz1990). The presence of tropical taxa (i.e., Iliochione subrugosa, Cerithium stercusmuscarum), locally referred to as “El Niño species,” among temperate assemblages in the 1–0 Ma time bin may coincide with periods of orbitally strengthened ENSO variability during some interglacial periods and may partly account for increasing local diversity in the late Pleistocene, after the arrival of northern immigrants. Does the geological record suggest future higher molluscan diversity in response to climate change? There is no conclusive evidence. However, we argue that the geological record does not support a future long-term increase in species richness. First, the arrival of northern species appears to be driven by short-term and episodic events. Second, the existing coastal record does not include faunal data from colder periods associated with glacial events, thus preventing any assessment of glacial/interglacial–driven faunal changes. Furthermore, there is controversial evidence regarding the response of the HCS to current climate change (e.g., D. Gutiérrez et al. Reference Gutiérrez, Bouloubassi, Sifeddine, Purca, Goubanova, Graco and Field2011, Reference Gutiérrez, Akester and Naranjo2016; Oerder et al. Reference Oerder, Colas, Echevin, Codron, Tam and Belmadani2015; M. T. Gutiérrez et al. Reference Gutiérrez, Castillo, Naranjo and Akester2017; Oyarzún and Brierley Reference Oyarzún and Brierley2019; Ramos et al. Reference Ramos, Tam, Aramayo, Briceño, Bandin, Buitron and Cuba2022). It is uncertain whether future changes in oceanographic and circulatory conditions will result in strong upwelling of cold deep waters or a dominance of stratified warm waters in present-day coastal upwelling cells.
Limitations and Future Directions
A notable limitation in our study comes from the lack of taxonomic resolution for some mollusk groups (e.g., Ostreidae, Veneridae, Pectinidae), particularly in taxa with limited taxonomically distinctive morphological features or poor preservation in the fossil record (e.g., Mytilidae). Therefore, while performing analyses at both a genus and species levels helped alleviate this limitation, further research focusing on taxonomy and phylogeny would enable a more precise understanding of specific evolutionary patterns.
Another limitation is related to chronostratigraphic uncertainty (i.e., no robust definition of the formation ages). Among the studied fossil localities, 12–10 Ma sediments are scarce, restricting our understanding of mollusk evolution from the middle to the early late Miocene. Additionally, the upper and lower age limits of geological units such as the Caracoles (2.7–~2 Ma) and Pongo Formations (~1.9 to 1.4 Ma) remain elusive. Although the precise age of these units remains unknown, their proximity to the present and their reduced temporal duration (less than 1 Myr) contained within a single time bin reduce its impact on the interpretation of evolutionary insights. As the age of marine sediments within the Sacaco area is better determined, higher-resolution studies of diversification patterns (e.g., 0.5 Myr time bins) and compositional analyses could be performed. Likewise, the fauna preserved in the fossil record is not always representative of an entire period. Marine terraces of the EPB correspond only to interglacial periods; therefore, we do not have an accurate record of the composition of molluscan fauna in glacial periods characterized by lower sea levels and cooler waters. Furthermore, the modern biogeographic and oceanographic zonation of the Peruvian coastline into three recognized marine provinces is also defined based on interglacial fauna.
Finally, future research on mollusks in the EPB should focus on (1) assessing spatial faunal changes to evaluate how diverse depositional settings affect long-term diversity patterns as well as ecological shifts and (2) evaluating functional diversity through analyses that integrate both species’ traits and abundance data to determine the impact of certain key species on the EPB ecosystems. Although the vertebrate communities of the EPB have been extensively studied (see Collareta et al. Reference Collareta, Lambert, Marx, Muizon, Varas-Malca, Landini and Bosio2021; Ochoa et al. Reference Ochoa, Salas-Gismondi, DeVries, Baby, Muizon, Altamirano and Barbosa-Espitia2021), the role of invertebrate taxa, such as mollusks and crustaceans, in the HCS evolution has not been fully explored. Therefore, there is a pressing need to integrate the evolutionary history and ecology of mollusks into the study of Peruvian coastal ecosystem history.
Conclusions
We presented a chronostratigraphically controlled analysis of the EPB mollusk fauna to improve our understanding of the Peruvian coastal ecosystem’s evolution. Through clustering and ordination analyses, we identified two molluscan assemblages: Assemblage A, present throughout the late Miocene (10–6 Ma), and Assemblage B (6–0 Ma), which resembles the modern fauna of the central-southern Peruvian coast. This suggests that the modern molluscan fauna of the HCS—at least at the genus level—began to establish itself earlier than its vertebrate counterpart. The modern faunal configuration started with a significant turnover during the Mio-Pliocene transition (6–4 Ma), with a different temporality and intensity for gastropods and bivalves. Gastropods exhibited a gradual turnover between 6 and 4 Ma. Bivalves underwent a stepwise restructuring, with an origination event at 6–5 Ma, followed by an extinction event at 5–4 Ma. This turnover represented a broad reorganization of ecological strategies, with bivalves showing declines in specific traits, while gastropods underwent a significant shift in diet with the rise of suspension feeders. We propose that the 6–4 Ma turnover event was driven by a combination of factors, including the Mio-Pliocene uplift pulse of the Andes Cordillera and the disappearance of semi-embayments formed by the Coastal Cordillera, followed by a sustained Pliocene +21 m sea-level rise. This study unlocks the potential for future integration of molluscan fauna into the study of the Humboldt Current ecosystems.
Acknowledgments
This project received funding from the European Union’s Horizon 2020 research and innovation program under the Marie Skłodowska-Curie grant agreement no. 101034371. It was also supported by a CONCYTEC-PROCIENCIA research grant awarded to D.O. (PE501078563–2022-PROCIENCIA) and through the Programa de incorporación de investigadores awarded to M.C. (grant no. E034-2019-02-FONDECYT-BM). R.M.-F. acknowledges funding from the “Beca de estímulo Fernando Porturas Plaza” (Universidad Peruana Cayetano Heredia). We extend special thanks to M. Rivera-Chira (Universidad Peruana Cayetano Heredia) and M. Soto (L’Institut de Recherche pour le Développement-Peru) for their dedication in preserving the legacy of Luc Ortlieb through the protection and housing of his malacological collection. Additionally, we appreciate the logistical assistance provided by S. Simon (Universidad Peruana Cayetano Heredia). Our gratitude extends to W. Grados and F. Quispe for their invaluable support in the field and lab, as well as to E. Armour-Smith and J. Armour-Smith for their logistical assistance while visiting the collections housed at the University of Washington. Sincere appreciation to G. Castro for guidance on new language tools. We thank the two anonymous reviewers and the editor for their constructive comments and suggestions, which significantly improved the quality of the article.
Competing Interests
The authors declare no conflicts of interest.
Data Availability Statement
The datasets supporting the conclusions of this study are available on the Dryad Digital Repository at https://doi.org/10.5061/dryad.g4f4qrg46. Supplementary materials and analytical code are available on the Zenodo Open Repository at https://doi.org/10.5281/zenodo.18012212.
Author Contributions
Conceptualization: D.O., T.D., R.M.-F. Methodology: R.M.-F., D.O., T.D., R.S.-G., A.I. Investigation: R.M.-F., T.D., M.C., R.S.-G., A.I., D.O. Visualization: R.M.-F., D.O. Supervision: D.O., T.D.
Writing—original draft: R.M.-F., D.O. Writing—review and editing: R.M.-F., T.D., M.C., R.S.-G., A.I., D.O.


 Open access