


Introduction
Biotic invasions are a leading cause of extinction in modern ecosystems (Eldredge Reference Eldredge1992; Lodge Reference Lodge1993; Lockwood and Pimm Reference Lockwood and Pimm1994; Singh Reference Singh2002; Lockwood et al. Reference Lockwood, Hoopes and Marchetti2007; Oliver et al. Reference Oliver, Heard, Isaac, Roy, Procter, Eigenbrod, Freckleton, Hector, Orme, Petchey, Proença, Raffaelli, Suttle, Mace, Martín-López, Woodcock and Bullock2015); however, their effects on ecosystem structure and functioning remain poorly understood. Data before invasion are rare, and studies are typically restricted to only a few species over short ecological timescales (Stouffer et al. Reference Stouffer, Sales-Pardo, Sirer and Bascompte2012; David et al. Reference David, Thébault, Anneville, Duyck, Chapuis and Loeuille2017; Mollot et al. Reference Mollot, Pantel and Romanuk2017). Yet ongoing anthropogenic effects, most notably global climate change, are likely to increase the taxonomic breadth and richness of species movements over the coming decades and centuries, particularly as habitats are altered. Geographic ranges change as species track shifting environments, and interspecific relationships are disrupted as a consequence. These changes have much in common with episodes of biotic interchanges and invasions in the geological past, commonly occurring during previous warming intervals, and are predicted to occur in the near future (Vermeij and Roopnarine Reference Vermeij and Roopnarine2008; Stigall Reference Stigall2019). Ancient invasions, although represented over longer temporal scales, were mechanistically and biologically comparable to modern invasions, and can be used to directly assess the ecological and evolutionary consequences of invasions (Stigall Reference Stigall2019). In addition, the fossil record documents persistent ecosystem dynamics (Aberhan Reference Aberhan1994) and can be used to understand how and why ecosystems change in response to perturbations (Jackson et al. Reference Jackson, Kirby, Berger, Bjorndal, Botsford, Bourque, Bradbury, Cooke, Erlandson, Estes, Hughes, Kidwell, Lange, Lenihan, Pandolfi, Peterson, Steneck, Tegner, Warner and Pandolfi2001; Miller et al. Reference Miller, Kneitel and Burns2002; Jackson and Erwin Reference Jackson and Erwin2006; Dzialowski et al. Reference Dzialowski, Lennon and Smith2007; Sperfeld et al. Reference Sperfeld, Schmidtke, Gaedke and Weithoff2010; Louys et al. Reference Louys, Wilkinson, Bishop and Louys2012; Gray et al. Reference Gray, Dykhuizen and Padilla2015; Roopnarine Reference Roopnarine, Dietl and Flessa2018; Tyler and Schneider Reference Tyler, Schneider, Tyler and Schneider2018; Stigall Reference Stigall2019). Therefore, here, we compare food webs across the Richmondian invasion, a well-documented invasion, to determine its effects on the structure and dynamics of Late Ordovician shallow-marine paleocommunities from the Cincinnati region (USA).
Biotic invasions preserved in the fossil record are well studied and are characterized by a hierarchical system based on the spatial scale of success and the relative evolutionary and ecological impacts (Stigall Reference Stigall2019). During the Late Ordovician (Katian), marine paleocommunities of the Cincinnati Basin were thought to be compositionally stable (i.e., little faunal turnover) for several million years until connected with previously isolated basins by rising sea levels (Patzkowsky and Holland Reference Patzkowsky and Holland1997; Holland and Patzkowsky Reference Holland and Patzkowsky2007; Malizia and Stigall Reference Malizia and Stigall2011). This facilitated the rapid widespread influx of more than 60 genera to the region over a relatively short period of ~1 Myr termed the “Richmondian invasion” (Anstey Reference Anstey1986; Patzkowsky and Holland Reference Patzkowsky and Holland1993, Reference Patzkowsky and Holland1996, Reference Patzkowsky and Holland1997, Reference Patzkowsky and Holland2007; Holland and Patzkowsky Reference Holland and Patzkowsky2007; Dudei and Stigall Reference Dudei and Stigall2010; Malizia and Stigall Reference Malizia and Stigall2011; Brame and Stigall Reference Brame and Stigall2014). The Richmondian invasion therefore falls into the hierarchical category of “coordinated” invasions (Stigall Reference Stigall2019), as numerous taxa simultaneously emigrated from previously isolated basins over a relatively short period of time, which is thought to have resulted in substantial community turnover, niche differentiation, and community restructuring (Holland and Patzkowsky Reference Holland and Patzkowsky2007; Stigall Reference Stigall2010; Stigall and Fine Reference Stigall and Fine2019). The invasion itself has been the subject of numerous studies focused on documenting the invasion, as well as changes in diversity and community structure (e.g., Patzkowsky and Holland Reference Patzkowsky and Holland1996; Holland Reference Holland, Brett and Baird1997; Holland and Patzkowsky Reference Holland and Patzkowsky2007), the geographic extent of the invasion (e.g., Stigall Reference Stigall2010), and shifts in geographic range and niche occupation (e.g., Dudei and Stigall Reference Dudei and Stigall2010; Malizia and Stigall Reference Malizia and Stigall2011; Tyler and Leighton Reference Tyler and Leighton2011; Walls and Stigall Reference Walls and Stigall2012). This study builds on and extends this earlier work by directly assessing changes in trophic energy flow and paleocommunity structure using networks of trophic interactions (food webs).
The effects of invasions on food webs vary. As immigrating species can occur at any trophic level, and have both direct and indirect effects, invasions frequently result in changes of trophic structure and functional richness (Wonham and Pachepsky Reference Wonham and Pachepsky2006; Byrnes et al. Reference Byrnes, Reynolds, Stachowicz, van Beusekom and Busch2007; Gido and Franssen Reference Gido and Franssen2007; Olden et al. Reference Olden, Pusey and Kennard2007; Romanuk et al. Reference Romanuk, Zhou, Brose, Berlow, Williams and Martinez2009; Comte et al. Reference Comte, Cucherousset and Olden2017; David et al. Reference David, Thébault, Anneville, Duyck, Chapuis and Loeuille2017). Competitive effects may arise, negatively affecting incumbents (Thomsen et al. Reference Thomsen, Byers, Schiel, Bruno, Olden, Wernberg and Silliman2014), and ecological displacement may occur, restricting the realized niche of incumbents to promote coexistence with invaders by reducing dietary overlap (Malizia and Stigall Reference Malizia and Stigall2011; Tyler and Leighton Reference Tyler and Leighton2011; Stigall Reference Stigall2014; David et al. Reference David, Thébault, Anneville, Duyck, Chapuis and Loeuille2017). Shifts in the number and/or intensity of species interactions can also alter the division of the network into modules, that is, groups of guilds more densely connected among themselves than to the rest of the network (Newman Reference Newman2006; Pascual and Dunne Reference Pascual and Dunne2006; Blondel et al. Reference Blondel, Guillaume, Lambiotte and Lefebvre2008; Rezende et al. Reference Rezende, Albert, Fortuna and Bascompte2009; Stouffer and Bascompte Reference Stouffer and Bascompte2011). Such compartmentalization is widespread in modern food webs (Krause et al. Reference Krause, Frank, Mason, Ulanowicz and Taylor2003; Rezende et al. Reference Rezende, Albert, Fortuna and Bascompte2009; Guimerà Reference Guimerà2010) and may increase food web stability and persistence by preventing propagation of perturbations between species (Krause et al. Reference Krause, Frank, Mason, Ulanowicz and Taylor2003; Newman Reference Newman2006; Gross et al. Reference Gross, Rudolf, Levin and Dieckmann2009; Stouffer and Bascompte Reference Stouffer and Bascompte2011)
To evaluate the effects of a coordinated invasion on paleocommunity structure and functioning, Late Ordovician shallow-marine food webs from before and after the Richmondian invasion were compared. First, the potential effects of various data sources on assessments of ecosystem structure and functioning were examined by constructing food webs produced using three datasets: museum collections and fieldwork, online data repositories, and both datasets combined. Using the dataset that performed most reliably, differences in pre- and postinvasion food web structure and dynamics were then assessed, by comparing food web topology and modeling paleocommunity stability. Differences between the pre- and postinvasion food webs would corroborate previous work, suggesting that this invasion ultimately led to community reorganization, and the potential for invasions to result in long-term reductions in stability. Understanding how the establishment of non-endemic species in the geologic past affected certain marine ecosystems can provide unique insights into the consequences of anticipated immigrations and invasions expected to occur in the coming decades, particularly in the Arctic and Antarctic (Arntz et al. Reference Arntz, Thatje, Gerdes, Gili and Gutt2005; Gili et al. Reference Gili, Arntz, Palanques, Orejas, Clarke, Dayton, Isla, Teixidó, Rossi and López-González2006; Willis and Birks Reference Willis and Birks2006; Vermeij and Roopnarine Reference Vermeij and Roopnarine2008; Aronson et al. Reference Aronson, Smith, Vos, McClintock, Amsler, Moksnes, Ellis, Kaeli, Singh, Bailey, Schiferl, van Woesik, Martina, Steffel, Deal, Lazarus, Havenhan, Swalethorp, Kjellerup and Thatje2015).
Materials and Methods
Geologic Setting
During the Late Ordovician, the Cincinnati Basin of modern Ohio, Indiana, and Kentucky was located along a gently dipping carbonate ramp in a shallow (~30 m) epeiric sea (Holland Reference Holland1993), situated distal to the Taconic foreland basin, approximately 20°S (Scotese and McKerrow Reference Scotese, McKerrow, McKerrow and Scotese1990). The region consists primarily of interbedded fossiliferous limestones and shale originally divided into third-order stratigraphic sequences, C1–C6 (Holland and Patzkowsky Reference Holland, Patzkowsky, Witzke, Ludvigsen and Day1996), and more recently revised and split into eight sequences representing 7 Myr (Brett et al. Reference Brett, Aucoin, Dattilo, Freeman, Hartshorn, McLaughlin and Schwalbach2020). Here we use the revised nomenclature of Brett et al. (Reference Brett, Aucoin, Dattilo, Freeman, Hartshorn, McLaughlin and Schwalbach2020) when referring to sequences (C1–C8) (Fig. 1). Today, the region consists primarily of fossiliferous limestones and shale, and four depositional environments are widely recognized within each sequence: offshore, deep subtidal, shallow subtidal, and peritidal (Frey and Pemberton Reference Frey and Pemberton1985; Brett and Baird Reference Brett and Baird1986; Holland Reference Holland1993; Holland and Patzkowsky Reference Holland, Patzkowsky, Witzke, Ludvigsen and Day1996; Holland et al. Reference Holland, Miller, Meyer and Dattilo2001; Brett et al. Reference Brett, Malgieri, Thomka, Aucoin, Dattilo and Schwalbach2015, Reference Brett, Aucoin, Dattilo, Freeman, Hartshorn, McLaughlin and Schwalbach2020). Previous studies have argued that ecological stability (i.e., low turnover) existed throughout the C1–C3 sequences across onshore/offshore gradients, with a subsequent breakdown in the C4 sequence and gradient reestablishment in the C5–C7 sequences (Holland and Patzkowsky Reference Holland and Patzkowsky2007). The invasion is preserved in the Sunset through the Clarksville Members of the Cincinnatian Series (C4 and C5B lithostratigraphic units of Brett et al. [Reference Brett, Aucoin, Dattilo, Freeman, Hartshorn, McLaughlin and Schwalbach2020]). The invasion was a pulsed event, with the most significant phase occurring abruptly in the C5, in the Clarksville–middle Rowland Member (C5B; Brett et al. Reference Brett, Aucoin, Dattilo, Freeman, Hartshorn, McLaughlin and Schwalbach2020). Brief, unsuccessful repeated invasions occurred in the C4 sequence and resulted in the extinction of incumbent taxa (Brett et al. Reference Brett, Aucoin, Dattilo, Freeman, Hartshorn, McLaughlin and Schwalbach2020). This trend of repeated invasion corresponds with patterns in modern invasions where species are introduced multiple times before they become established (Zenni and Nunez Reference Zenni and Nunez2013; David et al. Reference David, Thébault, Anneville, Duyck, Chapuis and Loeuille2017). However, reinvasion here occurs over time frames on the order of tens of thousands of years, consistent with coordinated invasions (Stigall Reference Stigall2019). Nonnative species occupied a variety of trophic levels and included tabulate and rugosan corals, trilobites, gastropods, bivalves, brachiopods, and nautiloids (Foerste Reference Foerste1917; Holland and Patzkowsky Reference Holland and Patzkowsky2007; Stigall Reference Stigall2010). Immigrating taxa were likely transported into the basin via multiple routes within Laurentia and Baltica due to climate-related changes in ocean circulation and sea level (Patzkowsky and Holland Reference Patzkowsky and Holland1996; Holland Reference Holland, Brett and Baird1997; Stigall Reference Stigall2010; Wright and Stigall Reference Wright and Stigall2013; Lam and Stigall Reference Lam and Stigall2015; Stigall and Fine Reference Stigall and Fine2019). The processes that initiated the Richmondian invasion were in many ways similar to current oceanographic changes related to modern climate change.
Field sample localities (left) and stratigraphic framework (right). Squares correspond to preinvasion localities, circles correspond to postinvasion localities, and numbers within symbols correspond with locality information in Table 1. The dark gray area represents the extent of Ordovician rock exposed at the surface in the region. The simplified stratigraphic column is modified after Brett et al. (Reference Brett, Aucoin, Dattilo, Freeman, Hartshorn, McLaughlin and Schwalbach2020). See also Holland and Patzkowsky (Reference Holland, Patzkowsky, Witzke, Ludvigsen and Day1996).

Food webs from pre- and postinvasion paleocommunities were reconstructed. Each food web included samples from shallow and deep subtidal facies from laterally adjacent paleoenvironments: the preinvasion Fairview (C2, deep subtidal) and Bellevue (C3, shallow subtidal) Formations, and the postinvasion Liberty (C6, deep subtidal) and Whitewater (C7, shallow subtidal) Formations (Holland Reference Holland1993). The Fairview and Liberty Formations represent shallow transitional facies with approximately equal proportions of limestone and shale above fair-weather base, while the Bellevue and Whitewater Formations represent shallower, shoreface facies with greater proportions of limestone (Tobin Reference Tobin1982, Reference Tobin1986; Holland Reference Holland1993, Reference Holland, Brett and Baird1997; Holland and Patzkowsky Reference Holland, Patzkowsky, Witzke, Ludvigsen and Day1996). As these facies represent continuous shallow-marine habitats above storm wave base (<30 m), it was assumed that species within and across facies had the potential to interact, and sampling was intended to capture species occurrence data from laterally adjacent habitats on a spatial scale comparable to studies of modern shallow-marine food webs (e.g., Roopnarine and Hertog Reference Roopnarine and Hertog2013). This study aims to assemble basin-level food webs before and after the invasion in comparable depositional environments, which is achieved through the inclusion of multiple data types sampling the four formations listed. Although this approach ensures that samples from a range of localities across stratigraphic dip were employed (see “Food Web Construction”), combining data from two formations preinvasion (Fairview and Bellevue) and two postinvasion (Liberty and Whitewater) increased temporal mixing. However, the stratigraphic third-order sequences represent unconformity bounded packages of 0.5–2 Myr in duration (Brett et al. Reference Brett, Aucoin, Dattilo, Freeman, Hartshorn, McLaughlin and Schwalbach2020). Thus, combining samples from different formations nevertheless resulted in food webs that represented average trophic structure across <2 Myr, a relatively short temporal scale over which to examine generalities in trophic structure in the fossil record. Further, these represent the same suite of depositional environments, so disparities between communities are unlikely to arise as a result of abiotic change.
Food Web Construction
The potential effects of data sources on trophic structure have not yet been evaluated when reconstructing fossil food webs, and the inclusion or omission of key species could bias reconstructions of trophic relationships. Therefore, changes in food web structure and functioning across the invasion were first compared using six food webs constructed using the following types of data: (1) species lists downloaded from the Paleobiology Database (PBDB; www.paleobiodb.org), (2) species lists compiled from museum collections and field-collected material (referred to as “specimen-based data”), and (3) a combined species list assembled using both the PBDB and specimen-based sources. Pre- and postinvasion food webs were constructed using each of the three data types, and food web structure and functioning were compared across the invasion to determine how each data type performed. If all three data sources yield comparable food webs and consistent paleocommunity structure and functioning across the invasion, then the choice of data source may not significantly affect trophic structure in paleo–food web reconstructions. However, food webs representing the same paleocommunity, but constructed using different data sources, may exhibit disparities in structure and/or dynamics. Species occurrence data from online repositories such as the PBDB, which archive data from scientific publications, may differ in temporal or spatial scope and resolution relative to datasets compiled by individual researchers (Alroy Reference Alroy2003).
To construct pre- and postinvasion food webs for each data set, six species lists were assembled. Species lists were downloaded from the PBDB for each formation (downloaded July 2016) and combined to form one pre- and one postinvasion dataset. Similarly, pre- and postinvasion species lists were obtained from nine museum collections and field sampling. Museum data were obtained from the University of Cincinnati's Invertebrate Paleontology collection and the Miami University Karl E. Limper Museum Invertebrate Paleontology collection. Additional museum collection data were downloaded via the iDigBio specimen portal (downloaded March 2017) from the Harvard Museum of Natural History, the Oklahoma Museum of Natural History, Kansas University Biodiversity Institute and Natural History Museum, the Smithsonian National Museum of Natural History, the Florida Museum of Natural History, University of Central Missouri, and the North Carolina Museum of Natural Sciences. Museum data were augmented with field sampling to increase the proportion of species with controlled metadata (e.g., geographic location and formation) and unbiased collecting. Field samples consisted of both bulk and targeted surficial sampling. Bulk sampling resulted in the collection of ~38 L from each of 14 field localities throughout the Cincinnati region, seven preinvasion and seven postinvasion (Fig. 1). At six of these localities, two formations were present, and thus both were sampled, resulting in a total of 20 samples pre- and postinvasion, respectively, totaling ~757 L of sediment (Table 1). Samples were wet-sieved (1-mm mesh) and air dried, and macrofossils were identified to the lowest taxonomic level (typically species) using various sources (Feldman and Hackathorn Reference Feldman and Hackathorn1996; Davis and Meyer Reference Davis and Meyer2009), yielding a total of 5867 identified specimens. Bryozoans from field sampling were not included, as species identifications require thin sections.
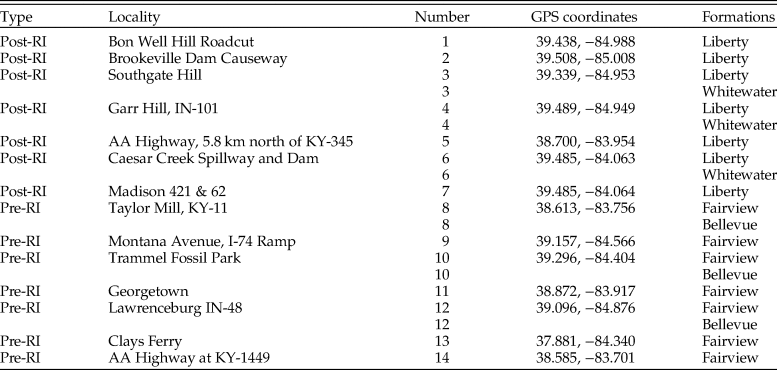
GPS coordinates for all field localities. Coordinates are in degrees. RI, Richmondian invasion. Numbers correspond to localities in Fig. 1.
To assemble the six food webs, for each species list, species were aggregated into trophic guilds (Dryad doi: https://doi.org/10.25338/B8T31B). Interactions between these guilds were inferred using extensive literature surveys of species life mode, feeding habits, functional morphology (e.g., feeding apparatus), habitat, species associations, and living analogue species (Steineck and Casey Reference Steineck, Casey and Capriulo1990; Frey Reference Frey1995; Fortey and Owens Reference Fortey and Owens1999; Williams et al. Reference Williams, Carlson, Brunton and Williams2000; Rezende et al. Reference Rezende, Albert, Fortuna and Bascompte2009; Arapov Reference Arapov2010; Bush and Bambach Reference Bush and Bambach2011; Stigall Reference Stigall2015). Trophic interactions have been similarly inferred in paleocommunities elsewhere (Dunne et al. Reference Dunne, Williams, Martinez, Wood and Erwin2008, Reference Dunne, Labandeira and Williams2014; Roopnarine et al. Reference Roopnarine, Angielczyk, Wang and Hertog2007; Mitchell et al. Reference Mitchell, Roopnarine and Angielczyk2012; Roopnarine Reference Roopnarine, Dietl and Flessa2018; Roopnarine and Dineen Reference Roopnarine, Dineen, Tyler and Schneider2018). As the methodology for species aggregation into trophic guilds is consistent across pre- and postinvasion food webs, as are the types of organisms, any dissimilarities between the food webs should result from differences in species occurrences and structural differences between food webs. These trophic guild food webs are in some ways comparable to cumulative food webs, which are widely used to examine food web structure (Stouffer et al. Reference Stouffer, Camacho, Guimerà, Ng and Amaral2005; Dunne et al. Reference Dunne, Williams, Martinez, Wood and Erwin2008).
Food Web Structure
The structure of pre- and postinvasion food webs was compared between data types and across the invasion to assess differences between data sources and identify changes in paleocommunity structure due to the invasion. If immigrating species occupied the same trophic guilds as incumbents, either outcompeting incumbents, or coexisting in unsaturated niche space, little change in the number and distribution of trophic guilds and guild interactions should occur. If new species succeeded in unoccupied niche space (adding guilds) or led to the local extinction of incumbents (reducing guilds), functional richness and the number of trophic guild interactions may either increase or decrease respectively. Note that changes in the number of species would not necessarily correspond to changes in the number of trophic guilds and/or interactions, that is, species richness can increase without resulting in an increase in functional richness. Changes in guild richness may also alter the trophic distribution of guilds (their energetic position in a food web) via the addition or loss of guilds at various trophic positions. Generalities in food web structure were therefore calculated using graph theory to quantitatively compare pre- and postinvasion food web structures. Descriptive metrics including the number of trophic guilds, network trophic position (ntp), and number of trophic links (consumer–resource interactions between guilds) were calculated to quantify species’ hierarchical position within food webs. Trophic position describes the number of intermediaries between basal organisms and predators in a food web (Pimm and Lawton Reference Pimm and Lawton1978). Here we quantify the position of guilds in the food web, using network trophic position (ntp), the average shortest distance to a primary producer guild calculated as:
 $${\rm nt}{\rm p}_i = 2 + \displaystyle{1 \over {r_i}}\mathop \sum \nolimits_{\,j = 1}^S a_{ij}\lpar {l_j} \rpar \comma \;$$
where trophic position is calculated for trophic guild i; ri is the number of consumer guilds; S is the number of trophic guilds in the food web; variable aij is either 0 or 1, where 1 indicates that guild i preys upon guild j; and lj is the length of the shortest path of guild j to a primary producer guild (Roopnarine and Dineen Reference Roopnarine, Dineen, Tyler and Schneider2018). Descriptive metrics were calculated using custom code written by C.L.T. in R v. 3.3.1 employing the igraph package (Csárdi and Nepusz Reference Csárdi and Nepusz2006; Kones et al. Reference Kones, Soetaert, van Oevelen and Owino2009; Hudson et al. Reference Hudson, Emerson, Jenkins, Layer, Ledger, Pichler, Thompson, O'Gorman, Woodward and Reuman2013; R Development Core Team 2013), and ntp was calculated using custom code written by P.D.R. in Julia (Bezanson et al. Reference Bezanson, Edelman, Karpinski and Shah2017). The ntp distributions were compared using a Kruskal-Wallis test in R.
Groups of guilds with more mutual interactions than expected form compartments, or modules (Gross et al. Reference Gross, Rudolf, Levin and Dieckmann2009; Stouffer and Bascompte Reference Stouffer and Bascompte2011). The propagation of secondary extinction across modules may be reduced if a community is more compartmentalized, thereby increasing stability (Krause et al. Reference Krause, Frank, Mason, Ulanowicz and Taylor2003; Newman Reference Newman2006; Gross et al. Reference Gross, Rudolf, Levin and Dieckmann2009; Stouffer and Bascompte Reference Stouffer and Bascompte2011). The number and size of compartments may be altered by changes in trophic organization, as well as the strength of compartmentalization (referred to as modularity). Larger proportions of generalist species may lead to a fusion of modules and a more cohesive network (Olesen et al. Reference Olesen, Bascompte, Dupont and Jordano2007; Padrón et al. Reference Padrón, Traveset, Briedenweg, Díaz, Nogales and Olesen2009; Albrecht et al. Reference Albrecht, Padrón, Bartomeus and Traveset2014). If many invaders were generalists (Marvier et al. Reference Marvier, Kareiva and Neubert2004; Stigall Reference Stigall2010, Reference Stigall2012; Malizia and Stigall Reference Malizia and Stigall2011), the postinvasion food web would have had fewer modules and therefore would be less stable. After the invasion, we would also expect an increase in modularity if the number and strength of species interactions increased, that is, greater competition between species utilizing similar resources (Pascual and Dunne Reference Pascual and Dunne2006). Calculating and interpreting modularity is feasible, because fossil food webs have been found to reliably record guild richness and evenness, trophic-level distribution, predator dietary breadth, food chain lengths, and modularity despite the preferential loss of soft-bodied taxa to poor preservation (i.e., reductions in species richness, and the number of interactions) (Roopnarine and Dineen Reference Roopnarine, Dineen, Tyler and Schneider2018). Hierarchical clustering community detection methods were used to identify natural divisions within the food web into compartments (Newman Reference Newman2006). The number of modules and modularity were calculated using the Louvain algorithm, which finds community structure by multilevel optimization of modularity (Blondel et al. Reference Blondel, Guillaume, Lambiotte and Lefebvre2008).
As higher trophic positions are often represented by rare species, if either the PBDB or specimen-based data sources produce a larger species pool, the likelihood of including more species at higher trophic positions would be greater (Alroy Reference Alroy2003). The size of the species pool derived from the PBDB could be affected in various ways. A greater number of species in the PBDB may be subject to outdated taxonomic identifications or “lumping” of taxa, reducing richness (Prothero Reference Prothero2015). For example, in some taxonomic groups identification to the species level may be particularly challenging, leading to the use of higher levels of taxonomic classification. Bryozoans, for example, require thin sections and extensive experience to identify to the species level. Alternatively, in cases where samples entered into the PBDB were collected, identified, and verified by taxonomic experts, these data may be accurate (Alroy Reference Alroy2003). However, outdated taxonomic classifications, incorrect geographic data, and missing key species, attributed to outdated identification or classifications employed during data entry, a lack of filters for taxonomic wastebasket terms, and transcription errors, are also likely to be present in the PBDB (Prothero Reference Prothero2015). The pervasiveness of these errors may be difficult to assess across taxonomic groups (Prothero Reference Prothero2015). In museum collections, taxonomic classifications that are well maintained and frequently updated may be more reliable, for example, at institutions with strong research backgrounds for the taxa, region, or geologic intervals represented (Ponder et al. Reference Ponder, Carter, Flemons and Chapman2001). However, collections can be biased toward higher-quality specimens intended for display or taxonomic description and identification, potentially omitting poorly preserved taxa or taxa already highly abundant in the collection, depressing species richness for a locality or region (Alroy Reference Alroy2002). Paleocommunities assembled through fieldwork and/or museum collections can also be biased by the taxonomic expertise of the collectors, concentrating collection efforts to portions of the paleocommunity or increasing the accuracy of species identification for some groups. Therefore, differences between food webs may arise due to the resulting differences in the trophic distribution of richness.
Species-Level Food Web Modeling
We hypothesized that preinvasion food webs would be more stable and resistant to collapse, as the community represented a purportedly stable system before disturbance and potential community reorganization (Holland and Patzkowsky Reference Holland and Patzkowsky2007). However, if the invasion altered food web structure, changes in stability may have resulted. Studies of the structural organization of detritus-based ecosystems, such as those of the Late Ordovician, are rare, and our understanding of the dynamics of detritus-based ecosystems and their responses to perturbation remains limited (but see Tavares-Cromar and Williams Reference Tavares-Cromar and Williams1996; Hildrew Reference Hildrew2009; Calizza et al. Reference Calizza, Costantini and Rossi2015). Empirical studies have shown that detritus is a consistent and readily available resource compared with phytoplankton (Moore et al. Reference Moore, Berlow, Coleman, De Suiter, Dong, Hastings, Johnson, McCann, Melville, Morin, Nadelhoffer, Rosemond, Post, Sabo, Scow, Vanni and Wall2004), and more realized trophic pathways to top predators exist in benthic food webs that derive energy from detrital basal resources (i.e., they show greater architectural complexity) (Raffaelli et al. Reference Raffaelli, Bell, Weithoff, Matsumoto, Cruz-Motta, Kershaw, Parker, Parry and Jones2003). Detritus-based food chains are thus thought to be important in stabilizing food webs, performing key functional roles (Moore et al. Reference Moore, Berlow, Coleman, De Suiter, Dong, Hastings, Johnson, McCann, Melville, Morin, Nadelhoffer, Rosemond, Post, Sabo, Scow, Vanni and Wall2004; Costantini and Rossi Reference Costantini and Rossi2010; Rooney and McCann Reference Rooney and McCann2012). Therefore, when detritus chains are affected by perturbations, the potential for indirect effects and trophic cascades is likely to be high. Here we assess stability and paleocommunity dynamics using the cascading extinction on graphs (CEG) model, designed specifically to take into account uncertainty in paleontological community data (see Roopnarine Reference Roopnarine2006, Reference Roopnarine2010, Reference Roopnarine, Dietl and Flessa2018). A paleocommunity's trophic structure, although accurate, can never be precisely specified by a single topology (Roopnarine Reference Roopnarine2006, Reference Roopnarine2010, Reference Roopnarine, Dietl and Flessa2018; Roopnarine and Dineen Reference Roopnarine, Dineen, Tyler and Schneider2018), because no food web reconstruction (modern or fossil) can capture all species interactions. Therefore, CEG stochastically generates species-level food webs by randomly and repeatedly drawing species from the trophic guilds and assigning them as predators and prey within the constraints of the trophic guild food web assembled as described earlier. Each species-level food web is a hypothesized representation of the paleocommunity, and each species is constrained to the potential interactions for its guild, as specified by the guild-level food web. For each species-level food web, CEG then employs a form of deletion stability modeling by removing increasing increments of primary producers, initiating trophic cascades of secondary extinctions that propagate through the food web. Primary productivity was modeled as a function of the density of herbivorous interactions (Angielczyk et al. Reference Angielczyk, Roopnarine and Wang2005; Roopnarine Reference Roopnarine2006; Roopnarine et al. Reference Roopnarine, Angielczyk, Wang and Hertog2007), scaling productivity as 10 times that of herbivore richness in accordance with general assimilation efficiency between tropic levels. Although there was a period of rapid planktonic diversification throughout the Ordovician (Servais et al. Reference Servais, Perrier, Danelian, Klug, Martin, Munnecke, Nowak, Nützelg, Vandenbroucke, Williams and Rasmussen2016), autotrophic phytoplankton were grouped into one guild based on predator–prey relationships that remain similar across genera, as the data available were not sufficient to distinguish them.
One hundred species-level food webs were stochastically generated for each of the six paleocommunities, three preinvasion and three postinvasion, yielding average community responses to simulated perturbations for each food web. Model responses to simulated perturbations were then compared to evaluate differences in stability and resistance to the propagation of secondary extinction between paleocommunities. If the specimen-based data included fewer species from higher trophic levels relative to the PBDB, specimen-based models may have relatively lower stability and resistance. Alternatively, specimen-based data may yield higher richness relative to the PBDB, if the number of species in the PBDB is reduced by outdated taxonomic identifications and “lumping” of taxa (Prothero Reference Prothero2015). If this is the case, specimen-based models may have greater stability and resistance relative to the PBDB data models. Differences between pre- and postinvasion stability and resistance would also suggest trophic restructuring occurred, altering paleocommunity stability. Collapse thresholds are marked by a dramatic increase in secondary extinction and were compared between communities to examine resistance to the propagation of secondary extinction, with higher perturbation thresholds associated with more robust communities. Collapse thresholds were calculated using the R package changepoint, in which statistical changes in the data sequence were detected implementing the pruned exact linear time, or PELT, algorithm (Killick and Eckley Reference Killick and Eckley2014). The changepoint value was identified for each of the 100 species-level food webs, and differences in the mean perturbation magnitude at which the pre- and postinvasion collapse thresholds occurred were evaluated using a t-test. In addition, variability in trophic cascades—the range of secondary extinction observed for each perturbation threshold—was used to assess relative stability. Highly variable responses to perturbations suggest sensitive community arrangements that facilitate a wide range of responses to perturbations. Differences in variability between models were assessed using the coefficient of variation, which was calculated for each simulation. The coefficients were then statistically compared using a Kruskal-Wallis test. Here we define “resistance” as the fraction of a community that persists after perturbation and subsequent secondary extinctions in CEG, that is, more-resistant communities have lower proportions of secondary extinction overall in response to repeated perturbation. Higher stability would therefore lead to a relatively narrower range of secondary extinction values for each perturbation magnitude.
Results
Food Web Structure
The PBDB data included 159 species (n = 2471) preinvasion versus 268 species (n = 3221) in the specimen-based data (Table 2). The PBDB data included 133 species (n = 3050) postinvasion relative to 197 species (n = 4858) in the specimen-based data. All species from field collections were present in museum collections, and 45% of species in museum collections were also present in field collections preinvasion, and 72% postinvasion. Similarly, the PBDB and specimen-based data shared high percentages of species, with 63% of the preinvasion species and 85% of the postinvasion species present in both datasets.
Sample sizes from various data sources. N represents abundance; % Shared species refers to the percentage shared between the specimen-based (SB) and Paleobiology Database (PBDB) subsets. For example, in the preinvasion data 100% of the species from field samples and 45% of the species in museum collections were present in the PBDB data subset, while 63% of the species in the PBDB subset were also present in the combined museum and field subset. The richness of the specimen-based and PBDB subsets do not sum to the combined richness, due to shared species.

Changes in food web structure across the invasion varied depending on the data source (Table 3). In the PBDB food web, the number of guilds decreased from 23 to 21, while in the specimen-based food web, the number of trophic guilds increased after the invasion from 20 to 21. However, both food webs contained identical guilds postinvasion (Fig. 2). The number of links (i.e., interactions) decreased in the PBDB food web from 63 to 56 and increased in the specimen-based food web from 54 to 56. There were three modules in food webs for both data subsets, thus compartmentalization was consistent, and modularity increased postinvasion for both (Table 3). Maximum ntp increased marginally across the invasion in food webs for both data sources, from 3.6 to 3.7, and mean ntp decreased from 2.0 to 1.8. The ntp values were not significantly different between the specimen-based and PBDB food webs in either the pre- or postinvasion intervals (χ2 = 0.001, p = 0.96, and χ2 = 0, p = 1, respectively). The PBDB subset included fewer total species, but richness was lower predominantly in intermediate trophic levels relative to the specimen-based dataset, at or near ntp 2.5 both pre- and postinvasion (Fig. 3).
Food webs. Trophic guild food webs for the preinvasion paleocommunity (A) and postinvasion paleocommunity (B). Circles are trophic guilds, connected by gray lines representing consumer–resource interactions. Images in circles represent the most diverse clade within that guild and are not the only type of organisms in any given guild. Trophic guilds are arranged by module (compartment) along the x-axis, and increasing network trophic position (ntp) along the y-axis, and color intensity indicates increasing species richness within guilds. Guild names are abbreviated as follows: Pred = predator; SFd = suspension feeder; Om zoopl = omnivorous micro-zooplankton; Detvr = detritivore; Gzr = grazer; Photoaut = photoautotroph. Roman numerals following guild names indicate similar types of functional guilds with distinct interactions (i.e., although functionally similar, guilds could not be aggregated due to different consumer–resource relationships). Guilds outlined in red are present preinvasion, but absent postinvasion, and the guild outlined in green is unique to the postinvasion food web. Links between trophic guilds are orange if they are linked directly to detritus, and there is a decrease in the number of guilds linked to detritus in the postinvasion food web. N Sp, number of species.

Trophic distribution of richness. The number of species per guild relative to the guild network trophic position (ntp) for the combined preinvasion (A) and postinvasion (B), specimen-based preinvasion (C) and specimen-based postinvasion (D), and Paleobiology Database (PBDB) preinvasion (E) and PBDB postinvasion (F) datasets. In all food webs, richness was highest at intermediate ntp values. Richness in the PBDB data subset was lower overall, and the reduction in species was concentrated at ntp 2.5.

Food web structure. Metrics describing food web structure before and after the invasion for all data and data subsets. Significant changes in species richness, guild richness, and the number of modules were observed pre- and postinvasion. However, consistent network trophic position (ntp) distribution, and modularity suggest that overall ecosystem structure did not change drastically after the invasion. Different data sources produced somewhat different quantitative metrics of food web structure, and relative changes across the invasion were inconsistent. For example, for food webs constructed using all data combined or the Paleobiology Database (PBDB), the number of guilds decreases postinvasion, while using only the specimen-based data increases the number of guilds by one. RI, Richmondian invasion.

In food webs assembled using the combined dataset, including all data sources, species richness decreased after the invasion from 358 preinvasion to 241, with only 67 shared species (Table 2). Similarly, the number of trophic guilds (pre 24; post 21), trophic links (pre 64; post 55), and modules (4 pre; 3 post) all decreased (Table 3, Fig. 2). In contrast, modularity increased moderately from 0.31 to 0.32 after the invasion. Maximum ntp values for pre- and postinvasion communities ranged from 3.6 to 3.8, average ntp decreased moderately from 2.13 to 1.90 and differed significantly (χ2 = 18, p = 0.02). Richness was predominantly concentrated in suspension-feeding guilds at intermediate trophic levels (ntp ~ 2.5). Four guilds present in the preinvasion paleocommunities were absent postinvasion (Fig. 2), each of which contained only a single species: Detritivore II (polychaete), Grazer I (polychaete), Suspension Feeder II (polychaete), and Suspension Feeder VII (filter-feeding trilobite); however, one new guild appeared postinvasion, Predator VII (eurypterid). Three of these guilds were linked directly to detritus, thus their loss led to the postinvasion being reduced from eight to five detrital chains (Fig. 2).
Species-Level Food Web Modeling
CEG models employing the specimen-based data were consistent with models using the combined datasets, producing comparable results across the invasion. Simulations in both sets of models responded uniformly to perturbations with low variability in secondary extinction at all perturbation levels and comparable collapse thresholds (Fig. 4). However, models utilizing the PBDB subset differed substantially. Although the preinvasion model response was relatively consistent with the specimen-based data, the postinvasion PBDB models exhibited highly variable reactions to perturbation (Fig. 5), with high variation that differed significantly (χ2 = 548.53, p << 0.001) among individual simulations, reaching up to 60% secondary extinction before reaching a less pronounced collapse threshold. The mean collapse threshold identified by the changepoint analysis differed significantly pre- and postinvasion in the specimen-based data (t = −26, p << 0.001); however, changepoint was unable to identify a collapse threshold in the postinvasion PBDB data due to the sigmoidal shape of the curve.
Cascading extinction on graphs (CEG) models. A, The full dataset; B, the specimen-based data subset; and C, the Paleobiology Database (PBDB) data subset. Shaded regions encompass the range of individual permutations of the perturbation of 100 stochastically generated species-level food webs, with dark lines denoting the mean. Dashed lines indicate the preinvasion collapse threshold in each graph. In the full dataset (A), the postinvasion community threshold of collapse typically occurred at lower perturbation magnitudes relative to the preinvasion, and total collapse occurred less frequently. Overall, both communities appear relatively stable, with well-constrained ranges of secondary extinction. However, the postinvasion has a wider range of secondary extinctions, suggesting lower stability. When data were restricted to the specimen-based subset (B), variation in model responses increased, and the collapse threshold occurred at lower perturbation magnitudes in the preinvasion (a reversal from the full dataset). The PBDB subset models (C) yielded relatively consistent responses and mean collapse threshold in the preinvasion, but dramatically increased variability in secondary extinction cascades and a less pronounced collapse threshold signal were observed postinvasion.

Variation in simulated secondary extinction. The median of the coefficient of variation for each simulation is higher postinvasion for the combined dataset (pre- and postinvasion), and differs significantly (χ2 = 203.83, p << 0.001). The range is greater in the postinvasion models for all three datasets, and is largest in the Paleobiology Database (PBDB) data subsets.

The threshold of collapse (i.e., a dramatic increase in secondary extinction) for our full-dataset CEG analysis was reached at a mean perturbation magnitude of 0.68 and 0.66 in the pre- and postinvasion paleocommunities, respectively (Fig. 4), and this difference was significant (t = 33.4, p << 0.001). Overall, CEG models exhibited a uniform response to perturbation among species-level food webs (Fig. 4). However, the postinvasion community appeared to be less stable and exhibited greater variability in species-level food web responses (Fig. 5) with significantly higher mean coefficients of variation (χ2 = 203.83, p << 0.001) relative to the preinvasion community.
Discussion
Comparisons of Data Sources: Specimen-based versus PBDB
Specimen-based data yielded higher richness relative to the PBDB, which could be due to differences in collection methods or data quantity or quality. However, differences in species occurrence lists resulted in only minor changes in guild food web structure. Although the absolute values differed between data sources, the relative change across the invasion was consistent. For example, the strength of the division into compartments (i.e., modularity) increased, and the average ntp increased slightly in all three postinvasion food webs. Given the consistency between metrics quantifying food web structure, such as the number of modules, modularity, and trophic levels, either data type could be appropriate for studies utilizing these analyses to assess paleocommunity structure. As museum collections become increasingly digitized, both collections and digital data repositories may be widely available to researchers interested in the application of food webs to understanding changes in ecosystem functioning. The addition of systematically collected field samples also did not contribute novel species (all 59 species from field samples were present in both museum collections and the PBDB), and substantial efforts over multiple field seasons would be necessary to document rare taxa, typical of higher trophic levels. Museum collections with a strong regional focus including a breadth of taxa and rare specimens thus serve as a valuable resource for trophic reconstructions.
In contrast to the comparisons of trophic structure, the specimen-based and PBDB data subsets produced different modeled paleocommunity dynamics. The specimen-based dataset produced model responses that were overall more similar to the full dataset, while the PBDB subset yielded highly unstable dynamics in the postinvasion CEG models, suggesting spurious model volatility introduced by missing influential guilds and/or species. Although the larger community structure was relatively consistent for both data subsets, the stochastic generation of species-level food webs produced highly divergent CEG model outcomes, that is, paleocommunity dynamics. Overall, the PBDB data yielded less stable paleocommunities, indicated by highly variable ranges in the proportions of secondary extinction and by a postinvasion switch from an exponential to logistic collapse curve. The higher richness of the specimen-based subset relative to the PBDB subset was important for modeling community dynamics, particularly with regard to reduced richness of guilds at intermediate trophic levels. In addition, subsetting the data led to the omission of several guilds. Their absence may also have made the food web more susceptible to trophic cascades in the CEG models. These differences suggest that datasets including substantial contributions from fieldwork and/or museum collections may be relatively better suited to analyses of trophic organization and paleocommunity dynamics. Further, data from online repositories, such as the PBDB, should be supplemented with additional data sources to ensure the highest available representation of species at all trophic levels. Additional studies of differences in trophic distributions across data types from other time periods and locations are necessary to assess the pervasiveness of potential data type disparities.
Differences in the results of the comparative species-level food web modeling between datasets suggest that influential species and/or guilds were missing from the PBDB dataset, producing highly volatile model responses. In addition, the combined data provided results consistent with the specimen-based analysis and included the largest taxonomic list, and thus captured a more comprehensive biotic suite (i.e., the maximum representation of functional diversity and trophic positions). Therefore, we limit our discussion of the potential effects of invasion on paleocommunity structure and dynamics to the results derived from the combined dataset.
Food Web Structure
The combined dataset suggests substantial species turnover (replacement of 291 species) and an overall decrease in richness postinvasion of 117 species that resulted in a reduction of functional richness and the loss of four guilds (Table 3, Fig. 2). However, average ntp and modularity did not differ significantly after the invasion, suggesting remarkably consistent trophic organization across the invasion despite these losses. The arrival of new taxa did not equate to an increase in the number or types of interactions between trophic guilds. This departs from studies that have suggested that the invasion increased biodiversity (Patzkowsky and Holland Reference Patzkowsky and Holland1996, Reference Patzkowsky and Holland2007; Holland and Patzkowsky Reference Holland and Patzkowsky2007) and resulted in community reorganization (Holland and Patzkowsky Reference Holland and Patzkowsky2007; Stigall Reference Stigall2010). Here, we document a decrease in richness in the Richmondian stage postinvasion paleocommunity, with profound species turnover corresponding to functional homogenization (loss of guilds). Interestingly, the postinvasion non-endemic species occupied almost all of the preexisting functional guilds from the preinvasion community. One guild is unique to the postinvasion food web, which consists of the eurypterid genus Megalograptus. This is consistent with previous reports of Megalograptus only occurring in the upper Cincinnatian (e.g., Alexander Reference Alexander1986; Frey Reference Frey1989; Tetlie Reference Tetlie2007). Although the Cincinnatian strata have been extensively sampled (e.g., Patzkowsky and Holland Reference Patzkowsky and Holland1996, Reference Patzkowsky and Holland2007; Holland et al. Reference Holland, Miller, Meyer and Dattilo2001; Holland and Patzkowsky Reference Holland and Patzkowsky2007; Holland Reference Holland, McLaughlin, Brett, Holland and Storrs2008), and our dataset represents, to our knowledge, the largest compilation of museum collections and published reports of pre- and postinvasion paleocommunities, it is nevertheless possible that the apparent arrival of Megalograptus is an artifact of the rarity of eurypterid fossils in the region during the Late Ordovician or a preservation bias relating to differences in lithologies and does not represent a new postinvasion functional group.
Previous studies on the invasion have argued that generalists occupying larger geographic areas preferentially survived the invasion (Marvier et al. Reference Marvier, Kareiva and Neubert2004; Malizia and Stigall Reference Malizia and Stigall2011; Stigall Reference Stigall2012). Empirical results in plant-pollination food webs have shown that greater proportions of generalists can lead to a more cohesive network (Olesen et al. Reference Olesen, Bascompte, Dupont and Jordano2007; Albrecht et al. Reference Albrecht, Padrón, Bartomeus and Traveset2014), and thus loss of modules. Therefore, based on previous observations, we predicted that if many new taxa were generalists, the postinvasion food web would have fewer modules and therefore would be less stable (Stouffer and Bascompte Reference Stouffer and Bascompte2011). The minor decrease in stability in the postinvasion CEG models and the reduction of modules may therefore be due to an increase in generalism postinvasion. Additional studies directly assessing changes in the proportion of generalist taxa across the invasion are, however, necessary to test this hypothesis.
Species-Level Food Web Modeling
Despite the loss of species and functional groups, only minor differences were observed in the paleocommunity dynamics modeled here. A small, but significant amount of destabilization occurred, and greater sensitivity to perturbation was observed postinvasion. This was likely caused by the loss of species richness, one module, three detritivore guilds, or some combination thereof. Although compartmentalization is thought to stabilize food webs (Stouffer and Bascompte Reference Stouffer and Bascompte2011), and the loss of one module postinvasion could have led to destabilization, that relationship was not clearly observed. Given the overall consistency in dynamics across the invasion, our species-level food web models suggest that conservation and ecosystem management may need to focus on preventing functional homogenization, as stability was not greatly reduced despite the loss of 117 species. If functional richness plays a critical role in ecosystem resistance on evolutionary timescales, additional investigation of the Richmondian invasion could provide unique insight into the consequences of anticipated asymmetric invasions expected to occur in the coming century. Paleozoic benthic marine ecosystems were in many ways functionally analogous to modern Arctic and Antarctic benthic marine ecosystems; they were dominated by suspension feeders and lacked durophagous predators (Aronson et al. Reference Aronson, Blake and Oji2001, Reference Aronson, Thatje, Clarke, Peck, Blake, Wilga and Seibel2007; Arntz et al. Reference Arntz, Thatje, Gerdes, Gili and Gutt2005; Gili et al. Reference Gili, Arntz, Palanques, Orejas, Clarke, Dayton, Isla, Teixidó, Rossi and López-González2006). Arctic and Antarctic communities are expected to undergo widespread invasions and community change in the near future with rising ocean temperatures, particularly by bathyal crustaceans (Frenot et al. Reference Frenot, Chown, Whinam, Selkirk, Convey, Skotnicki and Bergstrom2005; Aronson et al. Reference Aronson, Thatje, Clarke, Peck, Blake, Wilga and Seibel2007, Reference Aronson, Smith, Vos, McClintock, Amsler, Moksnes, Ellis, Kaeli, Singh, Bailey, Schiferl, van Woesik, Martina, Steffel, Deal, Lazarus, Havenhan, Swalethorp, Kjellerup and Thatje2015; Doney et al. Reference Doney, Ruckelshaus, Duffy, Barry, Chan, English, Galindo, Grebmeier, Hollowed, Knowlton, Polovina, Rabalais, Sydeman and Talley2012; Smith et al. Reference Smith, Aronson, Steffel, Amsler, Thatje, Singh, Anderson, Brothers, Brown, Ellis, Havenhand, James, Moksnes, Randolph, Sayre-McCord and McClintock2017) and elasmobranchs (MacNeil et al. Reference MacNeil, McMeans, Hussey, Vecsei, Svavarsson, Kovacs, Lydersen, Treble, Skomal, Ramsey and Fisk2012; Campana et al. Reference Campana, Fisk and Klimley2013). Although anticipated invasions may alter food webs, overall ecosystem stability may not change dramatically if functional richness is preserved.
Conclusions
The results of the specimen-based data analyses most closely tracked our full dataset. However, modeling of ecosystem dynamics resulted in variable outcomes depending on the data type used, highlighting problems associated with utilizing only subsets of all available data for paleo–food web reconstructions and suggesting that museum collections may be more suitable for fossil food web reconstructions than online data repositories. Additional empirical studies are necessary to reveal specific mechanisms that promote resistance at different scales of data collection. Pre- and postinvasion food webs consisted of remarkably consistent trophic organization despite high species turnover, and the Richmondian invasion resulted in only minor changes in paleocommunity structure, including functional homogenization and a decrease in the number of subcommunities (modules). However, these structural differences were sufficient to result in a small, but statistically significant, loss of stability. Therefore, modern ecosystems could be at risk of substantial destabilization in cases where dramatic functional homogenization occurs, pointing toward the preservation of functional diversity over species diversity in conservation and ecosystem management.
Acknowledgments
We thank the Paleontological Society, the Cincinnati Dry Dredgers, and Miami University for financial support. Further, we thank B. Hunda from the University of Cincinnati and K. Hauer from Miami University for access to museum collections, C. Brett for meaningful discussions regarding Cincinnatian stratigraphy and crinoid identifications, A. Stigall for a thoughtful review and discussions on Late Ordovician paleoecology, B. Datillo for a thoughtful and constructive review of the article, and the Ordovician Atlas of Life (ordovicianatlas.org). This research was funded by a National Science Foundation CAREER grant to C.L.T. (EAR-1848232).


 Open access