


Increasing replacement of fish oil (FO) with vegetable oils (VO) in aquafeeds is now common due to limited availability of FO worldwide. VO are completely lacking in the LC PUFA (EPA, 20 : 5n-3; DHA, 22 : 6n-3; arachidonic acid, 20 : 4n-6, ARA) considered essential for Atlantic salmon (Salmo salar)(Reference Rosenlund, Torstensen and Stubhaug1), but are rich in their 18-carbon precursors α-linolenic acid (18 : 3n-3) and linoleic acid (18 : 2n-6)(Reference Sissener2). Furthermore, VO usually contain much more 18 : 2n-6 than 18 : 3n-3, leading to a very different n-6:n-3 fatty acids (FA) ratio than in FO (n-6:n-3 FA ratio of rapeseed oil is 2·9, while it in capelin oil is 0·07(Reference Sissener, Torstensen and Ruyter3)). Including VO in fish feed at the expense of FO therefore greatly affects the dietary content of the essential long-chain PUFA, as well as leading to considerable changes in the n-6:n-3 FA ratio of the feed. Multiple trials have shown that partially replacing FO with oils of non-marine origin can be done without reducing growth for salmonids(Reference Torstensen, Bell and Rosenlund4–Reference Stubhaug, Lie and Torstensen8), provided that minimum requirements of nutrients are still covered. FA profiles in tissues of Atlantic salmon are, however, influenced by dietary FA composition and often reflect dietary differences in FA(Reference Sissener2,Reference Bou, Berge and Baeverfjord9) . An increasing dietary concentration of n-6 FA will cause increased tissue level of these FA(Reference Dernekbaşı, Murat and Alagil10–Reference Sissener, Sanden and Torstensen14), while decreasing dietary n-3 FA causes decreased tissue levels(Reference Rosenlund, Torstensen and Stubhaug1,Reference Sissener, Waagbø and Rosenlund15) . However, as most previous studies have replaced FO with VO, thus increasing n-6 FA and decreasing n-3 FA at the same time, it is hard to conclude on how dietary n-6 FA affect tissue incorporation of n-3 FA, and whether the absolute amounts of these FA or the ratio between them are the most important in determining tissue FA composition.
Feeding the freshwater fish Murray cod (Maccullochella peelii, Mitchell 1838) diets with 18 : 3n-3 and 18 : 2n-6 at a ratio of 1:1 combined with varying the absolute content of these FA showed that absolute levels played a vital role in the FA metabolism (β-oxidation, Δ6-desaturase activity)(Reference Francis, Peters and Turchini16). A follow-up study kept the absolute content of the sum of 18 : 2n-6 + 18 : 3n-3 constant, while changing the ratio between the two. Fillet FA profile was clearly impacted by dietary ratio, with higher dietary 18 : 3n-3/18 : 2n-6 ratio being reflected in the fillet and resulting in higher EPA and DHA levels(Reference Senadheera, Turchini and Thanuthong17). These trials demonstrate that both ratio and absolute levels can influence the final FA make up but does not reveal which of the two matters more.
Based on several studies using VO in aquafeeds, there are some indications of an increased requirement of EPA and DHA for Atlantic salmon with higher dietary proportions of n-6 FA (pers. Comm N. Sissener). That changes in the concentration of one FA can affect the requirement of another FA has been shown in other species, like the freshwater fish Eurasian Perch (Perca fluviatilis Linnaeus 1758), where excessive dietary 18 : 2n-6 caused an apparent deficiency of 18 : 3n-3(Reference Blanchard, Makombu and Kestemont18). Senadheera et al. (Reference Senadheera, Turchini and Thanuthong17) found that for Murray cod, a freshwater fish, increasing the dietary 18 : 2n-6 with constant EPA, and DHA had a negative effect on EPA and DHA tissue deposition. It should thus be possible to lower the dietary EPA and DHA without losing the beneficial effects of these FA, if you simultaneously reduce the dietary n-6 FA content.
A major concern when changing the n-3 and n-6 FA composition of the cellular membranes of Atlantic salmon is whether the production of eicosanoids will change. Eicosanoids are highly biologically active molecules with functions in inflammation and immunity(Reference Arts, Kohler, Kainz, Brett and Arts19), with the potency of the n-6 FA derived ones being higher than the n-3 FA derived ones(Reference Schmitz and Ecker20). Manipulating the dietary n-6 and n-3 FA levels can affect the production of eicosanoids. Atlantic salmon fed increased 18 : 2n-6 levels had higher levels of ARA-derived eicosanoids(Reference Bell, Sargent and Raynard21,Reference Bell, Raynard and Sargent22) and feeding high 18 : 3n-3 compared with high 18 : 2n-6 caused increased membrane bound EPA with reduced production of ARA-derived eicosanoids(Reference Bell, Dick and McVicar23). These studies suggest that manipulation of dietary n-6 and n-3 FA can affect the stress and immune responses of Atlantic salmon by regulating the eicosanoid production.
Surveillance of commercial Norwegian aquafeeds reveals that current n-6:n-3 FA ratios of salmonid diets are on average at 0·9 (range from 0·7 to 1·1)(Reference Sele, Sanden and Berntssen24). The most commonly used VO in Norway today is rapeseed oil(Reference Aas, Ytrestøyl and Åsgård25), which has a moderate n-6 FA content at 20 %(Reference Sissener, Torstensen and Ruyter3). However, should the need to use other VO with higher n-6 contents arise (such as soya oil with n-6 FA at 54 %(Reference Sissener, Torstensen and Ruyter3)), then the dietary n-6:n-3 FA ratio could easily rise to 2. Hence, the purpose of this trial was to distinguish between the effects of absolute n-3 and n-6 FA level and the n-6:n-3 FA ratio on the requirement of EPA and DHA and their effects on tissue FA composition. A feeding experiment was conducted with three diets containing equal absolute amounts of n-3 FA and n-6:n-3 FA ratios ranging from 1·0 to 6·0 as well as a final diet with double absolute n-3 FA content and n-6:n-3 FA ratio of 1·0. This gives this trial the possibility to separate between the effects of ratio and absolute amounts of n-3 on tissue FA levels. This trial was performed in a controlled experimental facility, where feed intake and growth were closely monitored for a maximised precision in collected data. A trial in such a setting does, however, also mean that the fish are protected from most external stressors such as diseases and temperature or oxygen fluctuations. The effect of the same changes in dietary and tissue FA composition on fish exposed to such external stressors in a large-scale commercial trial will be important to complement the current findings and to detect possible effects on fish robustness due to these dietary changes.
Materials and methods
Experimental design
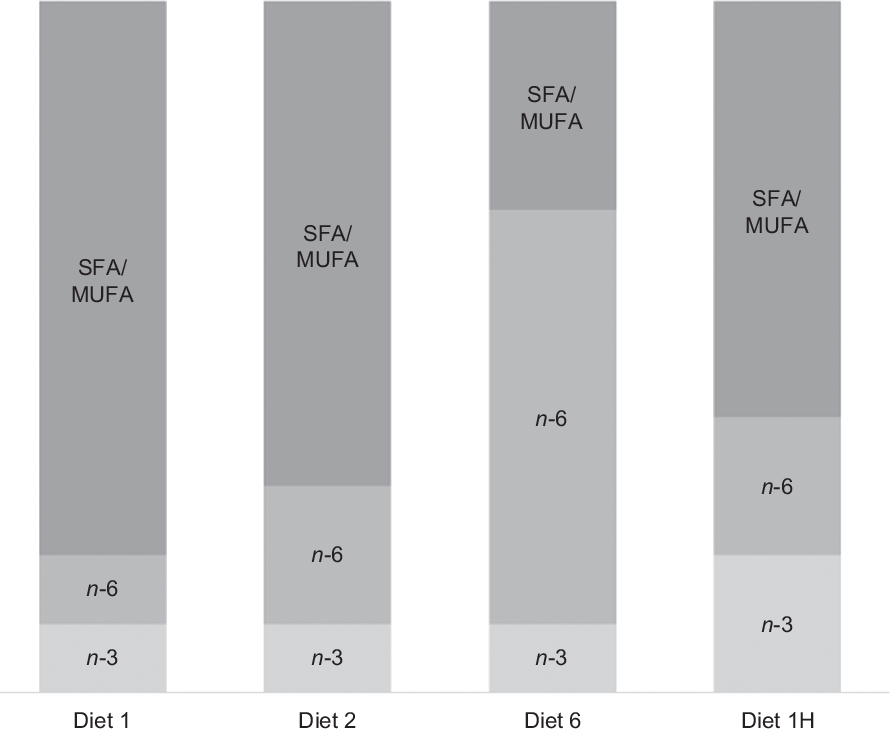
Four diets were produced with different absolute contents of n-6 and n-3 FA and different n-6:n-3 FA ratios. The first three diets were formulated to contain n-3 at approximately 8 % of total FA, but to differ in their n-6 FA contents to create n-6:n-3 FA ratios of 1, 2 and 6. An n-6:n-3 FA ratio of 6 is extreme compared with current commercial Norwegian salmonid feeds, averaging at 0·9(Reference Sele, Sanden and Berntssen24), but was included to provoke possible effects of n-6 FA inclusion. In these three diets, roughly half of the n-3 FA was provided as 18 : 3n-3 and half as EPA + DHA, resulting in EPA + DHA contents at around 1 % of the total diet. The fourth diet was formulated to contain twice as much n-3 FA as the first three diets (EPA + DHA at 2·0 % of feed), but with an n-6:n-3 FA ratio of 1, like the first diet. The diets will be referred to according to their planned dietary n-6:n-3 FA ratios for the rest of the paper. Hence, they will be called diets 1, 2 and 6, and with the final diet 1H due to its higher absolute contents of n-3 and n-6 FA compared with the first diet. The dietary formulation is given in Table 1. The only difference between them is the combination of oils used to adjust the n-3 and n-6 FA content. A graphical overview of the experimental design is given in Fig. 1.
Feed formulation in g/100 g of the four diets used in the feeding trial (4 mm pellet size)*

FM, fishmeal; FO, fish oil.
* Diet 1/Diet 2/Diet 6/Diet 1H, diet codes according to dietary n-6:n-3 fatty acid ratio. The final diet is labelled 1H due to its higher absolute contents of n-3 and n-6 fatty acids compared with the first diet.
Overview of the experimental design. The first three diets had the same n-3 fatty acid (FA) content with increasing n-6 content to increase the n-6:n-3 FA ratio. The last diet had double n-3 FA content, with an equal n-6 content, thus maintaining a low ratio. Diets are named according to their planned dietary n-6:n-3 FA ratio, with the final diet named 1H due to its higher absolute contents of n-3 and n-6 FA compared with the first diet.
Feeding trial
The feeding trial was performed at Skretting ARC Research Station at Lerang, Norway, and was conducted according to the guidelines of the Norwegian State Commission for Laboratory Animals (approval ID number 13576). A common extruded basal pellet was produced by Skretting ARC Feed Technology Plant (Stavanger, Norway) and coated with different oil blends to give the experimental diets. The experiment started 11 November 2017 with a pre-feeding period, to allow tissues to stabilise according to dietary FA composition. Atlantic salmon (SalmoBreed, Erfjord, Stamfisk AS, hatched February 2017) with an average weight of 80 g were distributed randomly between four circular tanks (3 m diameter, 7000 litres, 735 fish/tank) supplied with running sea water at 8°C and exposed to 24 h light. The fish were a mixed population of both sexes. During the pre-feeding period, the four experimental diets (3 mm pellet size) were fed to one tank each. Dietary composition of pre-feeding diets can be found in online Supplementary Table S1.
On 26 February 2018, the fish (mean weight 256 ± 2 g) were transferred to 12 experimental tanks (1 m diameter, 450 litres, thirty-two fish per tank, triplicate tanks per diet) and fed the experimental diets (4 mm pellets, increased from pre-feeding due to fish size). Tanks were supplied with flow through sea water at 11·8 ± 0·1°C, and the photoperiod was 24 h light. Diets were distributed in slight excess of expected feed intake using automatic feeders (Hølland Teknologi AS). All tanks were equipped with feed collectors for control of daily feed intake. Standard husbandry procedures at the research station were applied.
Sampling
At the start of the trial (i.e. after the pre-feeding period), all fish were weighed, and fork length was measured. The sampled fish were euthanised with an overdose of anaesthetic (Tricanine Pharmaq, 0·3 g/l). Totally, fifteen whole fish were collected from each pre-feeding tank, pooled in three samples (five fish per sample) and homogenised for FA analysis. The final sampling was conducted on 24 May 2018 after eighty-five feeding days. Before the final sampling, the fish were starved for 12 h. All fish were weighed, and fork length was measured before blood was sampled from the caudal vein using EDTA-coated vacutainers. The blood was centrifuged for 7 min at 2500 g to separate the plasma fraction from the erythrocytes. The erythrocytes were washed three times using physiological saltwater. From each tank, erythrocyte samples were collected from three fish and plasma samples from six fish. For liver lipid class and FA composition, the samples were pooled from six individual fish per tank. Pooled fillet samples (Norwegian quality cut) were taken from the same six fish as the liver samples. From three fish per tank, a section (approximately 8 × 8 cm) immediately anterior to the sampled Norwegian quality cut was sampled and frozen for skin samples. The samples of skin with muscle attached were sent frozen on dry ice to Nofima, who semi-thawed the samples, pulled the skin off the muscle and removed any remaining subcutaneous muscle from the skin samples before pooling samples from each tank. Eight whole fish from each tank were homogenised and pooled for proximate and FA composition analysis. Organ samples were flash frozen in liquid nitrogen, then put on dry ice and stored at –80°C until analysed. Erythrocytes, plasma and pooled samples (whole fish and fillet) were frozen on dry ice, then stored at –80°C until analyses. The sampled tissues were selected due to their known effects on general health and metabolism as well as their known dependence on dietary FA composition(Reference Sissener, Waagbø and Rosenlund15,Reference Bou, Berge and Baeverfjord26,Reference Cheng, Bou and Ruyter27) .
Analytical procedures
Total nitrogen was measured in whole fish using a Vario Macro Cube (Elementar Analysensysteme GmbH) nitrogen analyser according to the Association of Official Analytical Chemists(28), and total protein calculated as N × 6·25. Total fat in whole fish was determined gravimetrically after extraction with ethyl acetate. Ash content was determined gravimetrically by heating the sample to 550°C overnight in a muffle furnace (Thermolyne F 30, 430 CM).
Liver lipids were extracted using chloroform/methanol 2:1 (Merck) with 1 % added (2,6-di-tert-butyl-methylphenol; Sigma-Aldrich). The samples were analysed for absolute and relative amounts of different lipid classes using high-performance thin layer chromatography as described in Torstensen et al. (Reference Torstensen, Frøyland and Lie29).
Whole fish, liver and fillet (Norwegian quality cut) were analysed for FA composition using GC as described in Torstensen et al. (Reference Torstensen, Espe and Stubhaug30). In short, the lipids were extracted from the samples by addition of chloroform/methanol 2:1. The FA 19 : 0 was added as an internal standard for later quantification of the FA. The extracted samples were filtered and evaporated before saponification and methylation using 12 % BF3 in methanol. The separation of FA was performed on either an AutoGC (Autosystem XL, Perkin Elmer Inc.) or a Scion 436-GC (Scion Instruments) with a flame ionisation detector. The FA were identified by their retention time using a standard mixture of methyl esthers (Nu-Chek-Prep, Elysian), and the FA composition (area %) was determined. The software Chromeleon® version 7.2 (Thermo Scientific) was used to integrate the samples. The method used for FA composition at the Institute of Marine Research is accredited. For each run, control samples are also analysed, which must fall within the range of a well-established control card for the sample run to be approved. Liver FA were determined in both the polar and neutral lipids after separation by solid-phase extraction prior to saponification as described in Sissener et al. (Reference Sissener, Torstensen and Stubhaug31). The FA analysis of the feed was performed by Skretting ARC. The FA were methylated using methanolic HCl and extracted in hexane before separation by GC and is further described in Sissener et al. (Reference Sissener, Waagbø and Rosenlund15). The FA composition of the erythrocytes was analysed using ultra-fast GC, which is a faster method than the aforementioned FA analysis. This method is slightly more limited as MUFA are not separated depending on their double-bond position and are reported collectively as 16 : 1, 18 : 1, 20 : 1 and 22 : 1. It does, however, allow for analyses of a larger number of samples, as the methylation with NaOH and BF3 can be performed directly on the sample, thus omitting the extraction procedure. The FA composition by ultra-fast GC was performed as described in Sissener et al. (Reference Sissener, Torstensen and Stubhaug31).
The analyses of the FA composition of skin samples were performed by Nofima on pooled samples of three fish per tank. Total lipids were extracted from homogenised skin following the method described by Folch et al. (Reference Folch, Lees and Sloane Stanley32). A sample of 0·5 ml from the chloroform-methanol phase was used for analysis of FA composition of total lipids. The FA composition was performed using the method described by Mason & Waller(Reference Mason and Waller33). A fuller description of the method can be found in Bou et al. (Reference Bou, Berge and Baeverfjord26). The HP Chem Station software was used, and individual FA methyl esters were identified by referring to well-characterised standards. The relative amount of each FA was expressed as a percentage of the total amount of FA in the analysed sample, and the absolute amount of FA per g tissue was calculated using C23 : 0 methyl ester as the internal standard.
The lipid class composition of skin was performed by Nofima as described in Bou et al. (Reference Bou, Berge and Baeverfjord26). Briefly, a part of the Folch chloroform lipid extract was evaporated and then re-dissolved in hexane before separation by TLC. The spots corresponding to phosphatidylcholine (PC), phosphatidylethanolamine (PE), phosphatidylinositol (PI) and phosphatidylserine (PS) were scraped off into glass tubes and trans-methylated following the FA composition method by Nofima.
Calculations
 $${\rm{Feed\;conversion\;ratio\;}}\left( {{\rm{FCR}}} \right)\!:{\rm{\;FCR}} = \frac{{{\rm{feed}{\rm{\;}}eaten{\rm{\;}}\left( g \right)}}\over{{\rm{weight}{\rm{\;}}gain{\rm{\;}}\left( g \right)}}$$
 $$\hskip30pt{\rm{Condition\;factor\;}}\left( {{\rm{CF}}} \right)\!:{\rm{\;CF}} = {{{\displaystyle {\rm{body}}{\rm{\;}}{\rm{weight}}{\rm{\;}}\left( {\rm{g}} \right)}}\over{{\displaystyle {\rm{lengt}}{\rm{h}^3}\left( {\rm{cm}} \right)}}{\rm{\;}}} \times 100$$
 $${\rm{Specific\;growth\;rate\;}}\left( {{\rm{SGR}}} \right)\!:{\rm{SGR}} = \frac{{{{\rm{ln{w_2} - ln{w_1}}}}}\over{\rm{d}}} \times 100$$
where w2 and w1 are final and initial weights in grams and d the sum of experimental days.
 $${\rm{Hepatosomatic\;index\;}}\left( {{\rm{HSI}}} \right)\!:{\rm{\;HSI\;}} = {\rm{\;}}\frac{{{{\rm{liver}}{\rm{\;}}{\rm{weight}}{\rm{\;}}\left( \rm{g} \right)}}\over{{\rm{body}{\rm{\;}}weight{\rm{\;}}\left( g \right)}}}{\rm{\;}} \times 100$$
 $${\rm{Viscerasomatic\;index\;}}\left( {{\rm{VSI}}} \right)\!:{\rm{\;VSI\;}} = {\rm{\;}}\frac{{{\rm{viscera{\rm{\;}}weight{\rm{\;}}\left( g \right)}}}\over{{\rm{body{\rm{\;}}weight{\rm{\;}}\left( g \right)}}}}}{\rm{\;}} \times 100$$
Fatty acid productive value (FAPV)(Reference Stubhaug, Lie and Torstensen8):
 $${\scale 95%\eqalign{{\rm{FAPV}} = \cr {\rm{\;}}\frac{{{{{\rm{g\;FA\;per\;tank\;at\;end\;of\;trial}} - {\rm{g\;FA\;per\;tank\;at\;start\;of\;trial}}}}\over{{{\rm{g\;FA\;eaten\;in\;total\;per\;tank\;for\;the\;duration\;of\;the\;trial}}}}}{\rm{\;}} \times 100}$$
Statistics
Based on considerable previous experience, the hypothesised effect sizes were expected to be >1·5 sd. The experimental power was calculated post hoc using the power calculation tool for one-way ANOVA in the software Statistica (version 13.5.0.17). An α value of 0·05 and average effect size of approximately 1·5 sd were applied to a selection of response variables. For example, FA composition in erythrocytes had a power level (1 – β) of 0·999 and final weight a power level (1 – β) of 0·817.
All other statistical analyses were performed using the free software environment R(35). Differences between the groups were detected by one-way ANOVA when no tank effects were found. When tank effect (random effect) was found to be present, nested one-way ANOVA was used. Tukey’s honestly significant difference post hoc test was used when one-way ANOVA resulted in significant differences, using the packages nlme (Reference Pinheiro, Bates and Debroy36) and multcomp (Reference Hothorn, Bretz and Westfall37). Correlation analyses were performed using the function cor.test. The data were analysed for homogeneity of variances using Levene’s test (Brown Forsythe modification) and for normality using Shapiro Wilk’s test, in addition to using QQ-plots for graphical evaluation of normality. A P value of ≤0·05 was considered statistically significant. Results are presented as means with standard deviations.
Results
Dietary composition
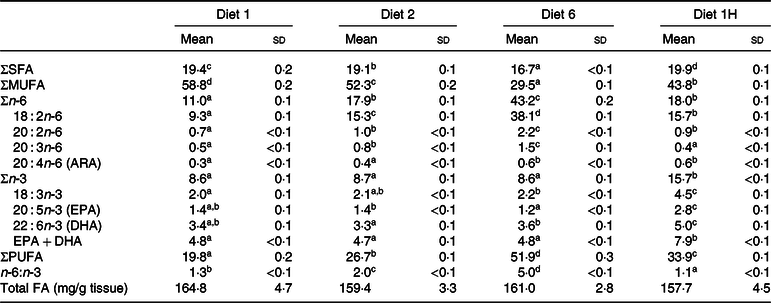
As planned, diets 1, 2 and 6 had the same n-3 FA content (7·7–7·8 % of total FA). 18 : 3n-3 ranged from 2·9 to 3·1 % of FA in the same three diets. Diets 1 and 2 contained equal amounts of EPA at 2·4 % of total FA, while diet 6 had a little less at 2·0 % of total FA. Diet 6 had slightly more DHA than groups 1 and 2 (1·8 % of total FA in diet 6 v. 1·5 % in diets 1 and 2), making the sum of EPA + DHA similar for these three diets (3·9, 3·9 and 3·8 % of total FA). As planned, diet 1H had approximately twice as much 18 : 3n-3, EPA and DHA compared with the three other diets.
Sunflower oil, containing large amounts of 18 : 2n-6 (62·5 %(Reference Sissener, Torstensen and Ruyter3)), was used to increase the dietary n-6 FA content and thus determine the n-6:n-3 FA ratio. Hence, 18 : 2n-6 varied from 10·8 to 46·7 % with diets 2 and 1H having similar contents at 17·9 and 17·6 % of total FA. The n-6:n-3 FA ratios ended up slightly higher than planned, but were still close to the planned 1, 2, 6 and 1 at 1·4, 2·4, 6·1 and 1·2, respectively. The FA 18 : 2n-6 was the major n-6 FA in all diets. Dietary SFA were stable across all diets at around 20 % of total FA, except for in diet 6 which due to a high content of sunflower oil got a reduced saturated fat content (16·6 % of total FA). MUFA was the main group of FA reduced when n-6 FA increased, due to the replacement of the MUFA-rich olive oil with n-6 rich sunflower oil, thus being highest in diet 1 (59 % of total FA) and the lowest in diet 6 (27 % of total FA). Proximate and FA composition of the 4 mm pellet is given in Table 2, while the results from the same analyses for the 3 mm pellet are given in online Supplementary Table S2.
Analysed dietary proximate composition (g/100 g), fatty acid (FA) composition (% of total FA) and total FA (g/100 g diet) of the four diets used in the feeding trial (4mm pellet size)*

ARA, arachidonic acid.
* Diet 1/Diet 2/Diet 6/Diet 1H, diet codes according to dietary n-6:n-3 FA ratio. The final diet is labelled 1H due to its higher absolute contents of n-3 and n-6 FA compared with the first diet.
Growth
Feeding diet 1H resulted in a significantly higher final weight and fork length of the fish than when feeding diets 1 and 2. The SGR for fish fed diet 1H was significantly higher than fish fed diet 2. Feed intake for the whole period was significantly lower in fish fed diet 1 than fish fed diet 1H. Neither FCR, CF, HSI nor VSI was affected by any of the diets (Table 3). There was no mortality in any of the dietary groups during the experiment.
Growth performance and organ indices of Atlantic salmon fed diets with varying dietary n-6:n-3 ratios and absolute levels of n-6 fatty acids (FA) and n-3 FA*
(Mean values and standard deviations in three tanks per diet)

SGR, specific growth rate; FCR, feed conversion ratio; CF, condition factor; HSI, hepatosomatic index; VSI, viscerasomatic index.
a,b Significantly different means are denoted by unlike superscript letters.
* Weight, fork length and CF from all fish at the final sampling (n 96/97), start weight, feed intake for the 85 d experimental period, SGR and FCR is given per tank (n 3), HSI and VSI are from six fish per tank (n 18). Diet 1/Diet 2/Diet 6/Diet 1H, diet codes according to dietary n-6:n-3 FA ratio. The final diet is labelled 1H due to its higher absolute contents of n-3 and n-6 FA compared with the first diet.
Whole fish proximate composition
The experimental diets did not lead to any differences in total protein or ash in whole fish; however, a significantly higher fat content was found in the fish fed diet 1 compared with fish fed diets 6 and 1H (Table 4).
Total fat, protein and DM (g/100 g) in homogenised whole Atlantic salmon fed the diets with varying dietary n-6:n-3 ratios and absolute levels of n-6 fatty acids (FA) and n-3 FA*
(Mean values with their standard deviations of three tanks per diet with eight fish pooled per tank (n 3 per diet))

a,b Significantly different means are denoted by unlike superscript letters.
* Diet 1/Diet 2/Diet 6/Diet 1H, diet codes according to dietary n-6:n-3 FA ratio. The final diet is labelled 1H due to its higher absolute contents of n-3 and n-6 FA compared with the first diet.
Fatty acid composition and fatty acid productive value in whole fish
The FA composition of whole fish is presented as % of total FA (Table 5), although mg/g was also calculated. The mg/g data were used to calculate the FAPV. The whole fish FA composition generally reflected the dietary composition, with SFA and MUFA following the dietary composition closely. The sum of PUFA in whole fish was slightly reduced compared with the dietary contents of this group of FA. Fish fed diet 6 had the largest reduction in tissue PUFA, followed by fish fed diets 1H, 2 and 1. The sum of n-6 FA was reduced relative to the feed for all groups with the biggest reduction occurring in fish fed diet 6, whereas the sum of n-3 FA increased in whole fish compared with the diets for all groups. A reduction in n-6 FA and an increase in n-3 FA in the tissues compared with the diets thus led to a slight reduction of the n-6:n-3 FA ratios in the fish tissues compared with the diets (1·3, 2·0, 5·0 and 1·1 in the tissues compared with 1·4, 2·4, 6·1 and 1·2 in the diets). In whole fish, it was the absolute dietary contents of n-3 and n-6 FA which were reflected.
Fatty acid (FA) composition (% of total FA) of whole Atlantic salmon fed diets with varying dietary n-6:n-3 ratios and absolute levels of n-6 FA and n-3 FA*
(Mean values and standard deviations of three tanks per diet with eight fish pooled per tank, n 3)
ARA, arachidonic acid.
a,b,c,d Significantly different means are denoted by unlike superscript letters.
* Diet 1/Diet 2/Diet 6/Diet 1H, diet codes according to dietary n-6:n-3 FA ratio. The final diet is labelled 1H due to its higher absolute contents of n-3 and n-6 FA compared with the first diet.
The FA composition of the Norwegian quality cut was almost identical to the FA composition in whole fish, though the total amount of fat was lower in muscle than in whole fish (online Supplementary Table S3).
The FAPV for DHA ranged from 122 to 144 % (Fig. 2) showing a net production of DHA for all dietary groups and no significant effects of diets. FAPV of 18 : 3n-3 ranged from 55 to 69 % and EPA from 44 to 56 % (Fig. 2), with group 1H having significantly higher FAPV than the other groups for both FA. FAPV for SFA (82·9 ± 4·3 %, all dietary groups combined) and MUFA (83·4 ± 4·0 %) did not show any dietary effects. Correlation analyses revealed no relation between dietary MUFA and whole fish content of EPA, DHA or the sum of EPA + DHA (mean P value 0·98, mean correlation coefficient = –0·006).
Fatty acid productive value (FAPV) (%) of 18 : 3n-3, EPA and DHA of whole Atlantic salmon fed diets with varying dietary n-6:n-3 fatty acid (FA) ratios and absolute levels of n-6 FA and n-3 FA. Values above the dashed line (100 %) indicate a net production, while values below indicate net consumption. Homogenates of whole fish were pooled from five fish per tank (n 3) at the initial sampling and pooled from eight fish per tank (n 3) at final sampling. Values are means with vertical bars representing standard deviations. a,b Significantly different means are denoted by unlike letters (one-way ANOVA, followed by Tukey's honestly significant difference multiple comparison). Diet 1/Diet 2/Diet 6/Diet 1H, diet codes according to dietary n-6:n-3 FA ratio. The final diet is labelled 1H due to its higher absolute contents of n-3 and n-6 FA compared with the first diet.
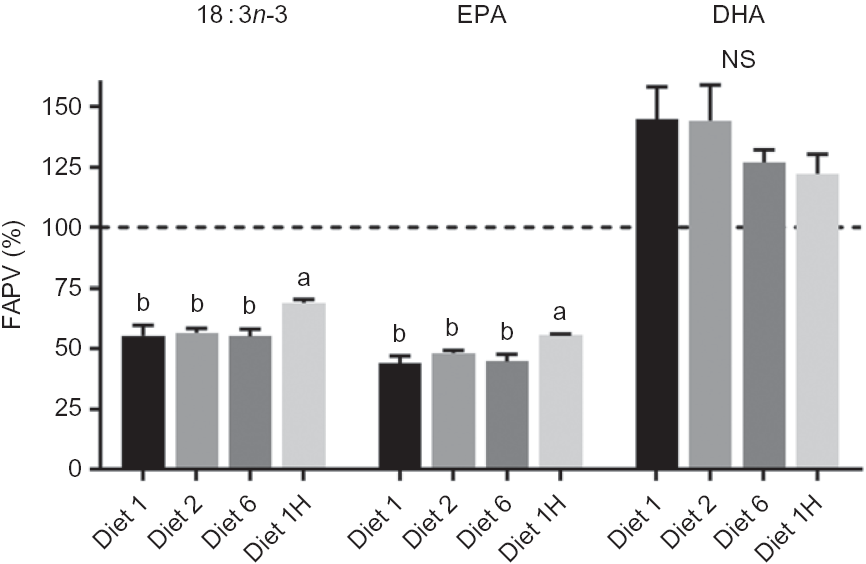
When calculating FAPV, the dietary content of each FA is required. Some FA are present in the diet at low levels (≤1 %) at which point the uncertainty in the FA analysis becomes very large. This can affect the retention calculations drastically and induce variation in retention values that is random rather than caused by the diets. The n-6 FA 20 : 2n-6 and 20 : 3n-6 were not present in the diet, and ARA was present at ≤1 % which makes it difficult to calculate accurate FAPV. However, 20 : 2n-6 and 20 : 3n-6 were present in whole fish, and ARA was present at higher amounts in whole fish than in the diets, thus indicating an endogenous production of these FA.
Liver lipid classes
Generally, the liver content of polar lipids remained quite stable across dietary groups, while there were significant differences in the neutral lipid content (Table 6). TAG was significantly higher in the liver of fish fed diets 1 and 6 compared with fish fed diets 2 and 1H, also causing a significant difference in the sum of neutral lipids and total lipids.
Liver lipid classes (mg/g) of Atlantic salmon fed diets with varying dietary n-6:n-3 fatty acid (FA) ratios and absolute levels of n-6 FA and n-3 FA*
(Mean values and standard deviations of three tanks per diet with six fish pooled per tank, n 3)

LPC, lysophosphatidylcholine; SM, sphingomyelin; PC, phosphatidylcholine; PS, phosphatidylserine; PI, phosphatidylinositol; CL, cardiolipin; PE, phosphatidylethanolamine; DAG, diacylglycerol; CHOL, cholesterol; ND, not detected; CE, cholesteryl ester.
a,b,c Significantly different means are denoted by unlike superscript letters.
* Diet 1/Diet 2/Diet 6/Diet 1H, diet codes according to dietary n-6:n-3 FA ratio. The final diet is labelled 1H due to its higher absolute contents of n-3 and n-6 FA compared with the first diet.
Fatty acid composition of the liver
Increasing the dietary n-6:n-3 FA ratio (diets 1, 2 and 6) resulted in a significant reduction of EPA in the polar lipids of the liver, while DHA remained unaffected (Fig. 3(A) and (B)). Every other n-3 FA analysed (18 : 4n-3, 20 : 4n-3, 21 : 5n-3, 22 : 5n-3 and 24 : 6n-3), except 18 : 3n-3, was also significantly reduced in the liver polar lipids when the dietary n-6:n-3 FA ratio was increased. There were no effects of dietary n-6:n-3 FA ratio on the content of any n-3 FA in the neutral lipids (diets 1, 2 and 6), but an increase in dietary n-3 FA led to higher contents of every n-3 FA (diet 1H). The fish fed diet 1H had significantly higher amounts of every n-3 FA compared with the other dietary groups. The fish fed diet 2 had a slightly elevated content of some of the n-3 FA (EPA, docosapentaenoic acid (22 : 5n-3), DHA and 24 : 6n-3) compared with the fish fed diet 6 (neutral lipid data in online Supplementary Table S4). The ratio of EPA:ARA in the liver polar lipids was strongly influenced by n-6:n-3 FA ratio of the diets and was the highest in diet 1 and diet 1H (Fig. 3(C)). The content of SFA was quite stable in the liver polar lipids at about 25 % of total FA, but significantly lower in fish fed diet 6 (23·5 % of total FA, online Supplementary Table S4). The MUFA in liver polar lipids were much lower than dietary MUFA, lying between 10 and 20 % of total FA (lowest in fish fed diet 6 and highest in fish fed diet 1). The neutral lipid MUFA and SFA were higher and lower than their levels in the diet, respectively, but followed the same fluctuations as in the diets (online Supplementary Table S4).
Content of EPA, DHA (% of total fatty acids (FA)) and the ratio of EPA:ARA in polar lipids of the liver (A–C), erythrocytes (D–F), and in phosphatidylcholine (PC) (G–I) and phosphatidylethanolamine (PE) (J–L) in the skin of Atlantic salmon fed diets with varying dietary n-6:n-3 FA ratios and absolute levels of n-6 FA and n-3 FA. Six liver samples were pooled from each tank (n 3), erythrocyte samples from three fish from each tank diet (n 9), skin samples from three fish were pooled from each tank (n 3). Values are means with vertical bars representing standard deviations. a,b,c Significantly different means are denoted by unlike letters (one-way ANOVA, followed by Tukey’s honestly significant difference multiple comparison). Diet 1/Diet 2/Diet 6/Diet 1H, diet codes according to dietary n-6:n-3 FA ratio. The final diet is labelled 1H due to its higher absolute contents of n-3 and n-6 FA compared with the first diet. ARA, arachidonic acid.

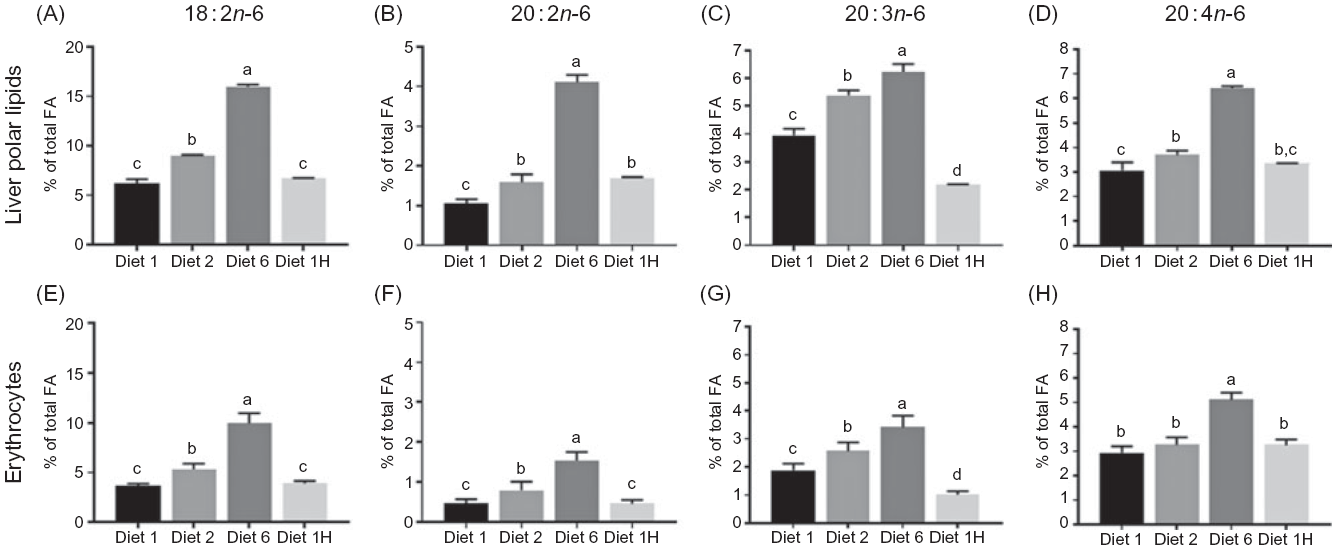
Increasing the dietary n-6:n-3 FA ratio led to increasing n-6 FA contents in the polar lipids (diets 1, 2 and 6), and similar dietary n-6:n-3 ratios led to similar contents of total n-6 FA despite different absolute dietary contents (diets 1 and 1H, Fig. 5(A)). Hence, indicating that in the polar lipids, dietary n-6:n-3 FA ratio had a greater effect than absolute dietary amount of these FA. Additionally, all intermediary FA in the production of ARA (and some longer chain n-6 FA) were present in all dietary groups, despite not being present in the feed. The ARA content of the liver polar lipids of fish fed diet 1H was intermediate between the content in fish fed diet 1 and diet 2 (Fig. 4(A)–(D)). Increased dietary content of n-6 FA also caused higher n-6 FA in the neutral lipids, but in contrast to the polar lipids, the absolute amounts appeared to be of greater importance here than the n-6:n-3 FA ratio. For example, fish fed diet 2 and fish fed diet 1H had the same total n-6 FA in the liver neutral lipids, even though they had different dietary n-6:n-3 FA ratios (Fig. 5(A)). All intermediates from 18 : 2n-6 to ARA were present, but 18 : 3n-6 and 20 : 3n-6 seemed to follow the n-6:n-3 FA ratio rather than absolute dietary content. The 18 : 3n-6, 20 : 2n-6, 20 : 3n-6 were also present at much lower amounts than in the polar lipids. ARA, however, seemed to simply reflect the dietary content and was present at lower concentrations than most of the intermediates of its biosynthesis (online Supplementary Table S4).
Content of 18:2n-6, 20:2n-6, 20:3n-6 and 20:4n-6 (% of total fatty acids (FA)) in liver (A–D) and erythrocytes (E–H) of Atlantic salmon fed diets with varying dietary n-6:n-3 ratios and absolute levels of n-6 FA and n-3 FA. Six liver samples were pooled from each tank (n 3), erythrocytes sampled from three fish from each tank (n 9). Values are means with vertical bars representing standard deviations. a,b,c,d Significantly different means are denoted by unlike letters (one-way ANOVA, followed by Tukey’s honestly significant difference multiple comparison). Diet 1/Diet 2/Diet 6/Diet 1H, diet codes according to dietary n-6:n-3 FA ratio. The final diet is labelled 1H due to its higher absolute contents of n-3 and n-6 compared with the first diet.
Comparison of sum n-6 (% of total fatty acids (FA)) and n-6:n-3 FA ratio between neutral (![]() ) and polar (
) and polar (![]() ) lipids in the liver of Atlantic salmon fed diets with varying dietary n-6:n-3 FA ratios and absolute levels of n-6 FA and n-3 FA. Six liver samples were pooled from each tank (n 3). Values are means with vertical bars representing standard deviations. a,b,c,d;A,B Significantly different means are denoted by unlike letters (one-way ANOVA, followed by Tukey’s honestly significant difference multiple comparison). Diet 1/Diet 2/Diet 6/Diet 1H, diet codes according to dietary n-6:n-3 FA ratio. The final diet is labelled 1H due to its higher absolute contents of n-3 and n-6 FA compared with the first diet.
) lipids in the liver of Atlantic salmon fed diets with varying dietary n-6:n-3 FA ratios and absolute levels of n-6 FA and n-3 FA. Six liver samples were pooled from each tank (n 3). Values are means with vertical bars representing standard deviations. a,b,c,d;A,B Significantly different means are denoted by unlike letters (one-way ANOVA, followed by Tukey’s honestly significant difference multiple comparison). Diet 1/Diet 2/Diet 6/Diet 1H, diet codes according to dietary n-6:n-3 FA ratio. The final diet is labelled 1H due to its higher absolute contents of n-3 and n-6 FA compared with the first diet.
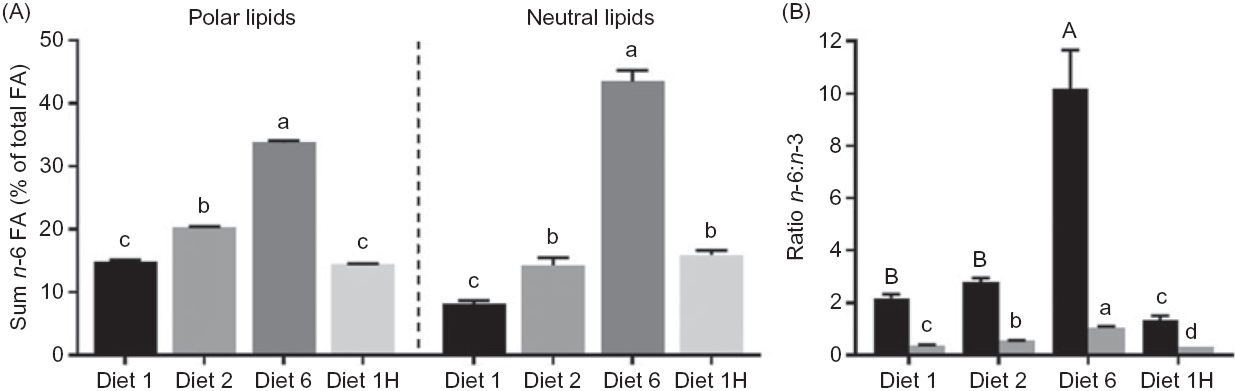
Compared with EPA and DHA feed content, these FA were present at considerably higher concentrations in the liver polar lipids. Contrarily, 18 : 2n-6 was reduced manifold in the liver polar lipids compared with the feed, while a smaller reduction was seen in the neutral lipids. In the liver neutral lipids, DHA was similar to the dietary content, whilst EPA was reduced relative to the feed. Consequently, the liver n-6:n-3 FA ratio ranged from 0·3 to 1·1 in the polar lipids and from 1·4 to 10·2 in the neutral lipids (Fig. 5(B)).
Fatty acid composition of erythrocytes
The FA composition of the erythrocytes was more dominated by n-3 FA than the other tissues (42–53 % of total FA) and had a stable SFA content at about 31 % of total FA. The MUFA was much lower than in the diets, ranging from 7 to 13 % of total FA (online Supplementary Table S5). A higher n-6:n-3 FA ratio significantly affected the EPA content of the erythrocytes, while DHA remained more resilient towards change (diets 1, 2 and 6, Fig. 3(D) and (E)). However, although a numeric decrease in EPA was seen when the dietary n-6:n-3 FA ratio was increased from 1 to 2, it was not significant. Only when raising the n-6:n-3 FA ratio to 6 was a significant decrease in EPA content seen. The EPA:ARA ratio in erythrocytes was highly influenced by dietary n-6:n-3 FA ratio with similarly high values in diet 1 and diet 1H, and lower values in the two other dietary groups (Fig. 3(F)). The other n-3 FA analysed (20 : 4n-3 and 22 : 5n-3) were numerically decreased when increasing the dietary n-6:n-3 FA ratio to 2 and significantly decreased when the n-6:n-3 FA ratio was raised to 6 (online Supplementary Table S5). Fish fed diet 1H exhibited the highest percentage of every n-3 FA in the erythrocytes.
An increase in the dietary n-6:n-3 FA ratio led to higher levels of 18 : 2n-6, 20 : 2n-6 and 20 : 3n-6 (diets 1, 2 and 6) in the erythrocytes; however, similar n-6:n-3 FA ratios but different absolute amounts of dietary n-6 FA (diets 1 and 1H) resulted in the same amount of that n-6 FA in the erythrocytes (Fig. 4(E)–(G)). In ARA, however, only fish fed diet 6 stood out, with significantly higher content than the other three diets (Fig. 4(H)).
Fatty acid composition of phospholipid classes in skin
Regardless of diet, each of the PL classes was characterised by their own compositional pattern of FA. PC was characterised by the highest relative levels of 16 : 0 and 18 : 1n-9. The PS fraction had a high proportion of 18 : 0 and DHA, while PI had a large fraction of 18 : 0 and the highest relative amount of ARA. Lastly, DHA was the FA with the highest concentration in PE, which also had relatively high amounts of 18 : 1n-9 (Fig. 6). The SFA content was generally higher than in the diets at approximately 30–40 % of total FA, except for in PE which had lower levels (approximately 15 % of total FA). MUFA followed the same pattern as in the diets, being highest in fish fed diet 1 and the lowest in the fish fed diet 6, but mostly lying at lower levels than in the diets (10–40 % of total FA).
Selected fatty acids (FA) that characterise the different phospholipid classes in the skin of Atlantic salmon fed diets with varying dietary n-6:n-3 ratios and absolute levels of n-6 FA and n-3 FA. Values for each FA are pooled for all dietary groups and given as means with vertical bars representing standard deviations. Diet 1/Diet 2/Diet 6/Diet 1H, diet codes according to dietary n-6:n-3 FA ratio. The final diet is labelled 1H due to its higher absolute contents of n-3 and n-6 FA compared with the first diet. PC, phosphatidylcholine; PS, phosphatidylserine; PI, phosphatidylinositol; PE, phosphatidylethanolamine.

PC and PE were the PL classes most affected by the diets, with almost every FA analysed significantly affected (online Supplementary Table S6). A decrease in PC and PE content of EPA was seen with increasing the n-6:n-3 FA ratio (diets 1, 2 and 6). Feeding the fish diet 1H resulted in the significantly highest content of EPA and DHA in the PC (Fig. 3(G) and (H)) and PE (Fig. 3(J) and (K)) of the skin. The ratio between EPA:ARA in the PC and PE of the skin was also highly influenced by the dietary n-6:n-3 diets, with the fish fed diet 1 and diet 1H having similar EPA:ARA ratios (Fig. 3(I) and (L)). The increasing dietary n-6:n-3 FA ratio caused a significant increase in 18 : 2n-6, 20 : 2n-6, 20 : 3n-6 and ARA in both PC and PE (diets 1, 2 and 6, online Supplementary Table S6). In PC, dietary n-6:n-3 FA ratio was reflected in 18 : 2n-6 content and ARA reflected absolute dietary n-6 FA. Contrastingly in PE, 18 : 2n-6 reflected absolute dietary n-6 and ARA reflected dietary n-6:n-3 ratio. ARA and 20 : 3n-6 were significantly increased by higher dietary n-6 content in the PI. In PS, 18 : 2n-6, 20 : 2n-6 and 20 : 3n-6 reflected dietary n-6:n-3 FA ratio. No other FA was significantly affected in PS and PI.
The n-6:n-3 FA ratio in the total FA of the skin was increased by the dietary ratio (data not shown). The different PL classes were much less impacted, though once again it was clear that the PI and PS were more resistant to change, their ratios barely affected even with 6-fold increases in dietary ratio. Though more resistant to change than the total FA, PE and PC were more influenced than PI and PS (online Supplementary Table S6). Thus, PI and PS were the most conserved PL classes and the least affected by dietary differences.
Discussion
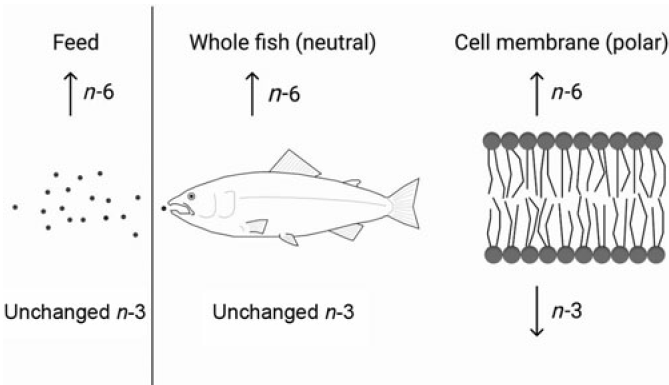
The requirement of EPA and DHA has been extensively studied in fish; however, it has been sparsely studied in relation to the dietary content of n-6 FA. To test the possibility of a higher requirement for EPA and DHA with increasing dietary n-6 FA is of high relevance to the aquaculture industry. Knowing how to keep the beneficial effects of EPA and DHA even at low dietary levels is crucial with the limited global availability of these nutrients. Important functions of these FA, like maintaining membrane fluidity and function as well as their roles in the inflammatory system through eicosanoid production, depend on the correct levels of these FA in the polar lipid fraction. It is therefore important to be able to formulate fish diets that reduce the metabolic losses of the valuable EPA and DHA and by this maintaining fish health by maximising the positive output of these FA. There is general agreement that a higher dietary n-6 FA content will result in increased fish tissue levels of n-6 FA(Reference Dernekbaşı, Murat and Alagil10–Reference Bell, McVicar and Park12,Reference Xu and Kestemont38) . Additionally, altering the ratio between n-3:n-6 FA has also been shown to affect n-6 FA tissue levels(Reference Bransden, Carter and Nichols11,Reference Senadheera, Turchini and Thanuthong17) . Nevertheless, it has remained unclear whether it is the ratio or absolute contents that play the greater role in deciding the fate of the ingested FA. The present trial, especially designed to be able to distinguish between ratio or absolute contents of n-3 and n-6 FA, demonstrated that both n-6:n-3 FA ratio and absolute contents affected the lipid composition of Atlantic salmon. However, neutral and polar lipids were not affected the same way by these dietary variations. Whole fish and muscle (dominated by neutral lipids(Reference Bransden, Carter and Nichols11,Reference Torstensen, Frøyland and Ørnsrud39) ) and liver neutral lipids all reflected the dietary absolute content of n-6 and n-3 FA. Liver polar lipids, erythrocytes (dominated by polar lipids) and PL of the skin, on the other hand, generally responded more to the dietary n-6:n-3 FA ratio. Fig. 7 shows a schematic overview of the main results. This is in accordance with earlier reports, where the FA composition of the polar lipids remained more conserved than that of the neutral lipids(Reference Bou, Berge and Baeverfjord9,Reference Ruyter, Røsjø and Einen40,Reference Torstensen, Lie and Frøyland41) .
Constant dietary n-3 fatty acids (FA) with increasing dietary n-6 FA will lead to higher n-6 FA content in the fish and its cell membranes. However, while the n-3 FA levels in the whole fish will not be affected by the increasing dietary n-6 FA, the cell membrane n-3 FA content will decrease despite constant dietary n-3 FA.
Failure to provide sufficient dietary n-3 LC-PUFA can result in reduced growth for salmonids(Reference Ruyter, Røsjø and Einen40). In the present trial, fish fed diets with constant EPA + DHA (11 g/kg feed) and increasing n-6:n-3 FA ratio did not differ significantly in their final weights. However, fish fed the diet with double absolute n-3 LC-PUFA (20 g/kg feed) had a significantly higher final weight. The present trial ended when the fish were about 750 g. Bou et al. (Reference Bou, Berge and Baeverfjord26) found significantly lower weight in fish provided with 10 g/kg dietary EPA + DHA than fish given 17 g/kg when allowed to grow to about 1·2 kg. This could indicate a slightly higher requirement for EPA and DHA than 10–11 g/kg feed for smaller fish.
The fillet FA composition of Atlantic salmon generally reflects the FA composition of the diets(Reference Sissener2,Reference Bou, Berge and Baeverfjord9) , and this trial was no exception. What was demonstrated in the present trial, however, was that the absolute amounts of dietary n-6 and n-3 FA was reflected, not dietary n-6:n-3. Whole fish also reflected the absolute dietary n-6 and n-3 FA. Neutral lipids constitute the largest lipid fraction of both Atlantic salmon muscle(Reference Torstensen, Frøyland and Ørnsrud39) and whole fish(Reference Bransden, Carter and Nichols11); hence, it is likely that at least the neutral lipid fraction mirrors the dietary absolute n-6 and n-3 FA. It was unfortunate that the fillet reflected the absolute dietary contents of n-3 and n-6 FA and not n-6:n-3 FA ratio. This means that Atlantic salmon fillet content of these FA cannot be modified simply by manipulating the n-6:n-3 FA ratio of the feed. Mice given salmon fed soya oil as the main lipid source (high 18 : 2n-6) developed insulin resistance, accumulated fat in the liver and became overweight(Reference Alvheim, Torstensen and Lin42). So, although a higher dietary n-6:n-3 for Atlantic salmon will not reduce fillet EPA and DHA levels, it will cause elevated levels of n-6 FA which could reduce the lowering effect eating salmon has on consumer’s n-6:n-3 ratio.
The FAPV values for 18 : 3n-3, EPA and DHA were not affected by dietary n-6:n-3 ratio; however, a higher dietary n-3 FA content significantly increased the FAPV for both 18 : 3n-3 and EPA, probably indicating a lowered use of these FA for DHA biosynthesis when more DHA was provided in the feed. It could also mean less 18 : 3n-3 and EPA being used for β-oxidation. Dietary DHA is known to inhibit its own biosynthetic pathway(Reference Betancor, Howarth and Glencross43,Reference Thomassen, Rein and Berge44) , with inhibition occurring mainly at the final Δ6-desaturation step (24 : 5n-3 to 24 : 6n-3) and the second elongation step (22 : 5n-3 to 24 : 5n-3)(Reference Thomassen, Rein and Berge44) It has been suggested that increased dietary n-6 FA could have a positive effect on the endogenous production of DHA(Reference Sissener, Sanden and Torstensen14,Reference Caballero, Obach and Rosenlund45) , and Caballero et al. (Reference Caballero, Obach and Rosenlund45) hypothesised that this could be due to activation of the Δ5- and Δ6-desaturases (dietary DHA at 2·9–6·7 in % of total FA). Sissener et al. (Reference Sissener, Sanden and Torstensen14) found a positive correlation between dietary 18 : 2n-6 and FAPV of DHA in Atlantic salmon (dietary DHA at 2·3–2·8 in % of total FA). However, a recent trial feeding Atlantic salmon fry/parr an EPA and DHA-free diet from start feeding found that high dietary 18 : 2n-6 inhibited the biosynthesis of long-chain PUFA(Reference Sprague, Xu and Betancor46). The present experiment did not show any effect of dietary 18 : 2n-6 on DHA FAPV. Although DHA production was evident due to all FAPV being above 100 (ranging from 122 to 145), there were no significant differences between the groups in FAPV despite large differences in dietary 18 : 2n-6. MUFA and SFA are good sources of energy and their dietary content may therefore have a sparing effect on EPA and DHA. A potential sparing effect of SFA was not possible to assess in this trial, due to quite stable SFA contents in all the diets. Correlation analyses did, however, show a clear lack of relation between dietary MUFA and tissue EPA and DHA, thus rejecting the hypothesis of a MUFA-sparing effect. In short, there were no effects of dietary n-6:n-3 FA ratio or absolute n-6 FA on the FAPV of 18 : 3n-3, EPA and DHA, but a higher dietary n-3 led to significantly higher FAPV and consequently higher conservation of 18 : 3n-3 and EPA.
Using VO as the main lipid source for Atlantic salmon can cause an increase in liver TAG content(Reference Bransden, Carter and Nichols11,Reference Alvheim, Torstensen and Lin42,Reference Ruyter, Moya-Falcón and Rosenlund47) , which is considered a general sign of dietary imbalance that can originate from several sources. Multiple trials have also demonstrated that low dietary EPA + DHA can result in increased liver fat in Atlantic salmon(Reference Bou, Berge and Baeverfjord26,Reference Sanden, Liland and Saele48) , which could explain the lower liver TAG content seen in the fish fed the highest dietary n-3 FA of the present trial (diet 1H). Bransden et al. (Reference Bransden, Carter and Nichols11), Alvheim et al. (Reference Alvheim, Torstensen and Lin42) and Ruyter et al. (Reference Ruyter, Moya-Falcón and Rosenlund47) used VO very high in 18 : 2n-6, which could suggest 18 : 2n-6 as the culprit for the high liver TAG content. This would correspond well with the high liver TAG seen in the fish fed diet 6 in this experiment. Feeding trials using rapeseed oil (high 18 : 1n-9)(Reference Liland, Espe and Rosenlund49) and cell studies using 18 : 1n-9 in the medium(Reference Espe, Xie and Chen50) suggest that 18 : 1n-9 too can contribute to a fatty liver. Diet 1 contained the highest amount of 18 : 1n-9 in the present trial, this could help explaining the high liver TAG found in this group. The fish fed diet 1 additionally had the highest content of crude fat in whole fish. A generally high fat level (high visceral fat, liver fat) has previously been seen when Atlantic salmon has been fed rapeseed oil as the main oil source(Reference Torstensen, Espe and Stubhaug30). Fish fed diet 2, however, ended up with significantly lower liver TAG than fish fed diets 1 and 6 and similar TAG levels as fish fed diet 1H. Diet 2 had less 18 : 1n-9 than diet 1 and less n-6 than diet 6. It is possible that diet 2 had a more beneficial balance between 18 : 1n-9 and 18 : 2n-6 than diet 1 and diet 6, leading to the significantly lower liver TAG. This means that there were likely several causes to the varying liver TAG levels. Too high dietary 18 : 1n-9 caused liver TAG, and too high dietary n-6 FA did the same, while higher dietary content of EPA and DHA led to lower liver TAG.
It is a known phenomenon that DHA is preferentially accumulated in salmonid tissues, particularly at low dietary levels, while EPA is more utilised for energy production or biosynthesis of DHA(Reference Emery, Norambuena and Trushenski51,Reference Codabaccus, Carter and Bridle52) . In the present study, while EPA was significantly reduced by an increasing n-6:n-3 FA ratio (constant n-3 FA) in the liver polar lipids, the erythrocytes and the PC and PE of the skin, DHA remained relatively unchanged in these tissues. In fact, all n-3 FA analysed other than DHA and 18 : 3n-3 were reduced by increasing the dietary n-6:n-3 ratio. A possible explanation could be that DHA is more critical than EPA as a structural component, while EPA is believed to have a bioactive role in processes related to inflammation and immunity(Reference Stillwell and Wassall53,Reference Calder54) . In line with our results, Bell et al. (Reference Bell, McVicar and Park12) found reduced EPA but stable DHA in liver PC and PE (the two largest PL fractions) in Atlantic salmon fed a diet containing sunflower oil (dietary n-6:n-3 FA ratio at 4·4) compared with when fed a FO diet (dietary n-6:n-3 FA ratio at 0·1). However, in the study by Bell et al. (Reference Bell, McVicar and Park12), the FO diet contained more EPA and DHA than the sunflower oil diet, while in our study it was kept constant in diets 1, 2 and 6. Our results demonstrate that this reduction of tissue EPA caused by increased dietary n-6:n-3 FA ratio occurs even when dietary EPA and DHA are kept unchanged. On the contrary, in the neutral lipids of the liver, an increasing n-6:n-3 FA ratio did not reduce the n-3 FA as in the polar lipids. The only dietary change that clearly caused a significant effect on the n-3 FA in this tissue was an increased absolute dietary content of n-3 FA. In theory, there could be a few reasons why a higher dietary n-6:n-3 could cause a rise in polar lipid n-6 FA at the expense of EPA (and the other n-3 FA except DHA and 18 : 3n-3) in Atlantic salmon. It could mean that there has been a reduced biosynthesis of EPA due to increased competition for enzymes shared by n-6 and n-3 FA, or a competition for incorporation into the polar lipids. It could also be an increased requirement for EPA, and its anti-inflammatory eicosanoids, due to higher levels of n-6 FA and lower EPA/ARA ratio causing an increased inflammatory status. In whole fish (mainly neutral lipids(Reference Bransden, Carter and Nichols11)), the dietary absolute contents of the n-3 and n-6 FA were reflected; meaning no reduction of whole fish EPA (or other n-3 FA) by increased dietary n-6:n-3 ratio. As the effects were only seen in the polar lipids, it is most likely not an 18 : 2n-6 induced inhibition of n-3 PUFA biosynthesis. A competition between n-6 and n-3 FA for incorporation into the phospholipids seems more probable. DHA appeared exempted in this competition, as it was the only FA spared the response seen for the other n-3 FA. However, although a higher dietary n-6:n-3 FA ratio caused a reduction in most polar lipid n-3 FA in our study, increasing the n-3 FA content concomitantly with n-6 FA trumped this. Not only were the adverse effects of increasing dietary n-6 FA on polar lipid n-3 FA negated, but a higher content of all n-3 FA in polar lipids was seen. The fact that DHA was the only n-3 FA to remain stable in polar lipid types despite increasing dietary n-6:n-3 FA ratios emphasises its importance and shows that dietary n-6 FA is not a decisive factor in deciding the DHA levels of polar lipids. Based on this, using oils with higher n-6 FA content would not be a large issue. However, the amount of EPA was notably reduced when increasing the dietary n-6:n-3 FA ratio. Not only do we not know the consequences of this should there be a higher need for EPA when the fish are exposed to challenging conditions (stress, illness, etc.), it also means poor utilisation of a valuable nutrient. Hence, the results of this study indicate that by keeping a low n-6:n-3 FA ratio, a better utilisation of the dietary EPA content can be achieved.
The dietary n-6 FA content is reflected in the tissue n-6 FA of Atlantic salmon(Reference Bransden, Carter and Nichols11,Reference Bell, McVicar and Park12,Reference Sissener, Sanden and Torstensen14) . Hence, it was unsurprising that constant dietary n-3 with increasing dietary n-6 FA (mainly 18 : 2n-6) caused an increase in n-6 FA in all tissues (both neutral and polar lipids). The neutral lipids accumulated much more 18 : 2n-6 than the polar lipids of the liver. This corresponds to the findings of Berge et al. (Reference Berge, Witten and Baeverfjord55) in Atlantic salmon vertebrae where fish fed a diet high in 18 : 2n-6 led to larger increase of 18 : 2n-6 in TAG than in PL. In the present study, the neutral lipids of the liver incorporated more 18 : 2n-6 and less EPA, docosapentaenoic acid and DHA than the polar lipids, resulting in n-6:n-3 FA ratios from 1·4 to 10·2 and 0·3 to 1·1 in the neutral and polar lipids, respectively. Although this highlights a stricter control of the polar lipids, increases in polar lipids n-6 FA were still seen with higher dietary n-6 FA, particularly in the longer chain n-6 FA. PL are major components of cellular membranes, and their n-6 and n-3 FA content has a strong influence on membrane fluidity(Reference Schmitz and Ecker20). The n-6 and n-3 FA acyl chain flexibility differ substantially and the removal of even one double bond can significantly alter membrane fluidity(Reference Rajamoorthi, Petrache and McIntosh56,Reference Eldho, Feller and Tristam-Nagle57) . Hence, the alteration of membrane n-6 and n-3 FA content could affect the physical properties of the cell membrane, and thereby alter cell function.
There was also a clear difference in the distribution of the different n-6 FA in the neutral lipids and polar lipids in the present study. In the neutral lipids, the total n-6 FA was mostly composed of 18 : 2n-6, with a little 20 : 2n-6 and 20 : 3n-6, and only miniscule amounts of ARA which merely reflected the dietary content. In the polar lipids, on the other hand, there was a higher amount present of all intermediates from 18 : 2n-6 to ARA, but also of ARA itself. However, though the dietary n-6:n-3 FA ratio increased, it did not lead to an equally large increase in polar lipid ARA. Therefore, it seems to be some restricting mechanism to avoid extreme accumulation of ARA in polar lipids when facing very high dietary n-6:n-3 FA ratios. The present study mostly found less ARA than EPA in PL of Atlantic salmon, which has been seen before(Reference Martinez-Rubio, Morais and Evensen58,Reference Sissener, Torstensen and Owen59) . Less membrane ARA than EPA is provided no deficiency of EPA + DHA, as n-6 FA will then replace the n-3 FA in the PL(Reference Bou, Berge and Baeverfjord9). However, in the fish fed the extreme diet in the present study (dietary n-6:n-3 FA ratio at 6), the relationship was inversed with more ARA than EPA. ARA is readily incorporated into membrane PL of fish(Reference Tocher and Sargent60), from which it can be released again mainly by cytosolic phospholipase 2 to be further metabolised by enzymes such as cyclo-oxygenase 2 or lipoxygenase into eicosanoids. Eicosanoids are particularly bioactive compounds involved in, e.g. inflammatory responses and tissue homeostasis(Reference Wymann and Schneiter61). Since ARA is preferentially incorporated into fish PLs(Reference Tocher and Sargent60), increasing dietary 18 : 2n-6 will lead to a shift in the balance between EPA and ARA incorporated into the PL, as seen in this trial. Additionally, Atlantic salmon has a preference for using ARA over EPA for eicosanoid production(Reference Bell, Tocher and Farndale62). As ARA-derived eicosanoids are generally known to be more potent than EPA derived ones(Reference Schmitz and Ecker20), it is possible that an excessive n-6 FA intake could cause negative eicosanoid-mediated responses. The fish in this trial were kept under controlled, stable conditions and did not seem impaired by these diets. However, it is possible that exposure to more challenging conditions common to the aquaculture industry such as transport and handling could result in eicosanoid-mediated responses with a negative impact on fish performance.
PS and PI of the skin were only marginally affected by the dietary FA variations, but this is in line with previous results in skin(Reference Cheng, Bou and Ruyter27), liver, heart(Reference Bell, McVicar and Park12), gill and leucocytes(Reference Bell, Raynard and Sargent22). PC and PE, however, had significantly reduced EPA. Cheng et al. (Reference Cheng, Bou and Ruyter27) suggested that a higher content of EPA and DHA in the PL of the skin could improve the inflammatory and protective-barrier capacities in the skin of fish, though they found no significant differences in epidermal thickness or mucus cell density due to high variation. This could mean that increased dietary n-6:n-3 FA ratio could negatively affect the protective capabilities of the skin by reducing the PL content of EPA and DHA.
The hypothesis that an increased dietary n-6:n-3 FA ratio and/or higher dietary n-6 FA could affect the requirement of EPA and DHA in Atlantic salmon seems to be at least partly true. The reduction of EPA in polar lipids with increasing dietary n-6:n-3 FA ratio in this study indicates that a better utilisation of EPA can be achieved when the dietary n-6:n-3 FA ratio is kept low. DHA was not significantly decreased. The content of EPA and DHA in fillet was only affected by absolute dietary n-3 FA, but so was the content of all n-6 FA. This means that a feed with higher dietary n-6:n-3 FA ratio does not reduce the EPA and DHA for human consumption, but the n-6 FA content will increase. While these diets led to considerable changes in tissue FA composition, the fish in this trial did not seem to suffer from it. However, the fish were kept under ideal, stable conditions, which did not necessarily represent the challenging conditions under which fish in aquaculture are kept. The effects of altering the Atlantic salmon tissue FA composition with diets with varying n-6:n-3 FA ratio and absolute n-6 FA under non-ideal conditions (e.g. fish exposed to disease, non-optimal oxygen levels or temperature, stress due to handling) need to be tested.
Acknowledgements
Joar Breivik, Endre Johnsen, Elisabeth Ødegård Else Leirnes at the Institute of Marine Research are acknowledged for technical assistance with sample analyses, and Tårn Helgøy Thomsen from Skretting ARC is acknowledged for technical assistance at the Lerang Research Station.
This study was funded by The Norwegian Seafood Research Fund – FHF (grant number: 901282, ‘OptiHealth’) and The Norwegian Research Council – NRC (N.L.I., grant number: 273215). FHF and NRC had no role in the design, analysis or writing of this article.
All authors participated in the writing of the manuscript and approved the final version. B. K. H.: main author of the manuscript, data analysis. N. S. L.: data analysis, sampling. G. R.: design and planning, sampling. M. B.: responsible for analyses performed on skin. I. S.: diet formulation. N. H. S.: design and planning, sampling.
The authors declare that there are no conflicts of interest.
Supplementary material
For supplementary material referred to in this article, please visit https://doi.org/10.1017/S0007114520002494


 Open access