


Water is the most abundant compound in humans and is essential for all main functions of the body(Reference Jequier and Constant1). Water loss occurs constantly through the lungs, skin, kidneys and gastrointestinal tract, and has an adverse impact on physical(Reference Armstrong, Costill and Fink2, Reference Lopez, Casa and Jensen3) and cognitive(Reference Ganio, Armstrong and Casa4, Reference Smith, Newell and Baker5) performance if uncompensated. Thus, the intake of sufficient water to compensate for daily losses is crucial. Total water intake comes from multiple sources, including drinking-water and other beverages and moisture content in food, and water is also produced within the body via oxidative metabolism. However, because drinking-water and other beverages constitute approximately 80 % of total water intake in European and American diets(6), adequate fluid consumption is therefore critical for maintaining essential body functions.
There is no consensus about how much total water, or, more specifically, drinking-water and other beverages (hereafter referred to as fluid) an individual should consume. The lack of consistent recommendations reflects uncertainty about how to monitor or measure the hydration process in the general population. Many methods for measuring hydration status have been proposed, and detailed reviews have explored their strengths and weaknesses(Reference Armstrong7–Reference Shirreffs9). Overall, however, no single method appears to be adequate for all situations(Reference Armstrong7). When water losses are rapid or substantial, such as with exercise or environmental exposure, an increase in plasma osmolality or urine specific gravity (USG) can signal dehydration(Reference Cheuvront, Fraser and Kenefick10); moreover, a decrease in body mass is a validated technique to estimate acute water loss and establish adequate replacement fluid intake, particularly among athletes(Reference Casa, Armstrong and Hillman11). However, for the general population, for whom water losses are less pronounced, and whose water balance is thus influenced largely by fluid intake, it remains unclear whether there is meaningful or biologically significant variability in these same physiological parameters.
At the country level, recommendations for total water intake (fluid and food) are based in large part on epidemiological analyses of observed intakes from national food surveys. For example, the Institute of Medicine guidelines for adequate intake of total water for the USA and Canada (3·7 and 2·7 litres/d for adult men and women, respectively) were established based on median total water intake from US survey data, under the assumption that in large population studies, fluid intake will be greater than or equal to body water needs(12). There are efforts to take physiological parameters into consideration. The European Food Safety Authority bases its adult total water intake recommendations (2·5 and 2·0 litres/d for men and women, respectively) on both observed intakes and relative to a ‘desirable’ urine osmolarity of 500 mOsm/l(6), based on the renal solute load derived from dietary surveys from multiple European countries. However, the European Food Safety Authority report concedes that solute load from dietary records varies widely between countries; moreover, the calculation of water volume necessary to achieve the desired urine osmolality is theoretical. In order to establish recommendations for total water intake supported by physiological indicators, the impact of habitual fluid intake practices on hydration biomarkers and water balance must be described.
In France, total fluid intake from drinking-water and other beverages ranges widely, from as low as 0·5 litres/d in the first decile to greater than 3·0 litres/d in the highest decile, with some individuals reporting consumption of greater than 4·0 litres daily(13, Reference Bellisle, Thornton and Hebel14). Moreover, the distribution of total fluid consumption by French adults can be stratified into three relatively equal tertiles, with the bottom third of adults consuming less than 1·2 litres/d, the middle third consuming between 1·2 and 2·0 litres/d and the top third consuming greater than 2·0 litres/d. Currently, it is not known whether individuals who habitually consume high volumes are physiologically similar to those who drink lower volumes of fluid.
The objective of the present study was to assess the impact of habitually different total fluid intake behaviours (low consumption < 1·2 litres/d v. high consumption >2·0 litres/d) on multiple biomarkers of hydration status in free-living conditions. Specifically, we were interested in exploring urine and blood biomarkers implicated in (1) the traditional assessment of hydration status, (2) the regulation of total body water by the kidneys and (3) the risk of kidney pathologies. To our knowledge, no study has previously investigated physiological differences between people voluntarily exhibiting different fluid consumption levels in free-living conditions.
Experimental methods
Subjects
The study enrolled healthy Caucasian French men and women, aged 25–40 years, with a BMI between 18·5 and 29·5 kg/m2 and with habitual fluid consumption (drinking-water plus other beverages) falling into either the bottom or top thirds of the French fluid intake distribution. Initial inclusion criteria included the ability to stay at home, abstain from strenuous physical activity for the study duration (4 d), access the Internet and live within a maximum of 30 min from the investigating centre. Exclusion criteria included use of medication likely to interfere with metabolism, such as hypotensive or diuretic treatment, history of gastrointestinal or metabolic disease (such as diabetes mellitus); renal, hepatic or cardiac failure, smoking more than fifteen cigarettes per d; or consumption of more than two (women) or more than three (men) standard servings of alcohol per weekday (where one standard serving represents 250 ml beer, 100 ml wine or 30 ml of spirits). Participants completed a total of six clinic visits (Fig. 1). After an initial eligibility screening (V0), potentially eligible subjects completed a clinical examination and received instructions on to use an electronic diary questionnaire (e-diary; MXS-Epidemio), described in detail below, to estimate usual fluid consumption over three consecutive weekdays. Subjects then returned to the clinic for an inclusion visit (V1), where their e-diary was used to identify individuals whose daily fluid consumption was consistent with either the low drinker (LD; ≤ 1·2 litres/d per 1·73 m2 of body surface area) or high drinker (HD; 2·0–4·0 litres/d per 1·73 m2 body surface area) groups.
Schematic of subject recruitment, group allocation and experimental phase. 24hU, 24 h urine; LD, low drinker; HD, high drinker; FMU, first morning urine.
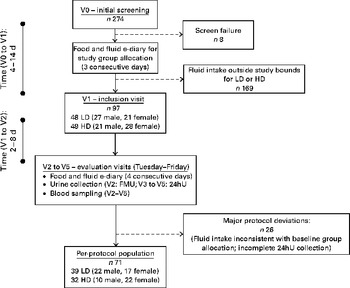
A total of 274 subjects were screened between August and December 2009. Of these, ninety-seven individuals (35·4 %) satisfied the initial screening criteria and reported daily fluid consumption that consistently classified them as either LD (n 48) or HD (n 49). The study was conducted according to the guidelines laid down in the Declaration of Helsinki and all procedures involving human subjects were approved by the Comité de Protection des Personnes of Ile de France XI. Written informed consent was obtained from all subjects. The final analysis sample includes thirty-nine LD and thirty-two HD participants who complied with the protocol and completed all the measures required during the study period.
Experimental design
The study was a comparative study of two non-randomised groups (LD and HD). Enrolled subjects were asked to follow their usual daily activities and food and fluid consumption habits. Study participants had four clinic visits (evaluation visits; V2–V5) within 3 weeks of completing the screening process. Evaluation visits were scheduled to run from Tuesday to Friday to avoid the weekend when dietary habits could be different from those on weekdays. Starting on the Monday before the evaluation visits, subjects again used the e-diary to record daily food and fluid intake. The following morning, subjects collected their first morning urine (FMU) at home, and delivered it to the clinic during their first evaluation visit (V2). Study participants continued to complete the food and fluid e-diary and collected 24 h urine (24hU) specimens over the next 3 d, and reported to the clinic each morning (V3–V5) to deliver their 24hU collections. A fasting blood sample was drawn during each morning visit (V2–V5). The central laboratory remained blinded to the status (LD or HD) of the participants.
Food and fluid intake diary
The e-diary is an electronic food questionnaire that was specifically developed for epidemiological studies of food and fluid intake in France. For every entry, subjects recorded the meal type (breakfast, lunch, dinner or snack), time of day, and characteristics of all food and beverage items consumed. Food item selections were made using a database of component pictures based on the French Data Centre on Food Quality (Centre d'Information sur la Qualité des Aliments; CIQUAL) table(15), a reference databank of the nutritional composition of more than 1300 generic foods. A unique and helpful aspect of this tool was that, for a selected food item, the software automatically suggested other foods normally associated with it in the French diet. To finalise the record, subjects were prompted to record the quantity of each of the selected components, using a list of proposed portions or directly in terms of weight or volume. The software computes daily intake totals for macro- and micronutrients, trace elements and water content of foods and beverages. Beverages were selected from an extensive list and were grouped for descriptive purposes into seven classes: drinking-water (tap and bottled); flavoured water; dairy beverages (including drinkable yogurt and fermented milk beverages); hot beverages (coffee and tea); sweetened still beverages (e.g. fruit juices, bottled iced tea); carbonated sweetened beverages (e.g. colas); alcohol. Total water intake was calculated from the moisture content in food and the total water volume in beverages, including alcohol.
Urine and blood biomarkers
A broad selection of biomarkers in the urine (FMU and 24hU) and blood was assessed, with specific biomarkers presented in the Results section (Tables 1–3). Broadly, we were interested in the following: (1) markers that have routinely been used in the determination of hydration status, such as urine and plasma osmolality, USG and urine colour(Reference Armstrong, Maresh and Castellani16, Reference Armstrong, Soto and Hacker17); (2) hormones implicated in the regulation of body water via the kidneys, such as arginine vasopressin (AVP) and aldosterone; (3) indicators of risk for kidney pathologies, such as concentrations of solutes that are known to be associated with kidney stones(Reference Tiselius18). These three categories were of interest because of their potential to be directly influenced by daily fluid intake. The majority of analyses were performed directly by the central laboratory (ExcelBio; Laboratoire Thébault) with specific analyses (osmolality, aldosterone, AVP and renin) performed by specialised laboratories (SGS Aster and Biomnis).
Characteristics of the first morning urine in the low and high drinkers (Adjusted mean values with their standard errors; medians and quartiles)

USG, urine specific gravity; CRI, Crystallization Risk Index.
Characteristics of 24 h urine in the low and high drinkers (Adjusted mean values with their standard errors; medians and quartiles)
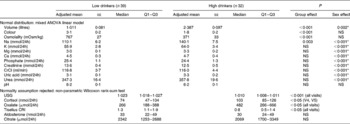
CrCl, creatinine clearance; USG, urine specific gravity; CRI, Crystallization Risk Index.
* P values were significantly higher than those for females.
Characteristics of fasting blood samples in the low and high drinkers (Adjusted mean values with their standard errors; medians and quartiles)
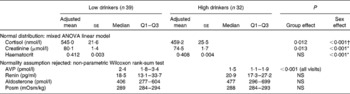
AVP, arginine vasopressin; Posm, plasma osmolality.
* P values in males were significantly higher than those in females.
† P values in females were significantly higher than those in males.
Urine collection procedures
The FMU collected for V2 was collected separately from the three subsequent 24hU collections. All urine was stored at 4°C and biological components were analysed daily on the fresh samples. During each evaluation visit, total urine mass was determined to the nearest 1 g and a sample was retained for analysis. Urine osmolality was measured via freezing point osmometry (Messtechnik). USG was determined using a pen refractometer (ATAGO Company). Urine volume was calculated from urine mass and USG. Urine biochemistry assays were performed daily, with the following exceptions: cortisol, aldosterone, citrate and oxalate, which were stored at − 20°C and batch processed. From the biochemical urine analyses, the Tiselius Crystallization Risk Index (CRI) was calculated(Reference Tiselius18). The Tiselius CRI is useful in evaluating the risk of recurrent kidney stone formation, and takes into account the total volume of urine produced as well as the excretion of solute elements that increase (Ca and oxalate) or decrease (Mg and citrate) the risk of calcium oxalate stone formation(Reference Tack19).
Blood collection procedures
During each evaluation visit, a 40 ml fasting-state blood sample was drawn. Aliquots for plasma osmolality were measured using a fresh sample via freezing point osmometry (Messtechnik). A sample for measuring serum cortisol and creatinine was collected in a 5 ml dry tube. Samples for plasma haematocrit, AVP, renin and aldosterone were collected in EDTA tubes. Assays were performed immediately on fresh samples, with the exception of renin, aldosterone and AVP, which were frozen at − 20°C and batch processed weekly. After processing, all samples were stored at − 80°C.
Statistical analysis
The Statistical Analysis Systems software package version 9.2 (SAS Institute) was used for analyses. An assumption of normal distribution was evaluated for each variable. A distribution was considered as approximately normal if the values of skewness and kurtosis fell within the interval [ − 1,+1]. In the case of normal distribution, comparison between the groups was done using ANOVA including group, sex and group × sex interaction as factors when measurement was done at only one time point (i.e. FMU). When there were repeated measurements, ANOVA for repeated measures, including group, sex, visit and associated interactions as factors, was performed. For ANOVA comparisons, results are reported as means with their standard errors for LD and HD, and group means were adjusted for sex as a covariate. If the normality assumption was rejected, a Wilcoxon non-parametric rank-sum test was used, and results are reported using medians and interquartile ranges (Q1–Q3). All statistical tests were two-sided with an α risk equal to 0·05.
Results
Per-protocol subject characteristics
Overall, twenty-six subjects presented with at least one major deviation and were excluded from the per-protocol population. These major deviations mostly fell into two categories: first, fluid consumption during the evaluation period that was not consistent with consumption at baseline (n 20), therefore invalidating the participant's assignment to the LD or HD group; second, excessive inter-day variation ( ≥ 20 %) or in 24 h creatinine clearance (n 5), suggesting that at least one of the 24hU collections was incomplete. The per-protocol population consisted of seventy-one subjects, thirty-nine LD (56 % male; age 31·3 (sd 4·5) years) and thirty-two HD (31 % male; age 32·1 (sd 4·2) years), with the sex difference between the groups approaching statistical significance (Fisher's exact test: P= 0·055).
Total water intake
Drinking-water and other beverages (fluid intake)
The results of repeated-measures ANOVA revealed significant between-group differences in daily fluid intake during the study period, with LD consuming 0·74 (sd 0·37) litres and HD consuming 2·70 (sd 0·40) litres (P< 0·001). The effect of sex was also significant (P= 0·002), with males in both groups consuming more fluid than their female counterparts. Drinking-water (tap and bottled) appeared to be the major contributor to fluid intake, representing 65 % of all beverages among the HD and 47·5 % among the LD (Fig. 2).
Mean daily total fluid consumption classified by beverage class, for female and male low drinkers (LD) and high drinkers (HD).  , Alcoholic beverages;
  , carbonated beverages;
  , sweetened still beverages;
  , hot beverages;
  , milk and milk products;
  , flavoured water; ■, water.

Water from food
The amount of water from food was largely similar between the groups, with Wilcoxon rank-sum tests revealing no significant between-group differences during V3, V4 and V5. During V5, the median (Q1–Q3) volume of water obtained from food was 0·55 litres (0·41–0·81) in the LD group, and 0·68 litres (0·51–0·88) in the HD group.
First morning urine
ANOVA revealed significant between-group differences for the following indices of hydration status in the FMU: volume (P= 0·035); specific gravity (P= 0·020); osmolality (P= 0·001). Among the LD, the FMU volume was lower, and USG and osmolality were higher than among the HD (Table 1). FMU concentrations of Na, K, phosphate, creatinine, uric acid, urea and citrate were also significantly higher in the LD. Cortisol, aldosterone, urine colour, pH, and the Tiselius CRI were similar in both groups.
24 h urine
In the 24hU samples, significant between-group differences were found for urine volume, colour, osmolality and USG (P< 0·001). Subjects in the LD group excreted significantly less urine than those in the HD group over each 24 h period (1·0 v. 2·4 litres), and their urine was more concentrated, as reflected by a darker colour (3·1 v. 1·8), higher osmolality (767 v. 371 mOsm/kg) and higher specific gravity (1·023 v. 1·010) (Table 2). The distribution of 24hU osmolality values among the LD and HD is shown in Fig. 3. There were also significant sex differences, with males producing a greater urine volume than females (P= 0·002), and therefore excreting a significantly greater quantity of solute over each 24 h period (Na, K, Mg, Ca, phosphate, creatinine, uric acid and urea; all P< 0·001).
Distribution of 24 h urine osmolality measurements among the low drinkers () and high drinkers ().

Blood variables
Plasma concentrations of cortisol, creatinine and AVP were all higher in the LD group (P< 0·001; Table 3). There were no between-group differences in haematocrit, active renin, aldosterone or plasma osmolality. In both groups, males exhibited higher values than females for cortisol, creatinine and haematocrit (P< 0·001).
Discussion
The purpose of the present study was to compare a broad range of biomarkers in individuals with habitually different fluid intakes, to determine whether the differences in fluid intake that occur in daily life are associated with biologically significant variability. The results of the present study reveal several important differences between habitually LD and HD. First, urine biomarkers (volume, osmolality, specific gravity and colour) distinguish fluid intake habits between habitually LD and HD in free-living conditions. In contrast, despite a difference of more than 2 litres/d of total water intake, plasma osmolality was not different between the groups. Second, the proportion of total water intake obtained from beverages is markedly different between the groups, and is not in line with assumptions used by authorities to establish water intake recommendations. Third, the present findings suggest that individuals who habitually consume low fluid volumes show evidence of physiological adaptations to conserve total body water and maintain normal plasma osmolality, including increased expression of AVP and higher plasma cortisol. Moreover, the physiological adaptations to conserve total body water, which include a low urine volume, may have long-term implications for kidney health.
Differences in total water intake between the groups came mostly from drinking-water and beverages, while the contribution from water in food was similar (approximately 0·6 litres) in both groups. This contradicts assumptions used in both European and US recommendations for total water intake that all individuals obtain about 20 % of their total water from food(6). The present results confirm this percentage in the HD, where water in food represented on average 23 % of total fluid intake; however, in the LD, almost half (47 %) of total fluid intake was obtained from food. This finding suggests that the percentage of total water attributed to food may not be consistent across the fluid intake spectrum. Moreover, this challenges the establishment of total water recommendations that assume water from food as a percentage of total water, and makes a case for the establishment of a fluid intake recommendation specific to drinking-water and other beverages.
The average total water intake reported by the LD barely satisfied even conservative physiological estimates of minimum daily water loss. Using a composite of previously published data, the European Food Safety Authority estimates the physiological minimum necessary daily water loss via urine, stool, skin and lungs to be 1·3–1·5 litres, exclusive of sweating(6), while the Institute of Medicine estimates minimum daily water loss to be between 1·3 and 3·45 litres(12). However, despite the substantial differences in fluid consumption between the groups, there was no difference in plasma osmolality, with mean values of 289 and 288 mOsm/kg in the LD and HD, respectively. This suggests that in the absence of rapid and substantial water loss due to fluid restriction, exercise or environmental exposure, powerful physiological responses efficiently regulate plasma osmolality within an extremely narrow range. It therefore appears necessary to draw a clear distinction between the validity of plasma osmolality as a marker of acute and substantial body water loss, and its usefulness in differentiating between the LD and HD in less extreme environments. Cheuvront et al. (Reference Cheuvront, Ely and Kenefick20) recently reported that plasma osmolality was the only body fluid marker in which a single measured value could accurately diagnose acute dehydration. However, the dehydrated state was achieved by performing long-duration exercise in hot conditions, followed by an overnight stabilisation period. Moreover, in some instances of hypohydration(Reference Armstrong, Soto and Hacker17, Reference Francesconi, Hubbard and Szlyk21), plasma and serum osmolality do not track closely with acute changes in body weight or urinary indices. It has been suggested that because of its importance to cardiovascular function, plasma volume is defended in situations of mild hypohydration and thus plasma variables may not be affected until substantial body water has been lost(Reference Shirreffs9). This is in agreement with intake data from the Third National Health and Nutrition Examination Survey (NHANES III), showing that serum osmolality was maintained at a constant level over a wide range of water intake deciles(12). The aggregate of the present results, in combination with the NHANES data, supports the conclusion that plasma osmolality is not sensitive to variation in ad libitum fluid intake in free-living conditions.
The similarity in plasma osmolality values observed between the LD and HD suggests that physiological compromises took place in order to preserve plasma osmolality and volume. This is supported by significantly higher urine concentration as well as the increased expression of AVP in the LD group. In both first morning and 24hU samples, the LD had significantly lower urine volumes coupled with higher osmolality and specific gravity. In addition, plasma AVP, cortisol and creatinine were significantly higher in the LD. The increase in plasma AVP observed in the LD group is consistent with its main function, to increase water permeability of the collecting duct cells in the kidney, facilitating water reabsorption and resulting in more concentrated urine(Reference Bouby and Fernandes22). Furthermore, AVP stimulates the downstream release of adrenocorticotropic hormone, resulting in the increased expression of glucocorticoids, including cortisol(Reference Holsboer and Ising23, Reference Papadimitriou and Priftis24). Increased serum cortisol has already been associated with hypohydration in strenuous conditions(Reference Francesconi, Sawka and Pandolf25, Reference Maresh, Whittlesey and Armstrong26), and the present findings support this observation. However, to our knowledge, this is the first study to document an elevation in plasma cortisol in the LD, in the absence of acute dehydration. Moreover, a surprising finding was that cortisol excretion in 24hU was higher in the HD group. Because cortisol and other glucocorticoid metabolites exit the body via urine, higher cortisol excretion in the HD may suggest that fluid intake plays a role in the rate of metabolism and the elimination of cortisol. This observation is intriguing, but preliminary; future studies are necessary to further explore the relationship between fluid intake and cortisol elimination. Together, the elevated plasma concentrations of AVP and cortisol under normal life conditions may indicate that the LD engage physiological mechanisms to maintain total body water content. As cortisol is a major stress hormone(Reference Holsboer and Ising23), it appears appropriate to hypothesise that chronic limited fluid intake in the LD may be associated with a mild but chronic stress response.
The physiological adaptations in the LD that allow for the preservation of plasma volume are achieved at a potential cost to the renal–urinary system. In the present study, 24hU osmolality in the LD group was essentially unchanged compared with the first morning sample. In comparison, 24hU osmolality in the HD was lowered by roughly one-third relative to the corresponding FMU sample. The distribution of 24hU osmolality values, shown in Fig. 2, illustrates striking differences between the LD and HD groups. For instance, two-thirds of the 24hU samples in the HD group had osmolality values between 200 and 400 mOsm/kg. In contrast, two-thirds of the 24hU samples in the LD group were above 700 mOsm/kg, with nearly one-third above 900 mOsm/kg. Considering the kidney's maximal urine concentrating capacity, estimated to be between 900 and 1400 mOsm/kg(6, Reference Valtin and Schafer27), it appears that in at least a subset of the LD, the kidney may be approaching its maximal urine concentrating capacity over consecutive 24 h periods. At present, the literature documenting chronically elevated urine osmolality and kidney function is scarce. However, fluid intake and urine output are closely linked to urine osmolality(Reference Armstrong, Pumerantz and Fiala28), and recent papers have reported links between intake, urine volume and kidney function. Clark et al. (Reference Clark, Sontrop and Macnab29) compared the annual decline in estimated glomerular filtration rate among a large cohort of adults, and found that the annual rate of estimated glomerular filtration rate decline was inversely proportional to urine production, with the fastest rate observed in individuals whose urine volumes were less than 1 litre/d. This corresponds to roughly half of the LD in our sample, as twenty-one of the thirty-nine subjects had 24hU volumes of less than 1 litre. Moreover, a second recent study(Reference Strippoli, Craig and Rochtchina30) has reported that high fluid intakes were associated with a significantly lower risk of chronic kidney disease. In the context of available data on French drinking habits(13, Reference Bellisle, Thornton and Hebel14, 31, 32), these studies have suggested that ad libitum habitual drinking habits may not sufficiently protect against the increased risk of chronic kidney disease for a substantial slice of the French population.
Finally, the increase in plasma creatinine concentration observed in the LD may result from either decreased renal creatinine clearance or increased creatinine production. Upon investigation of 24hU variables, neither daily urinary creatinine clearance nor creatinine excretion was different between the groups. Given that the LD group included more male participants, and that males have higher plasma creatinine concentrations, it would appear that the simplest explanation for the difference between the LD and HD may have been the sex composition of the groups. However, this explanation may be too simplistic, given that the sex composition of the LD and HD groups was accounted for in the analysis. There also exists a plausible theoretical mechanistic explanation for increased plasma creatinine in the LD. Creatinine is continually produced from the degradation of creatine and phosphocreatine(Reference Brosnan and Brosnan33, Reference Persky, Brazeau and Hochhaus34). Cellular creatine uptake is accomplished by a creatine transporter (SLC6A8) that is stimulated by Serum/glucocorticoid-regulated kinase 1 (SGK1)(Reference Shojaiefard, Christie and Lang35). Because SGK1 is up-regulated by cell shrinkage(Reference Waldegger, Barth and Raber36) and dehydration(Reference Warntges, Friedrich and Henke37, Reference Tang, Zelenak and Volkl38), the LD may have higher rates of cellular creatine uptake (and thus higher rates of breakdown). Thus, the increased plasma creatinine concentration is at the very least consistent with the low fluid intake observed in the LD group.
The present study was designed to compare habitually LD and HD, which limits the interpretation of the findings to those individuals who are reasonably consistent in their daily fluid intake volume. It is not clear how a variable fluid intake, with high intake volumes on some days and low volumes on others, would have an impact on the biomarkers of hydration reported in the results. It is likely that individuals who transition from a low to high drinking volume, or vice versa, would experience a change in hydration biomarkers; however, the latency of these changes, as well as identifying which biomarkers are the most responsive to a change in fluid intake, still needs to be explored. However, in terms of applicability to real-world conditions, the present study's main strength is that individuals continued to eat and drink as they normally would, including a mix of drinking-water and other beverage categories. Moreover, these findings have potentially important health implications: despite ad libitum access to water and other beverages in free-living conditions, a proportion of the French population consumes barely enough fluid to compensate even minimum estimated daily losses. Acutely, the higher plasma concentrations of AVP in habitual LD suggest that the kidney is being relied upon to a greater degree to conserve water. Lower fluid intake and urine volumes are also associated with an increased risk of chronic kidney disease. This suggests that long-term kidney function depends, at least in part, upon how hard the kidney must work to maintain water balance.
Conclusion
The results of the present study suggest the possibility of differentiating LD and HD on the basis of urine characteristics, particularly 24 h volume, osmolality and specific gravity. These measures could be particularly useful in establishing recommended daily intakes for water that are based on physiological indicators of adequate hydration status rather than on median consumption data. While plasma osmolality was not different between the groups, examination of urinary and plasma hormone parameters suggests that the tight control of plasma osmolality comes at a cost, namely increased circulating cortisol and AVP and increased urine osmolality in the LD. The long-term impacts of these adaptations are not yet certain, but recent evidence points to a link between insufficient fluid intake and urine volumes and the risk of chronic kidney disease. Therefore, we propose that future determinations of adequate total water intake take into account the ability of the body to maintain both plasma and urine osmolality at moderate levels. Moreover, because water from food may not represent a consistent percentage of total water intake, future guidelines should specify intake requirements for water from fluids, independent of the contribution of moisture from food.
Acknowledgements
This study was supported by Danone Research. E. P., A. K., M. P., P. R. and L. L. B. are employees of Danone Research. L. E. A., F. L., J. S. and I. T. are occasional consultants for Danone Research. S. V., A. K., L. L. B., L. E. A., F. L., J. S. and I. T. contributed to the development of the study protocol. M. P. and P. R. performed the statistical analysis and informed the study design. E. P. and S. V. developed the manuscript, contributed to the analysis and interpreted the study results.


 Open access

