

Vitamin B12 (B12, cobalamin) is a water-soluble compound important for neural function and erythropoiesis. Humans and other animals, including rats, cannot synthesise B12 and obtain it from foods of animal source. Inadequate intake or impaired absorption may lead to B12 deficiency accompanied by clinical signs of neurological impairment and/or anaemia( Reference Stabler 1 , Reference Green, Allen and Bjorke-Monsen 2 ). Deficiency is treated with B12 injections or oral supplementation depending on severity and cause of the disease.
B12 exists in different forms that share the same core structure but differ in the upper exchangeable ligand( Reference Obeid, Fedosov and Nexo 3 ). Supplements for oral use ordinarily contain cyano-B12 (CN-B12), the stable synthetic form of the vitamin, whereas food contains natural forms such as hydroxo-B12 (HO-B12)/aquo-B12 (H2O-B12) or the metabolically active coenzyme forms 5'-deoxyadenosyl-B12 (ADO-B12) and methyl-B12 (CH3-B12)( Reference Farquharson and Adams 4 ). HO-B12 and H2O-B12 are interchangeable (depending on pH), and the term HO-B12 will be used to designate both forms. As the coenzymes are light sensitive and easily converted into HO-B12 upon brief light exposure( Reference Kozlowski, Garabato and Lodowski 5 ), HO-B12 is the ubiquitous form of B12 in food. HO-B12 can be further converted into sulphito-B12, glutationyl-B12 (GS-B12), CN-B12, and a number of other variants in the presence of the B12[Co3+]-coordinating anions. These reactions occur irrespectively of light( Reference Farquharson and Adams 6 ).
All forms of B12 are metabolically transformed into ADO-B12 and CH3-B12 in the cell( Reference Obeid, Fedosov and Nexo 3 ). Here, ADO-B12 acts as a cofactor for methylmalonyl-CoA mutase in the conversion of methylmalonyl-CoA to succinyl-CoA in the mitochondria. CH3-B12 acts as a cofactor for methionine synthase in the folate-dependent methylation of homocysteine to methionine in the cytoplasm( Reference Stabler 1 , Reference Green, Allen and Bjorke-Monsen 2 ).
Both human and animal studies have demonstrated that synthetic and natural forms of B12 are absorbed equally( Reference Adams, Ross and Mervyn 7 – Reference Kornerup, Fedosov and Juul 11 ). However, our recent data show that HO-B12 accumulates in the liver to a higher degree than CN-B12, but that the patterns are opposite in the brain and plasma. These observations were based on the administration of acute doses of radiolabelled HO-B12 and CN-B12 to rats( Reference Kornerup, Juul and Fedosov 10 , Reference Kornerup, Fedosov and Juul 11 ). In accordance with this, acute human studies showed CN-B12 to cause a 2–3-fold higher increase in the active circulating B12, holotranscobalamin, relative to HO-B12 upon oral administration( Reference Greibe, Mahalle and Bhide 12 ). These findings question whether HO-B12 and CN-B12 are equally efficient for supplying the tissues with B12.
The current study was undertaken to investigate the tissue distribution of B12 after 2 weeks of dietary intake of the two vitamin forms, either HO-B12 or CN-B12, in B12-depleted rats. We also provide new information on the prevalence of various B12 forms encountered in the key organs such as liver and brain.
Methods
Animals
Male Wistar rats (RjHan:WI) (n 30) from Janvier Labs, France, were used for the experiment (7 weeks old; weighing approximately 200 g upon arrival to the animal facility). This strain of rats was chosen as it is commonly used for animal studies in B12 research( Reference Kornerup, Juul and Fedosov 10 , Reference Kornerup, Fedosov and Juul 11 , Reference Quadros, Matthews and Wise 13 , Reference Birn, Nexo and Christensen 14 ). The study was authorised by the Danish Animal Experimental Inspectorate in agreement with the EU directive 2010/63/EU on animal experiments (approval no.: 2016-15-0201-00984) and conducted at the animal facility at Health Faculty, Aarhus University, Denmark. The institutional and national guidelines for care and use of animals were followed, and the rats were checked daily for any health or welfare problems. No signs of pain, suffering or distress was observed before or during the study.
The rats were housed in pairs in standard cages (Makrolon 1291 H type III H, 800 cm2; Techniplast) in a controlled environment (20·0±0·5°C; 60 % humidity) with a 12 h light–12 h dark cycle. Bedding material (asp chips; Tapvei) and soft paper wool (LBS Biotech) were changed daily. The rats were allowed 2 weeks of acclimatisation in the animal facility before the experiment was initiated. During this time, the rats were kept on a standard stock rat fodder (Altromin 1324; Brogaarden) containing 24 µg/kg diet CN-B12 (according to the manufacturer) and had free access to tap water. The rats weighed 237 (range 204–258) g at the beginning of the study.
Study design
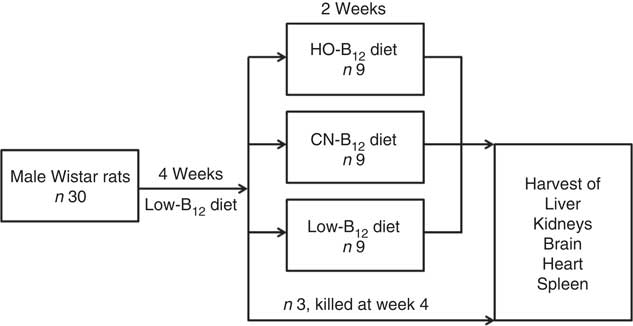
The experiment was conducted over a period of 6 weeks (study design is outlined in Fig. 1). Thirty male Wistar rats were fed a low-B12 diet containing 11 µg/kg diet B12 (Altromin C-1024; Brogaarden) for 4 weeks in order to obtain a suboptimal B12 status. At this point, three rats were killed to serve as 4-week controls, and the remaining twenty-seven rats were divided into three groups (HO-B12, CN-B12 and low-B12) and fed with three different custom-made diets for 2 additional weeks. The HO-B12 group (n 9) received a diet with added HO-B12, the CN-B12 group (n=9) received a diet with added CN-B12, and the low-B12 group (n 9) continued on the low-B12 diet (Altromin C-1024). The diets with HO-B12 and CN-B12 were custom-made by Brogaarden by addition of free (protein-unbound) HO-B12 (24 µg/kg diet) (cat. no. H1428000; Sigma-Aldrich) or CN-B12 (24 µg/kg diet) (cat. no. 68-19-9; Sigma-Aldrich) to the same stock of low-B12 Altromin C-1024 diet. Consequently, the three diets differed only in the content and the form of the B12 added. For quality check, we analysed the forms and content of B12 in the three diets received from Brogaarden before starting the study (see the ‘Evaluation of custom-made rat diets’ section). All rats had free access to food and water throughout the study. The amount of food consumed was calculated by subtracting the weight of left-overs from the ration provided each day.
Study design. Male Wistar rats (n 30) received a low-vitamin B12 diet for 4 weeks. At this time, three rats were killed, and the remaining twenty-seven rats were divided into three groups, who received custom-made diets for two additional weeks with added hydroxo-B12 (HO-B12) or cyano-B12 (CN-B12), or continued on the low-B12 diet. Hereafter, all rats were killed and tissues were harvested.
Three times during the experiment (baseline, week 4 and week 6), the rats were weighed and blood samples were drawn by puncture of the sublingual vein with a 23-gauge needle. After the end of the study (week 6), the rats were anaesthetised with isoflurane gas and killed by cervical dislocation. Liver, kidneys, brain (cerebrum), heart and spleen were collected, weighed and snap-frozen in liquid N2 before stored at −80°C until further processing (see the ‘Determination of vitamin B12 in rat plasma and tissue’ and ‘Determination of vitamin B12 forms in rat tissue’ sections).
Evaluation of custom-made rat diets
To verify that the content of B12 in the custom-made diets (HO-B12 diet, CN-B12 diet and low-B12 diet) was consistent with the specifications provided, 0·3 g of solids were dissolved in 1·5 ml demineralised water and centrifuged for 40 min at 20 000 g and 4°C. The supernatant was diluted 1:4 and analysed for total B12 content on the Advia Centaur CP Immunoassay System (Siemens). During the analysis, all B12 was converted to CN-B12; thus, the B12 content was calculated using the molecular weight of CN-B12 (MW: 1355·7). To assess the forms of B12 in the diets, 0·3 g of solids were dissolved in 500 µl of 0·4 m acetic acid and 1000 µl of 50 % methanol, whereupon the forms of B12 were determined as explained for the tissues (see the ‘Determination of vitamin B12 in rat plasma and tissue’ section).
Determination of vitamin B12 in rat plasma and tissue
Blood samples were collected into 4 ml lithium heparin tubes (BD Vacutainer), and plasma was removed after centrifugation at room temperature for 9 min at 1850 g and stored at −20°C until analysis. Plasma was measured for B12 content on the Advia Centaur CP Immunoassay System.
The tissues were thawed on ice and endogenous B12 was extracted from liver, kidneys, brain, heart and spleen by homogenising 0·2 g of tissue in 750 ml of Na-acetate buffer (0·4 mol/l, pH 4·4) using the Precellys 24 (Bertin Technologies) with three centrifugation cycles of 20 s at 6800 rpm with 30 s pauses between cycles. After homogenisation, 20 µl of KCN solution (30 mmol/l) was added to convert all B12 in the samples to CN-B12. Then, the mixtures were boiled for 10 minutes and centrifuged for 40 min at 20 000 g and 4°C, and the supernatants were collected and stored at −20°C until analysed. The supernatants were measured for total B12 content on the Advia Centaur CP Immunoassay System after dilution with 0·9 % solution of NaCl. Supernatants from the B12-depleted rats were diluted 1:5 (spleen, brain), 1:10 (liver, heart) or 1:100 (kidneys). Supernatants from the B12-replete rats (HO-B12 group and CN-B12 group) were diluted 1:5 (brain), 1:10 (liver, spleen), 1:20 (heart) or 1:500 (kidneys). The dilutions were chosen to ensure that the B12 concentrations would be within the range of measurements (100–1476 pmol/l) of the Advia Centaur CP Immunoassay system. The results were expressed as pmol B12/g of tissue unless otherwise indicated.
Determination of vitamin B12 forms in rat tissue
We determined the forms of B12 in liver, kidneys and brain from two rats selected from each of the three groups (HO-B12, CN-B12 and low-B12). For all groups, we chose the two rats with liver B12 closest to group mean. To determine the forms of B12, the following procedure was carried out in dim red light to prevent photolytic loss of the coenzymes ADO-B12 and CH3-B12. Tissues were thawed on ice and 0·2 g was mixed with 750 µl of homogenisation buffer containing 10 mm Pipes, pH 7·4 (Sigma-Aldrich), 1 mm EDTA (Sigma-Aldrich), 3 mm MgCl2, 6H2O (Merck), 400 mm NaCl, and two tablets of Complete Protease Inhibitor Cocktail (Roche Diagnostics) added per 50 ml of the buffer. The mixtures were homogenised using the Precellys 24 with three centrifugation cycles of 20 s at 6800 rpm with 30 s pauses between cycles. After homogenisation, the mixtures were centrifuged for 40 min at 20 000 g and 4°C and 500 µl of the supernatants were incubated with 500 µl of 0·4 m acetic acid and 1000 µl 50 % methanol (final pH 3·8) for 15 min at 65°C before being centrifuged again for 10 min at 2600 g at room temperature. The mixtures were then centrifuged for 3 min at 11 000 g through a 0·22-µm Durepor PVDF filter (Merck Millipore Ltd), and the B12 forms present in the supernatant were separated by HPLC essentially as described previously( Reference Hardlei and Nexo 15 , Reference Greibe and Nexo 16 ). In brief, a filtered sample was injected into an Agilent 1260 Infinity HPLC (Agilent Technologies) attached to a reverse-phase column (Luna 3 u reverse-phase C18(2) 150×4·6 mm; Phenomenex) and run with a flow rate of 1 ml/min. To apply the approximately similar amounts of B12, different volumes of filtered sample were injected onto the column depending on the tissue (90 µl of the brain sample; 45 µl of the liver sample; 9 µl of the kidney sample). A gradient of acetonitrile (HPLC S-grade; Rathburn Chemicals) increasing from 5 to 30 % over 28 min in 0·010 mol/l phosphoric acid (H3PO4, pH 3) was applied 4 min after injection. Due to the low amount of B12 present in the samples, we could not measure the B12 profile by recording absorbance. Therefore, we collected forty-six post-column fractions every 20 s (320 µl/fraction) between 9 and 25 min after injection. The samples were lyophilised and dissolved in 240 µl of 0·1 % PBS with 0·1 % bovine serum albumin (PBA) before measurement of B12, employing in-house haptocorrin ELISA( Reference Hardlei and Nexo 15 , Reference Hardlei, Morkbak and Bor 17 ) with a detection limit of 8 pmol/l B12. In brief, 100 µl (sample or calibrator) was incubated with apo-haptocorrin, and excessive apo-haptocorrin was removed with B12-coated magnetic beads. The amount of B12-saturated haptocorrin in the sample was measured by the haptocorrin ELISA, and the results from the samples were read on a calibration curve (0–218 pmol/l). The assay signal was linear for B12 concentrations between 0 and 218 pmol/l and the total imprecision (CV) was ≤10 % (measured for B12 concentration between 45 and 200 pmol/l). The results from the ELISA were used to construct HPLC elution profiles for each sample, and to calculate the fractional distribution of the various forms of B12 out of the total amount of B12 measured in each run. The amount of each form (pmol/g tissue) was calculated by multiplying the mean fractional content (from the two rats per group) with the mean B12 content per gram (from the two rats per group).
Standards with pure HO-B12 (GEA), CN-B12 (Sigma-Aldrich), ADO-B12 (Sigma-Aldrich) and CH3-B12 (Sigma-Aldrich) were used to identify the elution time of HO-B12 (10·8 min), CN-B12 (14·8 min), ADO-B12 (16·8 min) and CH3-B12 (19·8 min) from the HPLC column. The elution time of GS-B12 (12·4 minutes) was identified by incubating trace elements of labelled [57Co]HO-B12≈0·4 nm (synthesised as described in Kornerup et al.( Reference Kornerup, Juul and Fedosov 10 )) with 2 mm GSH in 0·1 m phosphate buffer (pH 3) for 1 h at room temperature. The mixture was applied to the HPLC column, and the elution time was identified by measuring the amount of cpm in the post-column fractions.
Recovery of the HPLC method was estimated by using radiolabelled [57Co]HO-B12 and [57Co]CN-B12 (catalogue no. 06B-430000; MP Biomedicals). The labelled B12 forms were added to rat liver extracts and run on the HPLC. The radioactivity counts in the injected samples and the collected elution fractions were used to calculate recovery of the two B12 forms. By this method, recovery was found to be 93 % for HO-B12 and 98 % for CN-B12.
Statistical analysis
The number of animals in each group was based on power calculations using a multiple linear regression model showing a statistical power of 90 % and confidence level of 95 %. The calculations were based on an earlier study showing a mean plasma B12 of 1330 pmol/l in rats kept on a standard diet with CN-B12 ( Reference Kornerup, Fedosov and Juul 11 ), and an anticipated mean decrease of 25 % for rats fed a diet with HO-B12.
The D’Agostino-Pearson omnibus test was used to determine if the data followed the Gaussian distribution. Logarithmic transformation was used to obtain a normal distribution. Differences between the groups at the given time points were estimated by one-way ANOVA with Tukey’s post hoc corrections for multiple comparisons. Differences between the time points within the same group were estimated by repeated-measures one-way ANOVA with Tukey’s post hoc corrections for multiple comparisons. For some data (daily intake of diet (all groups), liver B12 (pmol/g) and heart B12 (pmol/g) (CN-B12 group)), normality could not be achieved by logarithmic transformation. In these cases, comparisons were made using the Kruskal–Wallis test with Dunn’s corrections. Values of P≤0·05 were accepted as statistical significant. The data analysis was performed using the statistical software available in GraphPad Prism version 7.03.
Results
We present data on rats kept on a low-B12 diet for 4 weeks before 2 weeks supplementation with HO-B12, CN-B12, or continuation on the low-B12 diet. The design is shown in Fig. 1.
Diet and vitamin B12 intake
The rats had a daily dietary intake of (median 23·4 (range 21·6–32·9) g/rat per d (HO-B12 group), 24·8 (range 20·4–33·8) g/rat per d (CN-B12 group), and 24·4 (range 21·5–31·6) g/rat per d (low-B12 group). There was no difference in the amount of food consumed per day between the groups (P=0·18). Also, there was no significant weight difference among the rats in the three groups at the end of the study (see Table 1) or at any time point during the study (data not shown).
Total organ contents of vitamin B12 (B12) in rats on diets with hydroxo-B12 (HO-B12) or cyano-B12 (CN-B12) or on a low-B12 dietFootnote * (Mean values and ranges)
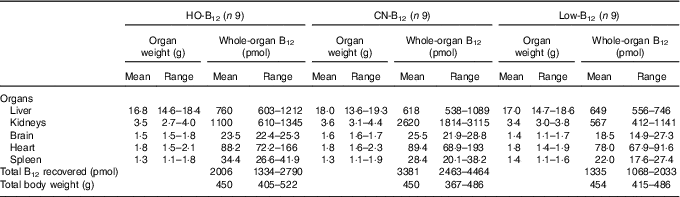
* Rats were kept for 4 weeks on a low-B12 diet followed by 2 weeks on diets with HO-B12 or CN-B12, or continuing on the low-B12 diet for 2 weeks before killed. The total amount (sum) of B12 (total B12 recovered) in the harvested rat organs is shown. The three groups of rats consumed the same amount of rat diet during the study (24 g/d). There was no difference in organ weights or total rat weights between the three groups as judged by the one-way ANOVA. The tissue B12 contents between the three groups (B12/g tissue) are compared in Fig. 3.
The B12 content of the diet assigned by the supplier (see the ‘Methods’ section) differed somewhat from our estimates. Here we indicate the values measured by us. Before the start of our study, all rats were kept on a standard rat diet containing 33 µg of CN-B12/kg thereby supplying 0·79 µg (583 pmol) of CN-B12/d. The low-B12 diet, used for 4 weeks to obtain a suboptimal B12 status, contained 5 µg B12/kg equivalent to 0·12 µg (87 pmol) of B12/d (>90 % HO-B12). The custom-made CN-B12 diet contained 24 µg/kg supplying 0·58 µg (428 pmol) of CN-B12/d. The HO-B12 diet contained 21 µg/kg supplying 0·50 µg (362 pmol) of HO-B12/d.
The amount of B12 (approximately 0·5 µg/d) supplied to the rats from the custom-made diets corresponds to a daily intake of approximately 60 µg/d B12 in a human setting (weight 60 kg). This dose is within the normal range (9 µg/d to 1 mg/d) of commercially available oral supplements used for prevention and treatment of B12 deficiency.
Plasma and tissue vitamin B12 content in vitamin B12-depleted rats
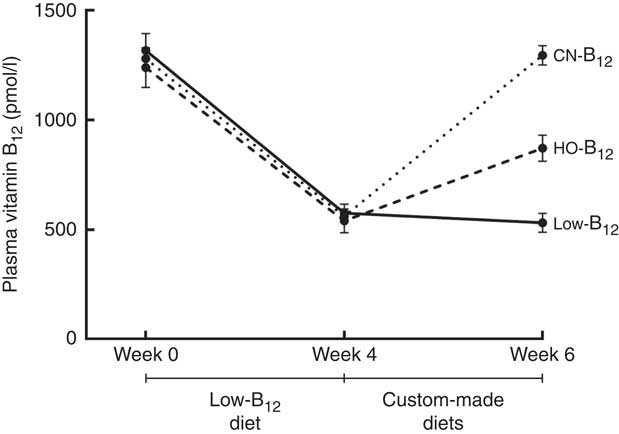
We measured B12 in plasma at baseline and after 4 and 6 weeks on a low-B12 diet. After 4 weeks, the plasma B12 level had dropped from a mean of 1279 to 558 pmol/l (n 30, all rats). A further decline to 531 pmol/l was observed after 2 additional weeks on the low-B12 diet (n 9, low-B12 group at week 6) (P<0·006) (see Fig. 2). Three rats were killed after 4 weeks as controls. No statistically significant difference between the contents of B12 in liver and kidney was noticed after 4 and 6 weeks on the low-B12 diet (data not shown). These results suggest that the rats had reached a steady state in the B12 turnover on the low-B12 diet after 4 weeks, where the different custom-made diets were introduced.
Plasma vitamin B12 in rats on diets with hydroxo-B12 (HO-B12) or cyano-B12 (CN-B12) or a low-B12 diet. Three groups of rats (n 9 in each group) were kept for 4 weeks on a low-B12 diet followed by 2 weeks on custom-made diets with HO-B12 or CN-B12, or maintained on a low-B12 diet. Values are means with their standard errors. No difference in plasma B12 was found between the three groups at baseline or after 4 weeks (week 0, week 4). As expected, 4 weeks on the low-B12 diet reduced plasma B12 for all three groups (week 4) (P<0·0001). After the 2 weeks on custom-made diets (week 6), plasma B12 was increased in both supplemented groups. The increase in plasma B12 in the CN-B12 group was more than 2-fold higher than in the HO-B12 group (P<0·0001). Plasma B12 in the low-B12 group declined further from week 4 to week 6 (P=0·015). Differences between the groups at given time points (or between the time points of the same group) were estimated by the one-way (repeated-measures) ANOVA with Tukey’s post hoc corrections for multiple comparisons.
Plasma and tissue distribution of vitamin B12 after dietary intake of hydroxo-B12, cyano-B12 or low-B12 supplement
After the 4 weeks of the low-B12 diet, the HO-B12 group and the CN-B12 group received 2 weeks of special diets with HO-B12 and CN-B12, respectively. Following this treatment (week 6), plasma B12 had returned to the baseline levels in the CN-B12 group, but this was not the case for the HO-B12 group (see Fig. 2).
Liver, kidneys, brain, heart and spleen were harvested from the two repleted groups and the depleted group of rats and analysed for content of B12. The results are reported as pmol of B12/g tissue and total organ B12 (pmol) in Fig. 3 and Table 1, respectively.
Tissue distribution of vitamin B12 in rats on diets with hydroxo-B12 (HO-B12, ![]() ) or cyano-B12 (CN-B12,
) or cyano-B12 (CN-B12, ![]() ) or on a low-B12 (
) or on a low-B12 (![]() ) diet. Liver, kidneys, brain, heart and spleen were harvested from rats after 4 weeks on a low-B12 diet followed by 2 additional weeks on custom-made diets containing HO-B12 (n 9) or CN-B12 (n 9) or continuing on the low-B12 diet (n 9). Tissues were analysed for contents of total B12, and the results are given as pmol/g tissue. Values are means with their standard errors. Level of statistical significance (* P<0·05, ** P<0·005, *** P<0·0005) for group comparisons using the one-way ANOVA with Tukey’s post hoc corrections for multiple comparisons (kidney, brain, spleen; normalised data) or the Kruskal–Wallis test with Dunn’s corrections (kidney, heart; not normalised data). Notably, a higher amount of B12 was found in the liver and spleen of the HO-B12 group compared with the CN-B12 group; but in the kidney the B12 amount was highest in the CN-B12 group. There was no difference in liver B12 between the low-B12 group and the CN-B12 group.
) diet. Liver, kidneys, brain, heart and spleen were harvested from rats after 4 weeks on a low-B12 diet followed by 2 additional weeks on custom-made diets containing HO-B12 (n 9) or CN-B12 (n 9) or continuing on the low-B12 diet (n 9). Tissues were analysed for contents of total B12, and the results are given as pmol/g tissue. Values are means with their standard errors. Level of statistical significance (* P<0·05, ** P<0·005, *** P<0·0005) for group comparisons using the one-way ANOVA with Tukey’s post hoc corrections for multiple comparisons (kidney, brain, spleen; normalised data) or the Kruskal–Wallis test with Dunn’s corrections (kidney, heart; not normalised data). Notably, a higher amount of B12 was found in the liver and spleen of the HO-B12 group compared with the CN-B12 group; but in the kidney the B12 amount was highest in the CN-B12 group. There was no difference in liver B12 between the low-B12 group and the CN-B12 group.
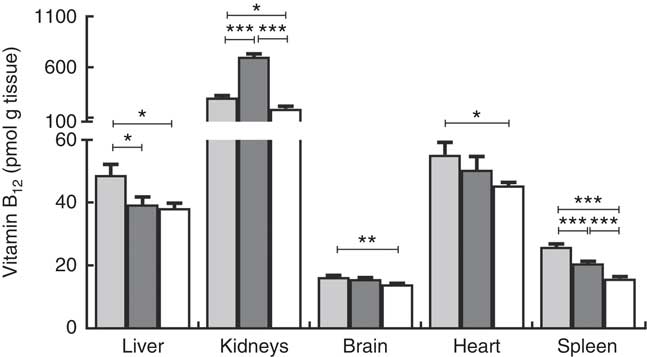
Compared with the low-B12 group, the following overall surplus of B12 had accumulated in the organs studied during the 2 weeks of dietary supplementation (+600 pmol in the HO-B12 group and +2000 pmol in the CN-B12 group). The high accumulation of CN-B12 was almost totally driven by an increase in the kidney content of B12. In contrast, significantly more HO-B12 than CN-B12 accumulated in the liver (P=0·027), and a similar tendency (HO-B12>CN-B12) was found in the spleen and the heart (Table 1). All in all, 1400 pmol more CN-B12 was recovered in the harvested organs compared with HO-B12. As we previously have shown, the two forms of B12 are absorbed equally well( Reference Kornerup, Juul and Fedosov 10 , Reference Kornerup, Fedosov and Juul 11 ), which implies that a surplus of approximately 1400 pmol HO-B12 relative to CN-B12 is distributed in the remaining rat tissues.
Forms of vitamin B12 in rat tissue after dietary intake of hydroxo-B12, cyano-B12 or low-B12 supplement
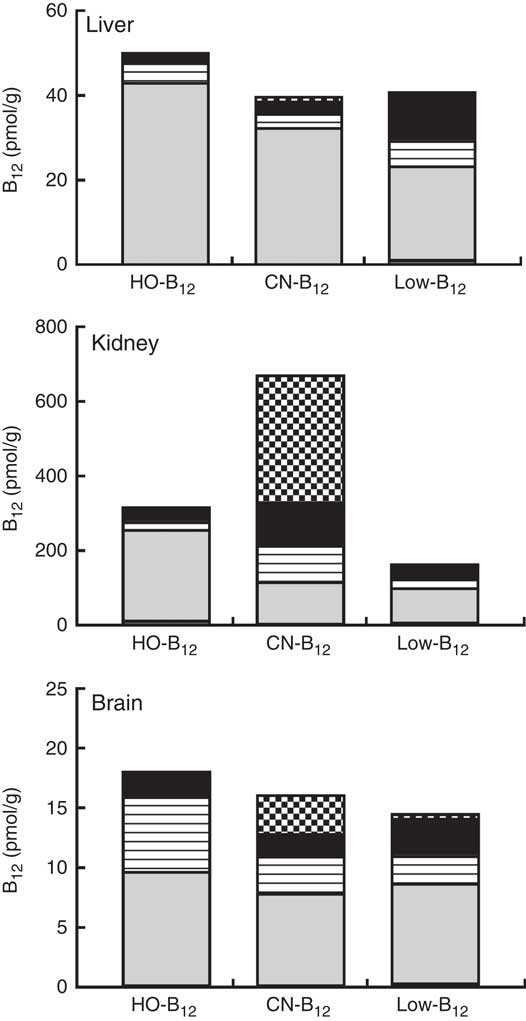
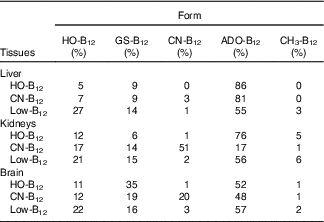
The forms of B12 in liver-, kidney- and brain homogenates prepared from organs of two rats from each group were measured following separation of the various forms by HPLC. The HPLC profiles showed peaks corresponding to the elution times for HO-B12 (10·8 min), GS-B12 (12·4 min), CN-B12 (14·8 min), ADO-B12 (16·8 min) and CH3-B12 (19·8 min). The fractional distributions of the five different B12 forms found in the tissues are shown in Table 2, and their estimated quantities are shown in Fig. 4.
Vitamin B12 (B12) forms in rat tissue. Liver, kidneys and brain were harvested from rats after 4 weeks on a low-B12 diet followed by 2 additional weeks on custom-made diets containing hydroxo-B12 (HO-B12) (n 9) or cyano-B12 (CN-B12) (n 9) or continuing on the low-B12 diet (n 9). Tissues from two rats per group were analysed for forms of B12 (CN-B12, HO-B12, glutathionyl-B12 (GS-B12), 5'-deoxyadenosyl-B12 (ADO-B12) and methyl-B12 (CH3-B12)) by HPLC followed by ELISA. Results are given as the amount (pmol/g tissue) of each of the five B12 forms in the particular tissue. The amount was calculated by multiplying the fractional amount of each B12 form (mean% from the two rats per group) with the B12 amount (mean pmol/g tissue from the two rats per group). ![]() , CN-B12;
, CN-B12; ![]() , HO-B12;
, HO-B12; ![]() , GS-B12;
, GS-B12; ![]() , ADO-B12;
, ADO-B12; ![]() , CH3-B12.
, CH3-B12.
Distribution of the five vitamin B12 (B12) forms in tissues from rats on diets with hydroxo-B12 (HO-B12) or cyano-B12 (CN-B12) or on a low-B12 dietFootnote *
GS-B12, glutathionyl-B12; ADO-B12, 5'-deoxyadenosyl-B12; CH3-B12, methyl-B12.
* Forms of B12 were determined by HPLC followed by ELISA. Fractional contents given in % were calculated based on the total amount of B12 measured in each run. Five different B12 peaks were identified, which eluted as HO-B12 (10·8 min), GS-B12 (12·4 min), CN-B12 (14·8 min), ADO-B12 (16·8 min) and CH3-B12 (19·8 min). Results are given as the calculated fractional distribution (mean% from two rats per group). The fractional distribution from each rat (not merged data) is shown in the online Supplementary data S1. The calculated amounts of each B12 form are shown in Fig. 4. The HPLC elution profiles are shown in the online Supplementary data S2.
In general, ADO-B12 was the predominant form in the rat tissues, followed by GS-B12 and HO-B12, whereas CH3-B12 and CN-B12 (for groups not treated with CN-B12) were almost undetectable (see Table 2 and Fig. 4). Compared with the low-B12 group, the HO-B12 group showed a marked increase in ADO-B12 in the liver and the kidneys and an increase in GS-B12 in the brain. The CN-B12 group showed a less pronounced increase in liver ADO-B12 and even a minor drop in brain ADO-B12, compared with depleted rats. Changes in the kidney of the CN-B12 group was characterised by a dominant accumulation of CN-B12, which was also partially encountered in the brain (Table 2 and Fig. 4).
Discussion
We explored the uptake of B12 and its accumulation and conversion to the coenzymes in rats kept on a low-B12 diet for 4 weeks followed by a 2-week diet containing HO-B12 or CN-B12 or a 2-week continuum on a low-B12 diet.
We found major differences in both the distribution and the degree of conversion to the B12 coenzymes for HO-B12 and CN-B12 supplementations. Notably, more than half of the administered CN-B12 remained in this form in the kidneys, whereas HO-B12 was largely converted to the bioactive ADO-B12 providing more than the doubled amount of active coenzymes to the kidney tissues than CN-B12. The degree of conversion becomes even larger if subtracting ADO-B12 in the low-B12 organs and counting only its increments, accumulated in the cause of HO-B12 and CN-B12 supplementation. Our study also highlights the uncertainty of using plasma B12 as a sole marker of B12 tissue content.
The work has some limitations. Even though no B12 had been added, the low-B12 diet still contained 5 µg/kg B12, possibly due to an unforeseen contamination with B12-producing micro-organisms in the production line. As a result, our low-B12 group showed a milder B12 depletion in the tissues, compared with the previous study employing a different batch of the same low-B12 diet( Reference Kornerup, Fedosov and Juul 11 ). However, as all three groups of rats were equally depleted, we do not believe that the ‘less pronounced’ level of depletion detracts from the value of our findings. We measured the B12 content and forms of the B12 present in the custom-made diets before administration but did not repeat these measures at the end of the study. The diets were kept in the cold (4°C) in the air- and light-tight containers until administration to the rats, and we consider B12 to be stable under these conditions throughout the 2 weeks study period. The CN-B12 diet contained 14 % more B12 than the HO-B12 diet. We do not expect this difference in supplemented quantities of CN-B12 and HO-B12 to be of importance, because the uptake of B12 reaches a plateau at high doses of the vitamin. Despite these weaknesses, we believe our study has merit and provides new interesting information on the metabolism of CN-B12 and HO-B12 in the tissues.
Acute uptake studies of CN-B12 and HO-B12 showed a higher accumulation of CN-B12 than HO-B12 in the kidneys and brain, but a lower accumulation in the liver and spleen( Reference Kornerup, Juul and Fedosov 10 , Reference Kornerup, Fedosov and Juul 11 ). Contrary to our expectations, the initial difference between the two B12 forms did not level out after 2 weeks of their dietary intake, and we observed both quantitative and qualitative differences in the distribution and conversion of CN-B12 and HO-B12.
A much higher accumulation of B12 was discovered in the liver of HO-B12 animals, whereas the CN-B12 group and the low-B12 group exhibited the same total B12 in this organ. Our findings support the view that the hepatocytes preferentially accumulate the natural forms of B12, whereas the synthetic vitamin has a reduced uptake (or increased export).
An interesting finding pertains to the threefold surplus of B12 accumulated in the examined organs of rats on a CN-B12 diet compared with an HO-B12 diet. This difference is driven by the vast accumulation of CN-B12 in the kidney, which has no bearing on the B12 coenzymes synthesised in this organ (nearly equal to that in the low-B12 group). Acute studies showed an equal uptake of the two forms of the vitamin( Reference Kornerup, Juul and Fedosov 10 , Reference Kornerup, Fedosov and Juul 11 ), and thus we anticipate that the animals have approximately the same amounts of B12 in the body, irrespectively of the B12-form supplied. This in turn suggests that other tissues would contain somewhat more B12, when the vitamin is provided as HO-B12 as compared with CN-B12. This interpretation is clearly supported by the results for the liver and the spleen, whereas the difference is insignificant in the brain and heart (Fig. 2).
The highest B12 concentrations and amounts were found in the kidneys of all animals, irrespectively of their diet. This agrees with our previous studies( Reference Kornerup, Juul and Fedosov 10 , Reference Kornerup, Fedosov and Juul 11 ) and also with the work of Quadros et al.( Reference Quadros, Matthews and Wise 13 ), where rats were given a mixed diet of ADO-B12 (60 %), HO-B12 (25 %) and CN-B12 (15 %). The total kidney B12 increased by factors of 1·6 and 4 on the HO-B12 and CN-B12 diets, respectively, when compared with the rats remaining on the low-B12 diet. It is well known that the kidneys serve as a storage organ for B12 in rats( Reference Birn, Nexo and Christensen 14 , Reference Scott, Treston and Bowman 18 , Reference Newmark 19 ), but such difference in kidney accumulation of the two forms of B12 was unexpected. The effect can be ascribed to a relatively low accumulation of CN-B12 in the liver (and possibly other organs), which leaves high quantities of the circulating CN-B12 (eventually filtered and stored in the kidneys). Another explanation might rely on a preferential accumulation of CN-B12 in the kidney. It should be noticed in this regard, that B12 in kidney remains physiologically ‘inert’, being stored mainly as a free ligand, not bound to any protein or enzyme( Reference Scott, Treston and Bowman 18 , Reference Newmark 19 ).
We also examined the coenzyme patterns of B12 in two animals from each group studied. The results for all in-group rats compared very well, and we take the data to be representative. In line with Quadros et al, we find ADO-B12 and HO-B12 (part of it converted to GS-B12) to account for the majority of the total B12, whereas CH3-B12 was almost undetectable. This might suggest that CH3-B12 is of little importance for the methylation of homocysteine in the rat. Quadros et al speculated that a B12-independent methylation mechanism of homocysteine (e.g. via the betaine pathway) could be involved. An alternative explanation might be that CH3-B12 in the rat cells mainly exists as the catalytic intermediate [Co1+]B12 spontaneously oxidised to HO-B12 under extraction( Reference Quadros, Matthews and Wise 13 ). We would like to point out in this regard that tissue HO-B12 (as well as its derivative GS-B12) is not necessarily an inert compound (like CN-B12). The enzymatic cycles of ADO-B12 and CH3-B12 go through the reduced intermediates ([Co2+]B12 and [Co1+]B12) with the ‘disconnected’ active groups (ADO and CH3, respectively( Reference Krautler 20 )). Both reduced cofactors are easily oxidised to HO-B12, making the latter merely a reflection of the catalytic steady state balance, for example CH3-B12↔[Co1+]B12.
We are not aware of other studies relating dietary forms of B12 to the pattern of B12 forms present in the key organs. Interestingly, these patterns are different in brain, liver, and kidney. Irrespectively of the diet, the brains showed comparable amounts of ADO-B12 in all groups, but the CN-B12 group also contained 20 % of CN-B12. We do not know whether this compound is an innocent bystander or a competitive antagonist of B12-dependent enzymes (the latter case presenting a clear physiological problem). The liver eventually converted both HO-B12 and CN-B12 to ADO-B12, albeit the conversion was most prominent in the HO-B12 group. Perhaps the most surprising result was observed in the kidney. Dietary intake of CN-B12 did not increase ADO-B12, and most of the extra B12 accumulated in the organ as CN-B12. In contrast, the supplement of HO-B12 diet almost doubled the amount of ADO-B12 in the kidney due to increments of ADO-B12=+145 pmol/g (HO-B12 group) v. +30 pmol/g (CN-B12 group), added to the ‘background’ level of 93 pmol/g (low-B12 group). Similar pictures were also observed in other organs. It seems that HO-B12 got converted to ADO-B12 at a higher rate than CN-B12 did. The result agrees with previous data suggesting that the conversion of CN-B12 to ADO-B12 is slower and more demanding than the conversion of HO-B12 ( Reference Uchino, Yagiri and Yoshino 21 , Reference Zhang, Hodgson and Trivedi 22 ). For example, Uchino et al described a 3-fold higher conversion to ADO-B12 in rat liver 24 h after intravenous injection of HO-B12 in comparison to CN-B12 ( Reference Uchino, Yagiri and Yoshino 21 ). This difference has a biochemical basis. Formation of ADO-B12 and CH3-B12 in the cell requires the initial reduction of CN-B12 or HO-B12, and this process is mediated by the specific chaperon CblC, assisted in its function by methionine synthase reductase (MSR) and NAPDH. The rate of reduction is considerable faster for HO-B12, which is also reduced by MSR and NAPDH without CblC, as well as by glutathione±MSR( Reference Li, Gherasim and Lesniak 23 ).
The finding, that dietary HO-B12 provides more active coenzymes to the tissues compared with CN-B12 (despite of a lower plasma B12 concentration), is of clinical and diagnostic relevance. B12 is traditionally evaluated from measurements of total plasma B12. Yet, our data suggest that plasma B12 concentrations do not truly reflect the tissue status of B12. For this reason, we recommend that plasma B12 measurements for diagnostic purposes are accompanied by, for example assessment of plasma methylmalonic acid, a marker of intracellular B12 status. Our findings also suggest that natural food items, such as milk and meat (containing HO-B12) provide a better source of B12 for the tissues than an equal amount of synthetic B12 from a vitamin pill. Studies are needed to investigate this subject closer.
In conclusion, tissue distribution of HO-B12 and CN-B12 after 2 weeks of dietary intake shows a great resemblance to our previous results observed 24 h after the acute uptake. CN-B12 is better at restoring plasma B12 than HO-B12. Yet, the latter provides a better supply of ADO-B12 to the tissues. The data raise a question whether HO-B12 provides a better supply of metabolically active B12 than CN-B12 does.
Acknowledgements
The authors would like to thank Inger Marie Jensen and Jette Fisker Petersen, Department of Clinical Biochemistry, Aarhus University Hospital, Denmark, for their excellent technical assistance.
The work is part of the TRIM project (www.trim-project.dk) financed by Innovation Fund Denmark (grant no. 12-132437). Innovation Fund Denmark has no role in the design, analysis or writing of this article.
The authors’ responsibilities were as follows: E. G., L. S. K., C. W. H. and E. N. formulated the research questions and designed the study; E. G., L. S. K. and C. B. J. conducted the research; E. G., S. N. F., C. W. H. and E. N. analysed the data; E. G. and E. N. wrote the manuscript and had primary responsibility for the final content. All authors have read and approved the final manuscript.
The authors declare that there are no conflicts of interest.
Supplementary material
For supplementary material/s referred to in this article, please visit https://doi.org/10.1017/S000711451800123X


 Open access